Global Wearable Devices In Sports Market
Taille du marché en milliards USD
TCAC :
% 
 USD
90.73 Billion
USD
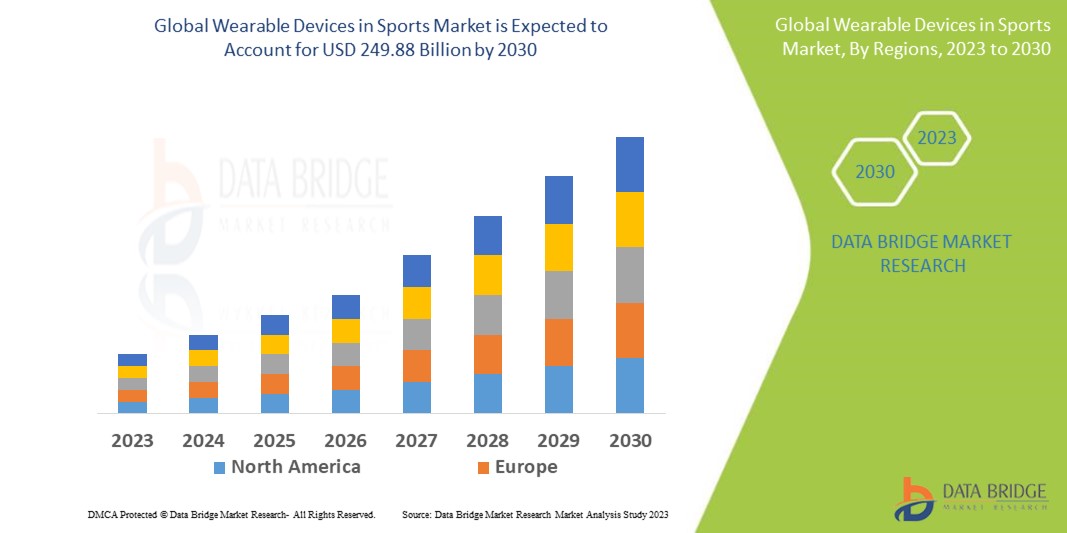
249.88 Billion
2022
2030
USD
90.73 Billion
USD
249.88 Billion
2022
2030
| 2023 –2030 | |
| USD 90.73 Billion | |
| USD 249.88 Billion | |
| % | |
Appareils portables mondiaux sur le marché du sport, par composant (matériel, logiciel), type de produit (podomètres, moniteurs de fitness et de fréquence cardiaque, tissus intelligents, caméras intelligentes , trackers de tir, autres), site (bandeau, appareil portable, bras et poignet, clip, capteur de chaussures, autres), application (comptage des pas, calories brûlées, surveillance de la fréquence cardiaque, suivi du sommeil, autres), utilisateur final (centres sportifs, centres de fitness, établissements de soins à domicile, autres), canal de distribution (magasin de détail indépendant, hypermarché/supermarché, magasin de marque, canal de vente en ligne) - Tendances et prévisions du secteur jusqu'en 2030.
Analyse et taille du marché des appareils portables dans le domaine du sport
Le nombre croissant de jeunes qui participent activement à des activités sportives conduit à l'utilisation d'indicateurs de santé qui accélèrent la croissance du marché. De plus, avec la sensibilisation croissante aux problèmes de santé, l'athlétisme est devenu un moyen pratique de maintenir la forme physique et de se protéger contre les troubles du mode de vie. Ces outils résistent à l'activité physique liée à l'entraînement de l'utilisateur et protègent contre le surentraînement. Tous ces facteurs connaissent une forte croissance du marché.
Français Data Bridge Market Research analyse que le marché des appareils portables sur le marché du sport, qui était de 90,73 milliards USD en 2022, atteindrait 249,88 milliards USD d'ici 2030 et devrait subir un TCAC de 13,5 % au cours de la période de prévision 2023 à 2030. En plus des informations sur les scénarios de marché tels que la valeur marchande, le taux de croissance, la segmentation, la couverture géographique et les principaux acteurs, les rapports de marché organisés par Data Bridge Market Research comprennent également une analyse approfondie des experts, l'épidémiologie des patients, l'analyse du pipeline, l'analyse des prix et le cadre réglementaire.
Portée et segmentation du marché des appareils portables dans le domaine du sport
|
Rapport métrique |
Détails |
|
Période de prévision |
2023 à 2030 |
|
Année de base |
2022 |
|
Années historiques |
2021 (personnalisable de 2015 à 2020) |
|
Unités quantitatives |
Chiffre d'affaires en milliards USD, volumes en unités, prix en USD |
|
Segments couverts |
Composant (matériel, logiciel), type de produit (podomètres, moniteurs de fitness et de fréquence cardiaque , tissus intelligents, caméras intelligentes , dispositifs de suivi des prises de vue, autres), site (serre-tête, appareil portable, bras et poignet, clip, capteur de chaussures, autres), application (nombre de pas, calories brûlées, surveillance de la fréquence cardiaque, suivi du sommeil, autres), utilisateur final (centres sportifs, centres de fitness, établissements de soins à domicile, autres), canal de distribution (magasin de détail indépendant, hypermarché/supermarché, magasin de marque, canal de vente en ligne) |
|
Pays couverts |
États-Unis, Canada et Mexique en Amérique du Nord, Allemagne, France, Royaume-Uni, Pays-Bas, Suisse, Belgique, Russie, Italie, Espagne, Turquie, Reste de l'Europe en Europe, Chine, Japon, Inde, Corée du Sud, Singapour, Malaisie, Australie, Thaïlande, Indonésie, Philippines, Reste de l'Asie-Pacifique (APAC) en Asie-Pacifique (APAC), Arabie saoudite, Émirats arabes unis, Afrique du Sud, Égypte, Israël, Reste du Moyen-Orient et de l'Afrique (MEA) en tant que partie du Moyen-Orient et de l'Afrique (MEA), Brésil, Argentine et Reste de l'Amérique du Sud en tant que partie de l'Amérique du Sud |
|
Acteurs du marché couverts |
Apple Inc. (États-Unis), Huawei Technologies Co., Ltd. (Chine), Fitbit Inc. (Royaume-Uni), Nike, Inc. (États-Unis), Under Armour, Inc (États-Unis), Koninklijke Philips NV (Pays-Bas), Zepp Health Corporation (Chine), StretchSense (États-Unis), Catapult (États-Unis), Withings (France), Guangdong Transtek Medical Electronics Co., Ltd (Chine), Abbott (États-Unis), Medtronic (Irlande), Apple Inc. (États-Unis), Virtual-Realties, LLC (Royaume-Uni), Google LLC (États-Unis), Xiaomi (Chine), Sony Corporation (Japon), Garmin Ltd. (États-Unis), Honeywell International Inc. (États-Unis), LG Electronics (Corée du Sud) |
|
Opportunités de marché |
|
Définition du marché
Les technologies portables liées au sport sont un groupe d'articles destinés à aider et à soutenir les utilisateurs. Ces gadgets portables ont été fabriqués pour aider les athlètes grâce à la technologie. Ces appareils portables utilisent Bluetooth, IoT et Wi-Fi pour fournir des données de performance individuelles. Ces gadgets portables sont équipés de trackers GPS qui aident à collecter des données sur le rythme de l'utilisateur, sa fréquence cardiaque, le nombre de pas effectués, le nombre de calories brûlées, etc.
Dynamique du marché mondial des appareils portables dans le domaine du sport
Conducteurs
- Augmentation de l'incidence des blessures liées au sport
Les blessures sportives sont très courantes dans le monde entier. Par exemple, on a recensé environ 288 nouvelles blessures chez 209 athlètes, avec un taux de survenue de 45,5 blessures pour 1 000 athlètes exposés aux Jeux asiatiques d'été de Guangzhou. Cette augmentation de la fréquence fait grimper rapidement la demande d'appareils portables dans le sport. Ainsi, ce facteur stimule la croissance du marché.
- Demande croissante d'appareils portables
L’utilisation croissante d’appareils portables tels que les bracelets de fitness et autres capteurs permet de surveiller la charge de stress et de prévenir les blessures dues à la fatigue chez les athlètes, ce qui a soutenu la croissance du marché des appareils portables dans le sport. Par exemple, Athletigen Technology, Inc., une entreprise axée sur la performance de Nouvelle-Écosse, travaille avec de nombreux sportifs pour utiliser les informations collectées sur leur ADN afin d’améliorer leurs performances et leur santé et de réduire la prévalence des blessures liées au sport. De tels exemples devraient stimuler la croissance du marché au cours de la période de prévision.
Opportunités
- Augmentation des partenariats entre les acteurs du marché
Le nombre croissant de partenariats entre les acteurs du marché stimule également la croissance du marché. Par exemple, en 2022, la société spécialisée dans le pitching KineticPro Performance s'est associée à Nextiles, un fabricant de technologie de tissu intelligent. Une analyse biomécanique du bras en temps réel serait proposée par le manchon KineticPro à l'aide de capteurs à base de fils soigneusement positionnés directement sur le coude. Ainsi, ce facteur crée davantage d'opportunités de croissance du marché.
- Demande croissante de vêtements et de textiles intelligents
Les vêtements et textiles intelligents sont fabriqués et conçus pour intégrer des technologies qui augmentent la fonctionnalité du porteur. Ces textiles ont de nombreuses applications, telles que la communication avec d'autres appareils, la transformation en différents matériaux, la conduction de l'énergie et la protection du porteur contre les dangers environnementaux. Les activités croissantes de R&D en faveur des systèmes personnels à base de textiles portables, tels que la surveillance de la santé, la protection, la sécurité et un mode de vie sain, ont suscité un vif intérêt au cours des dernières années. Ainsi, ce facteur favorise la croissance du marché.
Contraintes/Défis
- Coût élevé des appareils portables
Le coût initial élevé des appareils portables, le coût de leur maintenance et de leur réparation, ainsi que les nombreux problèmes liés à la batterie, freinent la croissance du marché. Il s'agit donc d'un frein majeur au marché.
Ce rapport sur le marché des appareils portables dans le domaine du sport fournit des détails sur les nouveaux développements récents, les réglementations commerciales, l'analyse des importations et des exportations, l'analyse de la production, l'optimisation de la chaîne de valeur, la part de marché, l'impact des acteurs du marché national et local, les opportunités d'analyse en termes de poches de revenus émergentes, les changements dans la réglementation du marché, l'analyse stratégique de la croissance du marché, la taille du marché, la croissance des catégories de marché, les niches d'application et la domination, les approbations de produits, les lancements de produits, les expansions géographiques, les innovations technologiques sur le marché. Pour obtenir plus d'informations sur le marché des appareils portables dans le domaine du sport, contactez Data Bridge Market Research pour un briefing d'analyste, notre équipe vous aidera à prendre une décision de marché éclairée pour atteindre la croissance du marché.
Développement récent
- En 2022, l'entreprise de performance humaine WHOOP et Penn State Intercollegiate Athletics se sont associés pour utiliser la technologie portable WHOOP et des informations de santé personnalisées afin d'améliorer le bien-être des étudiants-athlètes. Cette nouvelle coopération pluriannuelle comprend un déploiement de WHOOP 4.0 dans l'ensemble du département des sports et un programme complet de santé et d'engagement des étudiants-athlètes.
Portée du marché mondial des appareils portables dans le domaine du sport
Le marché des appareils portables dans le domaine du sport est segmenté en fonction du composant, du type de produit, du site, de l'application, de l'utilisateur final et du canal de distribution. La croissance parmi ces segments vous aidera à analyser les segments de croissance faibles dans les industries et à fournir aux utilisateurs un aperçu précieux du marché et des informations sur le marché pour les aider à prendre des décisions stratégiques pour identifier les principales applications du marché.
Composant
- Matériel
- Logiciel
Type de produit
- Podomètres
- Moniteurs de fitness et de fréquence cardiaque
- Tissus intelligents, caméra intelligente
- Suivi des prises de vue
- Autres
Site
- Bandeau
- Portable
- Bras et poignet
- Agrafe
- Capteur de chaussures
- Autres
Application
- Nombre de pas
- Calories brûlées
- Surveillance de la fréquence cardiaque
- Suivi du sommeil
- Autres
Utilisateur final
- Centres sportifs
- Centres de remise en forme
- Cadres de soins à domicile
- Autres
Canal de distribution
- Magasin de détail indépendant
- Hypermarché/Supermarché
- Boutique de marque
- Canal de vente en ligne
Analyse/perspectives régionales du marché des appareils portables dans le domaine du sport
Le marché des appareils portables sur le marché du sport est analysé et des informations sur la taille du marché et les tendances sont fournies par composant, type de produit, site, application, utilisateur final et canal de distribution comme référencé ci-dessus.
Français Les pays couverts dans le rapport sur le marché des appareils portables dans le sport sont les États-Unis, le Canada et le Mexique en Amérique du Nord, l'Allemagne, la France, le Royaume-Uni, les Pays-Bas, la Suisse, la Belgique, la Russie, l'Italie, l'Espagne, la Turquie, le reste de l'Europe en Europe, la Chine, le Japon, l'Inde, la Corée du Sud, Singapour, la Malaisie, l'Australie, la Thaïlande, l'Indonésie, les Philippines, le reste de l'Asie-Pacifique (APAC) en Asie-Pacifique (APAC), l'Arabie saoudite, les Émirats arabes unis, l'Afrique du Sud, l'Égypte, Israël, le reste du Moyen-Orient et de l'Afrique (MEA) en tant que partie du Moyen-Orient et de l'Afrique (MEA), le Brésil, l'Argentine et le reste de l'Amérique du Sud en tant que partie de l'Amérique du Sud.
L'Amérique du Nord devrait dominer le marché des appareils portables sur le marché du sport en raison de la popularité croissante de ces appareils parmi les athlètes professionnels. En outre, l'augmentation des cas de blessures sportives chez les athlètes et le nombre croissant d'activités de recherche dans cette région stimulent la croissance du marché.
L'Asie-Pacifique devrait connaître une croissance significative au cours de la période de prévision de 2023 à 2030 en raison de la baisse des coûts des smartphones, ce qui devrait accroître la croissance du marché. La demande croissante de nombreux groupes de clients cibles permet aux fabricants de réduire les prix des produits grâce à des volumes de production améliorés.
La section pays du rapport fournit également des facteurs d'impact sur les marchés individuels et des changements de réglementation sur le marché national qui ont un impact sur les tendances actuelles et futures du marché. Des points de données tels que l'analyse de la chaîne de valeur en aval et en amont, les tendances techniques et l'analyse des cinq forces de Porter, les études de cas sont quelques-uns des indicateurs utilisés pour prévoir le scénario de marché pour les différents pays. En outre, la présence et la disponibilité des marques mondiales et les défis auxquels elles sont confrontées en raison de la concurrence importante ou rare des marques locales et nationales, l'impact des tarifs nationaux et les routes commerciales sont pris en compte tout en fournissant une analyse prévisionnelle des données nationales.
Analyse du paysage concurrentiel et des parts de marché des appareils portables dans le domaine du sport
The wearable devices in sports market competitive landscape provides details by competitor. Details included are company overview, company financials, revenue generated, market potential, investment in research and development, new market initiatives, global presence, production sites and facilities, production capacities, company strengths and weaknesses, product launch, product width and breadth, application dominance. The above data points provided are only related to the companies' focus related to wearable devices in sports market.
Some of the major players operating in the wearable devices in sports market are:
- Apple Inc. (U.S.)
- Huawei Technologies Co., Ltd. (China)
- Fitbit Inc. (U.K.)
- Nike, Inc. (U.S.)
- Under Armour, Inc (U.S.)
- Koninklijke Philips N.V. (Netherlands)
- Zepp Health Corporation (China)
- StretchSense (U.S.)
- Catapult (U.S.)
- Withings (France)
- Guangdong Transtek Medical Electronics Co., Ltd (China)
- Abbott (U.S.)
- Medtronic (Ireland)
- Apple Inc. (U.S.)
- Virtual-Realties, LLC (U.K.)
- Google LLC (U.S.)
- Xiaomi (China)
- Sony Corporation (Japan)
- Garmin Ltd. (U.S.)
- Honeywell International Inc. (U.S.)
- LG Electronics (South Korea)
SKU-
Accédez en ligne au rapport sur le premier cloud mondial de veille économique

- Tableau de bord d'analyse de données interactif
- Tableau de bord d'analyse d'entreprise pour les opportunités à fort potentiel de croissance
- Accès d'analyste de recherche pour la personnalisation et les requêtes
- Analyse de la concurrence avec tableau de bord interactif
- Dernières actualités, mises à jour et analyse des tendances
- Exploitez la puissance de l'analyse comparative pour un suivi complet de la concurrence
Méthodologie de recherche
La collecte de données et l'analyse de l'année de base sont effectuées à l'aide de modules de collecte de données avec des échantillons de grande taille. L'étape consiste à obtenir des informations sur le marché ou des données connexes via diverses sources et stratégies. Elle comprend l'examen et la planification à l'avance de toutes les données acquises dans le passé. Elle englobe également l'examen des incohérences d'informations observées dans différentes sources d'informations. Les données de marché sont analysées et estimées à l'aide de modèles statistiques et cohérents de marché. De plus, l'analyse des parts de marché et l'analyse des tendances clés sont les principaux facteurs de succès du rapport de marché. Pour en savoir plus, veuillez demander un appel d'analyste ou déposer votre demande.
La méthodologie de recherche clé utilisée par l'équipe de recherche DBMR est la triangulation des données qui implique l'exploration de données, l'analyse de l'impact des variables de données sur le marché et la validation primaire (expert du secteur). Les modèles de données incluent la grille de positionnement des fournisseurs, l'analyse de la chronologie du marché, l'aperçu et le guide du marché, la grille de positionnement des entreprises, l'analyse des brevets, l'analyse des prix, l'analyse des parts de marché des entreprises, les normes de mesure, l'analyse globale par rapport à l'analyse régionale et des parts des fournisseurs. Pour en savoir plus sur la méthodologie de recherche, envoyez une demande pour parler à nos experts du secteur.
Personnalisation disponible
Data Bridge Market Research est un leader de la recherche formative avancée. Nous sommes fiers de fournir à nos clients existants et nouveaux des données et des analyses qui correspondent à leurs objectifs. Le rapport peut être personnalisé pour inclure une analyse des tendances des prix des marques cibles, une compréhension du marché pour d'autres pays (demandez la liste des pays), des données sur les résultats des essais cliniques, une revue de la littérature, une analyse du marché des produits remis à neuf et de la base de produits. L'analyse du marché des concurrents cibles peut être analysée à partir d'une analyse basée sur la technologie jusqu'à des stratégies de portefeuille de marché. Nous pouvons ajouter autant de concurrents que vous le souhaitez, dans le format et le style de données que vous recherchez. Notre équipe d'analystes peut également vous fournir des données sous forme de fichiers Excel bruts, de tableaux croisés dynamiques (Fact book) ou peut vous aider à créer des présentations à partir des ensembles de données disponibles dans le rapport.

