South Africa Agricultural Mapping & Imaging Market to 2032
Overview
The South Africa Agricultural Mapping & Imaging Market is expected to reach a 122.76 USD Million by 2032 and is projected to grow at a CAGR of 13.57% from 2025 to 2032.
Revenue, 2024 (USD Million)
50.37
Forecast, 2032 (USD Million)
122.76
CAGR, 2024 - 2032
13.57%
Report Coverage
South Africa
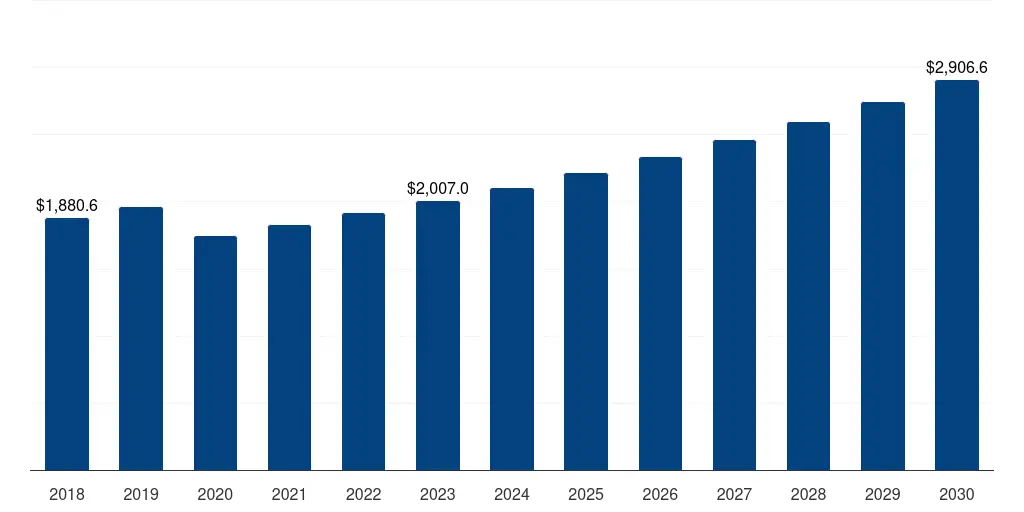
South Africa Agricultural Mapping & Imaging Market 2018-2032 USD Million
South Africa Agricultural Mapping & Imaging Market, Key Findings (2025-2032)
Market Growth and Projections:
- Market Size (2024): 50.37 USD Million
- Projected Market Size (2032): 122.76 USD Million
- CAGR (2025-2032): 13.57%
Key Findings of South Africa Agricultural Mapping & Imaging Market
- The South Africa Agricultural Mapping & Imaging Market was valued at 50.37 USD Million in 2024.
- The South Africa Agricultural Mapping & Imaging Market is likely to grow at a CAGR of 13.57% during the forecast period of 2024 to 2032.
- In 2024, the Largest segment Cloud in Deployment Mode Segment accounted for the largest share of the market with a revenue of 29.06 USD Million
- The fastest growing segment Crop Health Monitoring in Application Segment grew Fastest with a CAGR of 14.79% during the forecast period from 2024 to 2032.
South Africa Agricultural Mapping & Imaging Market Scope
South Africa Agricultural Mapping & Imaging Market Segmentation & Scope
Offering
- Services
- Software
- Hardware
Application
- Others
- Water Management
- Weather Monitoring and Forecasting
- Yield Monitoring
- Field Mapping
- Crop Health Monitoring
Deployment Mode
- On-Premise
- Cloud
Autonomy
- Autonomous
- Manual
- Semi-Autonomous
End User
- Agrochemical Companies
- Research Institutes
- Others
- Agro-Tech Companies
- Farms
South Africa Agricultural Mapping & Imaging Market Data Coverage Insights
| Study Period | 2024-2032 |
| Base Year | 2023 |
| Unit | Revenue in USD Million |
| Market Value in 2024 | 50.37 USD Million |
| Market Value in 2032 | 122.76 USD Million |
| CAGR (2025-2032) | 13.57% |
| Historic Data | 2016-2023 |
| Market Segments Covered | Offering,Application,Deployment Mode,Autonomy,End User |
Regional Insights:
-
Leading Market (2024-2032): South Africa, leading in terms of revenue 50.37 USD Million in 2024
- Key Country: South Africa, leading in terms of revenue with value of 50.37 USD Million in 2024.
Segments and Scope
-
South Africa Agricultural Mapping & Imaging Market to 2032, By Offering
- Hardware is the largest segment in South Africa Agricultural Mapping & Imaging Market to 2032 with a revenue of 24.87 USD Million in the year 2024.
- Hardware is the Fastest growing segment in South Africa Agricultural Mapping & Imaging Market to 2032 with a Growth rate of 13.93 % in forecast period 2025-2032.
-
South Africa Agricultural Mapping & Imaging Market to 2032, By Application
- Crop Health Monitoring is the largest segment in South Africa Agricultural Mapping & Imaging Market to 2032 with a revenue of 13.77 USD Million in the year 2024.
- Crop Health Monitoring is the Fastest growing segment in South Africa Agricultural Mapping & Imaging Market to 2032 with a Growth rate of 14.79 % in forecast period 2025-2032.
-
South Africa Agricultural Mapping & Imaging Market to 2032, By Deployment Mode
- Cloud is the largest segment in South Africa Agricultural Mapping & Imaging Market to 2032 with a revenue of 29.06 USD Million in the year 2024.
- Cloud is the Fastest growing segment in South Africa Agricultural Mapping & Imaging Market to 2032 with a Growth rate of 14.56 % in forecast period 2025-2032.
-
South Africa Agricultural Mapping & Imaging Market to 2032, By Autonomy
- Semi-Autonomous is the largest segment in South Africa Agricultural Mapping & Imaging Market to 2032 with a revenue of 23.60 USD Million in the year 2024.
- Autonomous is the Fastest growing segment in South Africa Agricultural Mapping & Imaging Market to 2032 with a Growth rate of 13.84 % in forecast period 2025-2032.
-
South Africa Agricultural Mapping & Imaging Market to 2032, By End User
- Farms is the largest segment in South Africa Agricultural Mapping & Imaging Market to 2032 with a revenue of 19.89 USD Million in the year 2024.
- Farms is the Fastest growing segment in South Africa Agricultural Mapping & Imaging Market to 2032 with a Growth rate of 14.49 % in forecast period 2025-2032.
South Africa Agricultural Mapping & Imaging Market Company Share Analysis
| Company Name |

|
||
| Trimble Inc. | |||
| Yara | |||
| CNH Industrial N.V. | |||
| Corteva | |||
| AGCO Corporation | |||

South Africa Agricultural Mapping & Imaging Market Geographical Sales Distribution, 2018-2032 USD Million
South Africa Agricultural Mapping & Imaging Market Company Profiling

Industry Related Reports
Frequently Asked Questions
The South Africa Agricultural Mapping & Imaging Market is segmented based on Segmentation Offering,Application,Deployment Mode,Autonomy,End User.
South Africa Agricultural Mapping & Imaging Market was valued at USD 50.37(Revenue in USD Million) in 2023.
South Africa Agricultural Mapping & Imaging Market is projected to grow at a CAGR of 13.57% during the forecast period of 2024 to 2032.
The Cloud segment is expected to dominate the South Africa Agricultural Mapping & Imaging Market, holding a largest market share of 29.06 USD Million in 2024
Coming Soon....
South Africa Agricultural Mapping & Imaging Market Scope
South Africa Agricultural Mapping & Imaging Market Segmentation & Scope
Offering
- Services
- Software
- Hardware
Application
- Others
- Water Management
- Weather Monitoring and Forecasting
- Yield Monitoring
- Field Mapping
- Crop Health Monitoring
Deployment Mode
- On-Premise
- Cloud
Autonomy
- Autonomous
- Manual
- Semi-Autonomous
End User
- Agrochemical Companies
- Research Institutes
- Others
- Agro-Tech Companies
- Farms
Frequently Asked Questions
The South Africa Agricultural Mapping & Imaging Market is segmented based on Segmentation Offering,Application,Deployment Mode,Autonomy,End User.
South Africa Agricultural Mapping & Imaging Market was valued at USD 50.37(Revenue in USD Million) in 2023.
South Africa Agricultural Mapping & Imaging Market is projected to grow at a CAGR of 13.57% during the forecast period of 2024 to 2032.
The estimated market value of the South Africa Agricultural Mapping & Imaging Market for final year is USD 122.76 (USD Million).
South Africa Agricultural Mapping & Imaging Market Company Profiling
Frequently Asked Questions
The South Africa Agricultural Mapping & Imaging Market is segmented based on Segmentation Offering,Application,Deployment Mode,Autonomy,End User.
South Africa Agricultural Mapping & Imaging Market was valued at USD 50.37(Revenue in USD Million) in 2023.
South Africa Agricultural Mapping & Imaging Market is projected to grow at a CAGR of 13.57% during the forecast period of 2024 to 2032.
The estimated market value of the South Africa Agricultural Mapping & Imaging Market for final year is USD 122.76 (USD Million).
HAVE A QUESTION?
Get expert advice on the right strategy for your business at no cost. We also offer customized subscription plans and affordable discounts for startups and universities.