U.S. Smart Aquaculture Market to 2032
Overview
The U.S. Smart Aquaculture Market is expected to reach a 5.16 USD Billion by 2032 and is projected to grow at a CAGR of 6.26% from 2025 to 2032.
Revenue, 2024 (USD Billion)
3.58
Forecast, 2032 (USD Billion)
5.16
CAGR, 2024 - 2032
6.26%
Report Coverage
U.S.
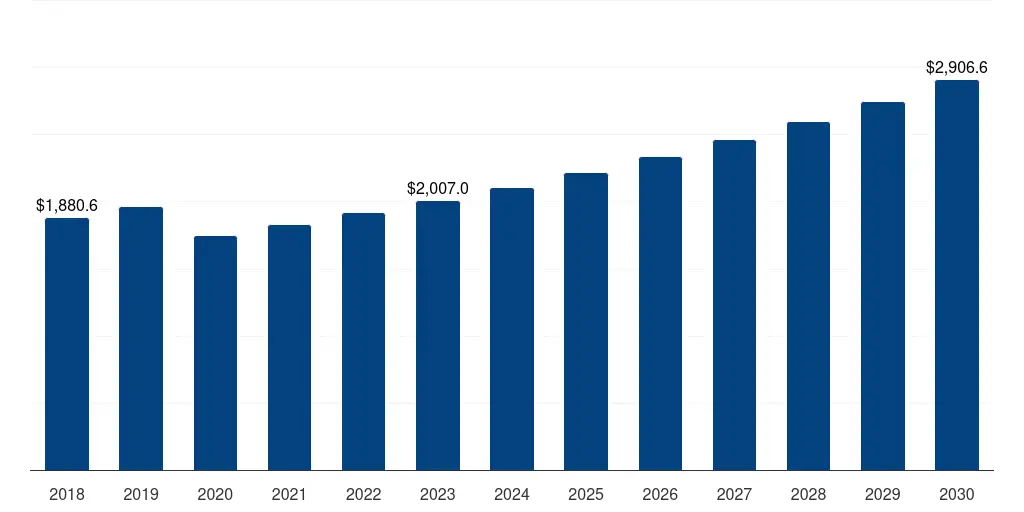
U.S. Smart Aquaculture Market 2018-2032 USD Billion
U.S. Smart Aquaculture Market, Key Findings (2025-2032)
Market Growth and Projections:
- Market Size (2024): 3.58 USD Billion
- Projected Market Size (2032): 5.16 USD Billion
- CAGR (2025-2032): 6.26%
Key Findings of U.S. Smart Aquaculture Market
- The U.S. Smart Aquaculture Market was valued at 3.58 USD Billion in 2024.
- The U.S. Smart Aquaculture Market is likely to grow at a CAGR of 6.26% during the forecast period of 2024 to 2032.
- In 2024, the Largest segment Land-based Aquaculture in Application Segment accounted for the largest share of the market with a revenue of 2.51 USD Billion
- The fastest growing segment Smart Feeding Systems in Type Segment grew Fastest with a CAGR of 6.91% during the forecast period from 2024 to 2032.
U.S. Smart Aquaculture Market Scope
U.S. Smart Aquaculture Market Segmentation & Scope
Type
- Others
- Aquaculture Environment Management Equipments
- Design / Construction Engineering
- Cleaning Systems
- Submersible Aquaculture System
- Underwater (ROV's)
- Water Animal Growth Management
- Aquaculture Intelligence
- Water Treatment Systems
- Monitoring & Control Systems
- Smart Feeding Systems
Offering
- Services
- Software
- Hardware
Farm Type
- Open Aquaculture Farms
- RAS Farms
Application
- Marine-based Aquaculture
- Land-based Aquaculture
U.S. Smart Aquaculture Market Data Coverage Insights
| Study Period | 2024-2032 |
| Base Year | 2021 |
| Unit | Revenue in USD Billion |
| Market Value in 2024 | 3.58 USD Billion |
| Market Value in 2032 | 5.16 USD Billion |
| CAGR (2025-2032) | 6.26% |
| Historic Data | 2016-2023 |
| Market Segments Covered | Type,Offering,Farm Type,Application |
Regional Insights:
-
Leading Market (2024-2032): U.S., leading in terms of revenue 3.58 USD Billion in 2024
- Key Country: U.S., leading in terms of revenue with value of 3,576.48 USD Million in 2024.
Segments and Scope
-
U.S. Smart Aquaculture Market to 2032, By Type
- Smart Feeding Systems is the largest segment in U.S. Smart Aquaculture Market to 2032 with a revenue of 894.64 USD Billion in the year 2024.
- Smart Feeding Systems is the Fastest growing segment in U.S. Smart Aquaculture Market to 2032 with a Growth rate of 6.91 % in forecast period 2025-2032.
-
U.S. Smart Aquaculture Market to 2032, By Offering
- Hardware is the largest segment in U.S. Smart Aquaculture Market to 2032 with a revenue of 1.66 USD Billion in the year 2024.
- Hardware is the Fastest growing segment in U.S. Smart Aquaculture Market to 2032 with a Growth rate of 6.67 % in forecast period 2025-2032.
-
U.S. Smart Aquaculture Market to 2032, By Farm Type
- RAS Farms is the largest segment in U.S. Smart Aquaculture Market to 2032 with a revenue of 2.34 USD Billion in the year 2024.
- RAS Farms is the Fastest growing segment in U.S. Smart Aquaculture Market to 2032 with a Growth rate of 6.56 % in forecast period 2025-2032.
-
U.S. Smart Aquaculture Market to 2032, By Application
- Land-based Aquaculture is the largest segment in U.S. Smart Aquaculture Market to 2032 with a revenue of 2.51 USD Billion in the year 2024.
- Land-based Aquaculture is the Fastest growing segment in U.S. Smart Aquaculture Market to 2032 with a Growth rate of 6.44 % in forecast period 2025-2032.
U.S. Smart Aquaculture Market Company Share Analysis
| Company Name |

|
||
| ScaleAQ | |||
| Innovasea Systems Inc. | |||
| In-Situ Inc. | |||
| Deep Trekker Inc. | |||
| Bluegrove AS | |||

U.S. Smart Aquaculture Market Geographical Sales Distribution, 2018-2032 USD Billion
U.S. Smart Aquaculture Market Company Profiling

Industry Related Reports
Frequently Asked Questions
The U.S. Smart Aquaculture Market is segmented based on Segmentation Type,Offering,Farm Type,Application.
U.S. Smart Aquaculture Market was valued at USD 3.58(Revenue in USD Billion) in 2021.
U.S. Smart Aquaculture Market is projected to grow at a CAGR of 6.26% during the forecast period of 2024 to 2032.
The Land-based Aquaculture segment is expected to dominate the U.S. Smart Aquaculture Market, holding a largest market share of 2.51 USD Billion in 2024
U.S. Smart Aquaculture Market Scope
U.S. Smart Aquaculture Market Segmentation & Scope
Type
- Others
- Aquaculture Environment Management Equipments
- Design / Construction Engineering
- Cleaning Systems
- Submersible Aquaculture System
- Underwater (ROV's)
- Water Animal Growth Management
- Aquaculture Intelligence
- Water Treatment Systems
- Monitoring & Control Systems
- Smart Feeding Systems
Offering
- Services
- Software
- Hardware
Farm Type
- Open Aquaculture Farms
- RAS Farms
Application
- Marine-based Aquaculture
- Land-based Aquaculture
Frequently Asked Questions
The U.S. Smart Aquaculture Market is segmented based on Segmentation Type,Offering,Farm Type,Application.
U.S. Smart Aquaculture Market was valued at USD 3.58(Revenue in USD Billion) in 2021.
U.S. Smart Aquaculture Market is projected to grow at a CAGR of 6.26% during the forecast period of 2024 to 2032.
The estimated market value of the U.S. Smart Aquaculture Market for final year is USD 5.16 (USD Billion).
U.S. Smart Aquaculture Market Company Profiling
Frequently Asked Questions
The U.S. Smart Aquaculture Market is segmented based on Segmentation Type,Offering,Farm Type,Application.
U.S. Smart Aquaculture Market was valued at USD 3.58(Revenue in USD Billion) in 2021.
U.S. Smart Aquaculture Market is projected to grow at a CAGR of 6.26% during the forecast period of 2024 to 2032.
The estimated market value of the U.S. Smart Aquaculture Market for final year is USD 5.16 (USD Billion).
HAVE A QUESTION?
Get expert advice on the right strategy for your business at no cost. We also offer customized subscription plans and affordable discounts for startups and universities.