
Asia-Pacific A2 Milk Market Analysis and Size
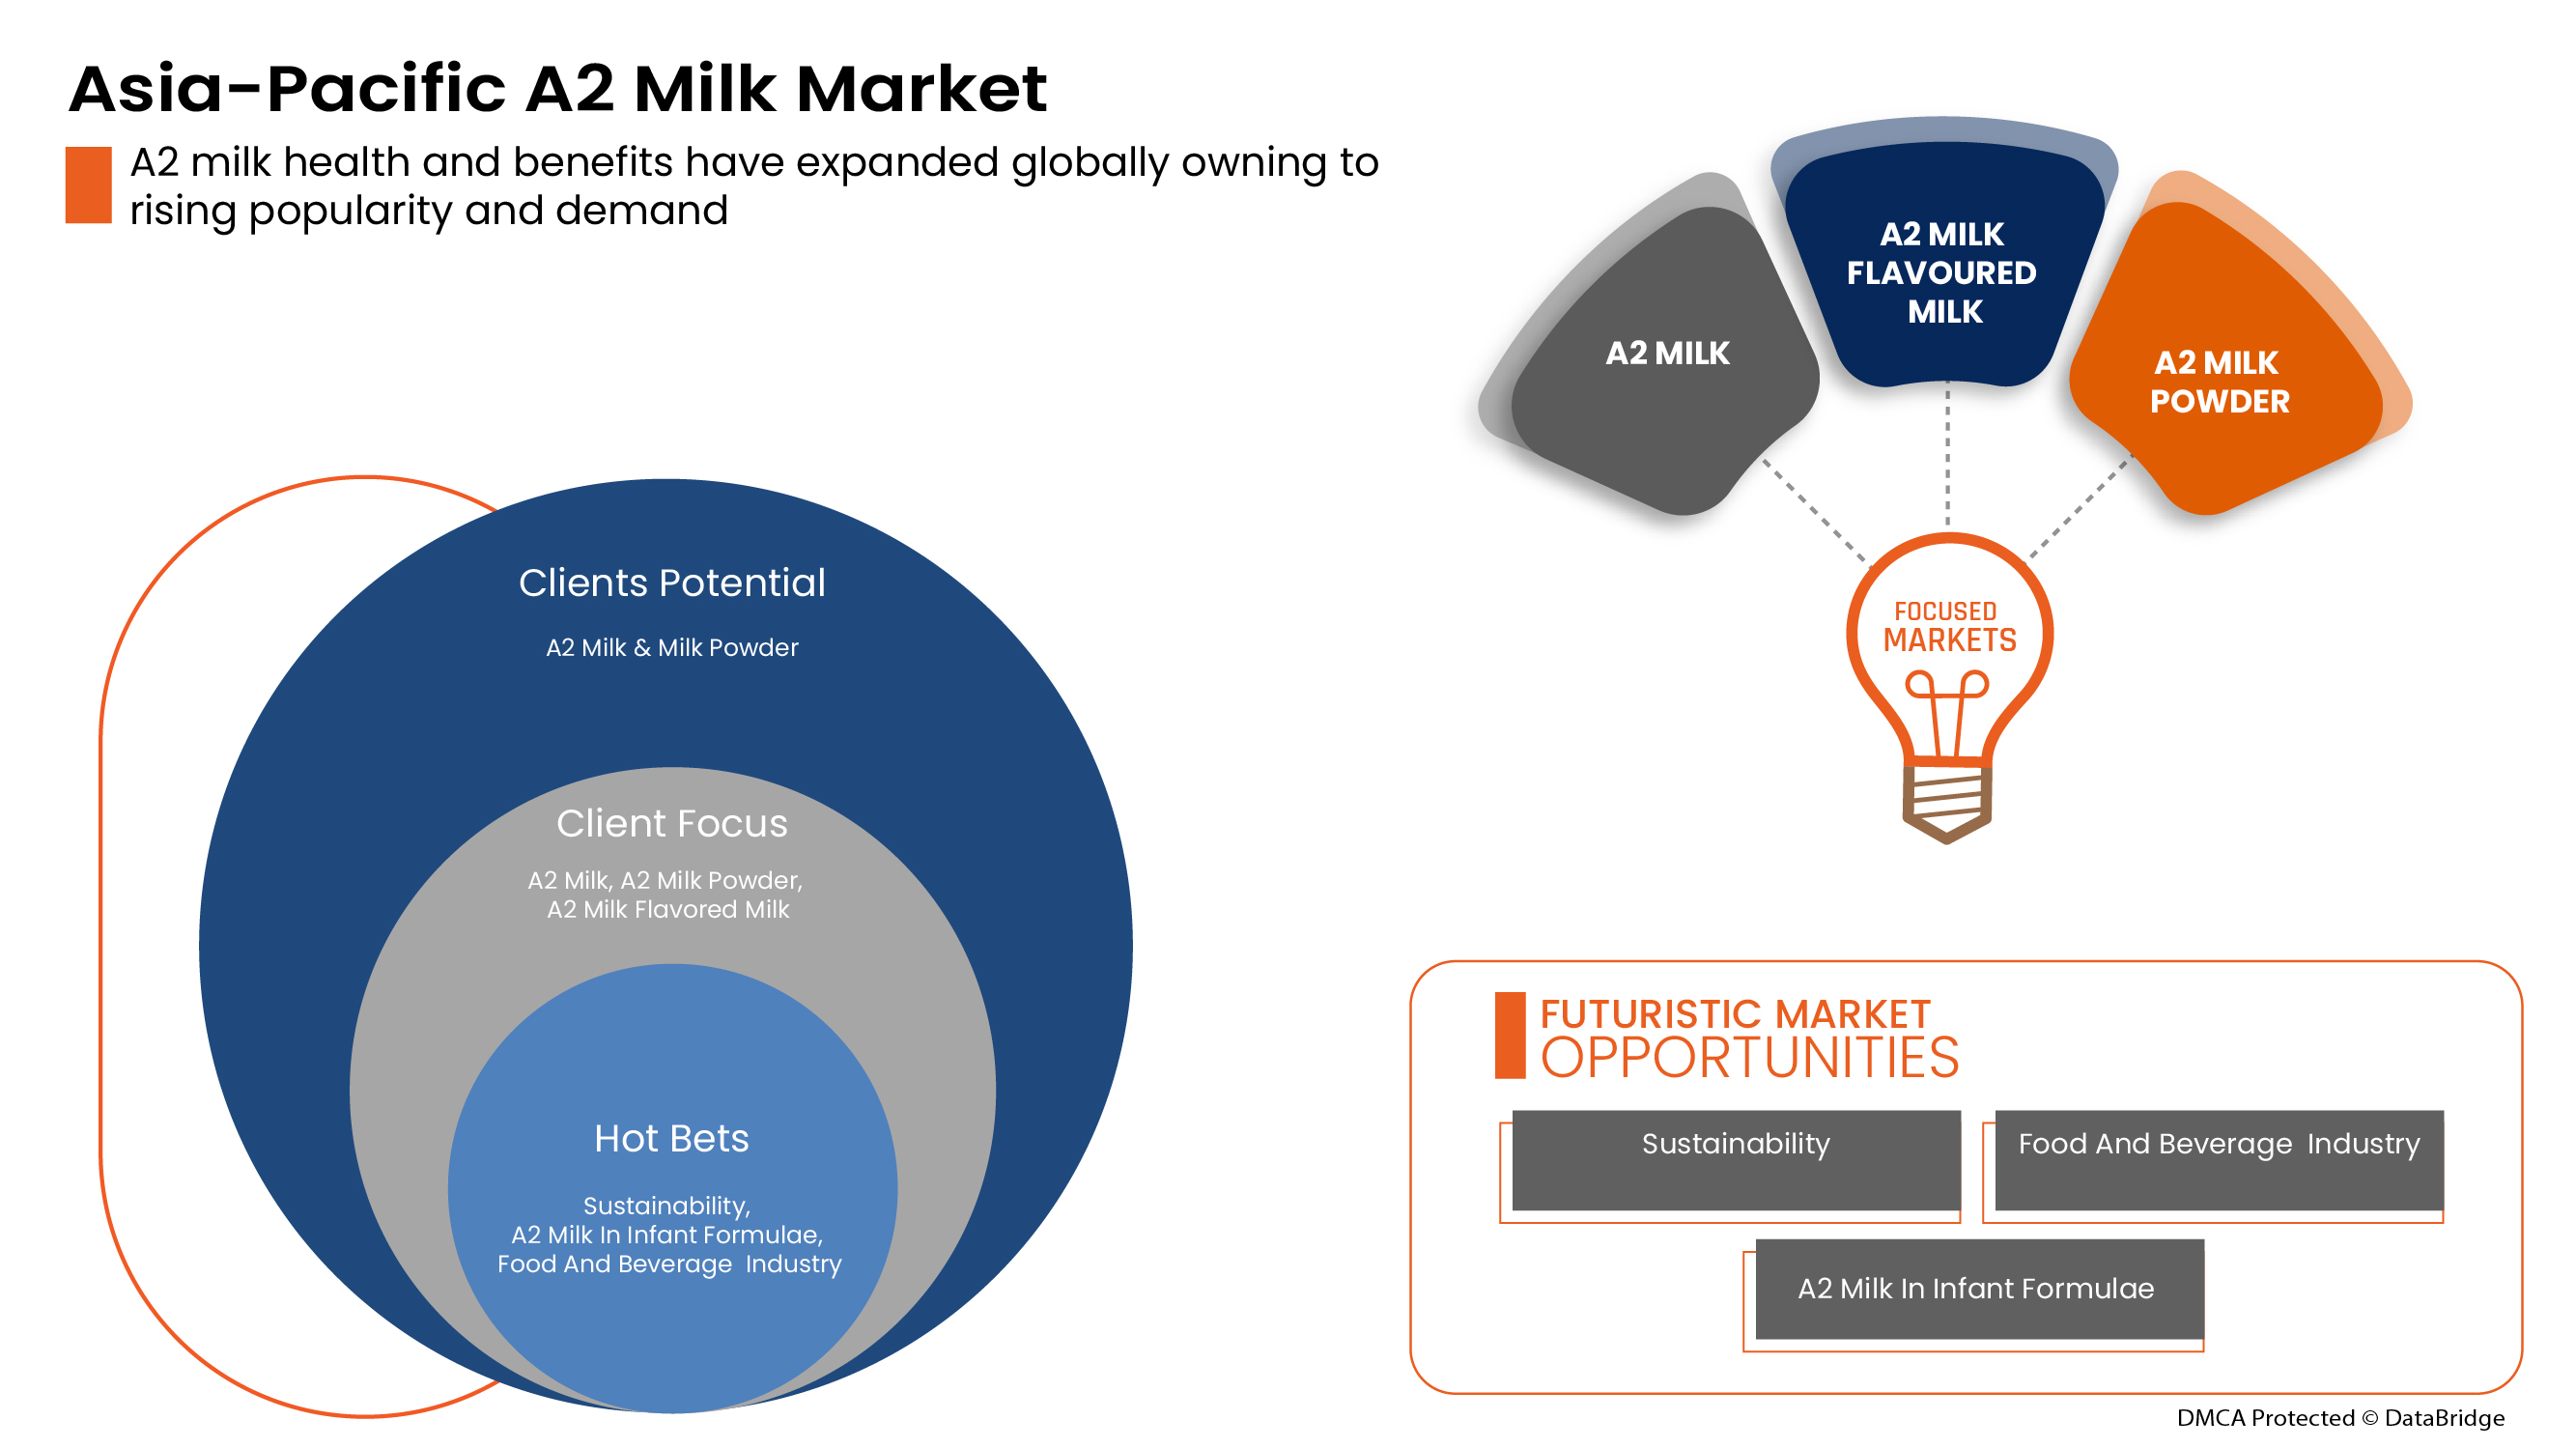
A2 milk aids in the development of immunity, stimulates metabolism and provides Omega 3 fatty acids. A2 dairy is gaining significant growth due to rising consumer awareness of their health and high nutrition content in A2 milk than in regular milk. It is available in various forms and is easily available in the market. However, high prices of A2 milk and its products are expected to restrain the market growth of A2 milk during the forecasted period. The inclination of consumers over sustainable production of A2 milk may lead to further growth in the market. In contrast, growing trends of veganism may serve as a major challenge for developing the Asia-Pacific A2 milk market.
For instance,
Taw river dairy uses its online website as a platform for selling the A2 milk bottles. The company provides doorstep delivery services as per the need and quantity required by the consumer in the U.K. with standard delivery charges.
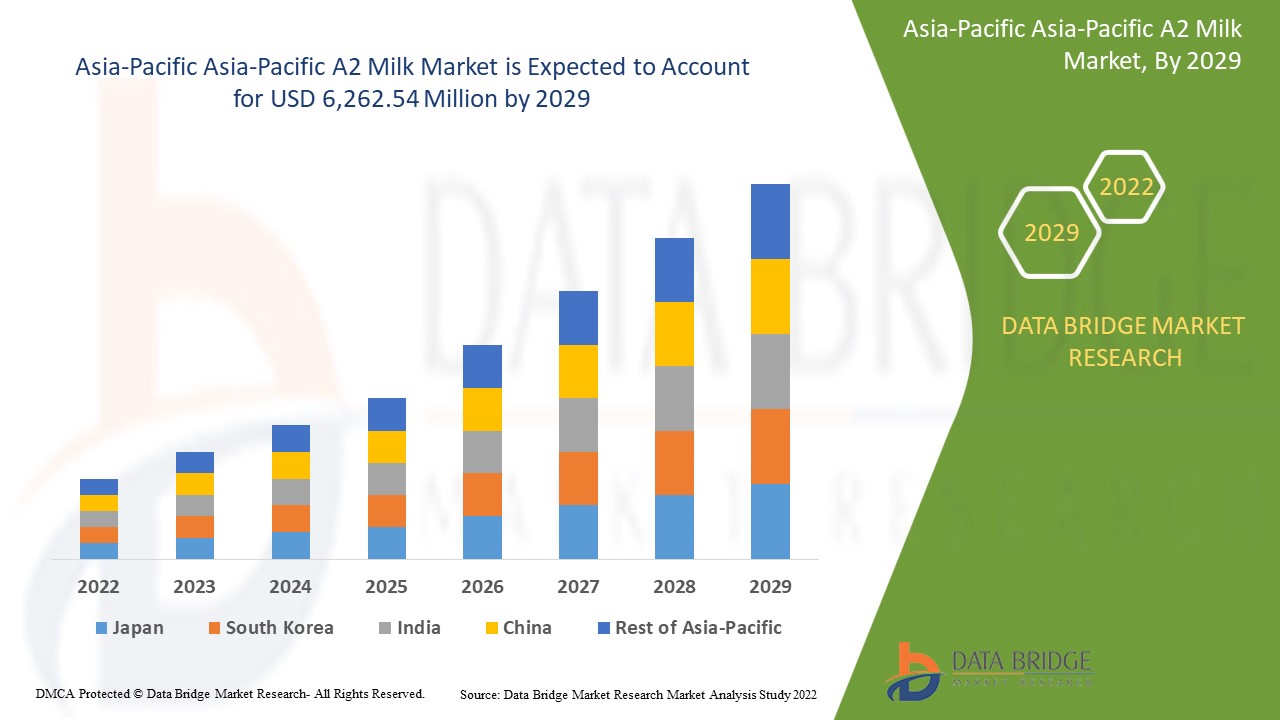
Data Bridge Market Research analyses that the A2 milk market is expected to reach USD 6,262.54 million by 2029, at a CAGR of 22.1% during the forecast period. The A2 milk market report also comprehensively covers pricing, patent and technological advancements.
|
Report Metric |
Details |
|
Forecast Period |
2022 to 2029 |
|
Base Year |
2021 |
|
Historic Year |
2020 (Customizable to 2019-2014) |
|
Quantitative Units |
Revenue in USD Million, Pricing in USD |
|
Segments Covered |
By Form (Powder and Liquid), Nature (Organic and Conventional), Fat Content (No Fat, Low Fat, Reduced Fat and Whole Fat), Packaging Size (101-250 Ml/Gm, 250-500ml/Gm, 501-1000ml/Gm and Above 1000 Ml/Gm), Packaging Form (Bottles, Cartons, Can, Jars and Others) And Distribution Channel (Store Based Retailers and Non-Store Retailers) |
|
Countries Covered |
China, New Zealand, Australia, India, Malaysia, Singapore, South Korea, Indonesia, Japan, Philippines, Thailand and Rest of Asia Pacific |
|
Market Players Covered |
GCMMF, Erden Cremery Private LTd., Provilac Dairy Farms Pvt. Ltd., Ripley Farms LLC, Taw River Dairy, The A2 Milk Company, Urban Farms Milk, Veedaz Organics Pvt Ltd., Avtaran A2 Milk and Organics, DOFE, Captain's Farm, Ksheerdham, Ayuda Organics, Veco Zuivel B.V. and Australia's Own among others. |
Market Definition
A2 milk is a type of cow's milk that lacks the A1 form of casein proteins and mostly contains the A2 form. The A2 beta-casein protein in A2 milk quickly breaks down into amino acids for quick digestion, improving our overall health and increasing cows' milk's nutritional value. A2 cow milk contains minerals such as calcium, potassium and phosphorus required for strong bones and teeth, better muscle function, blood pressure regulation, tissue and cell growth, enhancing good cholesterol (HDL) and maintaining overall nourishment and well-being of the body.
Asia-Pacific A2 Milk Market Dynamics
This section deals with understanding the market drivers, advantages, opportunities, restraints and challenges. All of this is discussed in detail below:
Drivers-
- Growth in awareness about health among consumers
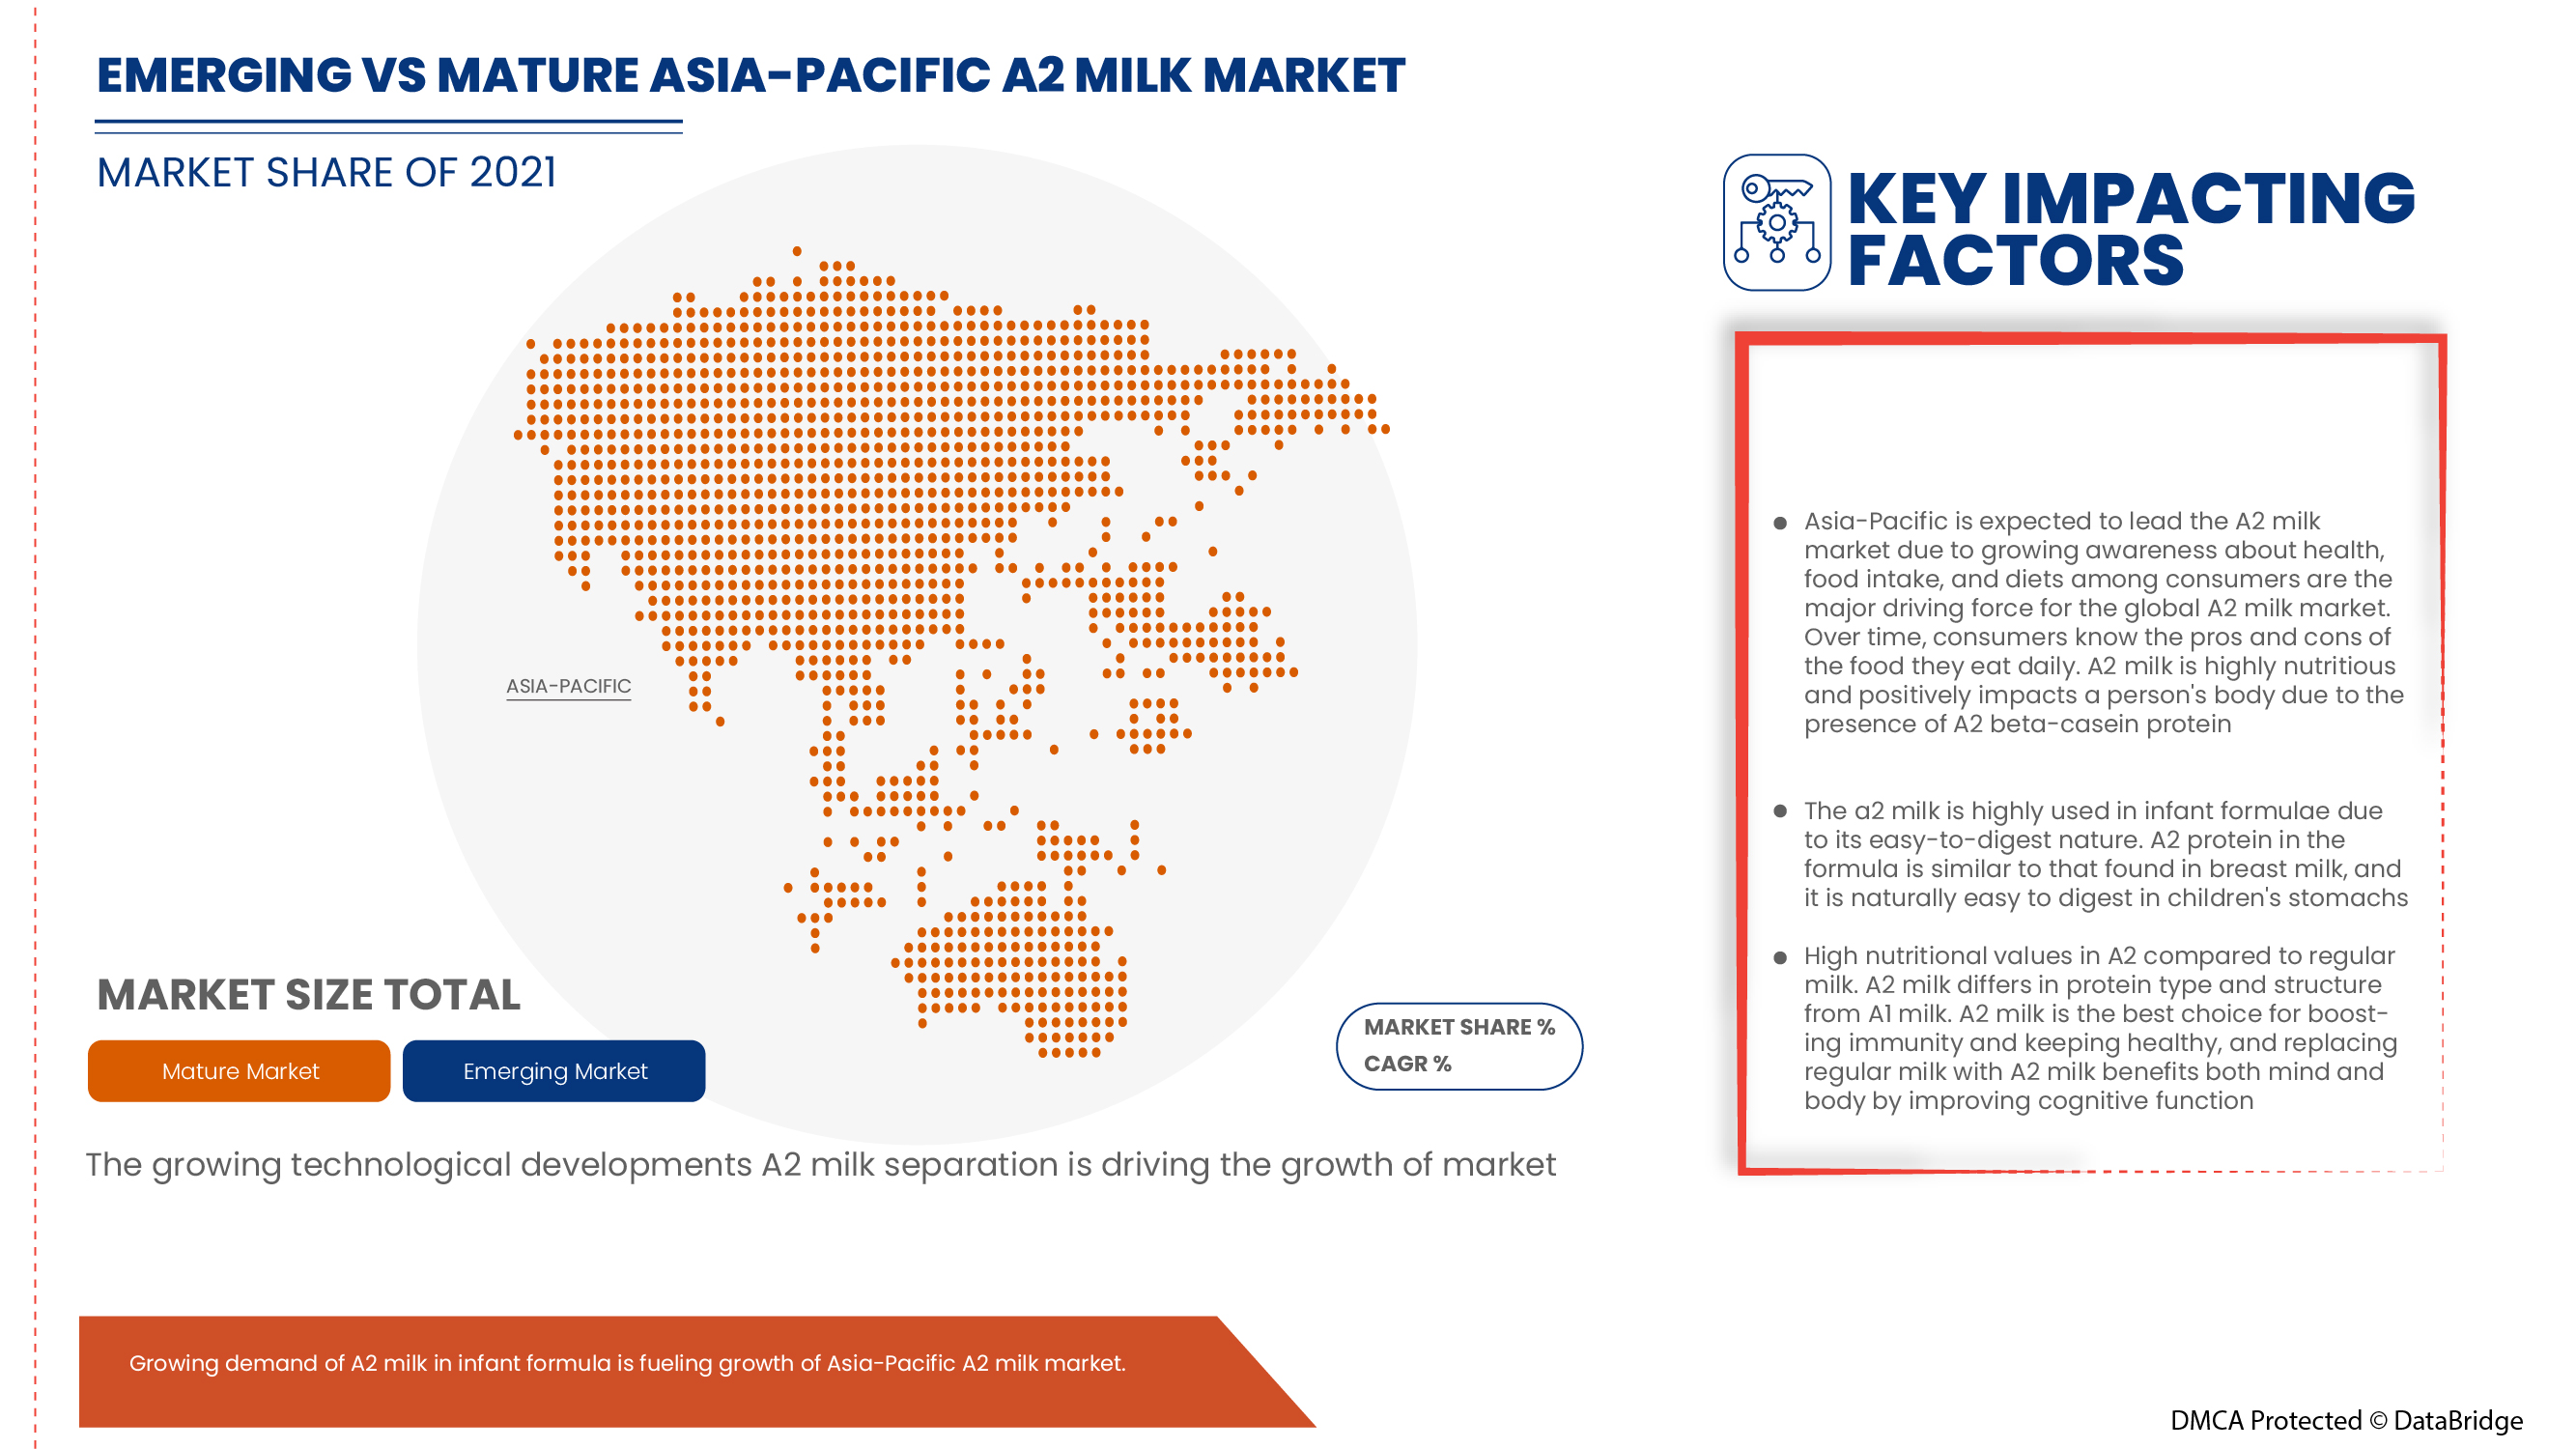
The growing awareness about health, food intake and diets among consumers are the major driving force for the Asia-Pacific A2 milk market. Over time, consumers know the pros and cons of the food they eat daily. A2 milk is highly nutritious and positively impacts a person's body due to the presence of A2 beta-casein protein. This A2 protein prevents various heart diseases, diabetes and autism. With this, people are consuming A2 milk and prefer it for regular consumption. This change in the preference and development of awareness towards health is expected to boost the market growth of the Asia-Pacific A2 milk market.
- Increase in applications of a2 milk in infant formulae
The A2 milk is highly used in infant formulae due to its easy-to-digest nature. A2 protein in the procedure is similar to that found in breast milk and it is naturally easy to digest in children's stomachs. A2 milk is sourced from cows fed from a plant-based diet and never given antibiotics or synthetic growth hormones. This regular usage of A2 milk in infant formulae is leading to higher demand for A2 milk across the globe. A2 milk procured from cows is further processed to make formulae.
For instance,
- Beta A2 Australia claims that Beta A2 Premium Infant Formula is scientifically designed to provide balanced nutrition for a baby from birth or when you stop breastfeeding within the first six months
Thus, the growing demand for infant formula, particularly in countries such as Australia and China, is driving the growth of the Asia-Pacific A2 milk market
- High nutritional values in a2 compared to regular milk
A2 milk differs in protein type and structure from A1 milk. A2 milk is the best choice for boosting immunity and keeping healthy and replacing regular milk with A2 milk benefits the mind and body by improving cognitive function and nourishing skin and hair. In addition, A2 milk prevents problems such as heart disease, lactose intolerance, diabetes and autism. With abundant nutrition and numerous health benefits, consumers' demand for A2 milk is rising rapidly. End users prefer A2 milk over regular milk in different dairy products to maintain good health. Hence, A2 milk is proved to be more nutritious than regular milk.
Restrain-
- High prices of a2 milk
The high prices of A2 milk over regular milk serve as a major restraint for market growth. The A2 milk and milk products have a price range double the regular milk in the market. The production of A2 milk is still limited as A2 milk cow breeds provide less milk per day and due to this, companies are charging high costs for A2 milk to generate higher revenues. The end users of A2 milk are the common men and the presence of A2 milk in the market with a higher range is not affordable to plenty of people. Due to higher degrees, people prefer regular milk over A2 milk and its products. These high milk prices are a major restraining factor in the market growth.
Opportunity-
- Inclination of consumers over sustainable production of A2 milk
Sustainability protects the environment's health and bio capacity. Individual and community well-being is aided by sustainability. Sustainability promotes a better economy with less pollution and waste, fewer emissions, more employment and equitable wealth distribution. A sustainable approach to A2 milk production reduces the environmental impact of dairy farming while increasing the dairy sector's animal welfare and social endorsement. Consumers with higher moral standards are more likely to be interested in purchasing A2 milk dairy products that are using sustainable innovations. Regular organic consumers have a more favorable attitude toward dairy products that use sustainable innovation. As a result, many A2 milk-based companies focus on sustainability in their production, processing, packaging and other processes.
Challenge
- High investment in R&D for a2 milk products
Companies invest in R&D for various reasons, including increased market participation, cost savings, marketing advancements and trend-matching. R&D can assist a company in following or staying ahead of market trends, thereby keeping the company relevant. Some benefits of R&D are obvious, such as the possibility of higher productive output or new product lines. But the investment required for R&D for A2 milk products is very high but is also necessary for new product launches. So, many companies are incapable of investing highly in this R&D department and do not launch any new products useful for Asia-Pacific A2 milk market growth
Post COVID-19 Impact on A2 Milk Market
COVID-19 significantly impacted the A2 milk market as almost every country has opted to shut down every production facility except those dealing in producing the essential goods and A2 milk has been considered a real good. The government has taken some strict actions, such as the shutdown of production and sale of non-essential goods,
The growth of the Asia-Pacific A2 milk market is increasing as the growing demand for A2 milk in the region has resulted in the launching of new A2 milk in the Asian Market. Hence, demand for A12 milk is estimated to spur product consumption over the forecast period. However, factors such as lack of knowledge regarding A2 milk restrain the market growth.
Manufacturers are making various strategic decisions to bounce back post-COVID-19. The players are conducting multiple research and development activities to improve the technology producing A2 milk by separating protein. The companies will bring advanced and accurate controllers to the market.
Recent Development
- In October 2021, the a2 Milk Company and the Hershey Company released the co-branded Hershey's/the a2 Milk Company chocolate milk. Removing a new or upgraded product requires R&D help, so these companies release very few new products into the market due to the lack of high investments in R&D
Asia-Pacific A2 Milk Market Scope
Asia-Pacific A2 milk market is segmented on form, nature, fat content, packaging size, packaging form and distribution channel. The growth amongst these segments will help you analyze major growth segments in the industries and provide the users with a valuable market overview and market insights to help them make strategic decisions for identifying core market applications.
Form
- Powder
- Liquid
On the basis of form, the Asia-Pacific A2 milk market is segmented into powder and liquid.
Nature
- Organic
- Conventional
On the basis of nature, the Asia-Pacific A2 milk market is segmented into organic and conventional.
Fat Content
- No fat
- Low fat
- Reduced fat
- Whole fat
On the basis of fat content, the Asia-Pacific A2 milk market is segmented into no fat, low fat, reduced fat and whole fat.
Packaging Size
- 101-250ml/gm
- 250-500mlgm
- 501-1000ml/gm
- Above 1000ml/gm
On the basis of packaging size, the Asia-Pacific A2 milk market is segmented into 101-250 ml/gm, 250-500ml/gm, 501-1000ml/gm and above 1000 ml/gm.
Packaging Form
- Bottles
- Cartons
- Can
- Jars
- Others
On the basis of packaging form, the Asia-Pacific A2 milk market is segmented into bottles, cartons, can, jars and others.
Distribution Channel
- Stored based retailers
- Non-store retailers
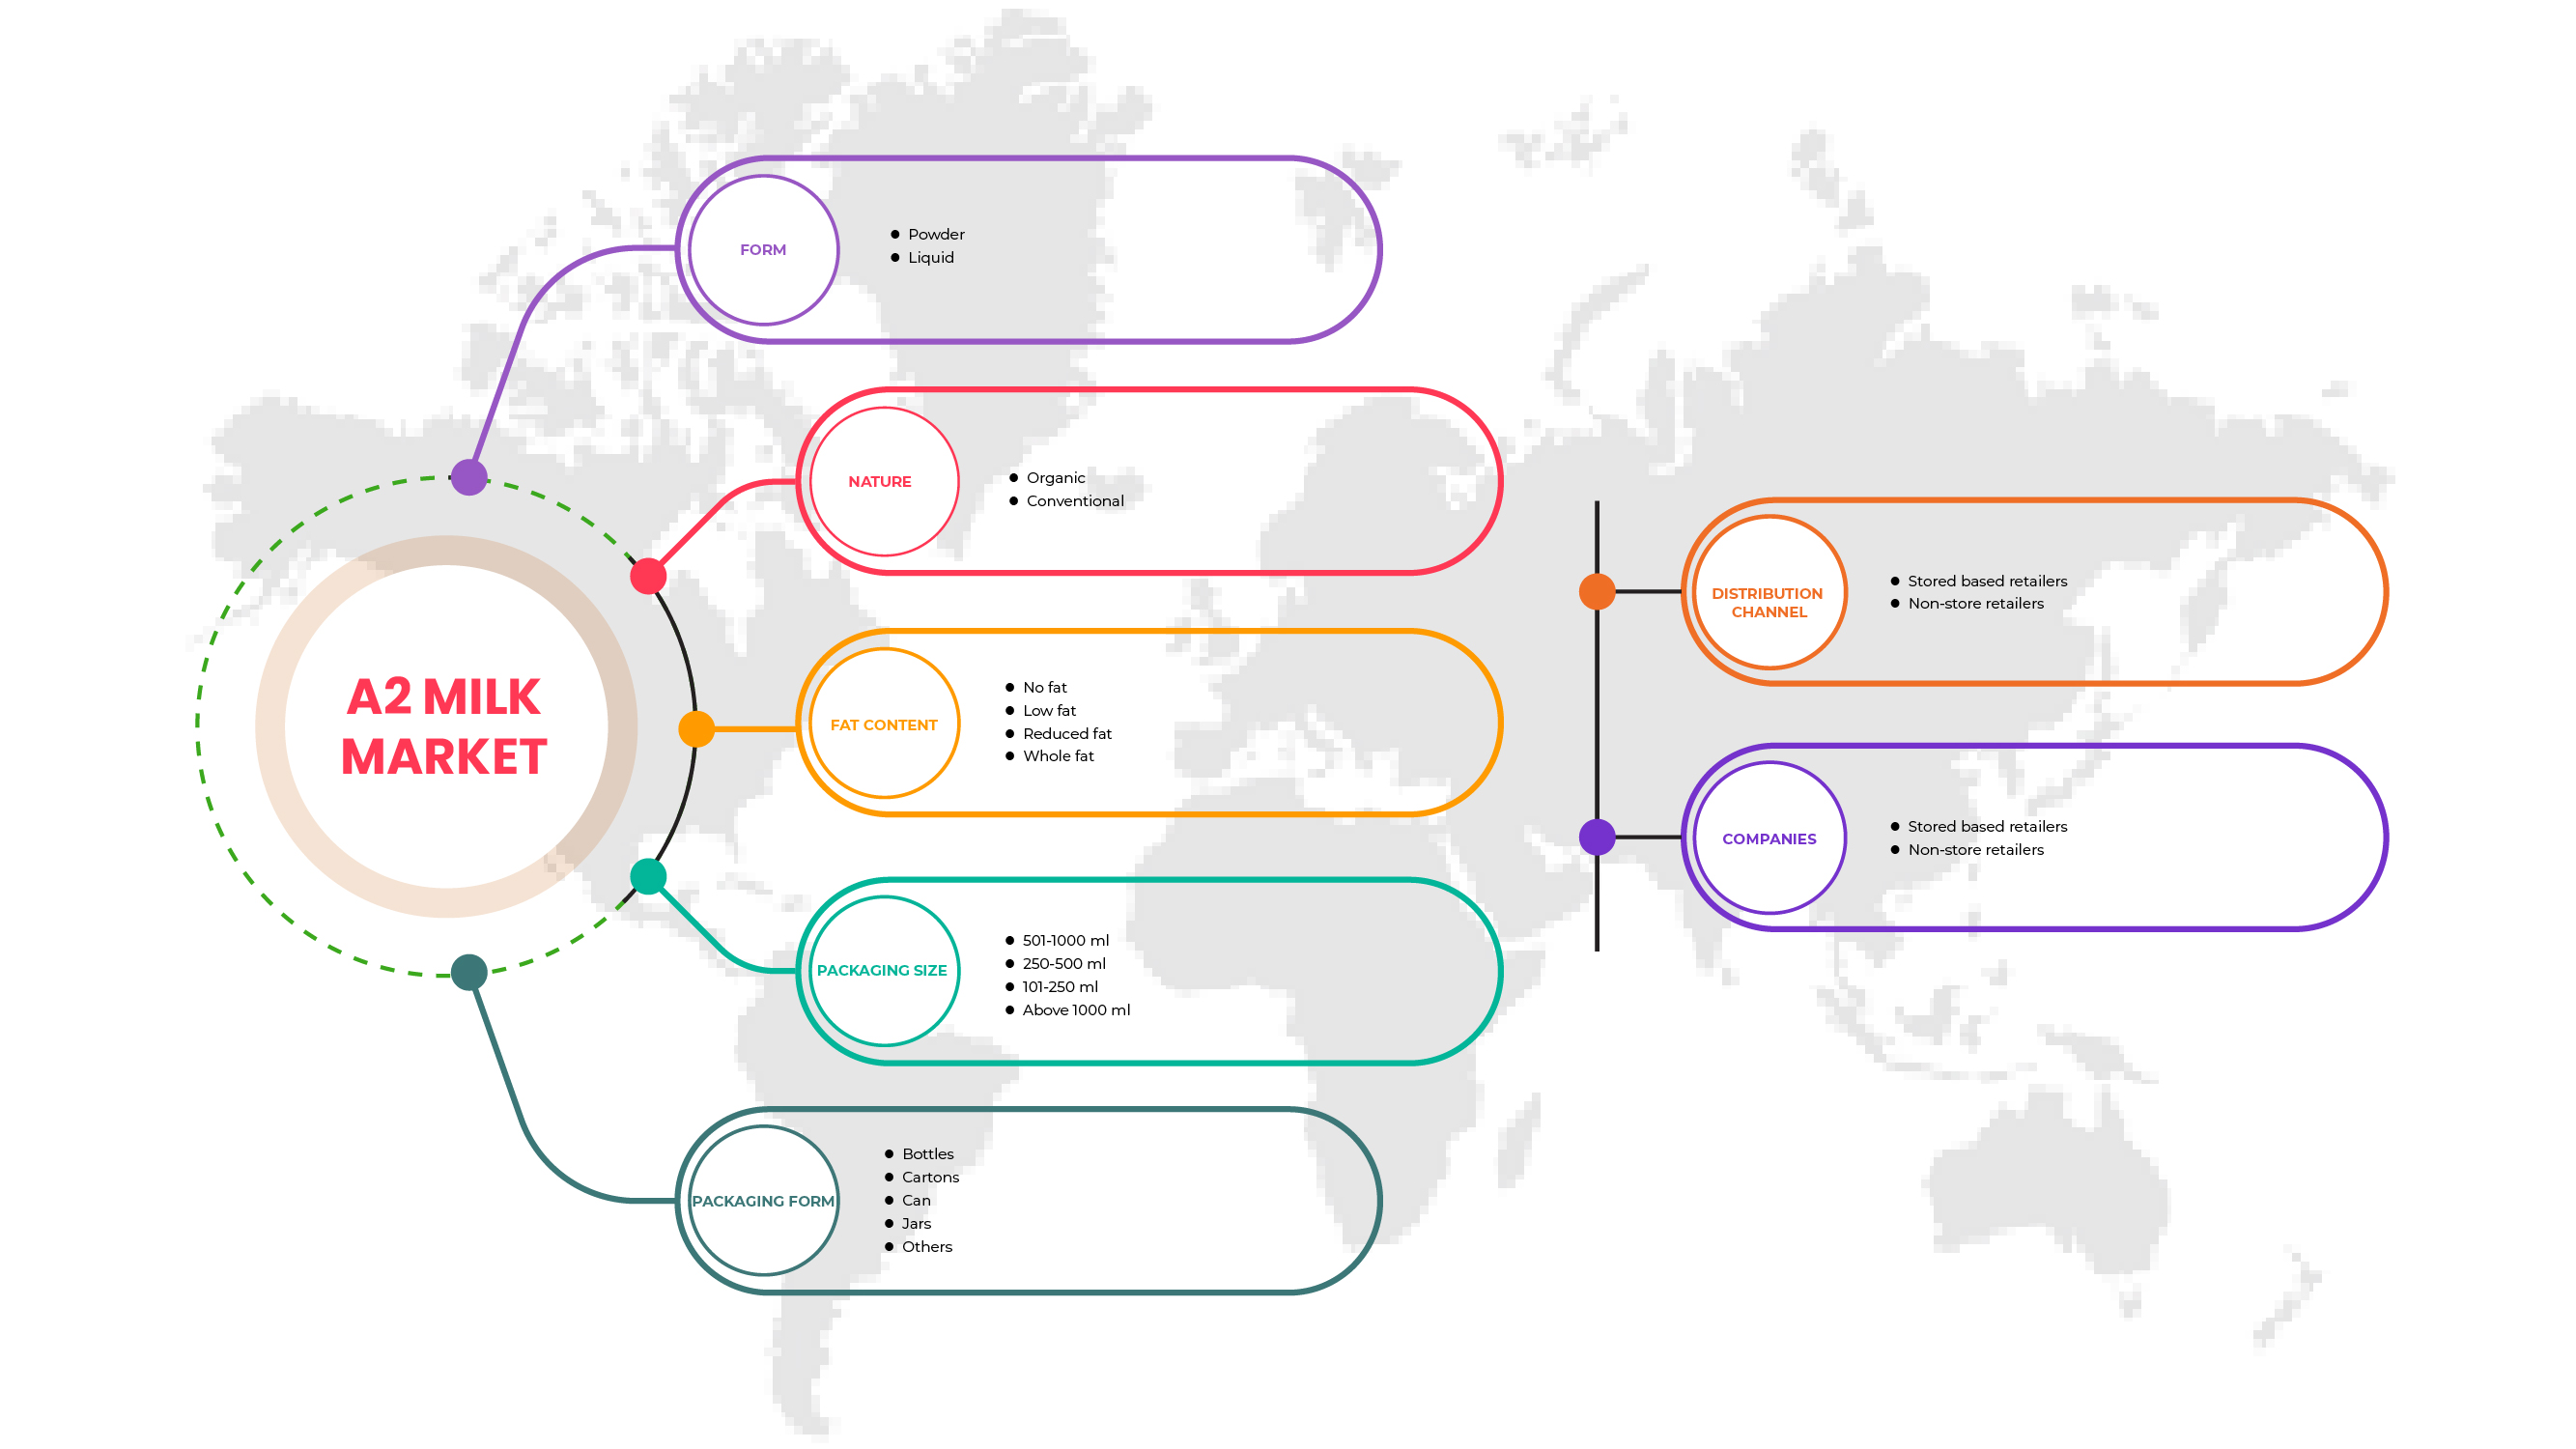
On the basis of distribution channel, the Asia-Pacific A2 milk market is segmented into store based retailers and non-store retailers.
A2 Milk Market Regional Analysis/Insights
The A2 milk market is analyzed and market size insights and trends are provided by country, form, nature, fat content, packaging size, packaging form and distribution channel, as referenced above.
The countries covered in the Asia-Pacific A2 milk market report are China, New Zealand, Australia, India, Malaysia, Singapore, South Korea, Indonesia, Japan, Philippines, Thailand and Rest of Asia Pacific.
India dominates the Asia-pacific region due to the exponential use of A2 milks in the country's infant formula manufacturing.
The country section of the report also provides individual market impacting factors and changes in market regulation that influence the current and future trends of the market. Data points like downstream and upstream value chain analysis, technological trends, porter's five forces analysis and case studies are some of the pointers used to forecast the market scenario for individual countries. Also, the presence and availability of Asia-Pacific brands and their challenges faced due to large or scarce competition from local and domestic brands, the impact of domestic tariffs and trade routes are considered while providing forecast analysis of the country data.
Competitive Landscape and A2 Milk Market Share Analysis
The A2 milk market competitive landscape provides details about a competitor. Components included are company overview, company financials, revenue generated, market potential, investment in research and development, new market initiatives, Asia-Pacific presence, production sites and facilities, production capacities, company strengths and weaknesses, product launch and product width and breadth, application dominance. The above data points are only related to the companies focus on the A2 milk market.
Some of the major players operating in the A2 milk market are GCMMF, Erden Cremery Private LTd., Provilac Dairy Farms Pvt. Ltd., Ripley Farms LLC, Taw River Dairy, The A2 Milk Company, Urban Farms Milk, Veedaz Organics Pvt Ltd., Avtaran A2 Milk and Organics, DOFE, Captain's Farm, Ksheerdham, Ayuda Organics, Veco Zuivel B.V. and Australia's Own among others.
SKU-

- Interactive Data Analysis Dashboard
- Company Analysis Dashboard for high growth potential opportunities
- Research Analyst Access for customization & queries
- Competitor Analysis with Interactive dashboard
- Latest News, Updates & Trend analysis
- Harness the Power of Benchmark Analysis for Comprehensive Competitor Tracking
Table of Content
1 INTRODUCTION
1.1 OBJECTIVES OF THE STUDY
1.2 MARKET DEFINITION
1.3 OVERVIEW OF ASIA PACIFIC A2 MILK MARKET
1.4 LIMITATIONS
1.5 MARKETS COVERED
2 MARKET SEGMENTATION
2.1 MARKETS COVERED
2.2 GEOGRAPHICAL SCOPE
2.3 YEARS CONSIDERED FOR THE STUDY
2.4 CURRENCY AND PRICING
2.5 DBMR TRIPOD DATA VALIDATION MODEL
2.6 MULTIVARIATE MODELLING
2.7 TREATMENT LIFELINE CURVE
2.8 PRIMARY INTERVIEWS WITH KEY OPINION LEADERS
2.9 DBMR MARKET POSITION GRID
2.1 VENDOR SHARE ANALYSIS
2.11 SECONDARY SOURCES
2.12 ASSUMPTIONS
3 EXECUTIVE SUMMARY
4 PREMIUM INSIGHTS
4.1 FACTORS INFLUENCING PURCHASE DECISION
4.1.1 PRODUCT NUTRITIONAL QUALITY
4.1.2 PRODUCT PRICING
4.1.3 AUTHENTICITY OF PRODUCT
4.2 GROWTH STRATEGIES ADOPTED BY KEY MARKET PLAYERS
4.3 TRADE ANALYSIS
4.3.1 IMPORTS-EXPORTS OF THE ASIA PACIFIC A2 MILK MARKET
4.4 INDUSTRY TRENDS AND FUTURE PERSPECTIVE OF ASIA PACIFIC A2 MILK MARKET
4.4.1 INDUSTRY TRENDS
4.4.2 FUTURE PERSPECTIVE
4.5 RAW MATERIAL SOURCING ANALYSIS: ASIA PACIFIC A2 MILK MARKET
4.6 SUPPLY CHAIN OF THE ASIA PACIFIC A2 MILK MARKET
4.6.1 RAW A2 MILK PRODUCTION
4.6.2 PROCESSING AND PACKAGING
4.6.3 TRANSPORTATION AND DISTRIBUTION
4.6.4 END USERS
4.7 TECHNOLOGICAL ADVANCEMENTS
4.8 VALUE CHAIN ANALYSIS: ASIA PACIFIC A2 MILK MARKET
4.9 PORTER'S FIVE
4.9.1 PORTER'S FIVE FORCES ANALYSIS FOR ASIA PACIFIC A2 MILK MARKET
4.9.2 BARGAINING POWER OF SUPPLIERS
4.9.3 BARGAINING POWER OF BUYERS/CONSUMERS
4.9.4 THREAT OF NEW ENTRANTS
4.9.5 THREAT OF SUBSTITUTE PRODUCTS
4.9.6 INTENSITY OF COMPETITIVE RIVALRY
5 REGULATORY FRAMEWORK AND LABELLING FOR THE ASIA PACIFIC A2 MILK MARKET
6 IMPACT OF ECONOMIC SLOWDOWN ON THE MARKET –ASIA PACIFIC A2 MILK MARKET
6.1 IMPACT ON PRICE
6.2 IMPACT ON SUPPLY CHAIN
6.3 IMPACT ON SHIPMENT
6.4 IMPACT ON COMPANY'S STRATEGIC DECISIONS
7 PRICING INDEX
7.1 FOB & B2B PRICES - ASIA PACIFIC A2 MILK MARKET
7.2 B2B PRICES - ASIA PACIFIC A2 MILK MARKET
8 PRODUCTION CAPACITY OF KEY MANUFACTURERS
9 BRAND OUTLOOK
9.1 PRODUCT VS BRAND OVERVIEW
10 MARKET OVERVIEW
10.1 DRIVERS
10.1.1 GROWING AWARENESS ABOUT HEALTH AMONG CONSUMERS
10.1.2 INCREASING APPLICATIONS OF A2 MILK IN INFANT FORMULAE
10.1.3 HIGH NUTRITIONAL VALUES IN A2 COMPARED TO REGULAR MILK
10.1.4 CONSUMERS EXPERIENCING HEALTH ISSUES DUE TO CONSUMPTION OF REGULAR MILK
10.2 RESTRAINT
10.2.1 HIGH PRICES OF A2 MILK
10.3 OPPORTUNITY
10.3.1 INCLINATION OF CONSUMERS OVER SUSTAINABLE PRODUCTION OF A2 MILK
10.4 CHALLENGES
10.4.1 GROWING TREND OF VEGANISM AMONG PEOPLE
10.4.2 HIGH INVESTMENT IN R&D FOR A2 MILK PRODUCTS
11 ASIA PACIFIC A2 MILK MARKET, BY FORM
11.1 OVERVIEW
11.2 LIQUID
11.3 POWDER
12 ASIA PACIFIC A2 MILK MARKET, BY NATURE
12.1 OVERVIEW
12.2 CONVENTIONAL
12.3 ORGANIC
13 ASIA PACIFIC A2 MILK MARKET, BY FAT CONTENT
13.1 OVERVIEW
13.2 WHOLE FAT
13.3 LOW FAT
13.4 REDUCED FAT
13.5 NO FAT
14 ASIA PACIFIC A2 MILK MARKET, BY PACKAGIING SIZE
14.1 OVERVIEW
14.2 501-1000 ML
14.3 250-500 ML
14.4 101-250 ML
14.5 ABOVE 1000 ML
15 ASIA PACIFIC A2 MILK MARKET, BY PACKAGING FORM
15.1 OVERVIEW
15.2 BOTTLES
15.2.1 PLASTIC
15.2.2 GLASS
15.3 CARTONS
15.4 CAN
15.5 JARS
15.6 OTHERS
16 ASIA PACIFIC A2 MILK MARKET, BY DISTRIBUTION CHANNEL
16.1 OVERVIEW
16.2 NON-STORE RETAILERS
16.2.1 ONLINE
16.2.2 VENDING MACHINE
16.3 STORE BASED RETAILERS
16.3.1 SUPERMARKETS/HYPERMARKETS
16.3.2 CONVENIENCE STORES
16.3.3 GROCERY STORES
16.3.4 SPECIALTY STORES
17 ASIA PACIFIC A2 MILK MARKET, BY REGION
17.1 ASIA-PACIFIC
17.1.1 CHINA
17.1.2 NEW ZEALAND
17.1.3 AUSTRALIA
17.1.4 INDIA
17.1.5 MALAYSIA
17.1.6 SINGAPORE
17.1.7 SOUTH KOREA
17.1.8 INDONESIA
17.1.9 JAPAN
17.1.10 PHILIPPINES
17.1.11 THAILAND
17.1.12 REST OF ASIA-PACIFIC
18 COMPANY LANDSCAPE: ASIA PACIFIC A2 MILK MARKET
18.1 COMPANY SHARE ANALYSIS: ASIA PACIFIC
19 SWOT ANALYSIS
20 COMPANY PROFILE
20.1 THE A2 MILK COMPANY LIMITED
20.1.1 COMPANY SNAPSHOT
20.1.2 REVENUE ANALYSIS
20.1.3 COMPANY SHARE ANALYSIS
20.1.4 PRODUCT PORTFOLIO
20.1.5 RECENT DEVELOPMENTS
20.2 GCMMF
20.2.1 COMPANY SNAPSHOT
20.2.2 COMPANY SHARE ANALYSIS
20.2.3 PRODUCT PORTFOLIO
20.2.4 RECENT DEVELOPMENT
20.3 CAPTAIN’S FARM
20.3.1 COMPANY SNAPSHOT
20.3.2 COMPANY SHARE ANALYSIS
20.3.3 PRODUCT PORTFOLIO
20.3.4 RECENT DEVELOPMENT
20.4 VEDAAZ ORGANICS PVT. LTD.
20.4.1 COMPANY SNAPSHOT
20.4.2 COMPANY SHARE ANALYSIS
20.4.3 PRODUCT PORTFOLIO
20.4.4 RECENT DEVELOPMENT
20.5 URBAN FARMS MILK
20.5.1 COMPANY SNAPSHOT
20.5.2 COMPANY SHARE ANALYSIS
20.5.3 PRODUCT PORTFOLIO
20.5.4 RECENT DEVELOPMENT
20.6 AUSTRALIA'S OWN
20.6.1 COMPANY SNAPSHOT
20.6.2 PRODUCT PORTFOLIO
20.6.3 RECENT DEVELOPMENT
20.7 AVTARAN MILK
20.7.1 COMPANY SNAPSHOT
20.7.2 PRODUCT PORTFOLIO
20.7.3 RECENT DEVELOPMENT
20.8 AYUDA ORGANICS
20.8.1 COMPANY SNAPSHOT
20.8.2 PRODUCT PORTFOLIO
20.8.3 RECENT DEVELOPMENT
20.9 DOFE
20.9.1 COMPANY SNAPSHOT
20.9.2 PRODUCT PORTFOLIO
20.9.3 RECENT DEVELOPMENT
20.1 ERDEN CREAMERY PRIVATE LIMITED
20.10.1 COMPANY SNAPSHOT
20.10.2 PRODUCT PORTFOLIO
20.10.3 RECENT DEVELOPMENT
20.11 KSHEERDHAM
20.11.1 COMPANY SNAPSHOT
20.11.2 PRODUCT PORTFOLIO
20.11.3 RECENT DEVELOPMENT
20.12 PROVILAC DAIRY FARMS PVT. LTD
20.12.1 COMPANY SNAPSHOT
20.12.2 PRODUCT PORTFOLIO
20.12.3 RECENT DEVELOPMENT
20.13 RIPLEY FARMS LLC
20.13.1 COMPANY SNAPSHOT
20.13.2 PRODUCT PORTFOLIO
20.13.3 RECENT DEVELOPMENT
20.14 TAW RIVER DAIRY
20.14.1 COMPANY SNAPSHOT
20.14.2 PRODUCT PORTFOLIO
20.14.3 RECENT DEVELOPMENT
20.15 VECO ZUIVEL B.V.
20.15.1 COMPANY SNAPSHOT
20.15.2 PRODUCT PORTFOLIO
20.15.3 RECENT DEVELOPMENT
21 QUESTIONNAIRE
22 RELATED REPORTS
List of Table
TABLE 1 FREE ON BOARD (FOB) OF A2 MILK
TABLE 2 BRAND COMPARATIVE ANALYSIS OF THE ASIA PACIFIC A2 MILK MARKET
TABLE 3 ASIA PACIFIC A2 MILK MARKET, BY FORM, 2020-2029 (USD MILLION)
TABLE 4 ASIA PACIFIC LIQUID IN A2 MILK MARKET, BY REGION, 2020-2029 (USD MILLION)
TABLE 5 ASIA PACIFIC POWDER IN A2 MILK MARKET, BY REGION, 2020-2029 (USD MILLION)
TABLE 6 ASIA PACIFIC A2 MILK MARKET, BY NATURE, 2020-2029 (USD MILLION)
TABLE 7 ASIA PACIFIC CONVENTIONAL IN A2 MILK MARKET, BY REGION, 2020-2029 (USD MILLION)
TABLE 8 ASIA PACIFIC ORGANIC IN A2 MILK MARKET, BY REGION, 2020-2029 (USD MILLION)
TABLE 9 ASIA PACIFIC A2 MILK MARKET, BY FAT CONTENT, 2020-2029 (USD MILLION)
TABLE 10 ASIA PACIFIC WHOLE FAT IN A2 MILK MARKET, BY REGION, 2020-2029 (USD MILLION)
TABLE 11 ASIA PACIFIC LOW FAT IN A2 MILK MARKET, BY REGION, 2020-2029 (USD MILLION)
TABLE 12 ASIA PACIFIC REDUCED FAT IN A2 MILK MARKET, BY REGION, 2020-2029 (USD MILLION)
TABLE 13 ASIA PACIFIC NO FAT IN A2 MILK MARKET, BY REGION, 2020-2029 (USD MILLION)
TABLE 14 ASIA PACIFIC A2 MILK MARKET, BY PACKAGING SIZE, 2020-2029 (USD MILLION)
TABLE 15 ASIA PACIFIC 501-1000 ML IN A2 MILK MARKET, BY REGION, 2020-2029 (USD MILLION)
TABLE 16 ASIA PACIFIC 250-500 ML IN A2 MILK MARKET, BY REGION, 2020-2029 (USD MILLION)
TABLE 17 ASIA PACIFIC 101-250 ML IN A2 MILK MARKET, BY REGION, 2020-2029 (USD MILLION)
TABLE 18 ASIA PACIFIC ABOVE 1000 ML IN A2 MILK MARKET, BY REGION, 2020-2029 (USD MILLION)
TABLE 19 ASIA PACIFIC A2 MILK MARKET, BY PACKAGING FORM, 2020-2029 (USD MILLION)
TABLE 20 ASIA PACIFIC BOTTLES IN A2 MILK MARKET, BY REGION, 2020-2029 (USD MILLION)
TABLE 21 ASIA PACIFIC BOTTLES IN A2 MILK MARKET, BY TYPE, 2020-2029 (USD MILLION)
TABLE 22 ASIA PACIFIC CARTONS IN A2 MILK MARKET, BY REGION, 2020-2029 (USD MILLION)
TABLE 23 ASIA PACIFIC CAN IN A2 MILK MARKET, BY REGION, 2020-2029 (USD MILLION)
TABLE 24 ASIA PACIFIC JARS IN A2 MILK MARKET, BY REGION, 2020-2029 (USD MILLION)
TABLE 25 ASIA PACIFIC OTHERS IN A2 MILK MARKET, BY REGION, 2020-2029 (USD MILLION)
TABLE 26 ASIA PACIFIC A2 MILK MARKET, BY DISTRIBUTION CHANNEL, 2020-2029 (USD MILLION)
TABLE 27 ASIA PACIFIC NON-STORE RETAILERS IN A2 MILK MARKET, BY REGION, 2020-2029 (USD MILLION)
TABLE 28 ASIA PACIFIC NON-STORE RETAILERS IN A2 MILK MARKET, BY TYPE, 2020-2029 (USD MILLION)
TABLE 29 ASIA PACIFIC STORE BASED RETAILERS IN A2 MILK MARKET, BY REGION, 2020-2029 (USD MILLION)
TABLE 30 ASIA PACIFIC STORE BASED RETAILERS IN A2 MILK MARKET, BY TYPE, 2020-2029 (USD MILLION)
TABLE 31 ASIA-PACIFIC A2 MILK MARKET, BY COUNTRY, 2020-2029 (USD MILLION)
TABLE 32 ASIA-PACIFIC A2 MILK MARKET, BY FORM, 2020-2029 (USD MILLION)
TABLE 33 ASIA-PACIFIC A2 MILK MARKET, BY NATURE, 2020-2029 (USD MILLION)
TABLE 34 ASIA-PACIFIC A2 MILK MARKET, BY FAT CONTENT, 2020-2029 (USD MILLION)
TABLE 35 ASIA-PACIFIC A2 MILK MARKET, BY PACKAGING SIZE, 2020-2029 (USD MILLION)
TABLE 36 ASIA-PACIFIC A2 MILK MARKET, BY PACKAGING FORM, 2020-2029 (USD MILLION)
TABLE 37 ASIA-PACIFIC BOTTLES IN A2 MILK MARKET, BY TYPE, 2020-2029 (USD MILLION)
TABLE 38 ASIA-PACIFIC A2 MILK MARKET, BY DISTRIBUTION CHANNEL, 2020-2029 (USD MILLION)
TABLE 39 ASIA-PACIFIC STORE BASED RETAILERS IN A2 MILK MARKET, BY TYPE, 2020-2029 (USD MILLION)
TABLE 40 ASIA-PACIFIC NON-STORE RETAILERS IN A2 MILK MARKET, BY TYPE, 2020-2029 (USD MILLION)
TABLE 41 CHINA A2 MILK MARKET, BY FORM, 2020-2029 (USD MILLION)
TABLE 42 CHINA A2 MILK MARKET, BY NATURE, 2020-2029 (USD MILLION)
TABLE 43 CHINA A2 MILK MARKET, BY FAT CONTENT, 2020-2029 (USD MILLION)
TABLE 44 CHINA A2 MILK MARKET, BY PACKAGING SIZE, 2020-2029 (USD MILLION)
TABLE 45 CHINA A2 MILK MARKET, BY PACKAGING FORM, 2020-2029 (USD MILLION)
TABLE 46 CHINA BOTTLES IN A2 MILK MARKET, BY TYPE, 2020-2029 (USD MILLION)
TABLE 47 CHINA A2 MILK MARKET, BY DISTRIBUTION CHANNEL, 2020-2029 (USD MILLION)
TABLE 48 CHINA STORE BASED RETAILERS IN A2 MILK MARKET, BY TYPE, 2020-2029 (USD MILLION)
TABLE 49 CHINA NON-STORE RETAILERS IN A2 MILK MARKET, BY TYPE, 2020-2029 (USD MILLION)
TABLE 50 NEW ZEALAND A2 MILK MARKET, BY FORM, 2020-2029 (USD MILLION)
TABLE 51 NEW ZEALAND A2 MILK MARKET, BY NATURE, 2020-2029 (USD MILLION)
TABLE 52 NEW ZEALAND A2 MILK MARKET, BY FAT CONTENT, 2020-2029 (USD MILLION)
TABLE 53 NEW ZEALAND A2 MILK MARKET, BY PACKAGING SIZE, 2020-2029 (USD MILLION)
TABLE 54 NEW ZEALAND A2 MILK MARKET, BY PACKAGING FORM, 2020-2029 (USD MILLION)
TABLE 55 NEW ZEALAND BOTTLES IN A2 MILK MARKET, BY TYPE, 2020-2029 (USD MILLION)
TABLE 56 NEW ZEALAND A2 MILK MARKET, BY DISTRIBUTION CHANNEL, 2020-2029 (USD MILLION)
TABLE 57 NEW ZEALAND STORE BASED RETAILERS IN A2 MILK MARKET, BY TYPE, 2020-2029 (USD MILLION)
TABLE 58 NEW ZEALAND NON-STORE RETAILERS IN A2 MILK MARKET, BY TYPE, 2020-2029 (USD MILLION)
TABLE 59 AUSTRALIA A2 MILK MARKET, BY FORM, 2020-2029 (USD MILLION)
TABLE 60 AUSTRALIA A2 MILK MARKET, BY NATURE, 2020-2029 (USD MILLION)
TABLE 61 AUSTRALIA A2 MILK MARKET, BY FAT CONTENT, 2020-2029 (USD MILLION)
TABLE 62 AUSTRALIA A2 MILK MARKET, BY PACKAGING SIZE, 2020-2029 (USD MILLION)
TABLE 63 AUSTRALIA A2 MILK MARKET, BY PACKAGING FORM, 2020-2029 (USD MILLION)
TABLE 64 AUSTRALIA BOTTLES IN A2 MILK MARKET, BY TYPE, 2020-2029 (USD MILLION)
TABLE 65 AUSTRALIA A2 MILK MARKET, BY DISTRIBUTION CHANNEL, 2020-2029 (USD MILLION)
TABLE 66 AUSTRALIA STORE BASED RETAILERS IN A2 MILK MARKET, BY TYPE, 2020-2029 (USD MILLION)
TABLE 67 AUSTRALIA NON-STORE RETAILERS IN A2 MILK MARKET, BY TYPE, 2020-2029 (USD MILLION)
TABLE 68 INDIA A2 MILK MARKET, BY FORM, 2020-2029 (USD MILLION)
TABLE 69 INDIA A2 MILK MARKET, BY NATURE, 2020-2029 (USD MILLION)
TABLE 70 INDIA A2 MILK MARKET, BY FAT CONTENT, 2020-2029 (USD MILLION)
TABLE 71 INDIA A2 MILK MARKET, BY PACKAGING SIZE, 2020-2029 (USD MILLION)
TABLE 72 INDIA A2 MILK MARKET, BY PACKAGING FORM, 2020-2029 (USD MILLION)
TABLE 73 INDIA BOTTLES IN A2 MILK MARKET, BY TYPE, 2020-2029 (USD MILLION)
TABLE 74 INDIA A2 MILK MARKET, BY DISTRIBUTION CHANNEL, 2020-2029 (USD MILLION)
TABLE 75 INDIA STORE BASED RETAILERS IN A2 MILK MARKET, BY TYPE, 2020-2029 (USD MILLION)
TABLE 76 INDIA NON-STORE RETAILERS IN A2 MILK MARKET, BY TYPE, 2020-2029 (USD MILLION)
TABLE 77 MALAYSIA A2 MILK MARKET, BY FORM, 2020-2029 (USD MILLION)
TABLE 78 MALAYSIA A2 MILK MARKET, BY NATURE, 2020-2029 (USD MILLION)
TABLE 79 MALAYSIA A2 MILK MARKET, BY FAT CONTENT, 2020-2029 (USD MILLION)
TABLE 80 MALAYSIA A2 MILK MARKET, BY PACKAGING SIZE, 2020-2029 (USD MILLION)
TABLE 81 MALAYSIA A2 MILK MARKET, BY PACKAGING FORM, 2020-2029 (USD MILLION)
TABLE 82 MALAYSIA BOTTLES IN A2 MILK MARKET, BY TYPE, 2020-2029 (USD MILLION)
TABLE 83 MALAYSIA A2 MILK MARKET, BY DISTRIBUTION CHANNEL, 2020-2029 (USD MILLION)
TABLE 84 MALAYSIA STORE BASED RETAILERS IN A2 MILK MARKET, BY TYPE, 2020-2029 (USD MILLION)
TABLE 85 MALAYSIA NON-STORE RETAILERS IN A2 MILK MARKET, BY TYPE, 2020-2029 (USD MILLION)
TABLE 86 SINGAPORE A2 MILK MARKET, BY FORM, 2020-2029 (USD MILLION)
TABLE 87 SINGAPORE A2 MILK MARKET, BY NATURE, 2020-2029 (USD MILLION)
TABLE 88 SINGAPORE A2 MILK MARKET, BY FAT CONTENT, 2020-2029 (USD MILLION)
TABLE 89 SINGAPORE A2 MILK MARKET, BY PACKAGING SIZE, 2020-2029 (USD MILLION)
TABLE 90 SINGAPORE A2 MILK MARKET, BY PACKAGING FORM, 2020-2029 (USD MILLION)
TABLE 91 SINGAPORE BOTTLES IN A2 MILK MARKET, BY TYPE, 2020-2029 (USD MILLION)
TABLE 92 SINGAPORE A2 MILK MARKET, BY DISTRIBUTION CHANNEL, 2020-2029 (USD MILLION)
TABLE 93 SINGAPORE STORE BASED RETAILERS IN A2 MILK MARKET, BY TYPE, 2020-2029 (USD MILLION)
TABLE 94 SINGAPORE NON-STORE RETAILERS IN A2 MILK MARKET, BY TYPE, 2020-2029 (USD MILLION)
TABLE 95 TABLE 41 SOUTH KOREA A2 MILK MARKET, BY FORM, 2020-2029 (USD MILLION)
TABLE 96 SOUTH KOREA A2 MILK MARKET, BY NATURE, 2020-2029 (USD MILLION)
TABLE 97 SOUTH KOREA A2 MILK MARKET, BY FAT CONTENT, 2020-2029 (USD MILLION)
TABLE 98 SOUTH KOREA A2 MILK MARKET, BY PACKAGING SIZE, 2020-2029 (USD MILLION)
TABLE 99 SOUTH KOREA A2 MILK MARKET, BY PACKAGING FORM, 2020-2029 (USD MILLION)
TABLE 100 SOUTH KOREA BOTTLES IN A2 MILK MARKET, BY TYPE, 2020-2029 (USD MILLION)
TABLE 101 SOUTH KOREA A2 MILK MARKET, BY DISTRIBUTION CHANNEL, 2020-2029 (USD MILLION)
TABLE 102 SOUTH KOREA STORE BASED RETAILERS IN A2 MILK MARKET, BY TYPE, 2020-2029 (USD MILLION)
TABLE 103 SOUTH KOREA NON-STORE RETAILERS IN A2 MILK MARKET, BY TYPE, 2020-2029 (USD MILLION)
TABLE 104 INDONESIA A2 MILK MARKET, BY FORM, 2020-2029 (USD MILLION)
TABLE 105 INDONESIA A2 MILK MARKET, BY NATURE, 2020-2029 (USD MILLION)
TABLE 106 INDONESIA A2 MILK MARKET, BY FAT CONTENT, 2020-2029 (USD MILLION)
TABLE 107 INDONESIA A2 MILK MARKET, BY PACKAGING SIZE, 2020-2029 (USD MILLION)
TABLE 108 INDONESIA A2 MILK MARKET, BY PACKAGING FORM, 2020-2029 (USD MILLION)
TABLE 109 INDONESIA BOTTLES IN A2 MILK MARKET, BY TYPE, 2020-2029 (USD MILLION)
TABLE 110 INDONESIA A2 MILK MARKET, BY DISTRIBUTION CHANNEL, 2020-2029 (USD MILLION)
TABLE 111 INDONESIA STORE BASED RETAILERS IN A2 MILK MARKET, BY TYPE, 2020-2029 (USD MILLION)
TABLE 112 INDONESIA NON-STORE RETAILERS IN A2 MILK MARKET, BY TYPE, 2020-2029 (USD MILLION)
TABLE 113 JAPAN A2 MILK MARKET, BY FORM, 2020-2029 (USD MILLION)
TABLE 114 JAPAN A2 MILK MARKET, BY NATURE, 2020-2029 (USD MILLION)
TABLE 115 JAPAN A2 MILK MARKET, BY FAT CONTENT, 2020-2029 (USD MILLION)
TABLE 116 JAPAN A2 MILK MARKET, BY PACKAGING SIZE, 2020-2029 (USD MILLION)
TABLE 117 JAPAN A2 MILK MARKET, BY PACKAGING FORM, 2020-2029 (USD MILLION)
TABLE 118 JAPAN BOTTLES IN A2 MILK MARKET, BY TYPE, 2020-2029 (USD MILLION)
TABLE 119 JAPAN A2 MILK MARKET, BY DISTRIBUTION CHANNEL, 2020-2029 (USD MILLION)
TABLE 120 JAPAN STORE BASED RETAILERS IN A2 MILK MARKET, BY TYPE, 2020-2029 (USD MILLION)
TABLE 121 JAPAN NON-STORE RETAILERS IN A2 MILK MARKET, BY TYPE, 2020-2029 (USD MILLION)
TABLE 122 PHILIPPINES A2 MILK MARKET, BY FORM, 2020-2029 (USD MILLION)
TABLE 123 PHILIPPINES A2 MILK MARKET, BY NATURE, 2020-2029 (USD MILLION)
TABLE 124 PHILIPPINES A2 MILK MARKET, BY FAT CONTENT, 2020-2029 (USD MILLION)
TABLE 125 PHILIPPINES A2 MILK MARKET, BY PACKAGING SIZE, 2020-2029 (USD MILLION)
TABLE 126 PHILIPPINES A2 MILK MARKET, BY PACKAGING FORM, 2020-2029 (USD MILLION)
TABLE 127 PHILIPPINES BOTTLES IN A2 MILK MARKET, BY TYPE, 2020-2029 (USD MILLION)
TABLE 128 PHILIPPINES A2 MILK MARKET, BY DISTRIBUTION CHANNEL, 2020-2029 (USD MILLION)
TABLE 129 PHILIPPINES STORE BASED RETAILERS IN A2 MILK MARKET, BY TYPE, 2020-2029 (USD MILLION)
TABLE 130 PHILIPPINES NON-STORE RETAILERS IN A2 MILK MARKET, BY TYPE, 2020-2029 (USD MILLION)
TABLE 131 THAILAND A2 MILK MARKET, BY FORM, 2020-2029 (USD MILLION)
TABLE 132 THAILAND A2 MILK MARKET, BY NATURE, 2020-2029 (USD MILLION)
TABLE 133 THAILAND A2 MILK MARKET, BY FAT CONTENT, 2020-2029 (USD MILLION)
TABLE 134 THAILAND A2 MILK MARKET, BY PACKAGING SIZE, 2020-2029 (USD MILLION)
TABLE 135 THAILAND A2 MILK MARKET, BY PACKAGING FORM, 2020-2029 (USD MILLION)
TABLE 136 THAILAND BOTTLES IN A2 MILK MARKET, BY TYPE, 2020-2029 (USD MILLION)
TABLE 137 THAILAND A2 MILK MARKET, BY DISTRIBUTION CHANNEL, 2020-2029 (USD MILLION)
TABLE 138 THAILAND STORE BASED RETAILERS IN A2 MILK MARKET, BY TYPE, 2020-2029 (USD MILLION)
TABLE 139 THAILAND NON-STORE RETAILERS IN A2 MILK MARKET, BY TYPE, 2020-2029 (USD MILLION)
TABLE 140 REST OF ASIA-PACIFIC A2 MILK MARKET, BY FORM, 2020-2029 (USD MILLION)
List of Figure
FIGURE 1 ASIA PACIFIC A2 MILK MARKET: SEGMENTATION
FIGURE 2 ASIA PACIFIC A2 MILK MARKET: DATA TRIANGULATION
FIGURE 3 ASIA PACIFIC A2 MILK MARKET: DROC ANALYSIS
FIGURE 4 ASIA PACIFIC A2 MILK MARKET: ASIA PACIFIC VS REGIONAL MARKET ANALYSIS
FIGURE 5 ASIA PACIFIC A2 MILK MARKET: COMPANY RESEARCH ANALYSIS
FIGURE 6 ASIA PACIFIC A2 MILK MARKET: INTERVIEW DEMOGRAPHICS
FIGURE 7 ASIA PACIFIC A2 MILK MARKET: DBMR MARKET POSITION GRID
FIGURE 8 ASIA PACIFIC A2 MILK MARKET: VENDOR SHARE ANALYSIS
FIGURE 9 ASIA PACIFIC A2 MILK MARKET: SEGMENTATION
FIGURE 10 INCREASING APPLICATION OF A2 MILK IN THE FOOD INDUSTRY IS EXPECTED TO DRIVE THE GROWTH OF THE ASIA PACIFIC A2 MILK MARKET IN THE FORECAST PERIOD
FIGURE 11 LIQUID SEGMENT IS EXPECTED TO ACCOUNT FOR THE LARGEST SHARE OF THE ASIA PACIFIC A2 MILK MARKET IN 2022 & 2029
FIGURE 12 SUPPLY CHAIN OF THE ASIA PACIFIC A2 MILK MARKET
FIGURE 13 VALUE CHAIN OF A2 MILK
FIGURE 14 DRIVERS, RESTRAINTS, OPPORTUNITIES, AND CHALLENGES OF THE ASIA PACIFIC A2 MILK MARKET
FIGURE 15 ASIA PACIFIC A2 MILK MARKET: BY FORM, 2021
FIGURE 16 ASIA PACIFIC A2 MILK MARKET: BY NATURE, 2021
FIGURE 17 ASIA PACIFIC A2 MILK MARKET: BY FAT CONTENT, 2021
FIGURE 18 ASIA PACIFIC A2 MILK MARKET: BY PACKAGING SIZE, 2021
FIGURE 19 ASIA PACIFIC A2 MILK MARKET: BY PACKAGING FORM, 2021
FIGURE 20 ASIA PACIFIC A2 MILK MARKET: BY DISTRIBUTION CHANNEL, 2021
FIGURE 21 ASIA-PACIFIC A2 MILK MARKET: SNAPSHOT (2021)
FIGURE 22 ASIA-PACIFIC A2 MILK MARKET: BY COUNTRY (2021)
FIGURE 23 ASIA-PACIFIC A2 MILK MARKET: BY COUNTRY (2022 & 2029)
FIGURE 24 ASIA-PACIFIC A2 MILK MARKET: BY COUNTRY (2021 & 2029)
FIGURE 25 ASIA-PACIFIC A2 MILK MARKET: BY FORM (2022 & 2029)
FIGURE 26 ASIA PACIFIC A2 MILK MARKET: COMPANY SHARE 2021 (%)
Asia Pacific A2 Milk Market, Supply Chain Analysis and Ecosystem Framework
To support market growth and help clients navigate the impact of geopolitical shifts, DBMR has integrated in-depth supply chain analysis into its Asia Pacific A2 Milk Market research reports. This addition empowers clients to respond effectively to global changes affecting their industries. The supply chain analysis section includes detailed insights such as Asia Pacific A2 Milk Market consumption and production by country, price trend analysis, the impact of tariffs and geopolitical developments, and import and export trends by country and HSN code. It also highlights major suppliers with data on production capacity and company profiles, as well as key importers and exporters. In addition to research, DBMR offers specialized supply chain consulting services backed by over a decade of experience, providing solutions like supplier discovery, supplier risk assessment, price trend analysis, impact evaluation of inflation and trade route changes, and comprehensive market trend analysis.
Data collection and base year analysis are done using data collection modules with large sample sizes. The stage includes obtaining market information or related data through various sources and strategies. It includes examining and planning all the data acquired from the past in advance. It likewise envelops the examination of information inconsistencies seen across different information sources. The market data is analysed and estimated using market statistical and coherent models. Also, market share analysis and key trend analysis are the major success factors in the market report. To know more, please request an analyst call or drop down your inquiry.
The key research methodology used by DBMR research team is data triangulation which involves data mining, analysis of the impact of data variables on the market and primary (industry expert) validation. Data models include Vendor Positioning Grid, Market Time Line Analysis, Market Overview and Guide, Company Positioning Grid, Patent Analysis, Pricing Analysis, Company Market Share Analysis, Standards of Measurement, Global versus Regional and Vendor Share Analysis. To know more about the research methodology, drop in an inquiry to speak to our industry experts.
Data Bridge Market Research is a leader in advanced formative research. We take pride in servicing our existing and new customers with data and analysis that match and suits their goal. The report can be customized to include price trend analysis of target brands understanding the market for additional countries (ask for the list of countries), clinical trial results data, literature review, refurbished market and product base analysis. Market analysis of target competitors can be analyzed from technology-based analysis to market portfolio strategies. We can add as many competitors that you require data about in the format and data style you are looking for. Our team of analysts can also provide you data in crude raw excel files pivot tables (Fact book) or can assist you in creating presentations from the data sets available in the report.


