
Asia-Pacific Accounts Payable Automation Market Analysis and Size
Account payable is important to ensure payment of bills on a timely basis, which improves the company's credit rating. This increasing demand for account payable bill generation is due to the timely payment of invoices, which ensures an uninterrupted flow of supplies and services. Timely payment avoids overdue payments and penalties. The Asia-Pacific accounts payable automation market is growing rapidly due to AL, ML, and cloud services. The companies are even launching new software to gain a larger market share.
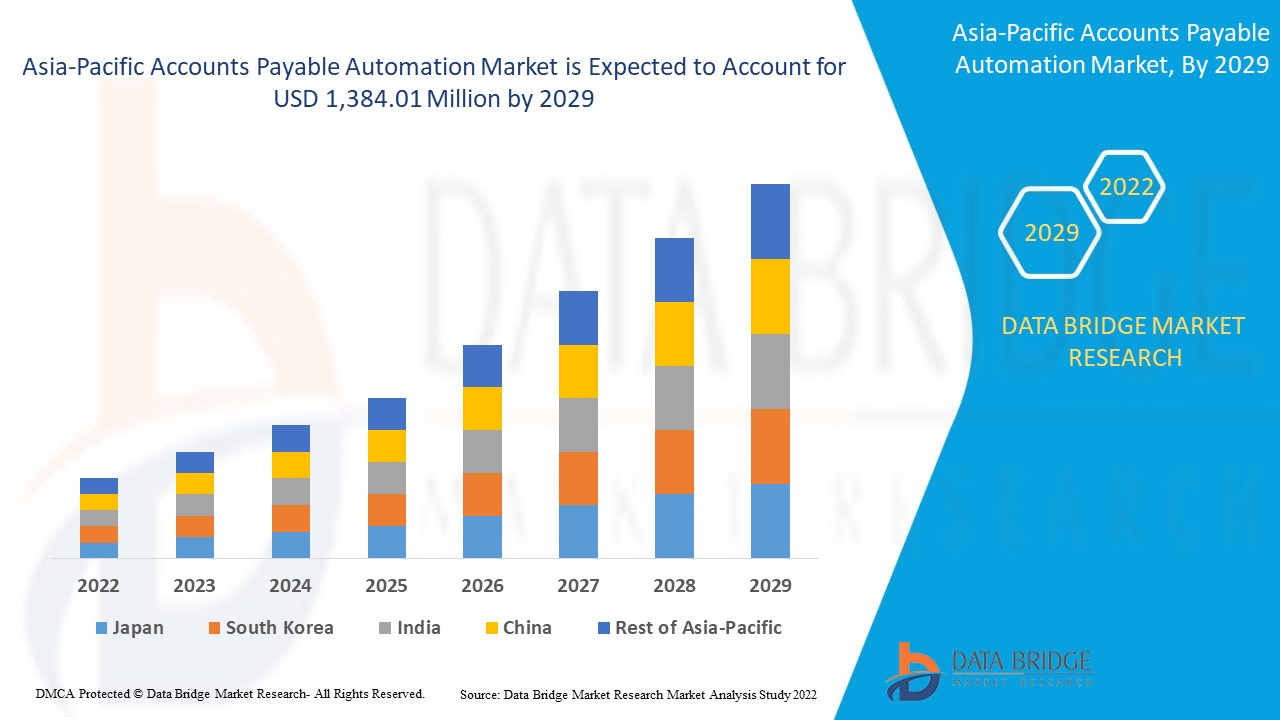
Data Bridge Market Research analyses that the accounts payable automation market are expected to reach USD 1,384.01 million by 2029, at a CAGR of 10.3% from 2022 to 2029. "Solutions" accounts for the most prominent modules mode segment.
|
Report Metric |
Details |
|
Forecast Period |
2022 to 2029 |
|
Base Year |
2021 |
|
Historic Years |
2020 (Customizable to 2019 - 2014) |
|
Quantitative Units |
USD Million in 2022 |
|
Segments Covered |
By Components (Solutions and Services), Organization Size (Large Enterprise, Small and Medium Enterprise), Process (Invoice Capture, Invoice Approval, Payment Authorization, Payment Execution, and Export), Deployment Mode (Cloud and On-Premise), Vertical (Manufacturing, Consumer Goods and Retail, Energy and Utilities, Healthcare, Banking, Financial Services, and Insurance, IT and Telecom, Government, Automotive, and Others) |
|
Countries Covered |
China, India, Japan, South Korea, Singapore, Australia, Malaysia, Thailand, Indonesia, Philippines, and the Rest of Asia-Pacific |
|
Market Players Covered |
Oracle Corporation, AvidXchange, SAP SE, FIS., FLEETCOR TECHNOLOGIES, INC., Kofax Inc., Coupa Software Inc., Zoho Corporation Pvt. Ltd., Bottomline Technologies, Inc., MineralTree, Zycus Inc., FINANCIAL FORCE, FreshBooks, Tipalti Inc., and Comarch SA. |
Market Definition
Accounts Payable (AP) Automation is the act of processing invoices in a digital format and through a touchless process using an AP automation solution. In an ideal situation, 100% of invoices a company receives can be processed automatically without human intervention. AP automation is more than just Optical Character Recognition (OCR). It is automation across the entire AP process, from data capture using OCR or digital invoice formats (such as EDI and e-invoices) through AP workflow, such as routing, coding, reviewing, and approving invoices and automatically matching them to Purchase Orders (PO), to the seamless integration with your enterprise resource planning system.
Asia-Pacific Accounts Payable Automation Market Dynamics
This section deals with understanding the market drivers, advantages, opportunities, restraints, and challenges. All of this is discussed in detail below:
Drivers
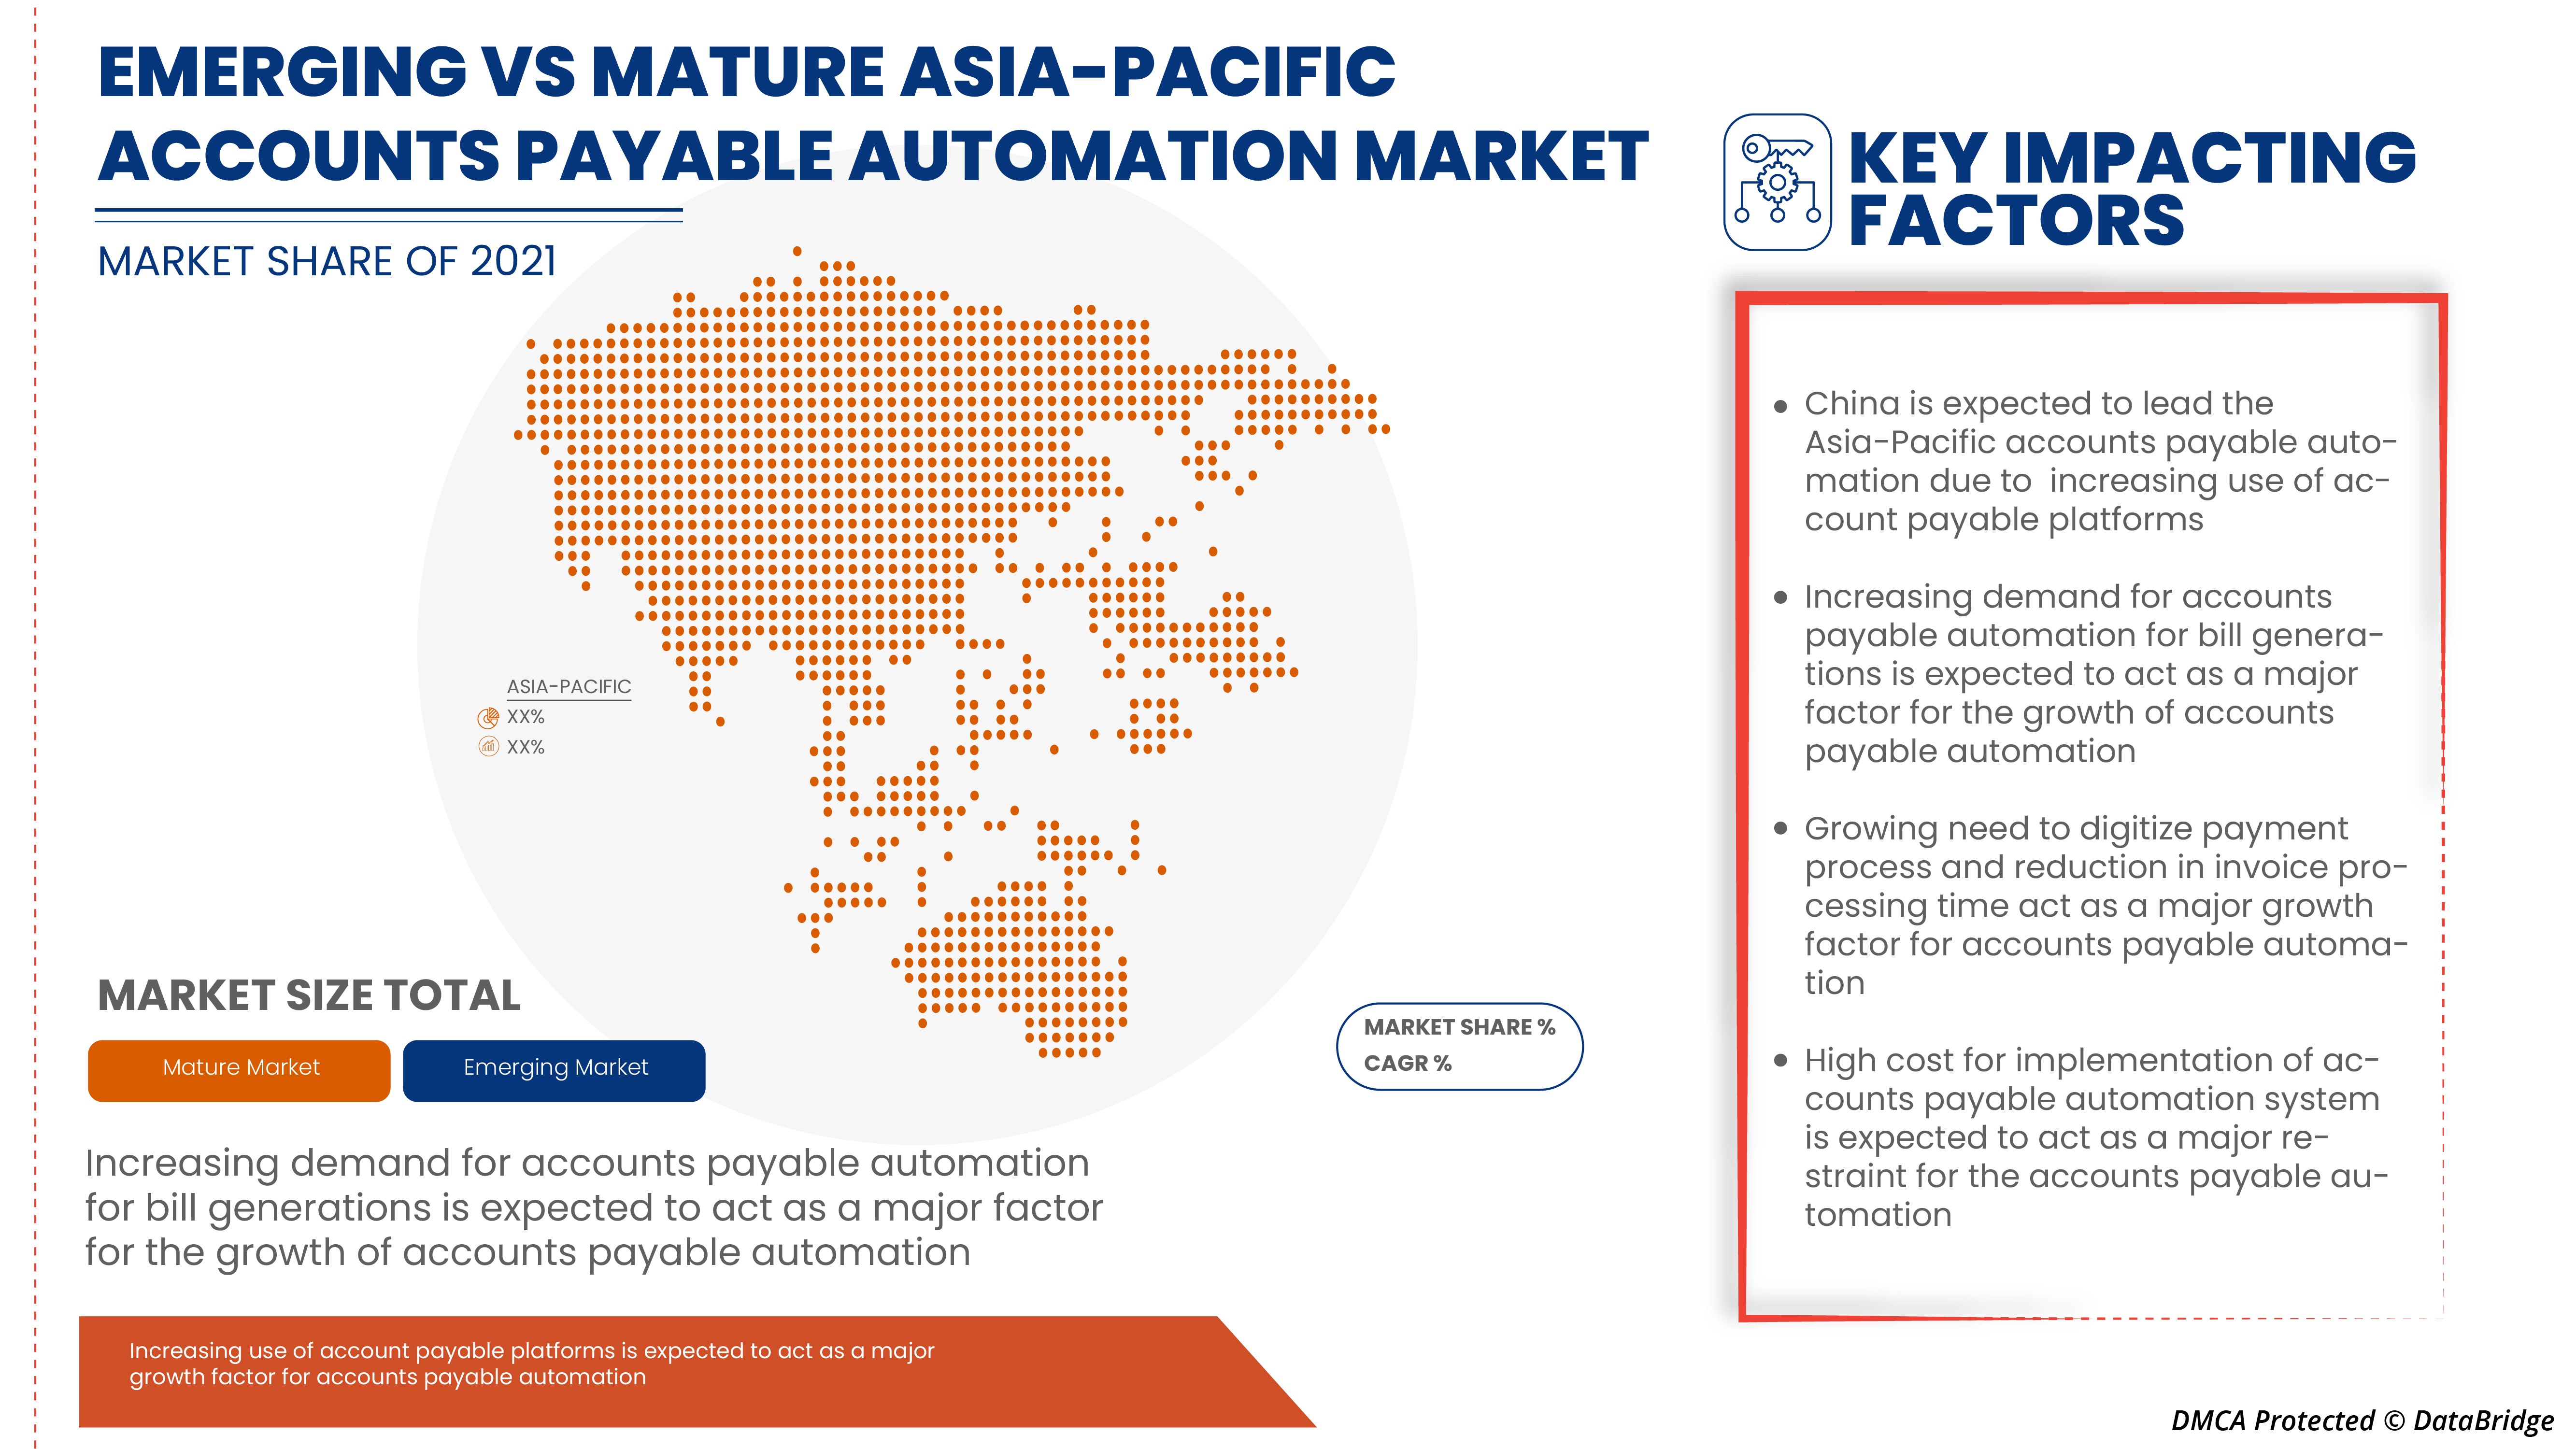
- Growth in the need to digitize the payment process and reduction in invoice processing time
The growth of digitalization is revolutionizing the interaction between customers and businesses and building a new platform for the interaction of ideas. Digitalization is the process of converting information into digital information by using various data and software. Since 2009 there has been a transformation of financial institutions towards digitalization by integrating digital technologies. Digital transformation has provided automation, better services, and efficiency to financial processes. Even the customers are inclined more towards digital platforms for the transaction of their financial assets; this has even boosted up more during this pandemic. The increasing need to digitize the payment process and reduce invoice time is thus leading to the growth of the global accounts payable automation market.
- Increasing demand for account payable automation for bill generation
Account payable is important to ensure payment of bills on a timely basis, which improves the company's credit rating. This increasing demand for account payable bill generation due to the timely payment of invoices ensures an uninterrupted flow of supplies and services. Timely payment avoids overdue payments, penalties, and another late fees among organizations, thus creating huge growth for the global account payable automation market.
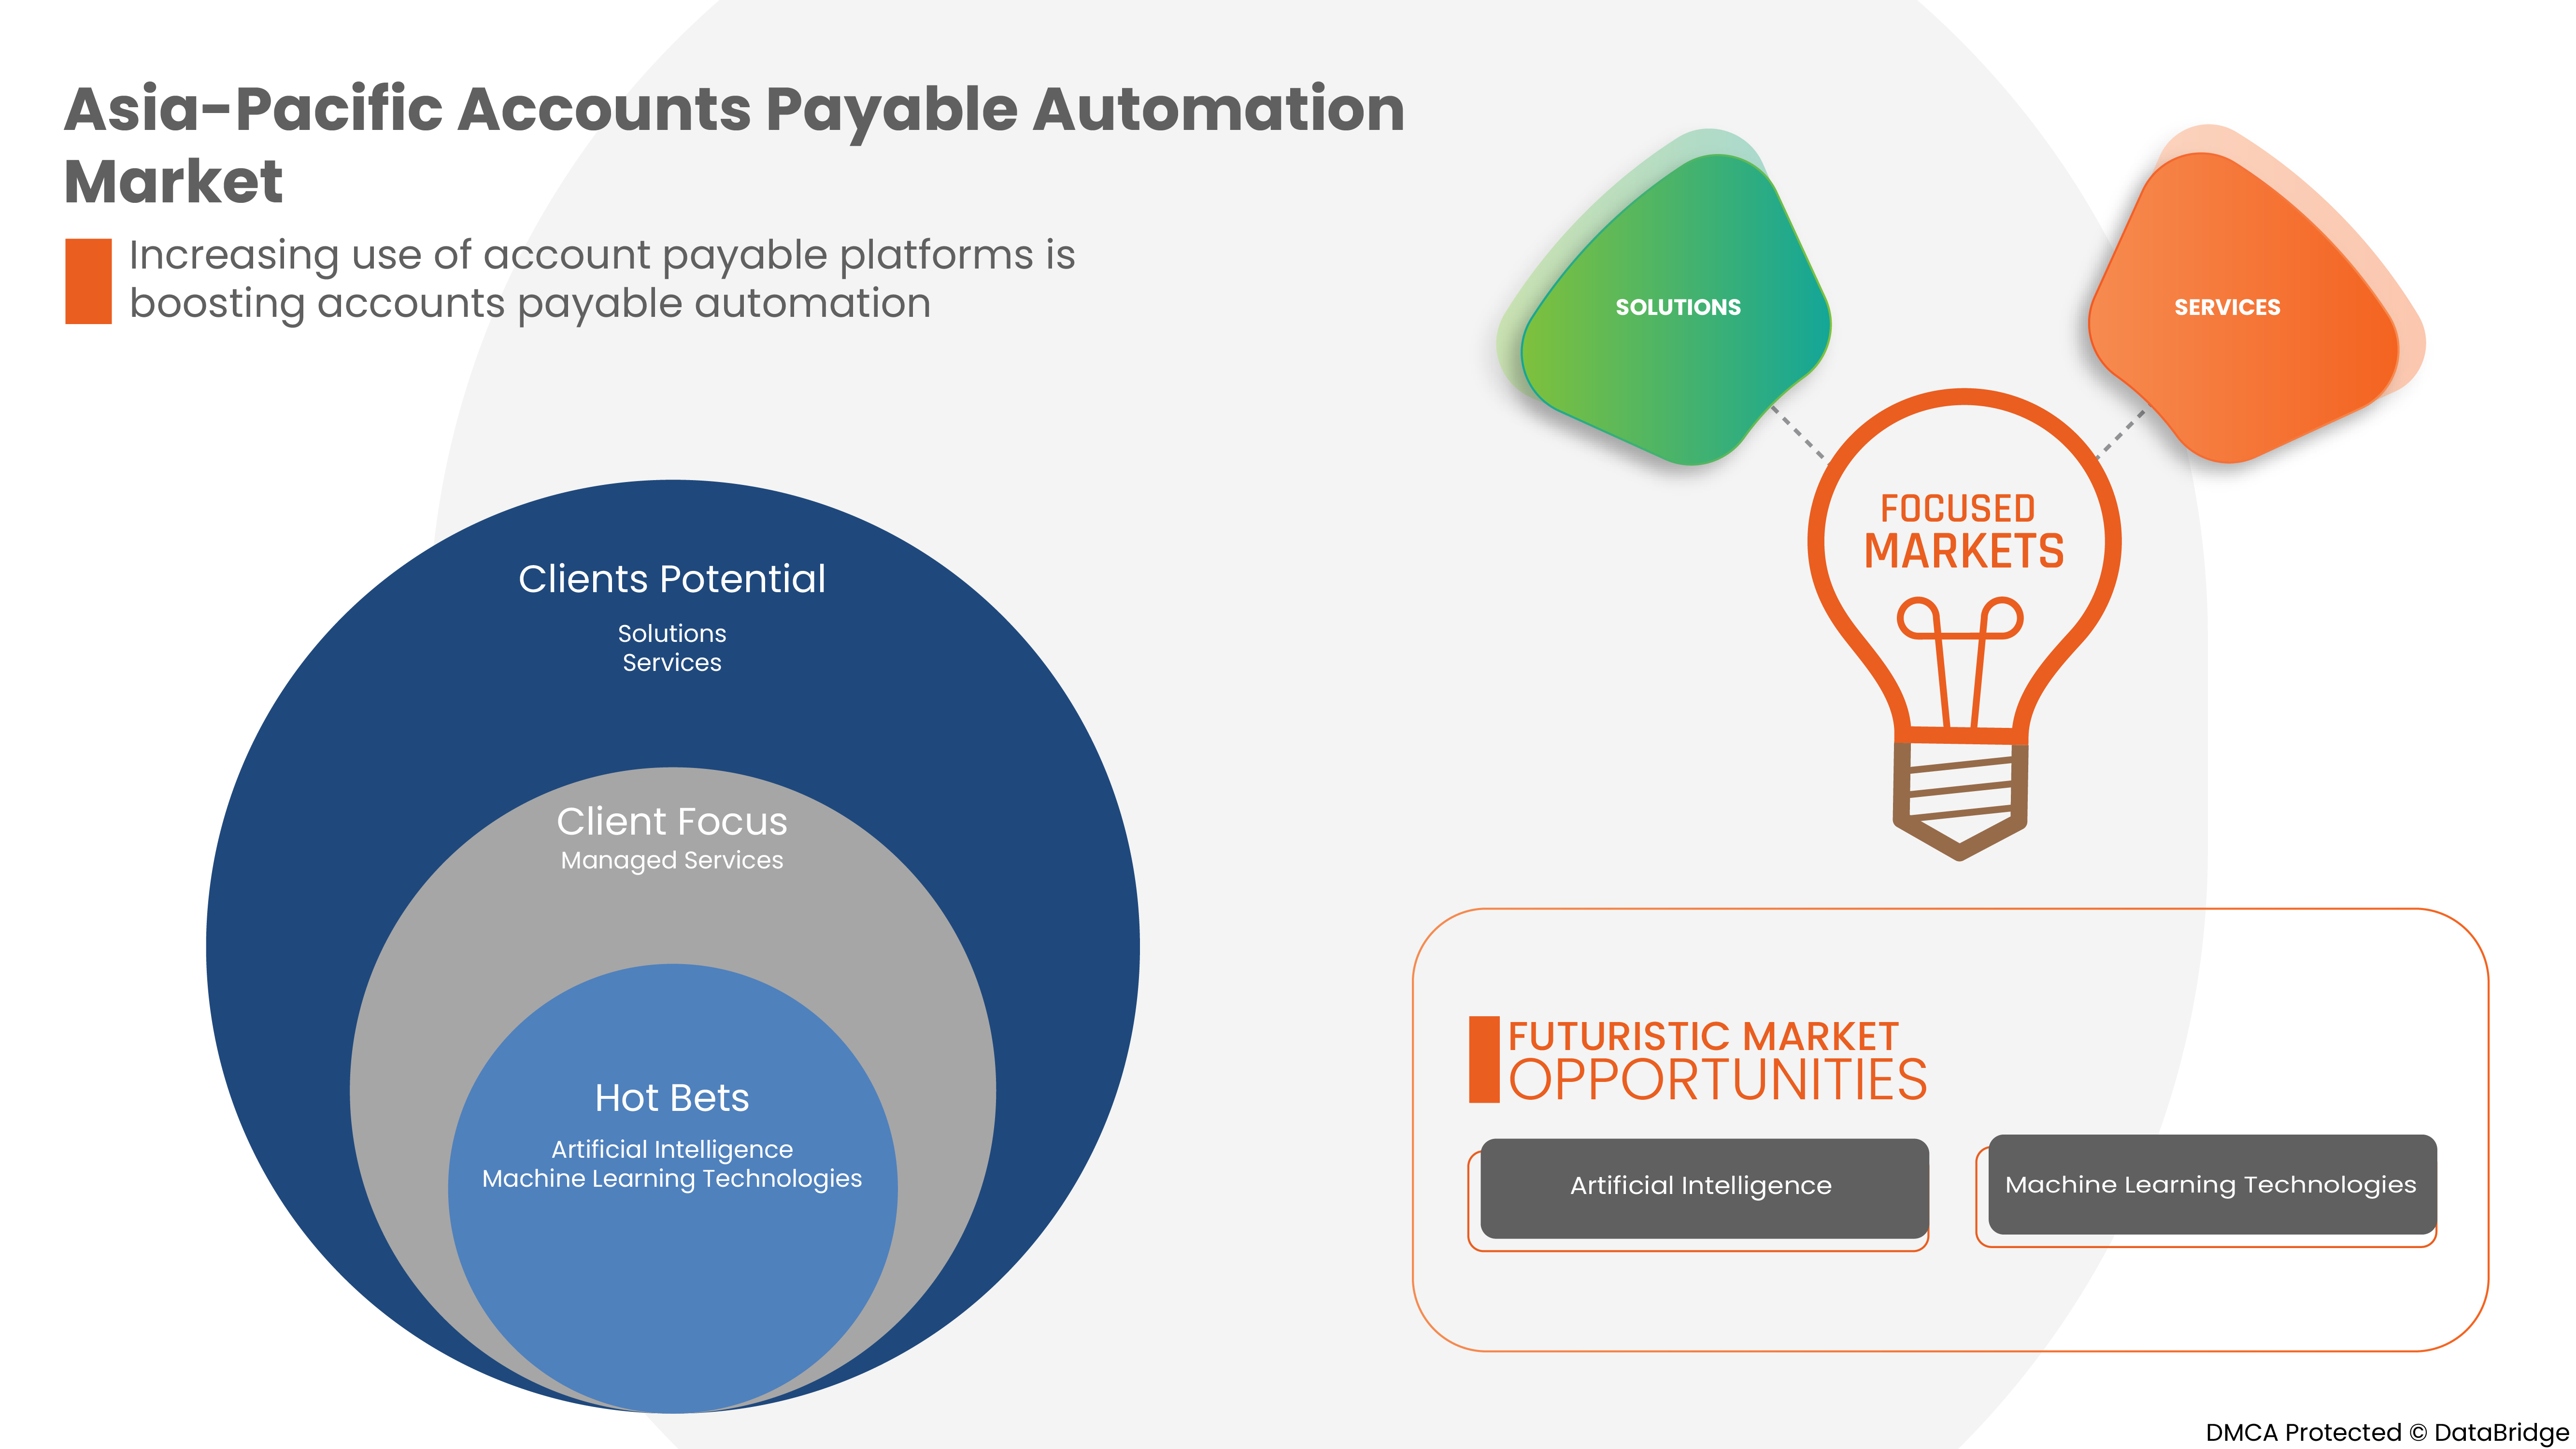
- Increase in the use of account payable platforms
Individual companies are getting more accustomed to account payable platforms for making transactions for their basic usage, such as gaining basic information, buying goods, or using it as a platform for their business.
Restraints/Challenges
- Higher cost for implementation of account payable automation systems
Generally, the cost of account payable automation depends on the specific needs and application. However, purchasing and implementing automation software in various systems for streamlining the transaction processes can seem daunting and expensive. Hence the higher cost can raise an issue in some companies, where the budget allocated for the system set up by the company remains unvaried.
- Rise in complexities of payable automation systems in large enterprises
Payable automation systems and software have been implemented across the globe to benefit from decreasing the necessity for human staff and to perform repetitive tasks by implementing automated machine processes instead. But the higher the system's complexity, the greater the risk that a system failure would seriously affect payable-related functioning. Many critical system failures, especially involving the assembly lines, would require restoring manual procedures for managing data and payment information of different clients. Although in most companies, it is found that resources are a limiting factor for development. A traditional way to manage the bills and coordinate schedules of payments to the suppliers' connections manually.
Post COVID-19 Impact on Asia-Pacific Accounts Payable Automation Market
The confinement and lockdown period during the COVID-19 crisis has shown the importance of good, reliable internet connectivity in a large industry. A high-speed connection in the large industry has allowed efficient teleworking, maintaining entertainment habits, and keeping close contacts. Data traffic in all networks has increased significantly during the pandemic period. COVID-19 has increased the demand for data integration in the market. Fixed broadband networks have gained immense popularity for keeping the world connected. Traffic grew 30-40% overnight, driven primarily by working from large industries (video conferencing and collaboration, VPNs), learning from large industries (video conferencing and collaboration, e-learning platforms), and entertainment (online gaming, video streaming, social media). Moreover, limited supply and shortage of software have significantly affected data integration in the market. The flow of new equipment, such as computers, servers, switches, and Customer Premise Equipment (CPE), has either been fully stopped or delayed, with lead times of up to 12 months for different items.
Manufacturers are making various strategic decisions to bounce back post-COVID-19. The players are conducting multiple research and development activities to improve the technology involved in data integration. With this, the companies will bring advanced data integration to the market.
Recent Development
- In January 2022, SAP SE partnered with Icertis to deliver enterprise contract intelligence. The partnership took place to expand solution portfolio of contract management. The partnership will leverage the company's technology to deliver more valuable services to their customer base
- In November 2021, Oracle Corporation launched an oracle fusion ERP analytics instrument for financial insights. This solution was designed to enable data process easier. This solution was a reliable solution for large-sized and mid-sized businesses, thereby helping the company to expand its market
Asia-Pacific Accounts Payable Automation Market Scope
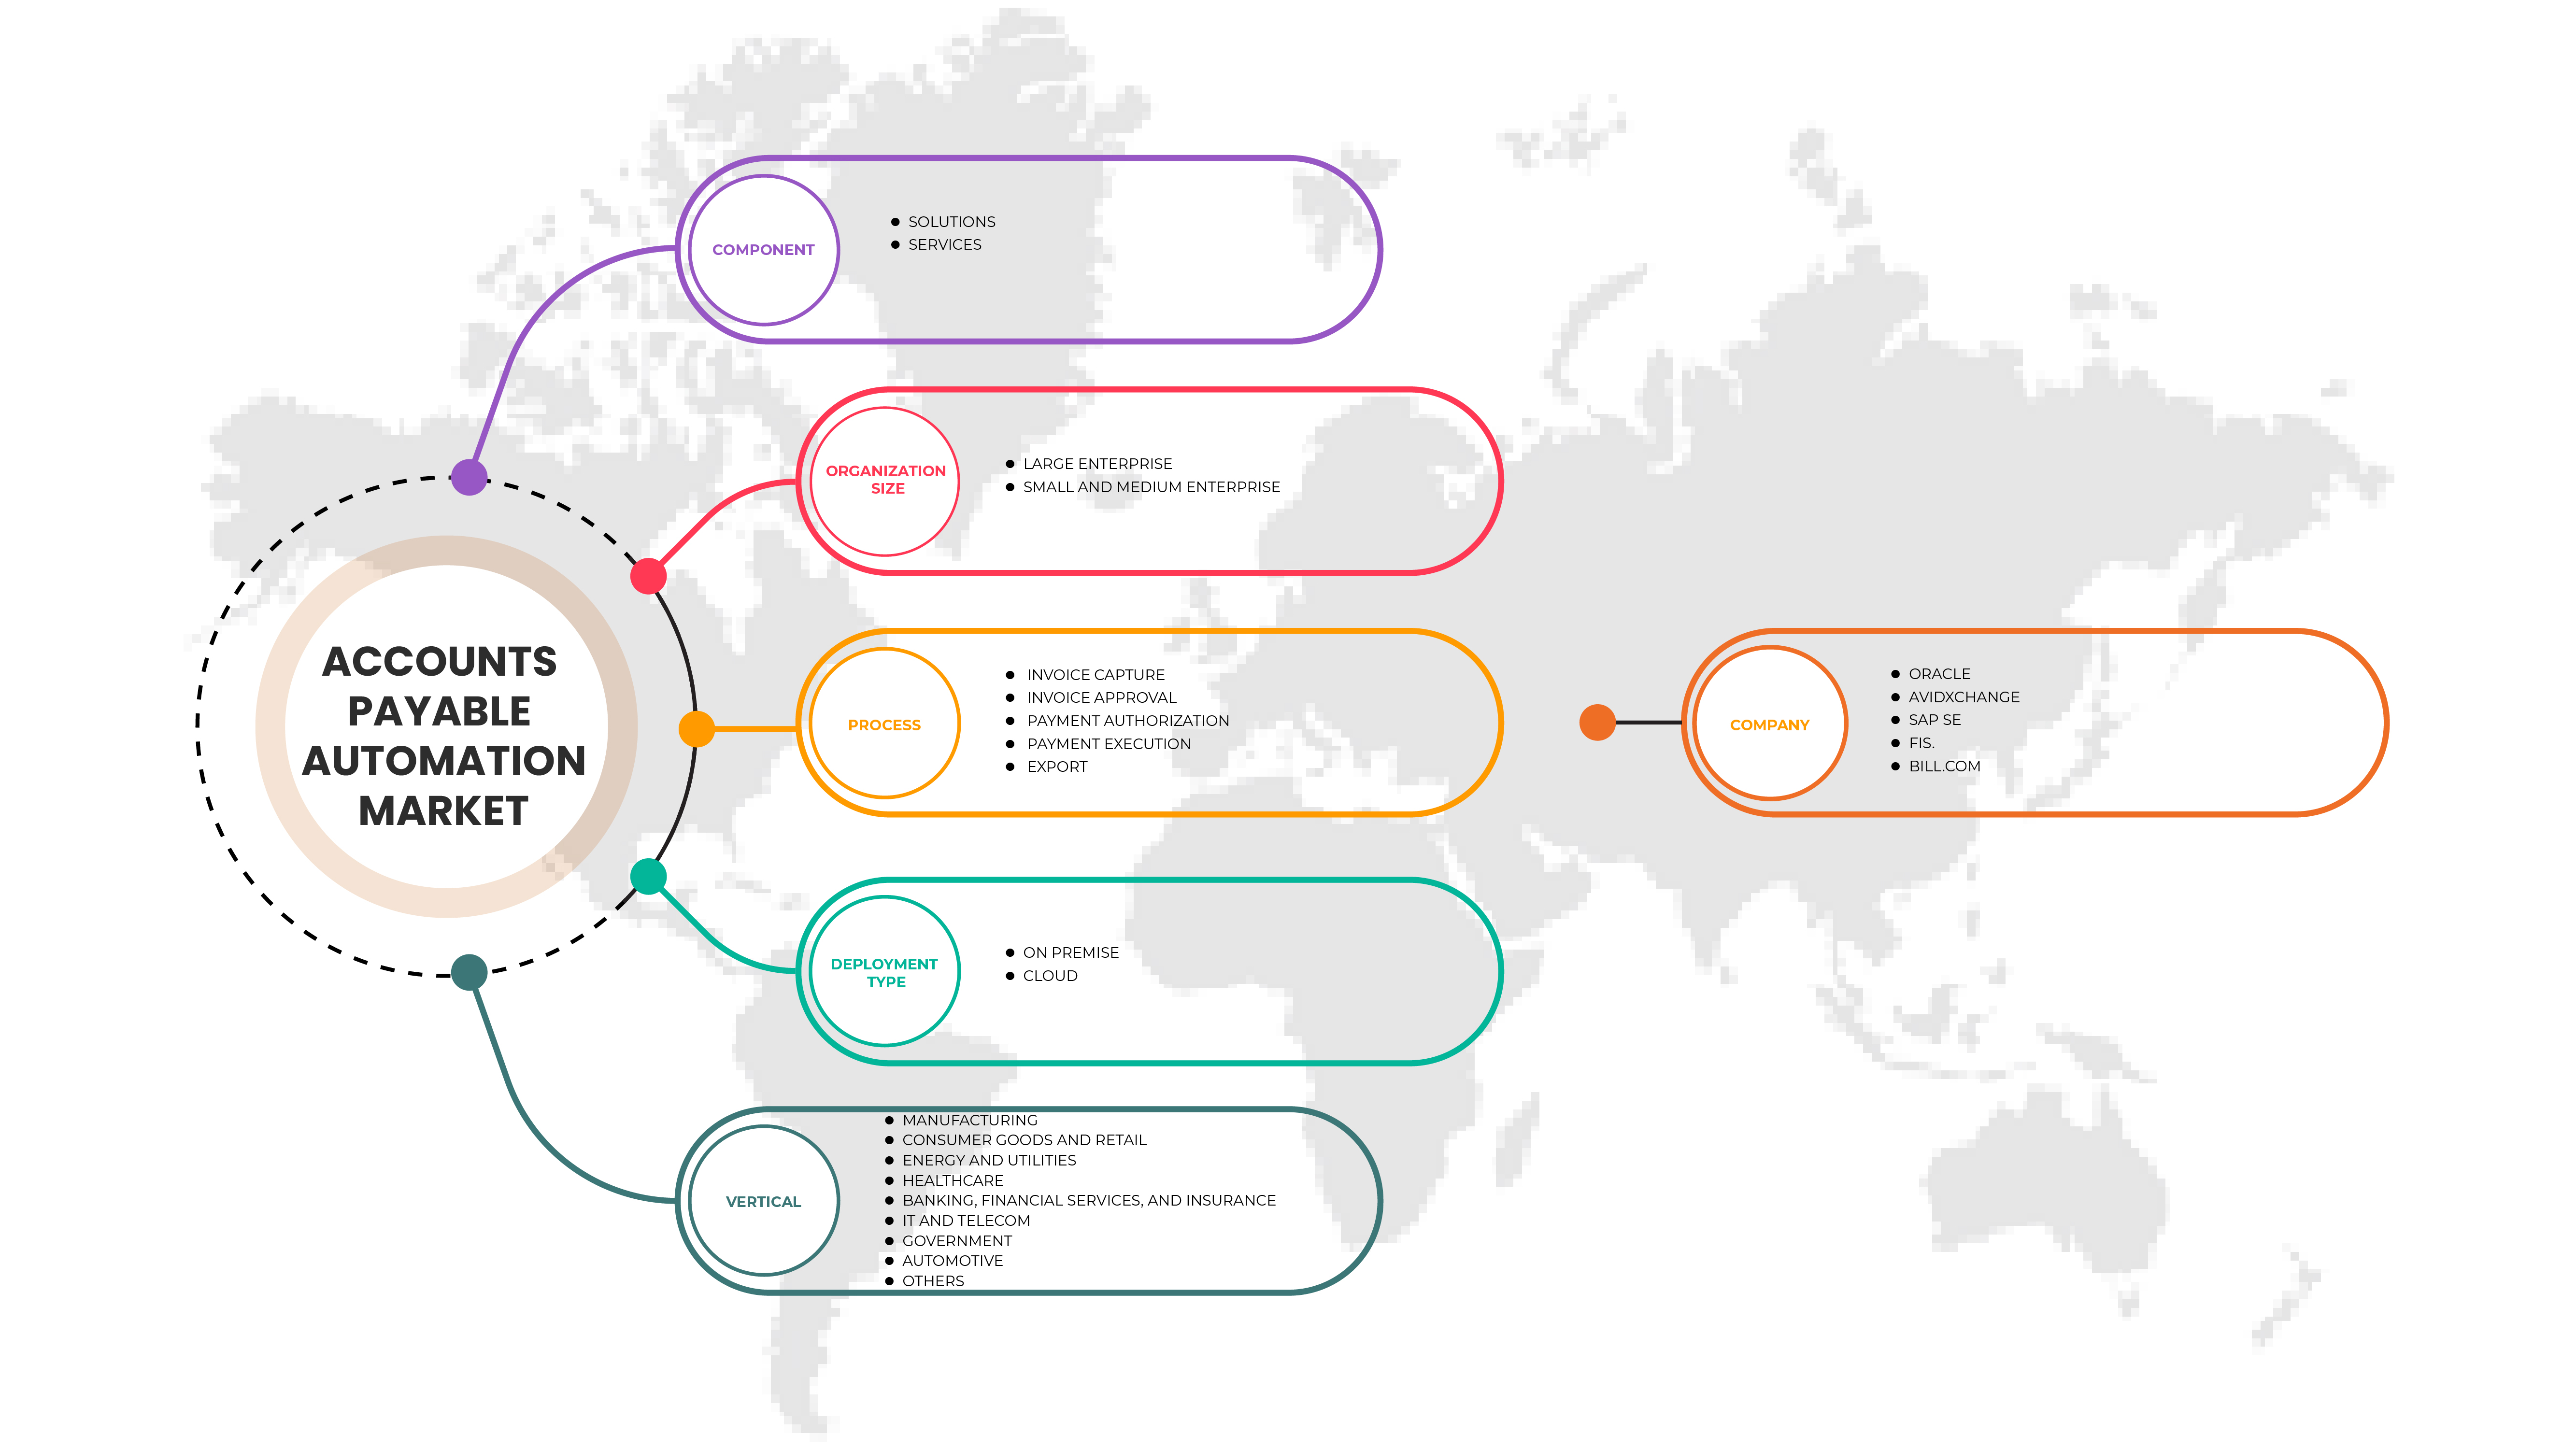
The Asia-Pacific accounts payable automation market is segmented on component, organization size, deployment mode, vertical, process. The growth amongst these segments will help you analyze meager growth segments in the industries and provide the users with a valuable market overview and market insights to help them make strategic decisions for identifying core market applications.
By Component
- Solutions
- Services
On the basis of component, the Asia-Pacific accounts payable automation market is segmented into solutions and services.
By Organization Size
- Large Enterprise
- Small and Medium Enterprise
On the basis of organization size, the Asia-Pacific accounts payable automation market has been segmented into large enterprise and small and medium enterprise.
By Process
- Invoice Capture,
- Invoice Approval
- Payment Authorization
- Payment Execution
- Export
On the basis of process, the Asia-Pacific accounts payable automation market has been segmented into invoice capture, invoice approval, payment authorization, payment execution, and export.
By Deployment Mode
- Cloud
- On-Premise
On the basis of deployment mode, the Asia-Pacific accounts payable automation market has been segmented into cloud and on-premise.
By Vertical
- Manufacturing
- Consumer Goods And Retail
- Energy And Utilities
- Healthcare
- Banking, Financial Services, And Insurance
- IT and Telecom
- Government
- Automotive
- Others
On the basis of vertical, the Asia-Pacific accounts payable automation market has been segmented into manufacturing, consumer goods and retail, energy and utilities, healthcare, banking, financial services, and insurance, IT and telecom, government, automotive, and others.
Asia-Pacific Accounts Payable Automation Market Regional Analysis/Insights
The Asia-Pacific accounts payable automation market is analyzed, and market size insights and trends are provided by country, organization size, deployment mode, process, vertical, and component, as referenced above.
The countries covered in the Asia-Pacific accounts payable automation market report are China, India, Japan, South Korea, Singapore, Australia, Malaysia, Thailand, Indonesia, Philippines, and the Rest of Asia-Pacific.
China is expected to dominate the Asia-Pacific accounts payable automation market as the country is witnessing increasing Hybrid automation has been in use lately due to its ability to connect applications, data files, and business partners across cloud and on-premises systems and also accounts payable automation compliance program is a set of regulations or rules that a financial institution, companies such as large enterprises, small enterprises, and medium enterprises must follow to prevent data loss and the growth of the country in the Asia-Pacific accounts payable automation market.
The country section of the report also provides individual market-impacting factors and market regulation changes that impact the market's current and future trends. Data points like downstream and upstream value chain analysis, technological trends, porter's five forces analysis, and case studies are some of the pointers used to forecast the market scenario for individual countries. Also, the presence and availability of Global brands and their challenges faced due to large or scarce competition from local and domestic brands, the impact of domestic tariffs, and trade routes are considered while providing forecast analysis of the country data.
Competitive Landscape and Asia-Pacific Accounts Payable Automation Market Share Analysis
The Asia-Pacific accounts payable automation market competitive landscape provides details on a competitor. Details include company overview, company financials, revenue generated, market potential, investment in research and development, new market initiatives, Global presence, production sites and facilities, production capacities, company strengths and weaknesses, product launch, product width and breadth, and application dominance. The above data points are only related to the companies focusing on the Asia-Pacific accounts payable automation market.
Some of the major players operating in the Asia-Pacific accounts payable automation market are:
- Oracle Corporation
- AvidXchange
- SAP SE
- FIS.
- FLEETCOR TECHNOLOGIES, INC.
- Kofax Inc.
- Coupa Software Inc.
- Zoho Corporation Pvt. Ltd.
- Bottomline Technologies, Inc.
- MineralTree
- Zycus Inc.
- FINANCIAL FORCE
- FreshBooks
- Tipalti Inc.
- Comarch SA.
SKU-

- Interactive Data Analysis Dashboard
- Company Analysis Dashboard for high growth potential opportunities
- Research Analyst Access for customization & queries
- Competitor Analysis with Interactive dashboard
- Latest News, Updates & Trend analysis
- Harness the Power of Benchmark Analysis for Comprehensive Competitor Tracking
Table of Content
1 INTRODUCTION
1.1 OBJECTIVES OF THE STUDY
1.2 MARKET DEFINITION
1.3 OVERVIEW OF ASIA PACIFIC ACCOUNTS PAYABLE AUTOMATION MARKET
1.4 CURRENCY AND PRICING
1.5 LIMITATIONS
1.6 MARKETS COVERED
2 MARKET SEGMENTATION
2.1 MARKETS COVERED
2.2 YEARS CONSIDERED FOR THE STUDY
2.3 GEOGRAPHIC SCOPE
2.4 DBMR TRIPOD DATA VALIDATION MODEL
2.5 PRIMARY INTERVIEWS WITH KEY OPINION LEADERS
2.6 DBMR MARKET POSITION GRID
2.7 VENDOR SHARE ANALYSIS
2.8 MARKET VERTICAL COVERAGE GRID
2.9 MULTIVARIATE MODELLING
2.1 COMPONENT CURVE
2.11 CHALLENGE MATRIX
2.12 SECONDARY SOURCES
2.13 ASSUMPTIONS
3 EXECUTIVE SUMMARY
4 PREMIUM INSIGHTS
5 REGIONAL SUMMARY: ASIA PACIFIC ACCOUNTS PAYABLE AUTOMATION MARKET
6 DBMR ANALYSIS
6.1 STRENGTH:
6.2 THREAT:
6.3 OPPORTUNITY:
6.4 WEAKNESS:
7 MARKET OVERVIEW
7.1 DRIVERS
7.1.1 GROWTH IN THE NEED TO DIGITIZE THE PAYMENT PROCESS AND REDUCTION IN INVOICE PROCESSING TIME
7.1.2 INCREASED DEMAND FOR ACCOUNTS PAYABLE AUTOMATION FOR BILL GENERATION
7.1.3 INCREASE IN THE USE OF ACCOUNTS PAYABLE PLATFORMS
7.2 RESTRAINTS
7.2.1 HIGHER COST FOR IMPLEMENTATION OF ACCOUNTS PAYABLE AUTOMATION SYSTEMS
7.2.2 RISE IN COMPLEXITY OF PAYABLE AUTOMATION SYSTEMS IN LARGE ENTERPRISES
7.3 OPPORTUNITIES
7.3.1 EMERGENCE OF AI, ML, AND RPA TECHNOLOGY TO HANDLE REPETITIVE AND LABOR-INTENSIVE TASK
7.3.2 ARTIFICIAL INTELLIGENCE (AI) AND MACHINE LEARNING (ML) APPLICATIONS
7.3.3 ROBOTIC PROCESS AUTOMATION (RPA)
7.3.4 ADOPTION OF CLOUD-BASED AUTOMATION PAYABLE SOLUTIONS
7.3.5 GOVERNMENT INITIATIVES TO DRIVE AUTOMATION AND DIGITALIZATION
7.4 CHALLENGES
7.4.1 INTEROPERABILITY OF MULTIPLE SYSTEM COMPONENTS FROM DIFFERENT SOLUTION PROVIDERS
7.4.2 LESS AWARENESS AMONG ORGANIZATIONS ABOUT THE VIRTUES OF AP AUTOMATION
8 ASIA PACIFIC ACCOUNTS PAYABLE AUTOMATION MARKET, BY COMPONENT
8.1 OVERVIEW
8.2 SOLUTIONS
8.3 SERVICES
8.3.1 MANAGED SERVICES
8.3.2 IMPLEMENTATION AND INTEGRATION
8.3.3 PROFESSIONAL SERVICES
8.3.4 SUPPORT AND MAINTENANCE
8.3.5 ADVISORY
9 ASIA PACIFIC ACCOUNTS PAYABLE AUTOMATION MARKET, BY ORGANIZATION SIZE
9.1 OVERVIEW
9.2 LARGE ENTERPRISE
9.3 SMALL AND MEDIUM ENTERPRISE
10 ASIA PACIFIC ACCOUNTS PAYABLE AUTOMATION MARKET, BY PROCESS
10.1 OVERVIEW
10.2 INVOICE CAPTURE
10.2.1 OPTICAL CHARACTER RECOGNITION (OCR)
10.2.2 COMPUTER VISION
10.2.3 INTELLIGENT DOCUMENT PROCESSING (IDP)
10.2.4 OTHERS
10.3 INVOICE APPROVAL
10.4 PAYMENT AUTHORIZATION
10.5 PAYMENT EXECUTION
10.6 EXPORT
11 ASIA PACIFIC ACCOUNTS PAYABLE AUTOMATION MARKET, BY DEPLOYMENT TYPE
11.1 OVERVIEW
11.2 ON PREMISE
11.3 CLOUD
11.3.1 PUBLIC
11.3.2 PRIVATE
12 ASIA PACIFIC ACCOUNTS PAYABLE AUTOMATION MARKET, BY VERTICAL
12.1 OVERVIEW
12.2 MANUFACTURING
12.3 CONSUMER GOODS AND RETAIL
12.4 ENERGY AND UTILITIES
12.5 HEALTHCARE
12.6 BANKING, FINANCIAL SERVICES, AND INSURANCE
12.7 IT AND TELECOM
12.8 GOVERNMENT
12.9 AUTOMOTIVE
12.1 OTHERS
13 ASIA PACIFIC ACCOUNTS PAYABLE AUTOMATION MARKET, BY REGION
13.1 ASIA-PACIFIC
13.1.1 CHINA
13.1.2 JAPAN
13.1.3 INDIA
13.1.4 SOUTH KOREA
13.1.5 AUSTRALIA
13.1.6 SINGAPORE
13.1.7 MALAYSIA
13.1.8 THAILAND
13.1.9 INDONESIA
13.1.10 PHILIPPINES
13.1.11 REST OF ASIA-PACIFIC
14 ASIA PACIFIC ACCOUNTS PAYABLE AUTOMATION MARKET, COMPANY LANDSCAPE
14.1 COMPANY SHARE ANALYSIS: ASIA PACIFIC
15 SWOT ANALYSIS
16 COMPANY PROFILE
16.1 ORACLE
16.1.1 COMPANY SNAPSHOT
16.1.2 REVENUE ANALYSIS
16.1.3 COMPANY SHARE ANALYSIS
16.1.4 PRODUCT PORTFOLIO
16.1.5 RECENT DEVELOPMENTS
16.2 AVIDXCHANGE
16.2.1 COMPANY SNAPSHOT
16.2.2 REVENUE ANALYSIS
16.2.3 PRODUCT PORTFOLIO
16.2.4 RECENT DEVELOPMENT
16.3 SAP SE
16.3.1 COMPANY SNAPSHOT
16.3.2 REVENUE ANALYSIS
16.3.3 COMPANY SHARE ANALYSIS
16.3.4 PRODUCT PORTFOLIO
16.3.5 RECENT DEVELOPMENTS
16.4 FIS.
16.4.1 COMPANY SNAPSHOT
16.4.2 REVENUE ANALYSIS
16.4.3 COMPANY SHARE ANALYSIS
16.4.4 SOLUTION PORTFOLIO
16.4.5 RECENT DEVELOPMENTS
16.5 BILL.COM
16.5.1 COMPANY SNAPSHOT
16.5.2 REVENUE ANALYSIS
16.5.3 COMPANY SHARE ANALYSIS
16.5.4 PRODUCT PORTFOLIO
16.5.5 RECENT DEVELOPMENT
16.6 AIRBASE INC.
16.6.1 COMPANY SNAPSHOT
16.6.2 PRODUCT PORTFOLIO
16.6.3 RECENT DEVELOPMENT
16.7 BOTTOMLINE TECHNOLOGIES, INC.
16.7.1 COMPANY SNAPSHOT
16.7.2 REVENUE ANALYSIS
16.7.3 PRODUCT PORTFOLIO
16.7.4 RECENT DEVELOPMENT
16.8 COMARCH SA.
16.8.1 COMPANY SNAPSHOT
16.8.2 REVENUE ANALYSIS
16.8.3 SOLUTION & PRODUCT PORTFOLIO
16.8.4 RECENT DEVELOPMENT
16.9 COUPA SOFTWARE INC.
16.9.1 COMPANY SNAPSHOT
16.9.2 REVENUE ANALYSIS
16.9.3 SOLUTION & PRODUCT PORTFOLIO
16.9.4 RECENT DEVELOPMENT
16.1 FINANCIALFORCE
16.10.1 COMPANY SNAPSHOT
16.10.2 PRODUCT PORTFOLIO
16.10.3 RECENT DEVELOPMENTS
16.11 FLEETCOR TECHNOLOGIES, INC.
16.11.1 COMPANY SNAPSHOT
16.11.2 REVENUE ANALYSIS
16.11.3 PRODUCT PORTFOLIO
16.11.4 RECENT DEVELOPMENT
16.12 FRESHBOOKS
16.12.1 COMPANY SNAPSHOT
16.12.2 PRODUCT PORTFOLIO
16.12.3 RECENT DEVELOPMENT
16.13 KOFAX INC.
16.13.1 COMPANY SNAPSHOT
16.13.2 PRODUCT PORTFOLIO
16.13.3 RECENT DEVELOPMENTS
16.14 MINERALTREE
16.14.1 COMPANY SNAPSHOT
16.14.2 PRODUCT PORTFOLIO
16.14.3 RECENT DEVELOPMENTS
16.15 MHC AUTOMATION
16.15.1 COMPANY SNAPSHOT
16.15.2 PRODUCT PORTFOLIO
16.15.3 RECENT DEVELOPMENTS
16.16 PROCURIFY TECHNOLOGIES INC.
16.16.1 COMPANY SNAPSHOT
16.16.2 PRODUCT PORTFOLIO
16.16.3 RECENT DEVELOPMENT
16.17 SAGE GROUP PLC
16.17.1 COMPANY SNAPSHOT
16.17.2 REVENUE ANALYSIS
16.17.3 SOLUTION PORTFOLIO
16.17.4 RECENT DEVELOPMENTS
16.18 TIPALTI INC.
16.18.1 COMPANY SNAPSHOT
16.18.2 SOLUTION PORTFOLIO
16.18.3 RECENT DEVELOPMENTS
16.19 ZOHO CORPORATION PVT. LTD.
16.19.1 COMPANY SNAPSHOT
16.19.2 PRODUCT PORTFOLIO
16.19.3 RECENT DEVELOPMENTS
16.2 ZYCUS INC.
16.20.1 COMPANY SNAPSHOT
16.20.2 SOLUTION PORTFOLIO
16.20.3 RECENT DEVELOPMENTS
17 QUESTIONNAIRE
18 RELATED REPORTS
List of Table
TABLE 1 ASIA PACIFIC ACCOUNTS PAYABLE AUTOMATION MARKET, BY COMPONENT, 2020-2029 (USD MILLION)
TABLE 2 ASIA PACIFIC SOLUTIONS IN ACCOUNTS PAYABLE AUTOMATION MARKET, BY REGION, 2020-2029 (USD MILLION)
TABLE 3 ASIA PACIFIC SERVICES IN ACCOUNTS PAYABLE AUTOMATION MARKET, BY REGION, 2020-2029 (USD MILLION)
TABLE 4 ASIA PACIFIC SERVICES IN ACCOUNTS PAYABLE AUTOMATION MARKET, BY TYPE, 2020-2029 (USD MILLION)
TABLE 5 ASIA PACIFIC ACCOUNTS PAYABLE AUTOMATION MARKET, BY ORGANIZATION SIZE, 2020-2029 (USD MILLION)
TABLE 6 ASIA PACIFIC LARGE ENTERPRISE IN ACCOUNTS PAYABLE AUTOMATION MARKET, BY REGION, 2020-2029 (USD MILLION)
TABLE 7 ASIA PACIFIC SMALL AND MEDIUM ENTERPRISE IN ACCOUNTS PAYABLE AUTOMATION MARKET, BY REGION, 2020-2029 (USD MILLION)
TABLE 8 ASIA PACIFIC ACCOUNTS PAYABLE AUTOMATION MARKET, BY PROCESS, 2020-2029 (USD MILLION)
TABLE 9 ASIA PACIFIC INVOICE CAPTURE IN ACCOUNTS PAYABLE AUTOMATION MARKET, BY REGION, 2020-2029 (USD MILLION)
TABLE 10 ASIA PACIFIC INVOICE CAPTURE IN ACCOUNTS PAYABLE AUTOMATION MARKET, BY METHOD, 2020-2029 (USD MILLION)
TABLE 11 ASIA PACIFIC INVOICE APPROVAL IN ACCOUNTS PAYABLE AUTOMATION MARKET, BY REGION, 2020-2029 (USD MILLION)
TABLE 12 ASIA PACIFIC PAYMENT AUTHORIZATION IN ACCOUNTS PAYABLE AUTOMATION MARKET, BY REGION, 2020-2029 (USD MILLION)
TABLE 13 ASIA PACIFIC PAYMENT EXECUTION IN ACCOUNTS PAYABLE AUTOMATION MARKET, BY REGION, 2020-2029 (USD MILLION)
TABLE 14 ASIA PACIFIC EXPORT IN ACCOUNTS PAYABLE AUTOMATION MARKET, BY REGION, 2020-2029 (USD MILLION)
TABLE 15 ASIA PACIFIC ACCOUNTS PAYABLE AUTOMATION MARKET, BY DEPLOYMENT TYPE, 2020-2029 (USD MILLION)
TABLE 16 ASIA PACIFIC ON PREMISE IN ACCOUNTS PAYABLE AUTOMATION MARKET, BY REGION, 2020-2029 (USD MILLION)
TABLE 17 ASIA PACIFIC CLOUD IN ACCOUNTS PAYABLE AUTOMATION MARKET, BY REGION, 2020-2029 (USD MILLION)
TABLE 18 ASIA PACIFIC CLOUD IN ACCOUNTS PAYABLE AUTOMATION MARKET, BY TYPE, 2020-2029 (USD MILLION)
TABLE 19 ASIA PACIFIC ACCOUNTS PAYABLE AUTOMATION MARKET, BY VERTICAL, 2020-2029 (USD MILLION)
TABLE 20 ASIA PACIFIC MANUFACTURING IN ACCOUNTS PAYABLE AUTOMATION MARKET, BY REGION, 2020-2029 (USD MILLION)
TABLE 21 ASIA PACIFIC CONSUMER GOODS AND RETAIL IN ACCOUNTS PAYABLE AUTOMATION MARKET, BY REGION, 2020-2029 (USD MILLION)
TABLE 22 ASIA PACIFIC ENERGY AND UTILITIES IN ACCOUNTS PAYABLE AUTOMATION MARKET, BY REGION, 2020-2029 (USD MILLION)
TABLE 23 ASIA PACIFIC HEALTHCARE IN ACCOUNTS PAYABLE AUTOMATION MARKET, BY REGION, 2020-2029 (USD MILLION)
TABLE 24 ASIA PACIFIC BANKING, FINANCIAL SERVICES, AND INSURANCE IN ACCOUNTS PAYABLE AUTOMATION MARKET, BY REGION, 2020-2029 (USD MILLION)
TABLE 25 ASIA PACIFIC IT AND TELECOM IN ACCOUNTS PAYABLE AUTOMATION MARKET, BY REGION, 2020-2029 (USD MILLION)
TABLE 26 ASIA PACIFIC GOVERNMENT IN ACCOUNTS PAYABLE AUTOMATION MARKET, BY REGION, 2020-2029 (USD MILLION)
TABLE 27 ASIA PACIFIC AUTOMOTIVE IN ACCOUNTS PAYABLE AUTOMATION MARKET, BY REGION, 2020-2029 (USD MILLION)
TABLE 28 ASIA PACIFIC OTHERS IN ACCOUNTS PAYABLE AUTOMATION MARKET, BY REGION, 2020-2029 (USD MILLION)
TABLE 29 ASIA-PACIFIC ACCOUNTS PAYABLE AUTOMATION MARKET, BY COUNTRY, 2020-2029 (USD MILLION)
TABLE 30 ASIA-PACIFIC ACCOUNTS PAYABLE AUTOMATION MARKET, BY COMPONENT, 2020-2029 (USD MILLION)
TABLE 31 ASIA-PACIFIC SERVICES IN ACCOUNTS PAYABLE AUTOMATION MARKET, BY TYPE, 2020-2029 (USD MILLION)
TABLE 32 ASIA-PACIFIC ACCOUNTS PAYABLE AUTOMATION MARKET, BY ORGANIZATION SIZE, 2020-2029 (USD MILLION)
TABLE 33 ASIA-PACIFIC ACCOUNTS PAYABLE AUTOMATION MARKET, BY PROCESS, 2020-2029 (USD MILLION)
TABLE 34 ASIA-PACIFIC INVOICE CAPTURE IN ACCOUNTS PAYABLE AUTOMATION MARKET, BY METHOD, 2020-2029 (USD MILLION)
TABLE 35 ASIA-PACIFIC ACCOUNTS PAYABLE AUTOMATION MARKET, BY DEPLOYMENT TYPE, 2020-2029 (USD MILLION)
TABLE 36 ASIA-PACIFIC CLOUD IN ACCOUNTS PAYABLE AUTOMATION MARKET, BY TYPE, 2020-2029 (USD MILLION)
TABLE 37 ASIA-PACIFIC ACCOUNTS PAYABLE AUTOMATION MARKET, BY VERTICAL, 2020-2029 (USD MILLION)
TABLE 38 CHINA ACCOUNTS PAYABLE AUTOMATION MARKET, BY COMPONENT, 2020-2029 (USD MILLION)
TABLE 39 CHINA SERVICES IN ACCOUNTS PAYABLE AUTOMATION MARKET, BY TYPE, 2020-2029 (USD MILLION)
TABLE 40 CHINA ACCOUNTS PAYABLE AUTOMATION MARKET, BY ORGANIZATION SIZE, 2020-2029 (USD MILLION)
TABLE 41 CHINA ACCOUNTS PAYABLE AUTOMATION MARKET, BY PROCESS, 2020-2029 (USD MILLION)
TABLE 42 CHINA INVOICE CAPTURE IN ACCOUNTS PAYABLE AUTOMATION MARKET, BY METHOD, 2020-2029 (USD MILLION)
TABLE 43 CHINA ACCOUNTS PAYABLE AUTOMATION MARKET, BY DEPLOYMENT TYPE, 2020-2029 (USD MILLION)
TABLE 44 CHINA CLOUD IN ACCOUNTS PAYABLE AUTOMATION MARKET, BY TYPE, 2020-2029 (USD MILLION)
TABLE 45 CHINA ACCOUNTS PAYABLE AUTOMATION MARKET, BY VERTICAL, 2020-2029 (USD MILLION)
TABLE 46 JAPAN ACCOUNTS PAYABLE AUTOMATION MARKET, BY COMPONENT, 2020-2029 (USD MILLION)
TABLE 47 JAPAN SERVICES IN ACCOUNTS PAYABLE AUTOMATION MARKET, BY TYPE, 2020-2029 (USD MILLION)
TABLE 48 JAPAN ACCOUNTS PAYABLE AUTOMATION MARKET, BY ORGANIZATION SIZE, 2020-2029 (USD MILLION)
TABLE 49 JAPAN ACCOUNTS PAYABLE AUTOMATION MARKET, BY PROCESS, 2020-2029 (USD MILLION)
TABLE 50 JAPAN INVOICE CAPTURE IN ACCOUNTS PAYABLE AUTOMATION MARKET, BY METHOD, 2020-2029 (USD MILLION)
TABLE 51 JAPAN ACCOUNTS PAYABLE AUTOMATION MARKET, BY DEPLOYMENT TYPE, 2020-2029 (USD MILLION)
TABLE 52 JAPAN CLOUD IN ACCOUNTS PAYABLE AUTOMATION MARKET, BY TYPE, 2020-2029 (USD MILLION)
TABLE 53 JAPAN ACCOUNTS PAYABLE AUTOMATION MARKET, BY VERTICAL, 2020-2029 (USD MILLION)
TABLE 54 INDIA ACCOUNTS PAYABLE AUTOMATION MARKET, BY COMPONENT, 2020-2029 (USD MILLION)
TABLE 55 INDIA SERVICES IN ACCOUNTS PAYABLE AUTOMATION MARKET, BY TYPE, 2020-2029 (USD MILLION)
TABLE 56 INDIA ACCOUNTS PAYABLE AUTOMATION MARKET, BY ORGANIZATION SIZE, 2020-2029 (USD MILLION)
TABLE 57 INDIA ACCOUNTS PAYABLE AUTOMATION MARKET, BY PROCESS, 2020-2029 (USD MILLION)
TABLE 58 INDIA INVOICE CAPTURE IN ACCOUNTS PAYABLE AUTOMATION MARKET, BY METHOD, 2020-2029 (USD MILLION)
TABLE 59 INDIA ACCOUNTS PAYABLE AUTOMATION MARKET, BY DEPLOYMENT TYPE, 2020-2029 (USD MILLION)
TABLE 60 INDIA CLOUD IN ACCOUNTS PAYABLE AUTOMATION MARKET, BY TYPE, 2020-2029 (USD MILLION)
TABLE 61 INDIA ACCOUNTS PAYABLE AUTOMATION MARKET, BY VERTICAL, 2020-2029 (USD MILLION)
TABLE 62 SOUTH KOREA ACCOUNTS PAYABLE AUTOMATION MARKET, BY COMPONENT, 2020-2029 (USD MILLION)
TABLE 63 SOUTH KOREA SERVICES IN ACCOUNTS PAYABLE AUTOMATION MARKET, BY TYPE, 2020-2029 (USD MILLION)
TABLE 64 SOUTH KOREA ACCOUNTS PAYABLE AUTOMATION MARKET, BY ORGANIZATION SIZE, 2020-2029 (USD MILLION)
TABLE 65 SOUTH KOREA ACCOUNTS PAYABLE AUTOMATION MARKET, BY PROCESS, 2020-2029 (USD MILLION)
TABLE 66 SOUTH KOREA INVOICE CAPTURE IN ACCOUNTS PAYABLE AUTOMATION MARKET, BY METHOD, 2020-2029 (USD MILLION)
TABLE 67 SOUTH KOREA ACCOUNTS PAYABLE AUTOMATION MARKET, BY DEPLOYMENT TYPE, 2020-2029 (USD MILLION)
TABLE 68 SOUTH KOREA CLOUD IN ACCOUNTS PAYABLE AUTOMATION MARKET, BY TYPE, 2020-2029 (USD MILLION)
TABLE 69 SOUTH KOREA ACCOUNTS PAYABLE AUTOMATION MARKET, BY VERTICAL, 2020-2029 (USD MILLION)
TABLE 70 AUSTRALIA ACCOUNTS PAYABLE AUTOMATION MARKET, BY COMPONENT, 2020-2029 (USD MILLION)
TABLE 71 AUSTRALIA SERVICES IN ACCOUNTS PAYABLE AUTOMATION MARKET, BY TYPE, 2020-2029 (USD MILLION)
TABLE 72 AUSTRALIA ACCOUNTS PAYABLE AUTOMATION MARKET, BY ORGANIZATION SIZE, 2020-2029 (USD MILLION)
TABLE 73 AUSTRALIA ACCOUNTS PAYABLE AUTOMATION MARKET, BY PROCESS, 2020-2029 (USD MILLION)
TABLE 74 AUSTRALIA INVOICE CAPTURE IN ACCOUNTS PAYABLE AUTOMATION MARKET, BY METHOD, 2020-2029 (USD MILLION)
TABLE 75 AUSTRALIA ACCOUNTS PAYABLE AUTOMATION MARKET, BY DEPLOYMENT TYPE, 2020-2029 (USD MILLION)
TABLE 76 AUSTRALIA CLOUD IN ACCOUNTS PAYABLE AUTOMATION MARKET, BY TYPE, 2020-2029 (USD MILLION)
TABLE 77 AUSTRALIA ACCOUNTS PAYABLE AUTOMATION MARKET, BY VERTICAL, 2020-2029 (USD MILLION)
TABLE 78 SINGAPORE ACCOUNTS PAYABLE AUTOMATION MARKET, BY COMPONENT, 2020-2029 (USD MILLION)
TABLE 79 SINGAPORE SERVICES IN ACCOUNTS PAYABLE AUTOMATION MARKET, BY TYPE, 2020-2029 (USD MILLION)
TABLE 80 SINGAPORE ACCOUNTS PAYABLE AUTOMATION MARKET, BY ORGANIZATION SIZE, 2020-2029 (USD MILLION)
TABLE 81 SINGAPORE ACCOUNTS PAYABLE AUTOMATION MARKET, BY PROCESS, 2020-2029 (USD MILLION)
TABLE 82 SINGAPORE INVOICE CAPTURE IN ACCOUNTS PAYABLE AUTOMATION MARKET, BY METHOD, 2020-2029 (USD MILLION)
TABLE 83 SINGAPORE ACCOUNTS PAYABLE AUTOMATION MARKET, BY DEPLOYMENT TYPE, 2020-2029 (USD MILLION)
TABLE 84 SINGAPORE CLOUD IN ACCOUNTS PAYABLE AUTOMATION MARKET, BY TYPE, 2020-2029 (USD MILLION)
TABLE 85 SINGAPORE ACCOUNTS PAYABLE AUTOMATION MARKET, BY VERTICAL, 2020-2029 (USD MILLION)
TABLE 86 MALAYSIA ACCOUNTS PAYABLE AUTOMATION MARKET, BY COMPONENT, 2020-2029 (USD MILLION)
TABLE 87 MALAYSIA SERVICES IN ACCOUNTS PAYABLE AUTOMATION MARKET, BY TYPE, 2020-2029 (USD MILLION)
TABLE 88 MALAYSIA ACCOUNTS PAYABLE AUTOMATION MARKET, BY ORGANIZATION SIZE, 2020-2029 (USD MILLION)
TABLE 89 MALAYSIA ACCOUNTS PAYABLE AUTOMATION MARKET, BY PROCESS, 2020-2029 (USD MILLION)
TABLE 90 MALAYSIA INVOICE CAPTURE IN ACCOUNTS PAYABLE AUTOMATION MARKET, BY METHOD, 2020-2029 (USD MILLION)
TABLE 91 MALAYSIA ACCOUNTS PAYABLE AUTOMATION MARKET, BY DEPLOYMENT TYPE, 2020-2029 (USD MILLION)
TABLE 92 MALAYSIA CLOUD IN ACCOUNTS PAYABLE AUTOMATION MARKET, BY TYPE, 2020-2029 (USD MILLION)
TABLE 93 MALAYSIA ACCOUNTS PAYABLE AUTOMATION MARKET, BY VERTICAL, 2020-2029 (USD MILLION)
TABLE 94 THAILAND ACCOUNTS PAYABLE AUTOMATION MARKET, BY COMPONENT, 2020-2029 (USD MILLION)
TABLE 95 THAILAND SERVICES IN ACCOUNTS PAYABLE AUTOMATION MARKET, BY TYPE, 2020-2029 (USD MILLION)
TABLE 96 THAILAND ACCOUNTS PAYABLE AUTOMATION MARKET, BY ORGANIZATION SIZE, 2020-2029 (USD MILLION)
TABLE 97 THAILAND ACCOUNTS PAYABLE AUTOMATION MARKET, BY PROCESS, 2020-2029 (USD MILLION)
TABLE 98 THAILAND INVOICE CAPTURE IN ACCOUNTS PAYABLE AUTOMATION MARKET, BY METHOD, 2020-2029 (USD MILLION)
TABLE 99 THAILAND ACCOUNTS PAYABLE AUTOMATION MARKET, BY DEPLOYMENT TYPE, 2020-2029 (USD MILLION)
TABLE 100 THAILAND CLOUD IN ACCOUNTS PAYABLE AUTOMATION MARKET, BY TYPE, 2020-2029 (USD MILLION)
TABLE 101 THAILAND ACCOUNTS PAYABLE AUTOMATION MARKET, BY VERTICAL, 2020-2029 (USD MILLION)
TABLE 102 INDONESIA ACCOUNTS PAYABLE AUTOMATION MARKET, BY COMPONENT, 2020-2029 (USD MILLION)
TABLE 103 INDONESIA SERVICES IN ACCOUNTS PAYABLE AUTOMATION MARKET, BY TYPE, 2020-2029 (USD MILLION)
TABLE 104 INDONESIA ACCOUNTS PAYABLE AUTOMATION MARKET, BY ORGANIZATION SIZE, 2020-2029 (USD MILLION)
TABLE 105 INDONESIA ACCOUNTS PAYABLE AUTOMATION MARKET, BY PROCESS, 2020-2029 (USD MILLION)
TABLE 106 INDONESIA INVOICE CAPTURE IN ACCOUNTS PAYABLE AUTOMATION MARKET, BY METHOD, 2020-2029 (USD MILLION)
TABLE 107 INDONESIA ACCOUNTS PAYABLE AUTOMATION MARKET, BY DEPLOYMENT TYPE, 2020-2029 (USD MILLION)
TABLE 108 INDONESIA CLOUD IN ACCOUNTS PAYABLE AUTOMATION MARKET, BY TYPE, 2020-2029 (USD MILLION)
TABLE 109 INDONESIA ACCOUNTS PAYABLE AUTOMATION MARKET, BY VERTICAL, 2020-2029 (USD MILLION)
TABLE 110 PHILIPPINES ACCOUNTS PAYABLE AUTOMATION MARKET, BY COMPONENT, 2020-2029 (USD MILLION)
TABLE 111 PHILIPPINES SERVICES IN ACCOUNTS PAYABLE AUTOMATION MARKET, BY TYPE, 2020-2029 (USD MILLION)
TABLE 112 PHILIPPINES ACCOUNTS PAYABLE AUTOMATION MARKET, BY ORGANIZATION SIZE, 2020-2029 (USD MILLION)
TABLE 113 PHILIPPINES ACCOUNTS PAYABLE AUTOMATION MARKET, BY PROCESS, 2020-2029 (USD MILLION)
TABLE 114 PHILIPPINES INVOICE CAPTURE IN ACCOUNTS PAYABLE AUTOMATION MARKET, BY METHOD, 2020-2029 (USD MILLION)
TABLE 115 PHILIPPINES ACCOUNTS PAYABLE AUTOMATION MARKET, BY DEPLOYMENT TYPE, 2020-2029 (USD MILLION)
TABLE 116 PHILIPPINES CLOUD IN ACCOUNTS PAYABLE AUTOMATION MARKET, BY TYPE, 2020-2029 (USD MILLION)
TABLE 117 PHILIPPINES ACCOUNTS PAYABLE AUTOMATION MARKET, BY VERTICAL, 2020-2029 (USD MILLION)
TABLE 118 REST OF ASIA-PACIFIC ACCOUNTS PAYABLE AUTOMATION MARKET, BY COMPONENT, 2020-2029 (USD MILLION)
List of Figure
FIGURE 1 ASIA PACIFIC ACCOUNTS PAYABLE AUTOMATION MARKET: SEGMENTATION
FIGURE 2 ASIA PACIFIC ACCOUNTS PAYABLE AUTOMATION MARKET: DATA TRIANGULATION
FIGURE 3 ASIA PACIFIC ACCOUNTS PAYABLE AUTOMATION MARKET: DROC ANALYSIS
FIGURE 4 ASIA PACIFIC ACCOUNTS PAYABLE AUTOMATION MARKET: ASIA PACIFIC VS REGIONAL MARKET ANALYSIS
FIGURE 5 ASIA PACIFIC ACCOUNTS PAYABLE AUTOMATION MARKET: COMPANY RESEARCH ANALYSIS
FIGURE 6 ASIA PACIFIC ACCOUNTS PAYABLE AUTOMATION MARKET: INTERVIEW DEMOGRAPHICS
FIGURE 7 ASIA PACIFIC ACCOUNTS PAYABLE AUTOMATION MARKET: DBMR MARKET POSITION GRID
FIGURE 8 ASIA PACIFIC ACCOUNTS PAYABLE AUTOMATION MARKET: VENDOR SHARE ANALYSIS
FIGURE 9 ASIA PACIFIC ACCOUNTS PAYABLE AUTOMATION MARKET: MARKET VERTICAL COVERAGE GRID
FIGURE 10 ASIA PACIFIC ACCOUNTS PAYABLE AUTOMATION MARKET: SEGMENTATION
FIGURE 11 GROWING NEED TO DIGITIZE PAYMENT PROCESS AND REDUCTION IN INVOICE PROCESSING TIME IS EXPECTED TO BE KEY DRIVER OF THE MARKET FOR ASIA PACIFIC ACCOUNTS PAYABLE AUTOMATION MARKET IN THE FORECAST PERIOD OF 2022 TO 2029
FIGURE 12 SOLUTION SEGMENT IS EXPECTED TO ACCOUNTS FOR THE LARGEST SHARE OF THE ASIA PACIFIC ACCOUNTS PAYABLE AUTOMATION MARKET FROM 2022 TO 2029
FIGURE 13 DRIVERS, RESTRAINTS, OPPORTUNITIES AND CHALLENGES OF THE ASIA PACIFIC ACCOUNTS PAYABLE AUTOMATION MARKET
FIGURE 14 ASIA PACIFIC ACCOUNTS PAYABLE AUTOMATION MARKET: BY COMPONENT, 2021
FIGURE 15 ASIA PACIFIC ACCOUNTS PAYABLE AUTOMATION MARKET: BY ORGANIZATION SIZE, 2021
FIGURE 16 ASIA PACIFIC ACCOUNTS PAYABLE AUTOMATION MARKET: BY PROCESS, 2021
FIGURE 17 ASIA PACIFIC ACCOUNTS PAYABLE AUTOMATION MARKET: BY DEPLOYMENT TYPE, 2021
FIGURE 18 ASIA PACIFIC ACCOUNTS PAYABLE AUTOMATION MARKET: BY VERTICAL, 2021
FIGURE 19 ASIA-PACIFIC ACCOUNTS PAYABLE AUTOMATION MARKET: SNAPSHOT (2021)
FIGURE 20 ASIA-PACIFIC ACCOUNTS PAYABLE AUTOMATION MARKET: BY COUNTRY (2021)
FIGURE 21 ASIA-PACIFIC ACCOUNTS PAYABLE AUTOMATION MARKET: BY COUNTRY (2022 & 2029)
FIGURE 22 ASIA-PACIFIC ACCOUNTS PAYABLE AUTOMATION MARKET: BY COUNTRY (2021 & 2029)
FIGURE 23 ASIA-PACIFIC ACCOUNTS PAYABLE AUTOMATION MARKET: BY COMPONENT (2022-2029)
FIGURE 24 ASIA PACIFIC ACCOUNTS PAYABLE AUTOMATION MARKET: COMPANY SHARE 2021 (%)
Asia Pacific Accounts Payable Automation Market, Supply Chain Analysis and Ecosystem Framework
To support market growth and help clients navigate the impact of geopolitical shifts, DBMR has integrated in-depth supply chain analysis into its Asia Pacific Accounts Payable Automation Market research reports. This addition empowers clients to respond effectively to global changes affecting their industries. The supply chain analysis section includes detailed insights such as Asia Pacific Accounts Payable Automation Market consumption and production by country, price trend analysis, the impact of tariffs and geopolitical developments, and import and export trends by country and HSN code. It also highlights major suppliers with data on production capacity and company profiles, as well as key importers and exporters. In addition to research, DBMR offers specialized supply chain consulting services backed by over a decade of experience, providing solutions like supplier discovery, supplier risk assessment, price trend analysis, impact evaluation of inflation and trade route changes, and comprehensive market trend analysis.
Data collection and base year analysis are done using data collection modules with large sample sizes. The stage includes obtaining market information or related data through various sources and strategies. It includes examining and planning all the data acquired from the past in advance. It likewise envelops the examination of information inconsistencies seen across different information sources. The market data is analysed and estimated using market statistical and coherent models. Also, market share analysis and key trend analysis are the major success factors in the market report. To know more, please request an analyst call or drop down your inquiry.
The key research methodology used by DBMR research team is data triangulation which involves data mining, analysis of the impact of data variables on the market and primary (industry expert) validation. Data models include Vendor Positioning Grid, Market Time Line Analysis, Market Overview and Guide, Company Positioning Grid, Patent Analysis, Pricing Analysis, Company Market Share Analysis, Standards of Measurement, Global versus Regional and Vendor Share Analysis. To know more about the research methodology, drop in an inquiry to speak to our industry experts.
Data Bridge Market Research is a leader in advanced formative research. We take pride in servicing our existing and new customers with data and analysis that match and suits their goal. The report can be customized to include price trend analysis of target brands understanding the market for additional countries (ask for the list of countries), clinical trial results data, literature review, refurbished market and product base analysis. Market analysis of target competitors can be analyzed from technology-based analysis to market portfolio strategies. We can add as many competitors that you require data about in the format and data style you are looking for. Our team of analysts can also provide you data in crude raw excel files pivot tables (Fact book) or can assist you in creating presentations from the data sets available in the report.


