
Asia-Pacific Augmented Reality (AR) and Mixed Reality (MR) Market Analysis and Insights
Augmented reality and mixed reality have brought a new change to digitalization. It has now become easier to experience the real world by setting different environmental conditions. Augmented reality & mixed reality has a wide range of applications, the growth of the market increased highly as the use of augmented reality and mixed reality became popular in driving simulators. The augmented reality and mixed reality provide the driver with a real sense of the road, driving conditions, car manuals, and road traffic that helps avoid accidents at an initial stage of learning and prepares the drivers for various situations. These attributes have led to an increased usage of augmented reality and mixed reality in defense and aerospace also. The army personnel used it for training in various conditions such as parachute jumping, submarine, combat situations, and driving in various environmental conditions.
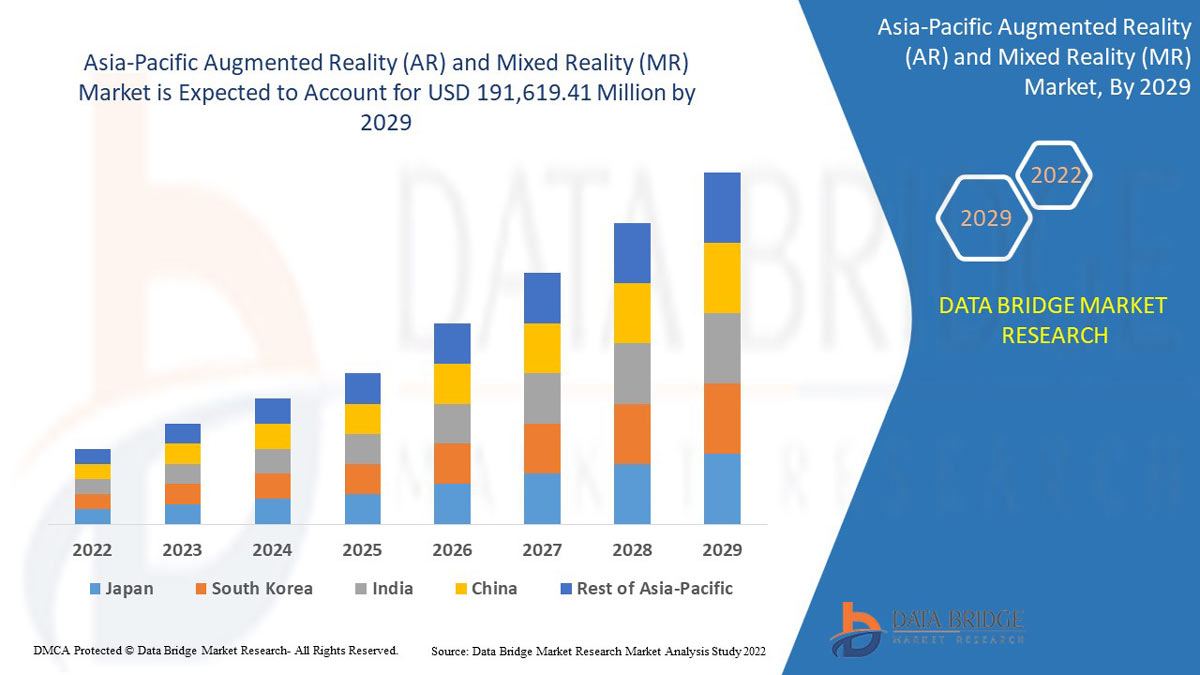
Data Bridge Market Research analyses that the Asia-Pacific augmented reality (AR) & mixed reality (MR) market is expected to reach the value of USD 191,619.41 million by 2029, at a CAGR of 51.9% during the forecast period. The hardware segment accounts for the largest component segment in the augmented reality (AR) & mixed reality (MR) market. The Asia-Pacific augmented reality (AR) & mixed reality (MR) market report also covers pricing analysis, patent analysis, and technological advancements in depth.
|
Report Metric |
Details |
|
Forecast Period |
2022 to 2029 |
|
Base Year |
2021 |
|
Historic Years |
2020 (Customizable to 2019 - 2014) |
|
Quantitative Units |
Revenue in USD Million, Pricing in USD |
|
Segments Covered |
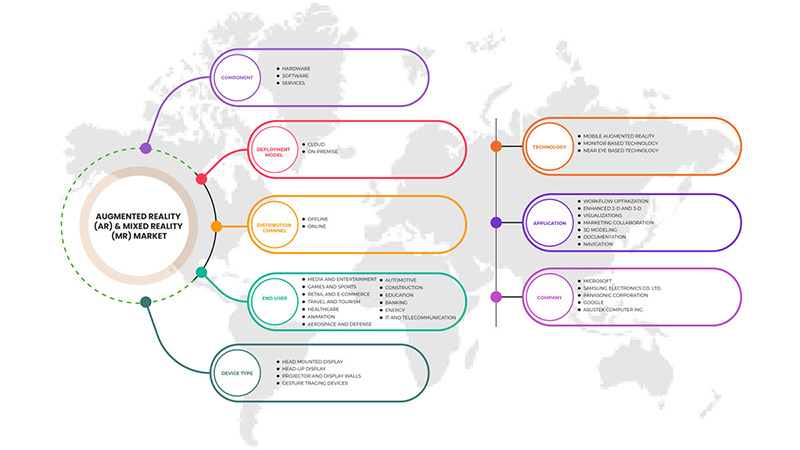
By Component (Hardware, Software, and Services), Deployment Model (Cloud and On Premise), Distribution Channel (Offline, Online), Device Type (Head Up Display, Head Mounted Display, Projector & Display Wall, Gesture Tracking Devices), Technology (Mobile Augmented Reality, Monitor-Based Technology, Near Eye Based Technology), Application (Workflow Optimization, Marketing Collaboration, Enhanced 2-D & 3-D, Visualizations, 3D Modelling, Documentation, Navigation), End User (Retail & E-Commerce, IT & Telecommunication, Automotive, Aerospace & Defense, Healthcare, Animation, Travel & Tourism, Energy, Media & Entertainment, Education, Construction, Games & Sports, Banking) |
|
Countries Covered |
China, Japan, South Korea, Australia, India, Taiwan, Thailand, Singapore, Malaysia, Vietnam, New Zealand, Indonesia, Philippines, Rest of Asia Pacific |
|
Market Players Covered |
HP Development Company, LP, HTC Corporation, Autodesk Inc., Barco, Intel Corporation, PTC, Seiko Epson Corporation, Ultraleap Limited, ASUSTek Computer Inc., Dell, Google (a subsidiary of Alphabet Inc.), Sony Corporation, Lenovo, Microsoft, SAMSUNG ELECTRONICS CO., LTD., Panasonic Corporation, RealWear, Inc., Magic Leap, Inc., EON Reality, and TeamViewer among others. |
Market Definition
Augmented reality is a technology that uses the existing user's environment and overlays the digital or virtual content or information over it to offer an immersive digital experience in a real-time environment. Augmented reality applications are developed on special 3D programs, which enable developers to integrate contextual or digital content with the real world in real-time. Augmented reality offers interactive experiences through multiple sensory modalities, including haptic, auditory, visual, somatosensory, and more. The technology has a wide range of applications in entertainment, training, and educational areas. Industries such as manufacturing, healthcare, and logistics, among others, are more focusing on adopting this technology for training, maintenance, assistance, and monitoring applications.
Mixed reality symbolizes the controlled collision of the AR/VR and IoT trends. Mixed reality (MR), also referred to as hybrid reality, is the technology that is used to merge real and virtual worlds and produce new environments and visualizations where physical and digital objects co-exist and interact in real time. Mixed reality is an interdisciplinary field involving computer graphics, signal processing, computer apparition, user interfaces, mobile computing, wearable computing, information visualization, and the design of displays and sensors. Mixed reality concepts are increasingly being adopted by various industries, including automotive, healthcare, and office environments, among others.
Market Dynamics
This section deals with understanding the market drivers, advantages, opportunities, restraints, and challenges. All of this is discussed in detail as below:
Drivers
- Increasing penetration of smart devices and internet services
With the introduction of smart devices, AR has provided valuable opportunities for retailers to engage consumers, showcase their products, and create a competitive advantage, which is expected to drive the Asia-Pacific AR (augmented reality) & MR (mixed reality) market significantly.
- Rise in adoption of augmented reality by educational institutes
AR in education allows students to gain knowledge through rich visuals and immersion into the subject matter. Moreover, speech technology also engages students by providing comprehensive details about the topic in a voice format. Therefore, the concept of e-learning with AR has become an essential strategy for gathering information, which is expected to drive the Asia-Pacific AR (augmented reality) & MR (mixed reality) market significantly.
- Increasing focus on cyber-physical systems
Augmented reality (AR) enables intuitive and efficient human-machine interactions between humans and CPMT (Cyber-Physical Machine Tool). As cyber-physical security systems become model-based and leverage augmented, virtual, or mixed reality, the gaps between training, planning/analysis, and situational awareness simulations disappear. Through a model-driven contextual interface, users can experience a virtual representation of a real-world facility.
- More of technological advancement and digitization
The continuing convergence of digitalization in the real and the virtual worlds have become the main factor of innovation and change in all sectors of our economy. Augmented reality technology (AR) has become one of the critical digital transformation technologies in industrial and non-industrial areas. The rise of augmented reality has transformed lives and day-to-day operations in technology, hospitality, healthcare, and other sectors. The use of augmented reality helps the customers understand the product or the service with more ease and helps them make the decisions easier. In addition, augmented reality can also help build and improve the organization's brand image by giving the customers a seamless buying experience.
Opportunities
-
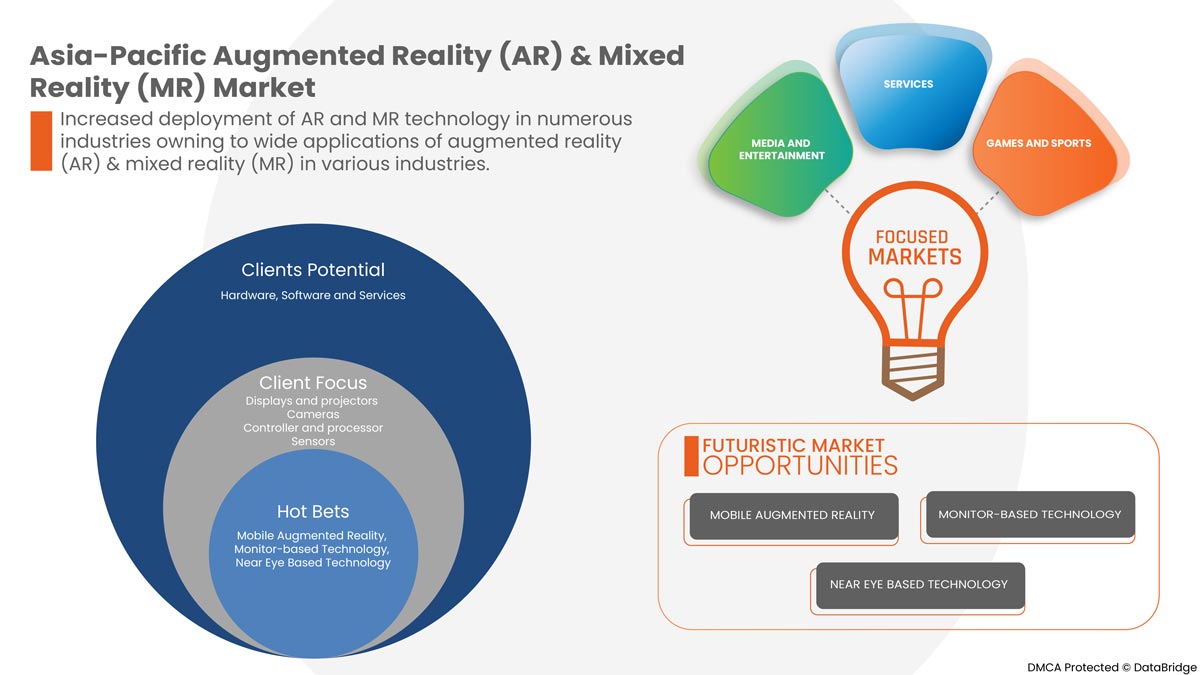
Increased deployment of AR and MR technology in numerous industries
The applications in various industrial sectors, especially in the defense industry, extensively use augmented and mixed reality. It is expected to create opportunities for the Asia-Pacific AR (augmented reality) & MR (mixed reality) market.
Restraints/Challenges
- Stringent regulations of government for varied organizations
AR (augmented reality) and MR (mixed reality) devices and applications are already subject to several laws and regulations governing individual privacy and user data across the countries. However, the current regulatory landscape addresses only some of the risks of using augmented reality devices. Specific requirements complicate the data collection necessary to provide robust and secure immersive experiences across sectors.
COVID-19 Impact on Asia-Pacific Augmented Reality (AR) & Mixed Reality (MR) Market
COVID-19 created a major impact on various industries as almost every country has opted for the shutdown of every facility except the ones dealing in the essential goods segment. The government has taken some strict actions such as the shutdown of facilities and sale of non-essential goods, blocked international trade, and many more to prevent the spread of COVID-19. The only business which is dealing in this pandemic situation is the essential services that are allowed to open and run the processes.
The increased usage of augmented reality-based devices has provided significant opportunities amid the COVID-19 pandemic. Although consumer purchasing power has been greatly diminished as a result of the coronavirus-induced economic slump, resulting in the decline of profit margins in organizations. While many key marketers and leaders saw signs of improvement from past years, it remains difficult to ascertain the actual market situation as the pent-up demand may be covering up a lower intrinsic level of demand for AR-based devices. The increase in AR smartphone applications, the rise in demand for remote collaboration, and technological advancements in medical applications are some of the factors driving the growth of the augmented reality and mixed reality market.
Manufacturers are making various strategic decisions to meet the growing demand in the COVID-19 period. The players were involved in strategic activities such as partnerships, collaborations, acquisitions, and others to improve the technology involved in the augmented reality (AR) & mixed reality (MR) market. With this, the companies will bring advanced and accurate solutions to the market. In addition, the government initiatives to boost digitization across industries have led to the market's growth.
Recent Developments
- In April 2021, Microsoft announced a Pentagon contract with the U.S. military for augmented reality headgear for soldiers worth USD 21.88 billion. This HoloLens will deliver soldiers more efficient visibility, next-generation night vision, and situational awareness for any war. This has also helped the company to transcend the traditional boundaries of space and time in the field of AR, thereby expanding their products in the market
- In July 2021, SAMSUNG ELECTRONICS CO., LTD. expanded its contactless offerings for consumers with a new Augmented Reality (AR) enabled service for its flagship products. With this, consumers may virtually experience a product in their homes, check product dimensions, and make an informed selection with the AR service. This has also helped the company to expand its product portfolio in the augmented reality market
Asia-Pacific Augmented Reality (AR) & Mixed Reality (MR) Market Scope
Asia-Pacific augmented reality (AR) & mixed reality (MR) market is segmented on the basis of component, deployment model, distribution channel, device type, technology, application, and end user. The growth amongst these segments will help you analyze meager growth segments in the industries and provide the users with a valuable market overview and market insights to help them make strategic decisions for identifying core market applications.
By Component
- Hardware
- Software
- Services
On the basis of component, the Asia-Pacific augmented reality (AR) & mixed reality (MR) market is segmented into hardware, software, and services.
By Deployment Model
- On-Premise
- Cloud
On the basis of the deployment model, the Asia-Pacific augmented reality (AR) & mixed reality (MR) market is segmented into on-premise and cloud.
By Distribution Channel
- Offline
- Online
On the basis of organization size, the Asia-Pacific augmented reality (AR) & mixed reality (MR) market is segmented into offline and online.
By Device Type
- Desktop
- Head Up Display
- Head Mounted Display
- Projector And Display Wall
- Gesture Tracking Devices
On the basis of device type, the Asia-Pacific augmented reality (AR) & mixed reality (MR) market has been segmented into head up display, head mounted display, projector and display wall, and gesture tracking devices.
By Technology
- Mobile Augmented Reality
- Monitor-Based Technology
- Near Eye Based Technology
On the basis of technology, the Asia-Pacific augmented reality (AR) & mixed reality (MR) market has been segmented into mobile augmented reality, monitor-based technology, and near eye based technology.
By Application
- Banking, Financial Services, and Insurance (BFSI)
- Workflow Optimization
- Marketing Collaboration
- Enhanced 2-D And 3-D
- Visualizations
- 3d Modelling
- Documentation
- Navigation
On the basis of application, the Asia-Pacific augmented reality (AR) & mixed reality (MR) market has been segmented into workflow optimization, marketing collaboration, enhanced 2-D and 3-D, visualizations, 3D modeling, documentation, and navigation.
By End User
- Banking, Financial Services And Insurance (BFSI)
- Retail And E-Commerce
- IT And Telecommunication
- Automotive
- Aerospace And Defense
- Healthcare
- Animation
- Travel And Tourism
- Energy
- Media And Entertainment
- Education
- Construction
- Games And Sports
- Banking
- Others
On the basis of end user, the Asia-Pacific augmented reality (AR) & mixed reality (MR) market is segmented into retail and e-commerce, IT and telecommunication, automotive, aerospace and defense, healthcare, travel and tourism, energy, media and entertainment, education, construction, games and sports, banking and others.
Asia-Pacific Augmented Reality (AR) & Mixed Reality (MR) Market Regional Analysis/Insights
Asia-Pacific augmented reality (AR) & mixed reality (MR) market is analyzed, and market size insights and trends are provided by country, component, deployment model, distribution channel, device type, technology, application, and end-user as referenced above.
Asia-Pacific augmented reality (AR) & mixed reality (MR) market covers countries such as China, Japan, South Korea, Australia, India, Taiwan, Thailand, Singapore, Malaysia, Vietnam, New Zealand, Indonesia, Philippines, Rest of Asia Pacific.
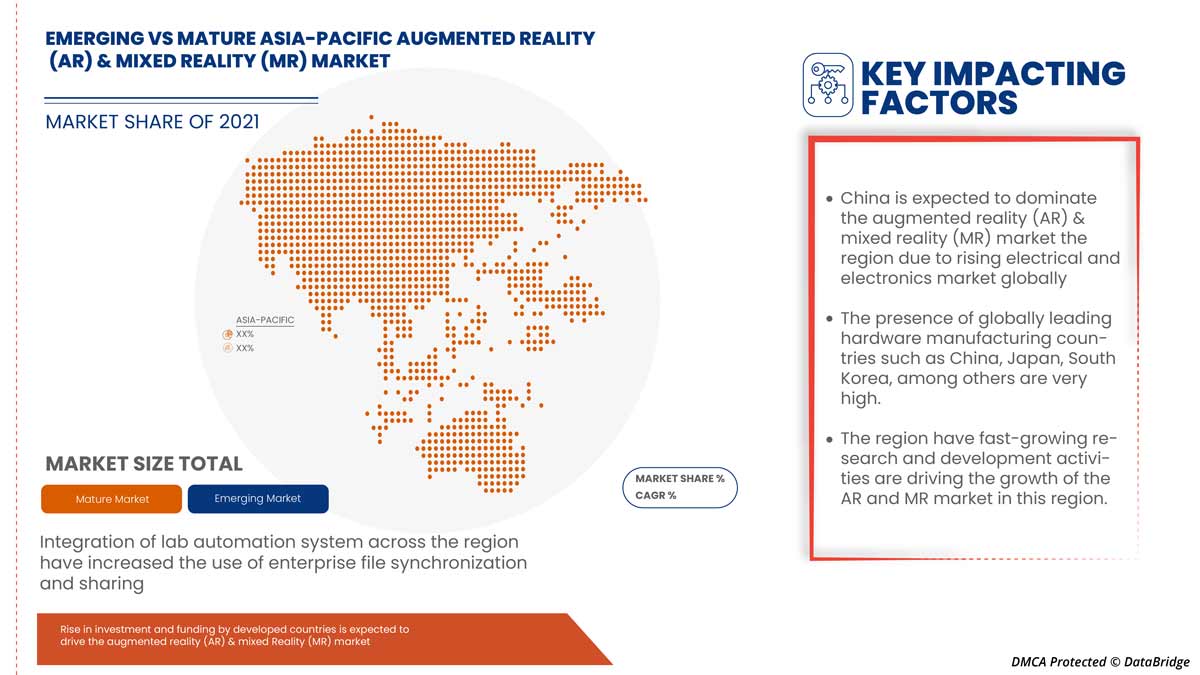
China is expected to dominate the Asia-Pacific augmented reality (AR) & mixed reality (MR) market to rise in the adoption of cloud-based solutions and emerging potential markets. However, stringent government regulations and emphasis of businesses on security aspects of corporate data, especially in developing countries, including India, Japan, China, and Indonesia, have led to the huge growth of the Asia-Pacific augmented reality (AR) & mixed reality (MR) market.
The country section of the Asia-Pacific augmented reality (AR) & mixed reality (MR) market report also provides individual market impacting factors and changes in regulations in the market domestically that impact the current and future trends of the market. Data points such as new sales, replacement sales, country demographics, disease epidemiology, and import-export tariffs are some of the significant pointers used to forecast the market scenario for individual countries. Also, the presence and availability of Asia-Pacific brands and their challenges faced due to large or scarce competition from local and domestic brands and the impact of sales channels are considered while providing forecast analysis of the country data.
Competitive Landscape and Augmented Reality (AR) & Mixed Reality (MR) Market Share Analysis
Asia-Pacific augmented reality (AR) & mixed reality (MR) market competitive landscape provides details of the competitor. Details included are company overview, company financials, revenue generated, market potential, investment in research and development, new market initiatives, global presence, production sites and facilities, production capacities, company strengths and weaknesses, solution launch, product width and breadth, application dominance. The above data points are only related to the companies focus on the Asia-Pacific augmented reality (AR) & mixed reality (MR) market.
Some of the major players operating in the Asia-Pacific augmented reality (AR) & mixed reality (MR) market are HP Development Company, LP, HTC Corporation, Autodesk Inc., Barco, Intel Corporation, PTC, Seiko Epson Corporation, Ultraleap Limited, ASUSTek Computer Inc., Dell, Google (a subsidiary of Alphabet Inc.), Sony Corporation, Lenovo, Microsoft, SAMSUNG ELECTRONICS CO., LTD., Panasonic Corporation, RealWear, Inc., Magic Leap, Inc., EON Reality, and TeamViewer among others.
SKU-

- Interactive Data Analysis Dashboard
- Company Analysis Dashboard for high growth potential opportunities
- Research Analyst Access for customization & queries
- Competitor Analysis with Interactive dashboard
- Latest News, Updates & Trend analysis
- Harness the Power of Benchmark Analysis for Comprehensive Competitor Tracking
Table of Content
1 INTRODUCTION
1.1 OBJECTIVES OF THE STUDY
1.2 MARKET DEFINITION
1.3 OVERVIEW OF ASIA PACIFIC AUGMENTED REALITY (AR) & MIXED REALITY (MR) MARKET
1.4 CURRENCY AND PRICING
1.5 LIMITATIONS
1.6 MARKETS COVERED
2 MARKET SEGMENTATION
2.1 MARKETS COVERED
2.2 GEOGRAPHICAL SCOPE
2.3 YEARS CONSIDERED FOR THE STUDY
2.4 DBMR TRIPOD DATA VALIDATION MODEL
2.5 PRIMARY INTERVIEWS WITH KEY OPINION LEADERS
2.6 DBMR MARKET POSITION GRID
2.7 VENDOR SHARE ANALYSIS
2.8 MULTIVARIATE MODELING
2.9 COMPONENT TIMELINE CURVE
2.1 MARKET APPLICATION COVERAGE GRID
2.11 SECONDARY SOURCES
2.12 ASSUMPTIONS
3 EXECUTIVE SUMMARY
4 PREMIUM INSIGHTS
4.1 REGULATIONS
4.1.1 IEEE STANDARDS
4.2 POST COVID
4.3 MARKETING
4.4 PRICING ANALYSIS/PRICE SENSITIVITY
4.5 KOREAN CONTENT'S POPULARITY
5 MARKET OVERVIEW
5.1 DRIVERS
5.1.1 INCREASING PENETRATION OF SMART DEVICES AND INTERNET SERVICES
5.1.2 RISE IN ADOPTION OF AUGMENTED REALITY BY EDUCATIONAL INSTITUTES
5.1.3 INCREASING FOCUS ON CYBER-PHYSICAL SYSTEMS
5.1.4 MORE OF TECHNOLOGICAL ADVANCEMENT AND DIGITIZATION
5.2 RESTRAINTS
5.2.1 STRINGENT REGULATIONS OF GOVERNMENT FOR VARIED ORGANIZATIONS
5.2.2 LOSS OF DATA AND PRIVACY
5.3 OPPORTUNITIES
5.3.1 INCREASED DEPLOYMENT OF AR AND MR TECHNOLOGY IN NUMEROUS INDUSTRIES
5.3.2 INCREASE IN VARIOUS STRATEGIC DECISIONS SUCH AS PARTNERSHIP AND ACQUISITION
5.3.3 DEVELOPMENT OF HARDWARE WITH FASTER PROCESSING SPEEDS
5.3.4 RISE IN INVESTMENT AND FUNDING BY DEVELOPED COUNTRIES
5.4 CHALLENGES
5.4.1 ASIA PACIFIC ECONOMIC SLOWDOWN LIMITS THE MARKET DEVELOPMENT
5.4.2 COMPLICATIONS WHILE OPERATING AUGMENTED REALITY (AR) & MIXED REALITY (MR) BASED PRODUCT
6 ASIA PACIFIC AUGMENTED REALITY (AR) & MIXED REALITY (MR) MARKET, BY COMPONENT
6.1 OVERVIEW
6.2 HARDWARE
6.2.1 DISPLAYS AND PROJECTORS
6.2.2 CAMERAS
6.2.3 CONTROLLER AND PROCESSOR
6.2.4 SENSORS
6.2.4.1 ACCELEROMETERS
6.2.4.2 GYROSCOPES
6.2.5 PROXIMITY SENSORS
6.2.6 MAGNETOMETERS
6.2.7 OTHERS
6.2.8 POSITION TRACKERS
6.2.9 OTHERS
6.3 SOFTWARE
6.4 SERVICES
6.4.1 IMPLEMENTATION
6.4.2 SUPPORT AND MAINTENANCE
6.4.3 TRAINING
7 ASIA PACIFIC AUGMENTED REALITY (AR) & MIXED REALITY (MR) MARKET, BY DEPLOYMENT MODEL
7.1 OVERVIEW
7.2 CLOUD
7.3 ON-PREMISE
8 ASIA PACIFIC AUGMENTED REALITY (AR) & MIXED REALITY (MR) MARKET, BY DEVICE TYPE
8.1 OVERVIEW
8.2 HEAD MOUNTED DISPLAY
8.2.1 SMART GLASSES
8.2.2 SMART HELMET
8.3 HEAD UP DISPLAY
8.4 PROJECTOR & DISPLAY WALLS
8.5 GESTURE-TRACKING DEVICES
9 ASIA PACIFIC AUGMENTED REALITY (AR) & MIXED REALITY (MR) MARKET, BY TECHNOLOGY
9.1 OVERVIEW
9.2 MOBILE AUGMENTED REALITY
9.3 MONITOR-BASED TECHNOLOGY
9.4 NEAR EYE BASED TECHNOLOGY
10 ASIA PACIFIC AUGMENTED REALITY (AR) & MIXED REALITY (MR) MARKET, BY DISTRIBUTION CHANNEL
10.1 OVERVIEW
10.2 OFFLINE
10.3 ONLINE
11 ASIA PACIFIC AUGMENTED REALITY (AR) & MIXED REALITY (MR) MARKET, BY APPLICATION
11.1 OVERVIEW
11.2 WORKFLOW OPTIMIZATION
11.3 ENHANCED 2-D AND 3-D
11.4 VISUALIZATIONS
11.5 MARKETING COLLABORATION
11.6 3D MODELING
11.7 DOCUMENTATION
11.8 NAVIGATION
12 ASIA PACIFIC AUGMENTED REALITY (AR) & MIXED REALITY (MR) MARKET, BY END USER
12.1 OVERVIEW
12.2 MEDIA AND ENTERTAINMENT
12.2.1 BROADCAST
12.2.2 MUSIC
12.2.3 ART GALLERIES AND EXHIBITIONS
12.2.4 MUSEUMS
12.2.5 THEME PARKS
12.3 GAMES AND SPORTS
12.4 RETAIL AND E-COMMERCE
12.4.1 JEWELLERY
12.4.2 BEAUTY AND COSMETICS
12.4.3 APPAREL FITTING
12.4.4 GROCERY SHOPPING
12.4.5 FOOTWEAR
12.4.6 FURNITURE AND LIGHTING DESIGN
12.5 TRAVEL AND TOURISM
12.6 HEALTHCARE
12.6.1 SURGERY
12.6.2 FITNESS MANAGEMENT
12.6.3 PATIENT CARE MANAGEMENT
12.6.4 PHARMACY MANAGEMENT
12.6.5 OTHERS
12.7 ANIMATION
12.7.1 CHARACTER
12.7.2 CARTOON
12.8 AEROSPACE AND DEFENSE
12.9 AUTOMOTIVE
12.1 CONSTRUCTION
12.11 EDUCATION
12.12 BANKING
12.13 ENERGY
12.14 IT AND TELECOMMUNICATION
12.15 OTHERS
13 ASIA PACIFIC AUGMENTED REALITY (AR) & MIXED REALITY (MR) MARKET, BY REGION
13.1 ASIA-PACIFIC
14 ASIA PACIFIC AUGMENTED REALITY (AR) & MIXED REALITY (MR) MARKET, COMPANY LANDSCAPE
14.1 COMPANY SHARE ANALYSIS: ASIA PACIFIC
15 SWOT ANALYSIS
16 COMPANY PROFILE
16.1 MICROSOFT
16.1.1 COMPANY SNAPSHOT
16.1.2 REVENUE ANALYSIS
16.1.3 COMPANY SHARE ANALYSIS
16.1.4 PRODUCTS PORTFOLIO
16.1.5 RECENT DEVELOPMENTS
16.2 GOOGLE (A SUBSIDIARY OF ALPHABET INC.)
16.2.1 COMPANY SNAPSHOT
16.2.2 REVENUE ANALYSIS
16.2.3 COMPANY SHARE ANALYSIS
16.2.4 PRODUCTS PORTFOLIO
16.2.5 RECENT DEVELOPMENTS
16.3 SAMSUNG ELECTRONICS CO., LTD.
16.3.1 COMPANY SNAPSHOT
16.3.2 REVENUE ANALYSIS
16.3.3 COMPANY SHARE ANALYSIS
16.3.4 PRODUCT PORTFOLIO
16.3.5 RECENT DEVELOPMENTS
16.4 PANASONIC CORPORATION
16.4.1 COMPANY SNAPSHOT
16.4.2 REVENUE ANALYSIS
16.4.3 COMPANY SHARE ANALYSIS
16.4.4 PRODUCTS PORTFOLIO
16.4.5 RECENT DEVELOPMENTS
16.5 DELL
16.5.1 COMPANY SNAPSHOT
16.5.2 REVENUE ANALYSIS
16.5.3 PRODUCTS PORTFOLIO
16.5.4 RECENT DEVELOPMENTS
16.6 LENOVO
16.6.1 COMPANY SNAPSHOT
16.6.2 REVENUE ANALYSIS
16.6.3 PRODUCTS PORTFOLIO
16.6.4 RECENT DEVELOPMENT
16.7 AUTODESK INC.
16.7.1 COMPANY SNAPSHOT
16.7.2 REVENUE ANALYSIS
16.7.3 PRODUCTS PORTFOLIO
16.7.4 RECENT DEVELOPMENTS
16.8 ASUSTEK COMPUTER INC.
16.8.1 COMPANY SNAPSHOT
16.8.2 REVENUE ANALYSIS
16.8.3 PRODUCT PORTFOLIO
16.8.4 RECENT DEVELOPMENT
16.9 BARCO
16.9.1 COMPANY SNAPSHOT
16.9.2 REVENUE ANALYSIS
16.9.3 PRODUCT PORTFOLIO
16.9.4 RECENT DEVELOPMENTS
16.1 EON REALITY
16.10.1 COMPANY SNAPSHOT
16.10.2 PRODUCT PORTFOLIO
16.10.3 RECENT DEVELOPMENTS
16.11 HP DEVELOPMENT COMPANY, L.P.
16.11.1 COMPANY SNAPSHOT
16.11.2 REVENUE ANALYSIS
16.11.3 PRODUCTS PORTFOLIO
16.11.4 RECENT DEVELOPMENTS
16.12 HTC CORPORATION
16.12.1 COMPANY SNAPSHOT
16.12.2 REVENUE ANALYSIS
16.12.3 PRODUCT PORTFOLIO
16.12.4 RECENT DEVELOPMENTS
16.13 INTEL CORPORATION
16.13.1 COMPANY SNAPSHOT
16.13.2 REVENUE ANALYSIS
16.13.3 PRODUCT PORTFOLIO
16.13.4 RECENT DEVELOPMENTS
16.14 MAGIC LEAP, INC.
16.14.1 COMPANY SNAPSHOT
16.14.2 PRODUCT PORTFOLIO
16.14.3 RECENT DEVELOPMENTS
16.15 PTC
16.15.1 COMPANY SNAPSHOT
16.15.2 REVENUE ANALYSIS
16.15.3 PRODUCTS PORTFOLIO
16.15.4 RECENT DEVELOPMENT
16.16 REALWEAR, INC.
16.16.1 COMPANY SNAPSHOT
16.16.2 PRODUCT PORTFOLIO
16.16.3 RECENT DEVELOPMENTS
16.17 SEIKO EPSON CORPORATION
16.17.1 COMPANY SNAPSHOT
16.17.2 REVENUE ANALYSIS
16.17.3 PRODUCT PORTFOLIO
16.17.4 RECENT DEVELOPMENTS
16.18 SONY CORPORATION
16.18.1 COMPANY SNAPSHOT
16.18.2 REVENUE ANALYSIS
16.18.3 PRODUCTS PORTFOLIO
16.18.4 RECENT DEVELOPMENT
16.19 TEAMVIEWER
16.19.1 COMPANY SNAPSHOT
16.19.2 REVENUE ANALYSIS
16.19.3 PRODUCT PORTFOLIO
16.19.4 RECENT DEVELOPMENTS
16.2 ULTRALEAP LIMITED
16.20.1 COMPANY SNAPSHOT
16.20.2 PRODUCT PORTFOLIO
16.20.3 RECENT DEVELOPMENT
17 QUESTIONNAIRE
18 RELATED REPORTS
List of Table
TABLE 1 AVERAGE DEVELOPMENT TIME AND COST FOR AR:
TABLE 2 ASIA PACIFIC AUGMENTED REALITY (AR) & MIXED REALITY (MR) MARKET, BY COMPONENT, 2020-2029 (USD MILLION)
TABLE 3 ASIA PACIFIC HARDWARE IN AUGMENTED REALITY (AR) & MIXED REALITY (MR) MARKET, BY REGION, 2020-2029 (USD MILLION)
TABLE 4 ASIA PACIFIC HARDWARE IN AUGMENTED REALITY (AR) & MIXED REALITY (MR) MARKET, BY TYPE 2020-2029 (USD MILLION)
TABLE 5 ASIA PACIFIC SENSORS IN AUGMENTED REALITY (AR) & MIXED REALITY (MR) MARKET, BY TYPE 2020-2029 (USD MILLION)
TABLE 6 ASIA PACIFIC SOFTWARE IN AUGMENTED REALITY (AR) & MIXED REALITY (MR) MARKET, BY REGION, 2020-2029 (USD MILLION)
TABLE 7 ASIA PACIFIC SERVICES IN AUGMENTED REALITY (AR) & MIXED REALITY (MR) MARKET, BY REGION, 2020-2029 (USD MILLION)
TABLE 8 ASIA PACIFIC SERVICES IN AUGMENTED REALITY (AR) & MIXED REALITY (MR) MARKET, BY TYPE 2020-2029 (USD MILLION)
TABLE 9 ASIA PACIFIC AUGMENTED REALITY (AR) & MIXED REALITY (MR) MARKET, BY DEPLOYMENT MODEL, 2020-2029 (USD MILLION)
TABLE 10 ASIA PACIFIC CLOUD IN AUGMENTED REALITY (AR) & MIXED REALITY (MR) MARKET, BY REGION, 2020-2029 (USD MILLION)
TABLE 11 ASIA PACIFIC ON-PREMISE IN AUGMENTED REALITY (AR) & MIXED REALITY (MR) MARKET, BY REGION, 2020-2029 (USD MILLION)
TABLE 12 ASIA PACIFIC AUGMENTED REALITY (AR) & MIXED REALITY (MR) MARKET, BY DEVICE TYPE, 2020-2029 (USD MILLION)
TABLE 13 ASIA PACIFIC HEAD MOUNTED DISPLAY IN AUGMENTED REALITY (AR) & MIXED REALITY (MR) MARKET, BY REGION, 2020-2029 (USD MILLION)
TABLE 14 ASIA PACIFIC HEAD MOUNTED DISPLAY IN AUGMENTED REALITY (AR) & MIXED REALITY (MR) MARKET, BY TYPE, 2020-2029 (USD MILLION)
TABLE 15 ASIA PACIFIC HEAD UP DISPLAY IN AUGMENTED REALITY (AR) & MIXED REALITY (MR) MARKET, BY REGION, 2020-2029 (USD MILLION)
TABLE 16 ASIA PACIFIC PROJECTORS & DISPLAY WALLS IN AUGMENTED REALITY (AR) & MIXED REALITY (MR) MARKET, BY REGION, 2020-2029 (USD MILLION)
TABLE 17 ASIA PACIFIC GESTURE-TRACKING DEVICES IN AUGMENTED REALITY (AR) & MIXED REALITY (MR) MARKET, BY REGION, 2020-2029 (USD MILLION)
TABLE 18 ASIA PACIFIC AUGMENTED REALITY (AR) & MIXED REALITY (MR) MARKET, BY TECHNOLOGY, 2020-2029 (USD MILLION)
TABLE 19 ASIA PACIFIC MOBILE AUGMENTED REALITY IN AUGMENTED REALITY (AR) & MIXED REALITY (MR) MARKET, BY REGION, 2020-2029 (USD MILLION)
TABLE 20 ASIA PACIFIC MONITOR-BASED TECHNOLOGY IN AUGMENTED REALITY (AR) & MIXED REALITY (MR) MARKET, BY REGION, 2020-2029 (USD MILLION)
TABLE 21 ASIA PACIFIC NEAR EYE BASED TECHNOLOGY IN AUGMENTED REALITY (AR) & MIXED REALITY (MR) MARKET, BY REGION, 2020-2029 (USD MILLION)
TABLE 22 ASIA PACIFIC AUGMENTED REALITY (AR) & MIXED REALITY (MR) MARKET, BY DISTRIBUTION CHANNEL, 2020-2029 (USD MILLION)
TABLE 23 ASIA PACIFIC OFFLINE IN AUGMENTED REALITY (AR) & MIXED REALITY (MR) MARKET, BY REGION, 2020-2029 (USD MILLION)
TABLE 24 ASIA PACIFIC ONLINE IN AUGMENTED REALITY (AR) & MIXED REALITY (MR) MARKET, BY REGION, 2020-2029 (USD MILLION)
TABLE 25 ASIA PACIFIC AUGMENTED REALITY (AR) & MIXED REALITY (MR) MARKET, BY APPLICATION, 2020-2029 (USD MILLION)
TABLE 26 ASIA PACIFIC WORKFLOW OPTIMIZATION IN AUGMENTED REALITY (AR) & MIXED REALITY (MR) MARKET, BY REGION, 2020-2029 (USD MILLION)
TABLE 27 ASIA PACIFIC ENHANCED 2-D AND 3-D IN AUGMENTED REALITY (AR) & MIXED REALITY (MR) MARKET, BY REGION, 2020-2029 (USD MILLION)
TABLE 28 ASIA PACIFIC VISUALIZATIONS IN AUGMENTED REALITY (AR) & MIXED REALITY (MR) MARKET, BY REGION, 2020-2029 (USD MILLION)
TABLE 29 ASIA PACIFIC MARKETING COLLABORATION IN AUGMENTED REALITY (AR) & MIXED REALITY (MR) MARKET, BY REGION, 2020-2029 (USD MILLION)
TABLE 30 ASIA PACIFIC 3D MODELING IN AUGMENTED REALITY (AR) & MIXED REALITY (MR) MARKET, BY REGION, 2020-2029 (USD MILLION)
TABLE 31 ASIA PACIFIC DOCUMENTATION IN AUGMENTED REALITY (AR) & MIXED REALITY (MR) MARKET, BY APPLICATION, 2020-2029 (USD MILLION)
TABLE 32 ASIA PACIFIC NAVIGATION IN AUGMENTED REALITY (AR) & MIXED REALITY (MR) MARKET, BY REGION, 2020-2029 (USD MILLION)
TABLE 33 ASIA PACIFIC AUGMENTED REALITY (AR) & MIXED REALITY (MR) MARKET, BY END USER, 2020-2029 (USD MILLION)
TABLE 34 ASIA PACIFIC MEDIA AND ENTERTAINMENT IN AUGMENTED REALITY (AR) & MIXED REALITY (MR) MARKET, BY REGION, 2020-2029 (USD MILLION)
TABLE 35 ASIA PACIFIC MEDIA AND ENTERTAINMENT IN AUGMENTED REALITY (AR) & MIXED REALITY (MR) MARKET, BY TYPE, 2020-2029 (USD MILLION)
TABLE 36 ASIA PACIFIC GAMES AND SPORTS IN AUGMENTED REALITY (AR) & MIXED REALITY (MR) MARKET, BY REGION, 2020-2029 (USD MILLION)
TABLE 37 ASIA PACIFIC RETAIL AND E-COMMERCE IN AUGMENTED REALITY (AR) & MIXED REALITY (MR) MARKET, BY REGION, 2020-2029 (USD MILLION)
TABLE 38 ASIA PACIFIC RETAIL AND E-COMMERCE IN AUGMENTED REALITY (AR) & MIXED REALITY (MR) MARKET, BY TYPE, 2020-2029 (USD MILLION)
TABLE 39 ASIA PACIFIC TRAVEL AND TOURISM IN AUGMENTED REALITY (AR) & MIXED REALITY (MR) MARKET, BY REGION, 2020-2029 (USD MILLION)
TABLE 40 ASIA PACIFIC HEALTHCARE IN AUGMENTED REALITY (AR) & MIXED REALITY (MR) MARKET, BY REGION, 2020-2029 (USD MILLION)
TABLE 41 ASIA PACIFIC HEALTHCARE IN AUGMENTED REALITY (AR) & MIXED REALITY (MR) MARKET, BY TYPE, 2020-2029 (USD MILLION)
TABLE 42 ASIA PACIFIC ANIMATION IN AUGMENTED REALITY (AR) & MIXED REALITY (MR) MARKET, BY REGION, 2020-2029 (USD MILLION)
TABLE 43 ASIA PACIFIC ANIMATION IN AUGMENTED REALITY (AR) & MIXED REALITY (MR) MARKET, BY TYPE, 2020-2029 (USD MILLION)
TABLE 44 ASIA PACIFIC AEROSPACE AND DEFENSE IN AUGMENTED REALITY (AR) & MIXED REALITY (MR) MARKET, BY REGION, 2020-2029 (USD MILLION)
TABLE 45 ASIA PACIFIC AUTOMOTIVE IN AUGMENTED REALITY (AR) & MIXED REALITY (MR) MARKET, BY REGION, 2020-2029 (USD MILLION)
TABLE 46 ASIA PACIFIC CONSTRUCTION IN AUGMENTED REALITY (AR) & MIXED REALITY (MR) MARKET, BY REGION, 2020-2029 (USD MILLION)
TABLE 47 ASIA PACIFIC EDUCATION IN AUGMENTED REALITY (AR) & MIXED REALITY (MR) MARKET, BY REGION, 2020-2029 (USD MILLION)
TABLE 48 ASIA PACIFIC BANKING IN AUGMENTED REALITY (AR) & MIXED REALITY (MR) MARKET, BY REGION, 2020-2029 (USD MILLION)
TABLE 49 ASIA PACIFIC ENERGY IN AUGMENTED REALITY (AR) & MIXED REALITY (MR) MARKET, BY REGION, 2020-2029 (USD MILLION)
TABLE 50 ASIA PACIFIC IT AND TELECOMMUNICATION IN AUGMENTED REALITY (AR) & MIXED REALITY (MR) MARKET, BY REGION, 2020-2029 (USD MILLION)
TABLE 51 ASIA PACIFIC OTHERS IN AUGMENTED REALITY (AR) & MIXED REALITY (MR) MARKET, BY REGION, 2020-2029 (USD MILLION)
TABLE 52 ASIA-PACIFIC AUGMENTED REALITY (AR) & MIXED REALITY (MR) MARKET, BY COMPONENT, 2020-2029 (USD MILLION)
TABLE 53 ASIA-PACIFIC HARDWARE IN AUGMENTED REALITY (AR) & MIXED REALITY (MR) MARKET, BY TYPE, 2020-2029 (USD MILLION)
TABLE 54 ASIA-PACIFIC SENSORS IN AUGMENTED REALITY (AR) & MIXED REALITY (MR) MARKET, BY TYPE, 2020-2029 (USD MILLION)
TABLE 55 ASIA-PACIFIC SERVICES IN AUGMENTED REALITY (AR) & MIXED REALITY (MR) MARKET, BY TYPE, 2020-2029 (USD MILLION)
TABLE 56 ASIA-PACIFIC AUGMENTED REALITY (AR) & MIXED REALITY (MR) MARKET, BY DEPLOYMENT MODEL, 2020-2029 (USD MILLION)
TABLE 57 ASIA-PACIFIC AUGMENTED REALITY (AR) & MIXED REALITY (MR) MARKET, BY DISTRIBUTION CHANNEL, 2020-2029 (USD MILLION)
TABLE 58 ASIA-PACIFIC AUGMENTED REALITY (AR) & MIXED REALITY (MR) MARKET, BY DEVICE TYPE, 2020-2029 (USD MILLION)
TABLE 59 ASIA-PACIFIC HEAD MOUNTED DISPLAY IN AUGMENTED REALITY (AR) & MIXED REALITY (MR) MARKET, BY TYPE, 2020-2029 (USD MILLION)
TABLE 60 ASIA-PACIFIC AUGMENTED REALITY (AR) & MIXED REALITY (MR) MARKET, BY TECHNOLOGY, 2020-2029 (USD MILLION)
TABLE 61 ASIA-PACIFIC AUGMENTED REALITY (AR) & MIXED REALITY (MR) MARKET, BY APPLICATION, 2020-2029 (USD MILLION)
TABLE 62 ASIA-PACIFIC AUGMENTED REALITY (AR) & MIXED REALITY (MR) MARKET, BY END USER, 2020-2029 (USD MILLION)
TABLE 63 ASIA-PACIFIC MEDIA AND ENTERTAINMENT IN AUGMENTED REALITY (AR) & MIXED REALITY (MR) MARKET, BY TYPE, 2020-2029 (USD MILLION)
TABLE 64 ASIA-PACIFIC RETAIL AND E-COMMERCE IN AUGMENTED REALITY (AR) & MIXED REALITY (MR) MARKET, BY TYPE, 2020-2029 (USD MILLION)
TABLE 65 ASIA-PACIFIC HEALTHCARE IN AUGMENTED REALITY (AR) & MIXED REALITY (MR) MARKET, BY TYPE, 2020-2029 (USD MILLION)
TABLE 66 ASIA-PACIFIC ANIMATION IN AUGMENTED REALITY (AR) & MIXED REALITY (MR) MARKET, BY TYPE, 2020-2029 (USD MILLION)
List of Figure
FIGURE 1 ASIA PACIFIC AUGMENTED REALITY (AR) & MIXED REALITY (MR) MARKET: SEGMENTATION
FIGURE 2 ASIA PACIFIC AUGMENTED REALITY (AR) & MIXED REALITY (MR) MARKET: DATA TRIANGULATION
FIGURE 3 ASIA PACIFIC AUGMENTED REALITY (AR) & MIXED REALITY (MR) MARKET: DROC ANALYSIS
FIGURE 4 ASIA PACIFIC AUGMENTED REALITY (AR) & MIXED REALITY (MR) MARKET: ASIA PACIFIC VS REGIONAL MARKET ANALYSIS
FIGURE 5 ASIA PACIFIC AUGMENTED REALITY (AR) & MIXED REALITY (MR) MARKET: COMPANY RESEARCH ANALYSIS
FIGURE 6 ASIA PACIFIC AUGMENTED REALITY (AR) & MIXED REALITY (MR) MARKET: INTERVIEW DEMOGRAPHICS
FIGURE 7 ASIA PACIFIC AUGMENTED REALITY (AR) & MIXED REALITY (MR) MARKET: DBMR MARKET POSITION GRID
FIGURE 8 ASIA PACIFIC AUGMENTED REALITY (AR) & MIXED REALITY (MR) MARKET: VENDOR SHARE ANALYSIS
FIGURE 9 ASIA PACIFIC AUGMENTED REALITY (AR) & MIXED REALITY (MR) MARKET: MULTIVARIATE MODELING
FIGURE 10 ASIA PACIFIC AUGMENTED REALITY (AR) & MIXED REALITY (MR) MARKET: COMPONENT TIMELINE CURVE
FIGURE 11 ASIA PACIFIC AUGMENTED REALITY (AR) & MIXED REALITY (MR) MARKET: MARKET APPLICATION COVERAGE GRID
FIGURE 12 ASIA PACIFIC AUGMENTED REALITY (AR) & MIXED REALITY (MR) MARKET: SEGMENTATION
FIGURE 13 INCREASING PENETRATION OF SMART DEVICES AND INTERNET SERVICES IS EXPECTED TO DRIVE ASIA PACIFIC AUGMENTED REALITY (AR) & MIXED REALITY (MR) MARKET IN THE FORECAST PERIOD OF 2022 TO 2029
FIGURE 14 THE HARDWARE SEGMENT IS EXPECTED TO ACCOUNT FOR THE LARGEST SHARE OF THE ASIA PACIFIC AUGMENTED REALITY (AR) & MIXED REALITY (MR) MARKET FROM 2022 TO 2029
FIGURE 15 NORTH AMERICA IS EXPECTED TO DOMINATE, AND ASIA-PACIFIC IS THE FASTEST-GROWING REGION IN THE ASIA PACIFIC AUGMENTED REALITY (AR) & MIXED REALITY (MR) MARKET IN THE FORECAST PERIOD OF 2022 TO 2029
FIGURE 16 DRIVERS, RESTRAINTS, OPPORTUNITIES, AND CHALLENGES OF THE ASIA PACIFIC AUGMENTED REALITY (AR) & MIXED REALITY (MR) MARKET
FIGURE 17 ASIA PACIFIC AUGMENTED REALITY (AR) & MIXED REALITY (MR) MARKET: BY COMPONENT, 2021
FIGURE 18 ASIA PACIFIC AUGMENTED REALITY (AR) & MIXED REALITY (MR) MARKET: BY DEPLOYMENT MODEL, 2021
FIGURE 19 ASIA PACIFIC AUGMENTED REALITY (AR) & MIXED REALITY (MR) MARKET: BY DEVICE TYPE, 2021
FIGURE 20 ASIA PACIFIC AUGMENTED REALITY (AR) & MIXED REALITY (MR) MARKET: BY TECHNOLOGY, 2021
FIGURE 21 ASIA PACIFIC AUGMENTED REALITY (AR) & MIXED REALITY (MR) MARKET: BY DISTRIBUTION CHANNEL, 2021
FIGURE 22 ASIA PACIFIC AUGMENTED REALITY (AR) & MIXED REALITY (MR) MARKET: BY APPLICATION, 2021
FIGURE 23 ASIA PACIFIC AUGMENTED REALITY (AR) & MIXED REALITY (MR) MARKET: BY END USER, 2021
FIGURE 24 ASIA-PACIFIC AUGMENTED REALITY (AR) & MIXED REALITY (MR) MARKET: SNAPSHOT (2021)
FIGURE 25 ASIA-PACIFIC AUGMENTED REALITY (AR) & MIXED REALITY (MR) MARKET: BY COMPONENT (2022 & 2029)
FIGURE 26 ASIA PACIFIC AUGMENTED REALITY (AR) & MIXED REALITY (MR) MARKET: COMPANY SHARE 2021(%)
Data collection and base year analysis are done using data collection modules with large sample sizes. The stage includes obtaining market information or related data through various sources and strategies. It includes examining and planning all the data acquired from the past in advance. It likewise envelops the examination of information inconsistencies seen across different information sources. The market data is analysed and estimated using market statistical and coherent models. Also, market share analysis and key trend analysis are the major success factors in the market report. To know more, please request an analyst call or drop down your inquiry.
The key research methodology used by DBMR research team is data triangulation which involves data mining, analysis of the impact of data variables on the market and primary (industry expert) validation. Data models include Vendor Positioning Grid, Market Time Line Analysis, Market Overview and Guide, Company Positioning Grid, Patent Analysis, Pricing Analysis, Company Market Share Analysis, Standards of Measurement, Global versus Regional and Vendor Share Analysis. To know more about the research methodology, drop in an inquiry to speak to our industry experts.
Data Bridge Market Research is a leader in advanced formative research. We take pride in servicing our existing and new customers with data and analysis that match and suits their goal. The report can be customized to include price trend analysis of target brands understanding the market for additional countries (ask for the list of countries), clinical trial results data, literature review, refurbished market and product base analysis. Market analysis of target competitors can be analyzed from technology-based analysis to market portfolio strategies. We can add as many competitors that you require data about in the format and data style you are looking for. Our team of analysts can also provide you data in crude raw excel files pivot tables (Fact book) or can assist you in creating presentations from the data sets available in the report.


