
Asia Pacific Gummy Candy Market
Market Size in USD Billion
CAGR :
% 
 USD
4.00 Billion
USD
5.95 Billion
2025
2033
USD
4.00 Billion
USD
5.95 Billion
2025
2033
| 2026 –2033 | |
| USD 4.00 Billion | |
| USD 5.95 Billion | |
| % | |
|
Asia-Pacific Gummy Candy Market Size
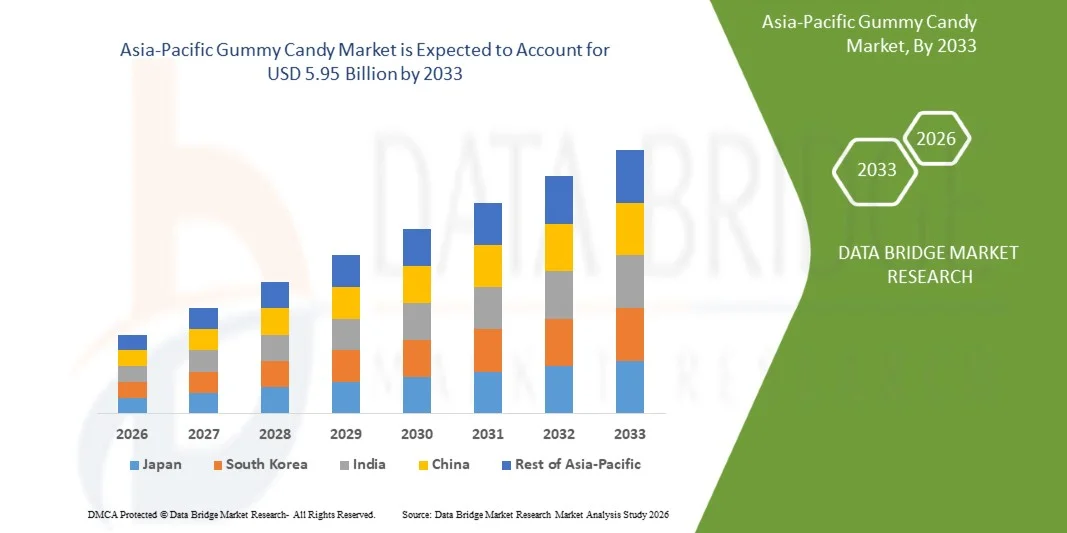
- The Asia-Pacific gummy candy market size was valued at USD 4.00 billion in 2025 and is expected to reach USD 5.95 billion by 2033, at a CAGR of 5.5% during the forecast period
- The market is fueled by increasing consumer preference for convenient, indulgent, and flavorful confectionery products, particularly among millennials and Gen Z consumers. Rising demand for innovative flavors, functional gummies (such as vitamin-infused and low-sugar variants), and clean-label products has significantly supported expansion.
- Additionally, strong retail penetration across supermarkets, convenience stores, and e-commerce platforms has improved product accessibility. Seasonal demand spikes during holidays and festive occasions further contribute to sales growth. Moreover, continuous product innovation in texture, packaging, and plant-based formulations is attracting health-conscious consumers, thereby sustaining steady market expansion across Asia-Pacific
Asia-Pacific Gummy Candy Market Analysis
- The market includes traditional sugar-based gummies as well as functional, organic, and sugar-free variants developed to meet evolving consumer preferences. Functional gummies may contain added vitamins, minerals, collagen, probiotics, or other nutraceutical ingredients. The market also covers flavored variants such as fruit, sour, and mixed flavors, distributed through both online and offline retail channels
- With increasing consumer demand for innovative confectionery products, clean-label ingredients, reduced-sugar alternatives, and functional treats, gummy candy manufacturers are focusing on product differentiation, premiumization, and health-oriented formulations. As a result, the market continues to expand across developed and emerging economies
- China dominated the Asia-Pacific gummy candy market with the largest revenue share of 33.61% in 2025, supported by its well-established confectionery industry, high per capita consumption of sugar confectionery products, and strong presence of leading players such as Mars, Incorporated, Mondelez International, and Haribo. The country benefits from an extensive retail distribution network spanning supermarkets, convenience stores, and online platforms, enabling wide product availability and rapid new product penetration. Additionally, continuous product innovation in functional gummies, organic and low-sugar variants, and vitamin-infused offerings has expanded the consumer base beyond children to include adults seeking better-for-you indulgence options.
- India is expected to be the fastest-growing region with CAGR of 5.8% in the Asia-Pacific gummy candy market during the forecast period, driven by several converging factors that are boosting consumer demand and expanding market infrastructure there. In recent years, manufacturers have actively introduced a wide variety of gummy products in Mexico, including both traditional candy gummies and newer functional or supplement-style formats, catering to diverse tastes and age groups — from kids enjoying flavored treats to adults seeking vitamin-fortified options.
- The traditional gummies segment dominated the largest market revenue share of 49.01% in 2025, driven by strong consumer familiarity, widespread availability, and established brand presence across both developed and emerging markets. Traditional gummies continue to benefit from their appealing taste profiles, convenient chewable format, and high acceptance among children as well as adults seeking easy-to-consume supplements or functional products. Additionally, extensive retail penetration through supermarkets, pharmacies, and online platforms has supported consistent sales volumes.
Report Scope and Asia-Pacific Gummy Candy Market Segmentation
|
Attributes |
Asia-Pacific Gummy Candy Key Market Insights |
|
Segments Covered |
|
|
Countries Covered |
Asia-Pacific
|
|
Key Market Players |
|
|
Market Opportunities |
|
|
Value Added Data Infosets |
In addition to the insights on market scenarios such as market value, growth rate, segmentation, geographical coverage, and major players, the market reports curated by the Data Bridge Market Research also include in-depth expert analysis, pricing analysis, brand share analysis, consumer survey, demography analysis, supply chain analysis, value chain analysis, raw material/consumables overview, vendor selection criteria, PESTLE Analysis, Porter Analysis, and regulatory framework. |
Asia-Pacific Gummy Candy Market Trends
“Expansion of Nutraceutical and Supplement-Style Gummies (Vitamins, Minerals, Probiotics, Collagen, Immunity, Energy, Sleep) to Attract Health-Oriented Consumers”
- The expansion of nutraceutical and supplement‑style gummies, including vitamins, minerals, probiotics, collagen, immunity boosters, energy, and sleep‑support formulations, represents a significant growth opportunity for the global gummy candy market.
- Consumers are increasingly seeking convenient, enjoyable, and functional ways to meet their daily nutritional and wellness needs. Gummies provide an attractive delivery format that combines taste, chewability, and ease of use with targeted health benefits.
- This convergence of indulgence and functionality allows confectionery manufacturers to tap into health-conscious demographics, including adults and children, while expanding into categories traditionally dominated by tablets, capsules, or powders.
- By leveraging wellness trends, clean-label positioning, and innovative formulations, gummy products are capturing new consumer segments and creating a high-potential avenue for market expansion
For instance,
- In July 2025, New York Post reported that a multivitamin brand collaborated with a culinary personality to launch flavour-centric multivitamin gummies, making nutrient intake enjoyable and attracting health-conscious adult consumers.
- In November 2025, Times of India highlighted the rise of colourful vitamin gummies in India, widely used for immunity, hair, and skin health, reflecting increasing adoption of functional gummy supplements among consumers.
- The growth of nutraceutical and supplement-style gummies represents a substantial opportunity for the global gummy candy market. By combining taste, convenience, and functional benefits, these products appeal to health-conscious consumers across age groups, including children, adults, and seniors. Functional gummies enable brands to enter the booming wellness and preventive health segments, diversify product portfolios, and enhance consumer engagement. Innovations in clean-label, plant-based, and sugar-reduced formulations further expand the appeal of gummies as a healthier indulgence. As consumer focus on wellness continues to rise, the integration of nutraceutical benefits into gummy formats is poised to drive market growth, create new revenue streams, and redefine the competitive landscape
Asia-Pacific Gummy Candy Market Dynamics
Driver
“Rising Global Demand for Convenient, Indulgent, and Fun Confectionery Formats, with Gummies Benefiting from Their Chewable Texture, Flavour Variety, and Visual Appeal”
- The global confectionery landscape is being reshaped by shifting consumer lifestyles that increasingly prioritize convenience, indulgence, and sensory engagement, positioning novel formats like gummies at the forefront of category growth.
- Gummies — with their chewable texture, broad spectrum of flavour innovations, visually attractive shapes and colours, and ease of consumption on the go — resonate strongly across age groups, particularly among younger consumers and time‑pressed adults.
- This trend is supported by broader snacking behaviors and confectionery demand patterns observed in multiple official and industry‑level reports, reflecting that consumers are not only seeking indulgence but also playful, experiential, and portable treats that fit modern consumption contexts.
- Such dynamics have expanded gummies beyond traditional candy segments into functional, fortified, and premium confectionery spaces, magnifying their market relevance
- For instance, in July 2025, Agriculture and Agri Food Canada reported that confectionery sales including gum and jellies grew at an average of 10.3% annually between 2019 and 2023, supported by strong performance across confectionery categories as consumers returned to celebrations and convenience oriented purchases
Restraint/Challenge
“Rising Health Concerns Related to Sugar Content, Artificial Colours, and Additives, Which Can Limit Consumption in Health-Conscious Consumer Segments”
- The rising health concerns related to high sugar content, artificial colours, and additives in food products represent a significant restraint on the global gummy candy market, particularly among health‑conscious consumer segments.
- As scientific evidence and public health advocacy both highlight potential adverse effects associated with excessive sugar intake and synthetic additives, regulatory bodies and health organizations are intensifying scrutiny of confectionery ingredients.
- Gummies — often high in added sugars, artificial flavours, and vibrant synthetic colours designed to enhance visual appeal — fall squarely within this debate, prompting concern among parents, educators, and healthcare professionals alike.
- With increasing awareness of obesity, diabetes, dental issues, neurobehavioral effects linked to synthetic dyes, and broader dietary recommendations to reduce consumption of high‑sugar and additive‑laden foods, a segment of consumers is opting for cleaner, lower‑additive alternatives.
- These dynamics create market pressure on traditional gummy products, influencing consumer preferences, regulatory actions, and reformulation trends that can limit overall market expansion
Asia-Pacific Gummy Candy Market Scope
The market is segmented on the basis of type, product type, flavor, application, and end distribution channel.
• By Product Type
On the basis of product type, the Asia-Pacific gummy candy market is segmented into traditional gummies, functional gummies, organic gummies, sugar-free gummies, and others. In 2026 traditional gummies segment is expected to dominate the Asia-Pacific gummy candy market with a 48.85% market share, driven by strong consumer familiarity, widespread availability, and established brand trust across both developed and emerging markets. Traditional gummies continue to appeal to a broad demographic, including children and adults, due to their pleasant taste, chewy texture, and ease of consumption compared to tablets or capsules.
The functional gimmies segment is anticipated to witness the fastest CAGR of 6.1% from 2026 to 2033, fueled by rising consumer preference for convenient, palatable, and on-the-go nutritional formats. Increasing health awareness and preventive healthcare trends are encouraging consumers to shift from traditional tablets and capsules toward more enjoyable alternatives such as gummies, which offer better taste, ease of consumption, and improved compliance.
• By Flavor
On the basis of flavor, the market is segmented into fruit flavors, sour flavors, mixed flavors, and others. the fruit flavors segment is further divided into strawberry, orange, lemon, and others. In 2026 fruit flavors segment is expected to dominate the Asia-Pacific gummy candy market with a 48.71% market share, driven by strong consumer preference for natural, refreshing, and health-associated taste profiles across beverages, dairy products, confectionery, and bakery applications. Growing awareness regarding clean-label ingredients and the shift toward naturally sourced flavoring agents have significantly supported the demand for fruit-based variants such as citrus, berry, tropical, and stone fruits. In addition, the expansion of functional and fortified food and beverage products has further boosted the incorporation of fruit flavors, as they effectively mask off-notes from vitamins, minerals, and plant-based proteins while maintaining product palatability.
The mixed flavors segment is expected to witness the fastest CAGR of 6.0% from 2026 to 2033, driven by evolving consumer taste preferences and the growing demand for unique, indulgent, and experiential products. Consumers, particularly younger demographics, are increasingly seeking innovative flavor combinations that offer novelty beyond traditional single-flavor options. The rising influence of global cuisines, premiumization trends, and seasonal or limited-edition launches has further encouraged manufacturers to experiment with blended flavor profiles.
• By Application
On the basis of application, the market is segmented into child and adult. In 2026 child segment is expected to dominate the Asia-Pacific gummy candy market with a 58.74% market share, fueled by the higher prevalence of the targeted condition among the pediatric population, increasing parental awareness regarding early diagnosis and treatment, and supportive government immunization and screening programs. In many countries, routine pediatric check-ups and school-based health initiatives have significantly improved detection rates, leading to higher treatment uptake within this age group.
The adult segment is anticipated to witness the fastest CAGR of 5.8% from 2026 to 2033, driven by the rising prevalence of lifestyle-related and chronic conditions among the adult population, including cardiovascular diseases, diabetes, obesity, and respiratory disorders. Increasing work-related stress, sedentary lifestyles, unhealthy dietary habits, and growing exposure to environmental pollutants are significantly contributing to the higher disease burden in this demographic.
• By Distribution Channel
On the basis of the distribution channel, the market is segmented into offline and online. In 2026 offline segment is expected to dominate the Asia-Pacific gummy candy market with a 78.35% market share, driven by strong presence of established brick-and-mortar retail networks, including specialty stores, supermarkets/hypermarkets, and authorized distributors. Consumers continue to prefer offline channels due to the ability to physically examine products, assess quality, compare features in person, and receive immediate assistance from sales representatives.
The online segment is expected to witness the fastest CAGR of 6.1% from 2026 to 2033, fueled by the rapid digitalization of retail channels and the growing consumer preference for convenient, contactless purchasing options. Increasing internet penetration, rising smartphone usage, and improved digital payment infrastructure have significantly enhanced accessibility to online platforms across both developed and emerging markets.
Gummy Candy Market Regional Analysis
- China holds a significant 33.61% market share in 2025, at a CAGR of 5.6%. The market benefits from a large consumer base, rising disposable incomes, and increasing preference for innovative confectionery products. Strong demand is driven by flavored gummies, functional candies (such as vitamin-infused gummies), and premium packaged products. The rapid expansion of modern retail formats and e-commerce platforms further supports market growth, while continuous product innovation in taste, texture, and health-oriented formulations enhances consumer engagement.
- India is projected to be the fastest-growing market in the Asia-Pacific gummy candy sector, registering a CAGR of around 5.8% during 2026–2033. Growth is fueled by a young population, increasing urbanization, and rising demand for affordable confectionery products. The expansion of organized retail, convenience stores, and online platforms is improving product accessibility. Additionally, growing popularity of gelatin-free, vegan, and fortified gummies, along with increasing influence of western snacking trends, is accelerating market adoption.
- Additionally, increasing consumer preference for convenient, ready-to-eat confectionery products, along with rising demand for functional and nutraceutical gummies, is expected to support long-term market expansion across the Asia-Pacific region. Countries such as South Korea, Thailand, Indonesia, and Malaysia are witnessing growing investments in food processing, retail expansion, and premium confectionery segments.
China Gummy Candy Market Insight
China dominated the Asia-Pacific gummy candy market with the largest revenue share of 33.61% in 2025, supported by its well-established confectionery industry, high per capita consumption of sugar confectionery products, and strong presence of leading players such as Mars, Incorporated, Mondelez International, and Haribo. The country benefits from an extensive retail distribution network spanning supermarkets, convenience stores, and online platforms, enabling wide product availability and rapid new product penetration. Additionally, continuous product innovation in functional gummies, organic and low-sugar variants, and vitamin-infused offerings has expanded the consumer base beyond children to include adults seeking better-for-you indulgence options.
India Gummy Candy Market Insight
India is expected to be the fastest-growing region in the Asia-Pacific gummy candy market during the forecast period, driven by several converging factors that are boosting consumer demand and expanding market infrastructure there. In recent years, manufacturers have actively introduced a wide variety of gummy products in Mexico, including both traditional candy gummies and newer functional or supplement-style formats, catering to diverse tastes and age groups — from kids enjoying flavored treats to adults seeking vitamin-fortified options.
Asia-Pacific Gummy Candy Market Share
The Asia-Pacific gummy candy industry is primarily led by well-established companies, including:
- YUMMYEARTH, INC. (U.S.)
- Candy Kittens (U.K.)
- BAZOOKA CANDY BRANDS (U.S.)
- CLOETTA AB (Sweden)
- Meiji Holdings Co., Ltd. (Japan)
- SmartSweets Inc. (Canada)
- PT YUPI INDO JELLY GUM Tbk (Indonesia)
- Arcor (Argentina)
- AUGUST STORCK KG (Germany)
- Trolli GmbH (Germany)
- Vidal Golosinas (Spain)
- THE HERSHEY COMPANY (U.S.)
- Mars, Incorporated (U.S.)
- Mondelēz International (U.S.)
- Nestlé (Switzerland)
- The Kraft Heinz Company (U.S.)
- ALBANESE CANDY (U.S.)
- HARIBO GMBH & CO. KG (Germany)
- FERRARA CANDY COMPANY (U.S.)
- PERFETTI VAN MELLE (Netherlands)
- PIM BRANDS. INC. (U.S.)
Latest Developments in the Asia-Pacific Gummy Candy Market
- In December, 2025 – HARIBO celebrated a record retail performance in the UK and announced a £20 million investment to expand its retail presence. The company opened new stores and welcomed around five million shoppers, strengthening brand accessibility and customer engagement. The investment highlights HARIBO’s strategy to grow direct retail channels and enhance consumer experience
- In July, 2025 – HARIBO announced a £35 million investment in West Yorkshire to expand operations and strengthen its manufacturing and distribution capabilities. The project supports local economic development and improves supply chain efficiency to meet increasing product demand. This investment reinforces HARIBO’s long-term growth and production expansion strategy
- In January, 2024 – HARIBO received planning approval to expand its Castleford site with a new warehouse and appointed a local construction company to develop the facility. The expansion aims to improve logistics efficiency and support growing consumer demand across the UK market. The project also highlights HARIBO’s commitment to local investment and job creation.
- In 2025 – HARIBO continued strengthening its corporate responsibility activities by supporting Grocery Aid initiatives and charity fundraising programs. The company participated in awareness campaigns and community fundraising activities to support workers and families in the grocery industry. These initiatives highlight HARIBO’s commitment to social responsibility and community welfare
SKU-
Get online access to the report on the World's First Market Intelligence Cloud

- Interactive Data Analysis Dashboard
- Company Analysis Dashboard for high growth potential opportunities
- Research Analyst Access for customization & queries
- Competitor Analysis with Interactive dashboard
- Latest News, Updates & Trend analysis
- Harness the Power of Benchmark Analysis for Comprehensive Competitor Tracking
Table of Content
1 INTRODUCTION
1.1 OBJECTIVES OF THE STUDY
1.2 MARKET DEFINITION
1.3 OVERVIEW OF ASIA-PACIFIC GUMMY CANDY MARKET
1.4 CURRENCY AND PRICING
1.5 LIMITATIONS
1.6 MARKETS COVERED
2 MARKET SEGMENTATION
2.1 MARKETS COVERED
2.2 GEOGRAPHICAL SCOPE
2.3 YEARS CONSIDERED FOR THE STUDY
2.4 DBMR TRIPOD DATA VALIDATION MODEL
2.5 PRIMARY INTERVIEWS WITH KEY OPINION LEADERS
2.6 DBMR MARKET POSITION GRID
2.7 VENDOR SHARE ANALYSIS
2.8 MULTIVARIATE MODELING
2.9 TECHNOLOGY LIFE LINE CURVE
2.1 MARKET APPLICATION COVERAGE GRID
2.11 SECONDARY SOURCES
2.12 ASSUMPTIONS
3 EXECUTIVE SUMMARY
4 PREMIUM INSIGHTS
4.1 PORTER’S FIVE FORCES
4.2 PESTEL ANALYSIS
4.3 PRODUCT QUALITY, FORMULATION CAPABILITY AND SENSORY PERFORMANCE
4.3.1 PRODUCT QUALITY, FORMULATION CAPABILITY AND SENSORY PERFORMANCE
4.3.2 PRODUCT QUALITY, FORMULATION CAPABILITY AND SENSORY PERFORMANCE
4.3.3 FOOD SAFETY, QUALITY ASSURANCE AND REGULATORY COMPLIANCE
4.3.4 INDUSTRY EXPERIENCE AND BRAND REFERENCES
4.3.5 LIFECYCLE COST AND VALUE PROPOSITION
4.3.6 CUSTOMIZATION, INNOVATION AND R&D SUPPORT
4.3.7 DELIVERY CAPABILITY AND SUPPLY CHAIN RELIABILITY
4.3.8 AFTER-SALES SERVICE AND COLLABORATIVE SUPPORT
4.3.9 PRICING TRANSPARENCY AND COMMERCIAL TERMS
4.3.10 DIGITAL CAPABILITIES AND TRACEABILITY ACCESS
4.3.11 CONCLUSION
4.4 PRODUCT CODES
4.5 ASSET MANAGEMENT APPROACHES PRACTISED
4.5.1 INTRODUCTION TO ASSET MANAGEMENT
4.5.2 TYPES OF ASSETS
4.5.3 MAINTENANCE STRATEGIES
4.5.4 REGULATORY & SAFETY COMPLIANCE
4.5.5 FINANCIAL IMPACT
4.6 CERTIFIED STANDARDS
4.6.1 FOOD SAFETY MANAGEMENT CERTIFICATIONS
4.6.2 QUALITY & MANUFACTURING SYSTEM CERTIFICATIONS
4.6.3 INGREDIENT & ETHICAL SOURCING CERTIFICATIONS
4.6.4 RELIGIOUS & DIETARY COMPLIANCE CERTIFICATIONS
4.6.5 PACKAGING & ENVIRONMENTAL CERTIFICATIONS
4.6.6 INDUSTRY IMPACT
4.7 CONTRACTING MODELS SCENERIO
4.7.1 INDUSTRY CONTEXT – REGULATION-RESPONSIVE OUTSOURCING MODEL
4.7.2 MAJOR CONTRACTING MODELS
4.7.3 OEM MODEL (BRAND-OWNED FORMULA, THIRD-PARTY PRODUCTION)
4.7.4 ODM MODEL (MANUFACTURER-DRIVEN INNOVATION)
4.7.5 PRIVATE-LABEL MODEL (RETAILER-OWNED BRAND MANUFACTURING)
4.7.6 WHITE-LABEL MODEL (STANDARD PRODUCT RESALE)
4.7.7 STRATEGIC CO-MANUFACTURING PARTNERSHIP MODEL
4.7.8 REGIONAL CONTRACTING DYNAMICS — COMPLIANCE-DRIVEN MODEL SELECTION
4.7.9 EMERGING HYBRID MODEL (2025–2030) — TRI-PARTY ECOSYSTEM MODEL
4.7.10 STRATEGIC OUTLOOK — NETWORK ORCHESTRATION MODEL
4.7.11 CONCLUSION — MODULAR VALUE-CHAIN MODEL
4.8 OVERVIEW: FAILURE RATES
4.8.1 NATURE OF FAILURE IN THE GUMMY CATEGORY
4.8.2 MANUFACTURING-STAGE FAILURE RATES (PROCESS & FORMULATION LOSSES)
4.8.3 OPERATIONAL IMPLICATION:
4.8.4 CONCLUSION
4.9 PRICING ANALYSIS
4.1 PRODUCTION CAPACITY OVERVIEW
4.10.1 OVERVIEW
4.10.2 CAPACITY RANGES
4.11 RAW MATERIAL COVERAGE
4.11.1 KEY INGREDIENTS
4.11.1.1 Gelling Agents
4.11.1.2 Sweeteners and Humectants
4.11.1.3 Flavorings and Acids
4.11.1.4 Colorants and Coatings
4.12 SAFETY STANDARDS
4.12.1 MATERIAL HANDLING & STORAGE
4.12.2 TRANSPORT & PRECAUTIONS
4.12.3 HAZARD IDENTIFICATION
4.13 SUPPLY CHAIN ECOSYSTEM
4.13.1 OVERVIEW
4.13.2 LOGISTIC COST SCENARIO
4.13.3 IMPORTANCE OF LOGISTICS SERVICE PROVIDERS
4.14 TECHNOLOGICAL ADVANCEMENTS BY MANUFACTURERS
4.14.1 AUTOMATION & CONTINUOUS PRODUCTION SYSTEMS
4.14.2 PRECISION COOKING, FORMULATION & INGREDIENT ENGINEERING
4.14.3 MOLDING INNOVATION & PRODUCT DESIGN FLEXIBILITY
4.14.4 SMART MANUFACTURING & DIGITAL QUALITY CONTROL
4.14.5 HIGH-EFFICIENCY & SUSTAINABLE MANUFACTURING
4.14.6 FUNCTIONAL & PHARMACEUTICAL-GRADE GUMMY TECHNOLOGY
4.14.7 CONCLUSION
4.15 VENDOR SELECTION CRITERIA
4.15.1 DEFINING SOURCING NEEDS
4.15.2 EVALUATING CREDENTIALS AND COMPLIANCE
4.15.3 VERIFYING QUALITY STANDARDS
4.15.4 ASSESSING CAPABILITIES AND INNOVATION
4.15.5 CHECKING PRODUCT RANGE AND RELIABILITY
5 REGULATION COVERAGE
5.1 KEY REGULATORY BODIES
5.2 LABELING AND SAFETY MANDATES
6 MARKET OVERVIEW
6.1 DRIVERS
6.1.1 RISING ASIA-PACIFIC DEMAND FOR CONVENIENT, INDULGENT, AND FUN CONFECTIONERY FORMATS, WITH GUMMIES BENEFITING FROM THEIR CHEWABLE TEXTURE, FLAVOURS VARIETY, AND VISUAL APPEAL.
6.1.2 GROWING PRESENCE OF BRANDED, LICENSED, AND CHARACTER-THEMED GUMMIES, PARTICULARLY IN CHILDREN
6.1.3 STRONG POPULARITY OF FRUIT-BASED, NOVELTY-SHAPED, AND SEASONAL GUMMY PRODUCTS
6.1.4 EXPANSION OF ORGANIZED RETAIL, CONVENIENCE STORES, AND E-COMMERCE CHANNELS, IMPROVING PRODUCT VISIBILITY AND DISTRIBUTION
6.2 RESTRAINTS
6.2.1 RISING HEALTH CONCERNS RELATED TO SUGAR CONTENT, ARTIFICIAL COLOURS, AND ADDITIVES, WHICH CAN LIMIT CONSUMPTION IN HEALTH-CONSCIOUS CONSUMER SEGMENTS
6.2.2 INCREASING REGULATORY AND LABELLING SCRUTINY AROUND SUGAR, ADDITIVES, AND MARKETING TO CHILDREN, ADDING COMPLIANCE COMPLEXITY FOR MANUFACTURERS
6.3 OPPORTUNITIES
6.3.1 EXPANSION OF NUTRACEUTICAL AND SUPPLEMENT-STYLE GUMMIES (VITAMINS, MINERALS, PROBIOTICS, COLLAGEN, IMMUNITY, ENERGY, SLEEP) TO ATTRACT HEALTH-ORIENTED CONSUMERS.
6.3.2 PREMIUMIZATION THROUGH FLAVOURS, NATURAL INGREDIENTS, UNIQUE TEXTURES, AND PREMIUM PACKAGING, SUPPORTING HIGHER AVERAGE SELLING PRICES.
6.3.3 GROWTH OF ADULT-ORIENTED GUMMY SEGMENTS (SOPHISTICATED FLAVOURS, FUNCTIONAL BENEFITS, PREMIUM TEXTURES, AND LIFESTYLE POSITIONING) BEYOND THE TRADITIONAL CHILDREN-FOCUSED MARKET.
6.4 CHALLENGES
6.4.1 BALANCING INDULGENCE APPEAL WITH HEALTH AND NUTRITION EXPECTATIONS, WITHOUT DILUTING TASTE, TEXTURE, OR CONSUMER ENJOYMENT.
6.4.2 PROTECTING BRAND DIFFERENTIATION AND SHELF SPACE IN A CROWDED CONFECTIONERY MARKET WITH FREQUENT NEW PRODUCT LAUNCHES.
7 ASIA-PACIFIC GUMMY CANDY MARKET, BY PRODUCT TYPE
7.1 OVERVIEW
7.2 TRADITIONAL GUMMIES
7.3 FUNCTIONAL GUMMIES
7.4 SUGAR-FREE GUMMIES
7.5 ORGANIC GUMMIES
7.6 OTHERS
7.7 TRADITIONAL GUMMIES IN ASIA-PACIFIC GUMMY CANDY MARKET, BY REGION, 2018-2033 (USD THOUSAND)
7.7.1 NORTH AMERICA
7.7.2 EUROPE
7.7.3 ASIA-PACIFIC
7.7.4 SOUTH AMERICA
7.7.5 MIDDLE EAST AND AFRICA
7.8 FUNCTIONAL GUMMIES IN ASIA-PACIFIC GUMMY CANDY MARKET, BY REGION, 2018-2033 (USD THOUSAND)
7.8.1 NORTH AMERICA
7.8.2 EUROPE
7.8.3 ASIA-PACIFIC
7.8.4 SOUTH AMERICA
7.8.5 MIDDLE EAST AND AFRICA
7.9 SUGAR-FREE GUMMIES IN ASIA-PACIFIC GUMMY CANDY MARKET, BY REGION, 2018-2033 (USD THOUSAND)
7.9.1 NORTH AMERICA
7.9.2 EUROPE
7.9.3 ASIA-PACIFIC
7.9.4 SOUTH AMERICA
7.9.5 MIDDLE EAST AND AFRICA
7.1 ORGANIC GUMMIES IN ASIA-PACIFIC GUMMY CANDY MARKET, BY REGION, 2018-2033 (USD THOUSAND)
7.10.1 NORTH AMERICA
7.10.2 EUROPE
7.10.3 ASIA-PACIFIC
7.10.4 SOUTH AMERICA
7.10.5 MIDDLE EAST AND AFRICA
7.11 OTHERS IN ASIA-PACIFIC GUMMY CANDY MARKET, BY REGION, 2018-2033 (USD THOUSAND)
7.11.1 NORTH AMERICA
7.11.2 EUROPE
7.11.3 ASIA-PACIFIC
7.11.4 SOUTH AMERICA
7.11.5 MIDDLE EAST AND AFRICA
8 ASIA-PACIFIC GUMMY CANDY MARKET, BY FLAVOR
8.1 OVERVIEW
8.2 FRUIT FLAVOURS
8.3 MIXED FLAVOURS
8.4 SOUR FLAVOURS
8.5 OTHERS
8.6 ASIA-PACIFIC FRUIT FLAVOURS IN GUMMY CANDY MARKET, BY TYPE, 2018-2033 (USD THOUSAND)
8.6.1 STRAWBERRY
8.6.2 ORANGE
8.6.3 LEMON
8.6.4 OTHERS
8.7 FRUIT FLAVOURS IN ASIA-PACIFIC GUMMY CANDY MARKET, BY REGION, 2018-2033 (USD THOUSAND)
8.7.1 NORTH AMERICA
8.7.2 EUROPE
8.7.3 ASIA-PACIFIC
8.7.4 SOUTH AMERICA
8.7.5 MIDDLE EAST AND AFRICA
8.8 MIXED FLAVOURS IN ASIA-PACIFIC GUMMY CANDY MARKET, BY REGION, 2018-2033 (USD THOUSAND)
8.8.1 NORTH AMERICA
8.8.2 EUROPE
8.8.3 ASIA-PACIFIC
8.8.4 SOUTH AMERICA
8.8.5 MIDDLE EAST AND AFRICA
8.9 SOUR FLAVOURS IN ASIA-PACIFIC GUMMY CANDY MARKET, BY REGION, 2018-2033 (USD THOUSAND)
8.9.1 NORTH AMERICA
8.9.2 EUROPE
8.9.3 ASIA-PACIFIC
8.9.4 SOUTH AMERICA
8.9.5 MIDDLE EAST AND AFRICA
8.1 OTHERS IN ASIA-PACIFIC GUMMY CANDY MARKET, BY REGION, 2018-2033 (USD THOUSAND)
8.10.1 NORTH AMERICA
8.10.2 EUROPE
8.10.3 ASIA-PACIFIC
8.10.4 SOUTH AMERICA
8.10.5 MIDDLE EAST AND AFRICA
9 ASIA-PACIFIC GUMMY CANDY MARKET, BY APPLICATION
9.1 OVERVIEW
9.2 CHILD
9.3 ADULT
9.4 CHILD IN ASIA-PACIFIC GUMMY CANDY MARKET, BY REGION, 2018-2033 (USD THOUSAND)
9.4.1 NORTH AMERICA
9.4.2 EUROPE
9.4.3 ASIA-PACIFIC
9.4.4 SOUTH AMERICA
9.4.5 MIDDLE EAST AND AFRICA
9.5 ADULTS IN ASIA-PACIFIC GUMMY CANDY MARKET, BY REGION, 2018-2033 (USD THOUSAND)
9.5.1 NORTH AMERICA
9.5.2 EUROPE
9.5.3 ASIA-PACIFIC
9.5.4 SOUTH AMERICA
9.5.5 MIDDLE EAST AND AFRICA
10 ASIA-PACIFIC GUMMY CANDY MARKET, BY DISTRIBUTION CHANNEL
10.1 OVERVIEW
10.2 OFFLINE
10.3 ONLINE
10.4 ASIA-PACIFIC OFFLINE IN GUMMY CANDY MARKET, BY TYPE, 2018-2033 (USD THOUSAND)
10.4.1 SUPERMARKET / HYPERMARKET
10.4.2 CONVENIENCE STORE
10.4.3 SPECIALTY STORE
10.4.4 OTHERS
10.5 OFFLINE IN ASIA-PACIFIC GUMMY CANDY MARKET, BY REGION, 2018-2033 (USD THOUSAND)
10.5.1 NORTH AMERICA
10.5.2 EUROPE
10.5.3 ASIA-PACIFIC
10.5.4 SOUTH AMERICA
10.5.5 MIDDLE EAST AND AFRICA
10.6 ASIA-PACIFIC ONLINE IN GUMMY CANDY MARKET, BY TYPE, 2018-2033 (USD THOUSAND)
10.6.1 E-COMMERCE WEBSITE
10.6.2 COMPANY-OWNED WEBSITE
10.7 ONLINE IN ASIA-PACIFIC GUMMY CANDY MARKET, BY REGION, 2018-2033 (USD THOUSAND)
10.7.1 NORTH AMERICA
10.7.2 EUROPE
10.7.3 ASIA-PACIFIC
10.7.4 SOUTH AMERICA
10.7.5 MIDDLE EAST AND AFRICA
11 ASIA-PACIFIC GUMMY CANDY MARKET, BY REGION
11.1 ASIA-PACIFIC
11.1.1 CHINA
11.1.2 JAPAN
11.1.3 INDIA
11.1.4 AUSTRALIA
11.1.5 SOUTH KOREA
11.1.6 INDONESIA
11.1.7 THAILAND
11.1.8 MALAYSIA
11.1.9 PHILLIPINES
11.1.10 SINGAPORE
11.1.11 NEW ZEALAND
11.1.12 REST OF ASIA-PACIFIC
12 ASIA-PACIFIC GUMMY CANDY MARKET: COMPANY LANDSCAPE
12.1 MANUFACTURER COMPANY SHARE ANALYSIS: GLOBAL
13 WOT ANALYSIS
14 COMPANY PROFILES
14.1 HARIBO GMBH & CO. KG
14.1.1 COMPANY SNAPSHOT
14.1.2 COMPANY SHARE ANALYSIS
14.1.3 PRODUCT/SERVICE PORTFOLIO
14.1.4 RECENT DEVELOPMENT
14.2 MONDELĒZ INTERNATIONAL
14.2.1 COMPANY SNAPSHOT
14.2.2 REVENUE ANALYSIS
14.2.3 COMPANY SHARE ANALYSIS
14.2.4 PRODUCT PORTFOLIO
14.2.5 RECENT DEVELOPMENT
14.3 FERRARA CANDY COMPANY
14.3.1 COMPANY SNAPSHOT
14.3.2 COMPANY SHARE ANALYSIS
14.3.3 PRODUCT/SERVICE PORTFOLIO
14.3.4 RECENT DEVELOPMENT
14.4 PERFETTI VAN MELLE
14.4.1 COMPANY SNAPSHOT
14.4.2 COMPANY SHARE ANALYSIS
14.4.3 PRODUCT/SERVICE PORTFOLIO
14.4.4 RECENT DEVELOPMENT
14.5 MARS, INCORPORATED
14.5.1 COMPANY SNAPSHOT
14.5.2 COMPANY SHARE ANALYSIS
14.5.3 PRODUCT PORTFOLIO
14.5.4 RECENT DEVELOPMENT
14.6 ALBANESE CANDY
14.6.1 COMPANY SNAPSHOT
14.6.2 PRODUCT/SERVICE PORTFOLIO
14.6.3 RECENT DEVELOPMENT
14.7 ARCOR
14.7.1 COMPANY SNAPSHOT
14.7.2 PRODUCT PORTFOLIO
14.7.3 RECENT DEVELOPMENT
14.8 AUGUST STORCK KG
14.8.1 COMPANY SNAPSHOT
14.8.2 PRODUCT PORTFOLIO
14.8.3 RECENT DEVELOPMENT
14.9 BAZOOKA CANDY BRANDS.
14.9.1 COMPANY SNAPSHOT
14.9.2 PRODUCT PORTFOLIO
14.9.3 RECENT DEVELOPMENT
14.1 CANDY KITTENS
14.10.1 COMPANY SNAPSHOT
14.10.2 PRODUCT PORTFOLIO
14.10.3 RECENT DEVELOPMENT
14.11 CLOETTA AB
14.11.1 COMPANY SNAPSHOT
14.11.2 REVENUE ANALYSIS
14.11.3 PRODUCT PORTFOLIO
14.11.4 RECENT DEVELOPMENT
14.12 MEIJI HOLDINGS CO., LTD.
14.12.1 COMPANY SNAPSHOT
14.12.2 REVENUE ANALYSIS
14.12.3 PRODUCT PORTFOLIO
14.12.4 RECENT DEVELOPMENT
14.13 NESTLÉ
14.13.1 COMPANY SNAPSHOT
14.13.2 REVENUE ANALYSIS
14.13.3 PRODUCT PORTFOLIO
14.13.4 RECENT DEVELOPMENT
14.14 PIM BRANDS. INC.
14.14.1 COMPANY SNAPSHOT
14.14.2 PRODUCT/SERVICE PORTFOLIO
14.14.3 RECENT DEVELOPMENT
14.15 PT YUPI INDO JELLY GUM TBK
14.15.1 COMPANY SNAPSHOT
14.15.2 PRODUCT PORTFOLIO
14.15.3 RECENT DEVELOPMENT
14.16 SMARTSWEETS INC.
14.16.1 COMPANY SNAPSHOT
14.16.2 PRODUCT PORTFOLIO
14.16.3 RECENT DEVELOPMENT
14.17 THE HERSHEY COMPANY
14.17.1 COMPANY SNAPSHOT
14.17.2 REVENUE ANALYSIS
14.17.3 PRODUCT PORTFOLIO
14.17.4 RECENT DEVELOPMENT
14.18 THE KRAFT HEINZ COMPANY
14.18.1 COMPANY SNAPSHOT
14.18.2 REVENUE ANALYSIS
14.18.3 PRODUCT PORTFOLIO
14.18.4 RECENT DEVELOPMENT
14.19 TROLLI GMBH
14.19.1 COMPANY SNAPSHOT
14.19.2 PRODUCT PORTFOLIO
14.19.3 RECENT DEVELOPMENT
14.2 VIDAL GOLOSINAS
14.20.1 COMPANY SNAPSHOT
14.20.2 PRODUCT PORTFOLIO
14.20.3 RECENT DEVELOPMENT
14.21 YUMMYEARTH INC.
14.21.1 COMPANY SNAPSHOT
14.21.2 PRODUCT PORTFOLIO
14.21.3 RECENT DEVELOPMENT
15 QUESTIONNAIRE
16 RELATED REPORTS
List of Table
TABLE 1 ASIA-PACIFIC GUMMY CANDY MARKET, BY PRODUCT TYPE, 2018-2033 (USD THOUSAND)
TABLE 2 TRADITIONAL GUMMIES IN ASIA-PACIFIC GUMMY CANDY MARKET, BY REGION, 2018-2033 (USD THOUSAND)
TABLE 3 FUNCTIONAL GUMMIES IN ASIA-PACIFIC GUMMY CANDY MARKET, BY REGION, 2018-2033 (USD THOUSAND)
TABLE 4 SUGAR-FREE GUMMIES IN ASIA-PACIFIC GUMMY CANDY MARKET, BY REGION, 2018-2033 (USD THOUSAND)
TABLE 5 ORGANIC GUMMIES IN ASIA-PACIFIC GUMMY CANDY MARKET, BY REGION, 2018-2033 (USD THOUSAND)
TABLE 6 OTHERS IN ASIA-PACIFIC GUMMY CANDY MARKET, BY REGION, 2018-2033 (USD THOUSAND)
TABLE 7 ASIA-PACIFIC GUMMY CANDY MARKET, BY FLAVOUR, 2018-2033 (USD THOUSAND)
TABLE 8 ASIA-PACIFIC FRUIT FLAVOURS IN GUMMY CANDY MARKET, BY TYPE, 2018-2033 (USD THOUSAND)
TABLE 9 FRUIT FLAVOURS IN ASIA-PACIFIC GUMMY CANDY MARKET, BY REGION, 2018-2033 (USD THOUSAND)
TABLE 10 MIXED FLAVOURS IN ASIA-PACIFIC GUMMY CANDY MARKET, BY REGION, 2018-2033 (USD THOUSAND)
TABLE 11 SOUR FLAVOURS IN ASIA-PACIFIC GUMMY CANDY MARKET, BY REGION, 2018-2033 (USD THOUSAND)
TABLE 12 OTHERS IN ASIA-PACIFIC GUMMY CANDY MARKET, BY REGION, 2018-2033 (USD THOUSAND)
TABLE 13 ASIA-PACIFIC GUMMY CANDY MARKET, BY APPLICATION, 2018-2033 (USD THOUSAND)
TABLE 14 CHILD IN ASIA-PACIFIC GUMMY CANDY MARKET, BY REGION, 2018-2033 (USD THOUSAND)
TABLE 15 ADULTS IN ASIA-PACIFIC GUMMY CANDY MARKET, BY REGION, 2018-2033 (USD THOUSAND)
TABLE 16 ASIA-PACIFIC GUMMY CANDY MARKET, BY DISTRIBUTION CHANNEL, 2018-2033 (USD THOUSAND)
TABLE 17 ASIA-PACIFIC OFFLINE IN GUMMY CANDY MARKET, BY TYPE, 2018-2033 (USD THOUSAND)
TABLE 18 OFFLINE IN ASIA-PACIFIC GUMMY CANDY MARKET, BY REGION, 2018-2033 (USD THOUSAND)
TABLE 19 ASIA-PACIFIC ONLINE IN GUMMY CANDY MARKET, BY TYPE, 2018-2033 (USD THOUSAND)
TABLE 20 ONLINE IN ASIA-PACIFIC GUMMY CANDY MARKET, BY REGION, 2018-2033 (USD THOUSAND)
TABLE 21 ASIA PACIFIC GUMMY CANDY MARKET, BY COUNTRY, 2018-2033 (USD THOUSAND)
TABLE 22 ASIA PACIFIC GUMMY CANDY MARKET, BY PRODUCT TYPE, 2018-2033 (USD THOUSAND)
TABLE 23 ASIA PACIFIC GUMMY CANDY MARKET, BY FLAVOUR, 2018-2033 (USD THOUSAND)
TABLE 24 ASIA PACIFIC FRUIT FLAVOURS IN GUMMY CANDY MARKET, BY TYPE, 2018-2033 (USD THOUSAND)
TABLE 25 ASIA PACIFIC GUMMY CANDY MARKET, BY APPLICATION, 2018-2033 (USD THOUSAND)
TABLE 26 ASIA PACIFIC GUMMY CANDY MARKET, BY DISTRIBUTION CHANNEL, 2018-2033 (USD THOUSAND)
TABLE 27 ASIA PACIFIC OFFLINE IN GUMMY CANDY MARKET, BY TYPE , 2018-2033 (USD THOUSAND)
TABLE 28 ASIA PACIFIC ONLINE IN GUMMY CANDY MARKET, BY TYPE, 2018-2033 (USD THOUSAND)
TABLE 29 CHINA GUMMY CANDY MARKET, BY PRODUCT TYPE, 2018-2033 (USD THOUSAND)
TABLE 30 CHINA GUMMY CANDY MARKET, BY FLAVOUR, 2018-2033 (USD THOUSAND)
TABLE 31 CHINA FRUIT FLAVOURS IN GUMMY CANDY MARKET, BY TYPE, 2018-2033 (USD THOUSAND)
TABLE 32 CHINA GUMMY CANDY MARKET, BY APPLICATION, 2018-2033 (USD THOUSAND)
TABLE 33 CHINA GUMMY CANDY MARKET, BY DISTRIBUTION CHANNEL, 2018-2033 (USD THOUSAND)
TABLE 34 CHINA OFFLINE IN GUMMY CANDY MARKET, BY TYPE , 2018-2033 (USD THOUSAND)
TABLE 35 CHINA ONLINE IN GUMMY CANDY MARKET, BY TYPE, 2018-2033 (USD THOUSAND)
TABLE 36 JAPAN GUMMY CANDY MARKET, BY PRODUCT TYPE, 2018-2033 (USD THOUSAND)
TABLE 37 JAPAN GUMMY CANDY MARKET, BY FLAVOUR, 2018-2033 (USD THOUSAND)
TABLE 38 JAPAN FRUIT FLAVOURS IN GUMMY CANDY MARKET, BY TYPE, 2018-2033 (USD THOUSAND)
TABLE 39 JAPAN GUMMY CANDY MARKET, BY APPLICATION, 2018-2033 (USD THOUSAND)
TABLE 40 JAPAN GUMMY CANDY MARKET, BY DISTRIBUTION CHANNEL, 2018-2033 (USD THOUSAND)
TABLE 41 JAPAN OFFLINE IN GUMMY CANDY MARKET, BY TYPE , 2018-2033 (USD THOUSAND)
TABLE 42 JAPAN ONLINE IN GUMMY CANDY MARKET, BY TYPE, 2018-2033 (USD THOUSAND)
TABLE 43 INDIA GUMMY CANDY MARKET, BY PRODUCT TYPE, 2018-2033 (USD THOUSAND)
TABLE 44 INDIA GUMMY CANDY MARKET, BY FLAVOUR, 2018-2033 (USD THOUSAND)
TABLE 45 INDIA FRUIT FLAVOURS IN GUMMY CANDY MARKET, BY TYPE, 2018-2033 (USD THOUSAND)
TABLE 46 INDIA GUMMY CANDY MARKET, BY APPLICATION, 2018-2033 (USD THOUSAND)
TABLE 47 INDIA GUMMY CANDY MARKET, BY DISTRIBUTION CHANNEL, 2018-2033 (USD THOUSAND)
TABLE 48 INDIA OFFLINE IN GUMMY CANDY MARKET, BY TYPE , 2018-2033 (USD THOUSAND)
TABLE 49 INDIA ONLINE IN GUMMY CANDY MARKET, BY TYPE, 2018-2033 (USD THOUSAND)
TABLE 50 AUSTRALIA GUMMY CANDY MARKET, BY PRODUCT TYPE, 2018-2033 (USD THOUSAND)
TABLE 51 AUSTRALIA GUMMY CANDY MARKET, BY FLAVOUR, 2018-2033 (USD THOUSAND)
TABLE 52 AUSTRALIA FRUIT FLAVOURS IN GUMMY CANDY MARKET, BY TYPE, 2018-2033 (USD THOUSAND)
TABLE 53 AUSTRALIA GUMMY CANDY MARKET, BY APPLICATION, 2018-2033 (USD THOUSAND)
TABLE 54 AUSTRALIA GUMMY CANDY MARKET, BY DISTRIBUTION CHANNEL, 2018-2033 (USD THOUSAND)
TABLE 55 AUSTRALIA OFFLINE IN GUMMY CANDY MARKET, BY TYPE , 2018-2033 (USD THOUSAND)
TABLE 56 AUSTRALIA ONLINE IN GUMMY CANDY MARKET, BY TYPE, 2018-2033 (USD THOUSAND)
TABLE 57 SOUTH KOREA GUMMY CANDY MARKET, BY PRODUCT TYPE, 2018-2033 (USD THOUSAND)
TABLE 58 SOUTH KOREA GUMMY CANDY MARKET, BY FLAVOUR, 2018-2033 (USD THOUSAND)
TABLE 59 SOUTH KOREA FRUIT FLAVOURS IN GUMMY CANDY MARKET, BY TYPE, 2018-2033 (USD THOUSAND)
TABLE 60 SOUTH KOREA GUMMY CANDY MARKET, BY APPLICATION, 2018-2033 (USD THOUSAND)
TABLE 61 SOUTH KOREA GUMMY CANDY MARKET, BY DISTRIBUTION CHANNEL, 2018-2033 (USD THOUSAND)
TABLE 62 SOUTH KOREA OFFLINE IN GUMMY CANDY MARKET, BY TYPE , 2018-2033 (USD THOUSAND)
TABLE 63 SOUTH KOREA ONLINE IN GUMMY CANDY MARKET, BY TYPE, 2018-2033 (USD THOUSAND)
TABLE 64 INDONESIA GUMMY CANDY MARKET, BY PRODUCT TYPE, 2018-2033 (USD THOUSAND)
TABLE 65 INDONESIA GUMMY CANDY MARKET, BY FLAVOUR, 2018-2033 (USD THOUSAND)
TABLE 66 INDONESIA FRUIT FLAVOURS IN GUMMY CANDY MARKET, BY TYPE, 2018-2033 (USD THOUSAND)
TABLE 67 INDONESIA GUMMY CANDY MARKET, BY APPLICATION, 2018-2033 (USD THOUSAND)
TABLE 68 INDONESIA GUMMY CANDY MARKET, BY DISTRIBUTION CHANNEL, 2018-2033 (USD THOUSAND)
TABLE 69 INDONESIA OFFLINE IN GUMMY CANDY MARKET, BY TYPE , 2018-2033 (USD THOUSAND)
TABLE 70 INDONESIA ONLINE IN GUMMY CANDY MARKET, BY TYPE, 2018-2033 (USD THOUSAND)
TABLE 71 THAILAND GUMMY CANDY MARKET, BY PRODUCT TYPE, 2018-2033 (USD THOUSAND)
TABLE 72 THAILAND GUMMY CANDY MARKET, BY FLAVOUR, 2018-2033 (USD THOUSAND)
TABLE 73 THAILAND FRUIT FLAVOURS IN GUMMY CANDY MARKET, BY TYPE, 2018-2033 (USD THOUSAND)
TABLE 74 THAILAND GUMMY CANDY MARKET, BY APPLICATION, 2018-2033 (USD THOUSAND)
TABLE 75 THAILAND GUMMY CANDY MARKET, BY DISTRIBUTION CHANNEL, 2018-2033 (USD THOUSAND)
TABLE 76 THAILAND OFFLINE IN GUMMY CANDY MARKET, BY TYPE , 2018-2033 (USD THOUSAND)
TABLE 77 THAILAND ONLINE IN GUMMY CANDY MARKET, BY TYPE, 2018-2033 (USD THOUSAND)
TABLE 78 MALAYSIA GUMMY CANDY MARKET, BY PRODUCT TYPE, 2018-2033 (USD THOUSAND)
TABLE 79 MALAYSIA GUMMY CANDY MARKET, BY FLAVOUR, 2018-2033 (USD THOUSAND)
TABLE 80 MALAYSIA FRUIT FLAVOURS IN GUMMY CANDY MARKET, BY TYPE, 2018-2033 (USD THOUSAND)
TABLE 81 MALAYSIA GUMMY CANDY MARKET, BY APPLICATION, 2018-2033 (USD THOUSAND)
TABLE 82 MALAYSIA GUMMY CANDY MARKET, BY DISTRIBUTION CHANNEL, 2018-2033 (USD THOUSAND)
TABLE 83 MALAYSIA OFFLINE IN GUMMY CANDY MARKET, BY TYPE , 2018-2033 (USD THOUSAND)
TABLE 84 MALAYSIA ONLINE IN GUMMY CANDY MARKET, BY TYPE, 2018-2033 (USD THOUSAND)
TABLE 85 PHILLIPPINES GUMMY CANDY MARKET, BY PRODUCT TYPE, 2018-2033 (USD THOUSAND)
TABLE 86 PHILLIPPINES GUMMY CANDY MARKET, BY FLAVOUR, 2018-2033 (USD THOUSAND)
TABLE 87 PHILLIPPINES FRUIT FLAVOURS IN GUMMY CANDY MARKET, BY TYPE, 2018-2033 (USD THOUSAND)
TABLE 88 PHILLIPPINES GUMMY CANDY MARKET, BY APPLICATION, 2018-2033 (USD THOUSAND)
TABLE 89 PHILLIPPINES GUMMY CANDY MARKET, BY DISTRIBUTION CHANNEL, 2018-2033 (USD THOUSAND)
TABLE 90 PHILLIPPINES OFFLINE IN GUMMY CANDY MARKET, BY TYPE , 2018-2033 (USD THOUSAND)
TABLE 91 PHILLIPPINES ONLINE IN GUMMY CANDY MARKET, BY TYPE, 2018-2033 (USD THOUSAND)
TABLE 92 SINGAPORE GUMMY CANDY MARKET, BY PRODUCT TYPE, 2018-2033 (USD THOUSAND)
TABLE 93 SINGAPORE GUMMY CANDY MARKET, BY FLAVOUR, 2018-2033 (USD THOUSAND)
TABLE 94 SINGAPORE FRUIT FLAVOURS IN GUMMY CANDY MARKET, BY TYPE, 2018-2033 (USD THOUSAND)
TABLE 95 SINGAPORE GUMMY CANDY MARKET, BY APPLICATION, 2018-2033 (USD THOUSAND)
TABLE 96 SINGAPORE GUMMY CANDY MARKET, BY DISTRIBUTION CHANNEL, 2018-2033 (USD THOUSAND)
TABLE 97 SINGAPORE OFFLINE IN GUMMY CANDY MARKET, BY TYPE , 2018-2033 (USD THOUSAND)
TABLE 98 SINGAPORE ONLINE IN GUMMY CANDY MARKET, BY TYPE, 2018-2033 (USD THOUSAND)
TABLE 99 NEW ZEALAND GUMMY CANDY MARKET, BY PRODUCT TYPE, 2018-2033 (USD THOUSAND)
TABLE 100 NEW ZEALAND GUMMY CANDY MARKET, BY FLAVOUR, 2018-2033 (USD THOUSAND)
TABLE 101 NEW ZEALAND FRUIT FLAVOURS IN GUMMY CANDY MARKET, BY TYPE, 2018-2033 (USD THOUSAND)
TABLE 102 NEW ZEALAND GUMMY CANDY MARKET, BY APPLICATION, 2018-2033 (USD THOUSAND)
TABLE 103 NEW ZEALAND GUMMY CANDY MARKET, BY DISTRIBUTION CHANNEL, 2018-2033 (USD THOUSAND)
TABLE 104 NEW ZEALAND OFFLINE IN GUMMY CANDY MARKET, BY TYPE , 2018-2033 (USD THOUSAND)
TABLE 105 NEW ZEALAND ONLINE IN GUMMY CANDY MARKET, BY TYPE, 2018-2033 (USD THOUSAND)
TABLE 106 REST OF ASIA PACIFIC GUMMY CANDY MARKET, BY PRODUCT TYPE, 2018-2033 (USD THOUSAND)
TABLE 107 REST OF ASIA PACIFIC GUMMY CANDY MARKET, BY FLAVOUR, 2018-2033 (USD THOUSAND)
TABLE 108 REST OF ASIA PACIFIC FRUIT FLAVOURS IN GUMMY CANDY MARKET, BY TYPE, 2018-2033 (USD THOUSAND)
TABLE 109 REST OF ASIA PACIFIC GUMMY CANDY MARKET, BY APPLICATION, 2018-2033 (USD THOUSAND)
TABLE 110 REST OF ASIA PACIFIC GUMMY CANDY MARKET, BY DISTRIBUTION CHANNEL, 2018-2033 (USD THOUSAND)
TABLE 111 REST OF ASIA PACIFIC OFFLINE IN GUMMY CANDY MARKET, BY TYPE , 2018-2033 (USD THOUSAND)
TABLE 112 REST OF ASIA PACIFIC ONLINE IN GUMMY CANDY MARKET, BY TYPE, 2018-2033 (USD THOUSAND)
List of Figure
FIGURE 1 ASIA-PACIFIC GUMMY CANDY MARKET: SEGMENTATION
FIGURE 2 ASIA-PACIFIC GUMMY CANDY MARKET: DATA TRIANGULATION
FIGURE 3 ASIA-PACIFIC GUMMY CANDY MARKET : DROC ANALYSIS
FIGURE 4 ASIA-PACIFIC GUMMY CANDY MARKET: ASIA-PACIFIC VS REGIONAL MARKET ANALYSIS
FIGURE 5 ASIA-PACIFIC GUMMY CANDY MARKET: COMPANY RESEARCH ANALYSIS
FIGURE 6 ASIA-PACIFIC GUMMY CANDY MARKET: INTERVIEW DEMOGRAPHICS
FIGURE 7 ASIA-PACIFIC GUMMY CANDY MARKET: DBMR MARKET POSITION GRID
FIGURE 8 ASIA-PACIFIC GUMMY CANDY MARKET: VENDOR SHARE ANALYSIS
FIGURE 9 ASIA-PACIFIC GUMMY CANDY MARKET : MULTIVARIVATE MODELING
FIGURE 10 ASIA-PACIFIC GUMMY CANDY MARKET: TYPE LIFELINE CURVE
FIGURE 11 ASIA-PACIFIC GUMMY CANDY MARKET: APPLICATION COVERAGE GRID
FIGURE 12 ASIA-PACIFIC GUMMY CANDY MARKET : SEGMENTATION
FIGURE 13 FIVE SEGMENTS COMPRISE THE ASIA-PACIFIC GUMMY CANDY MARKET, BY PRODUCT TYPE (2025)
FIGURE 14 ASIA-PACIFIC GUMMY CANDY MARKET: EXECUTIVE SUMMARY
FIGURE 15 STRATEGIC DECISIONS
FIGURE 16 RISING ASIA-PACIFIC DEMAND FOR CONVENIENT, INDULGENT, AND FUN CONFECTIONERY FORMATS, WITH GUMMIES BENEFITING FROM THEIR CHEWABLE TEXTURE, FLAVOR VARIETY, AND VISUAL APPEAL.IS DRIVING ASIA-PACIFIC GUMMY CANDY MARKET IS EXPECTED TO DRIVE THE ASIA-PACIFIC GUMMY CANDY MARKET DURING THE FORECAST PERIOD OF 2026 TO 2033
FIGURE 17 TRADITIONAL GUMMIES TYPE SEGMENT IS EXPECTED TO ACCOUNT FOR THE LARGEST SHARE OF THE ASIA-PACIFIC GUMMY CANDY MARKET IN 2026 & 2033
FIGURE 18 VENDOR SELECTION CRITERIA
FIGURE 19 DRIVERS, RESTRAINTS, OPPORTUNITIES & CHALLENGES ANALYSIS OF ASIA-PACIFIC GUMMY CANDY MARKET
FIGURE 20 ASIA-PACIFIC GUMMY CANDY MARKET, BY PRODUCT TYPE, 2025
FIGURE 21 ASIA-PACIFIC GUMMY CANDY MARKET, BY FLAVOR, 2025
FIGURE 22 ASIA-PACIFIC GUMMY CANDY MARKET, BY APPLICATION, 2025
FIGURE 23 ASIA-PACIFIC GUMMY CANDY MARKET, BY DISTRIBUTION CHANNEL, 2025
FIGURE 24 ASIA-PACIFIC GUMMY CANDY MARKET: SNAPSHOT (2025)
FIGURE 25 ASIA-PACIFIC GUMMY CANDY MARKET: COMPANY SHARE 2025 (%)
Asia Pacific Gummy Candy Market, Supply Chain Analysis and Ecosystem Framework
To support market growth and help clients navigate the impact of geopolitical shifts, DBMR has integrated in-depth supply chain analysis into its Asia Pacific Gummy Candy Market research reports. This addition empowers clients to respond effectively to global changes affecting their industries. The supply chain analysis section includes detailed insights such as Asia Pacific Gummy Candy Market consumption and production by country, price trend analysis, the impact of tariffs and geopolitical developments, and import and export trends by country and HSN code. It also highlights major suppliers with data on production capacity and company profiles, as well as key importers and exporters. In addition to research, DBMR offers specialized supply chain consulting services backed by over a decade of experience, providing solutions like supplier discovery, supplier risk assessment, price trend analysis, impact evaluation of inflation and trade route changes, and comprehensive market trend analysis.
Research Methodology
Data collection and base year analysis are done using data collection modules with large sample sizes. The stage includes obtaining market information or related data through various sources and strategies. It includes examining and planning all the data acquired from the past in advance. It likewise envelops the examination of information inconsistencies seen across different information sources. The market data is analysed and estimated using market statistical and coherent models. Also, market share analysis and key trend analysis are the major success factors in the market report. To know more, please request an analyst call or drop down your inquiry.
The key research methodology used by DBMR research team is data triangulation which involves data mining, analysis of the impact of data variables on the market and primary (industry expert) validation. Data models include Vendor Positioning Grid, Market Time Line Analysis, Market Overview and Guide, Company Positioning Grid, Patent Analysis, Pricing Analysis, Company Market Share Analysis, Standards of Measurement, Global versus Regional and Vendor Share Analysis. To know more about the research methodology, drop in an inquiry to speak to our industry experts.
Customization Available
Data Bridge Market Research is a leader in advanced formative research. We take pride in servicing our existing and new customers with data and analysis that match and suits their goal. The report can be customized to include price trend analysis of target brands understanding the market for additional countries (ask for the list of countries), clinical trial results data, literature review, refurbished market and product base analysis. Market analysis of target competitors can be analyzed from technology-based analysis to market portfolio strategies. We can add as many competitors that you require data about in the format and data style you are looking for. Our team of analysts can also provide you data in crude raw excel files pivot tables (Fact book) or can assist you in creating presentations from the data sets available in the report.


