
Asia-Pacific Leather Goods Market Analysis and Insights
Increasing innovation in leather goods with new features and designs and introducing bio-based leather are expected to provide opportunities in the Asia-Pacific leather goods market. However, rising awareness regarding the detrimental effects of unethical practices in producing leather goods and lack of skills, technology, intermediate inputs, and processing equipment is projected to challenge the market growth. The low availability of raw materials, the availability of synthetic alternatives such as plastic leather, and the availability of leather goods at low cost are some factors restraining the market growth.
The Asia-Pacific leather goods market report provides details of market share, new developments, and the impact of domestic and localized market players, analyzes opportunities in terms of emerging revenue pockets, changes in market regulations, products approvals, strategic decisions, product launches, geographic expansions, and technological innovations in the market. To understand the analysis and the market scenario contact us for an Analyst Brief, our team will help you create a revenue impact solution to achieve your desired goal.
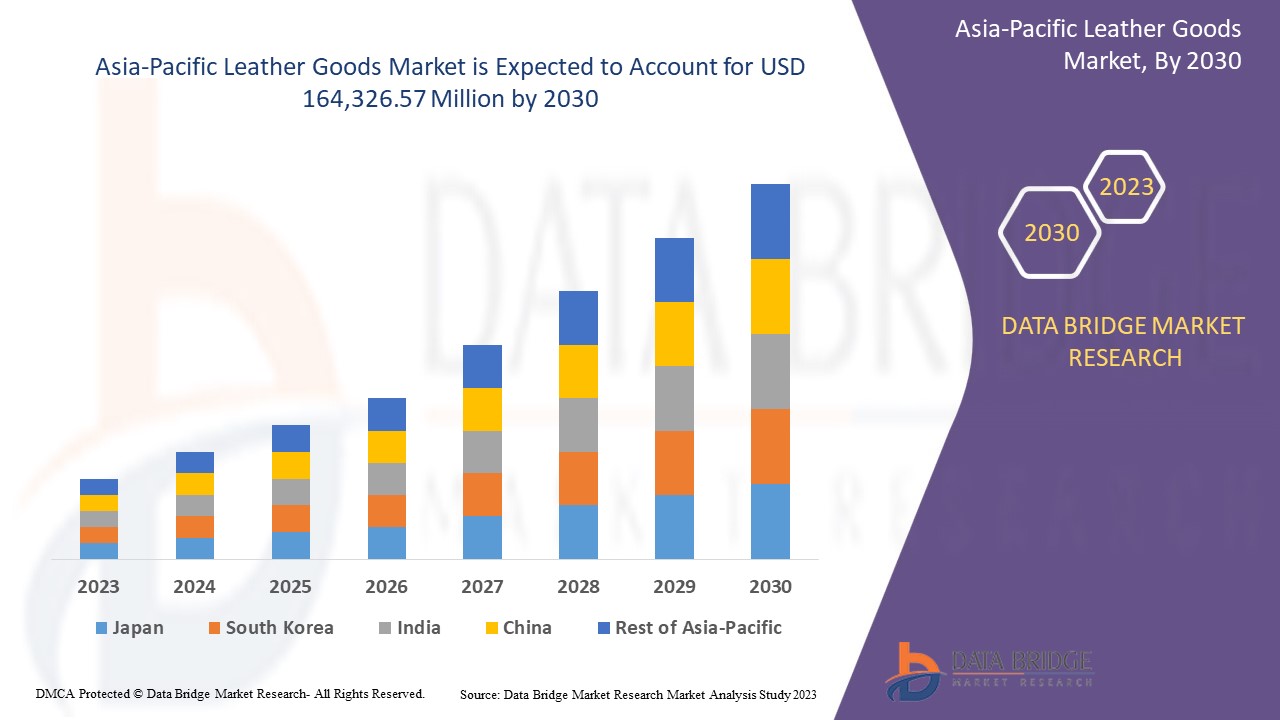
The Asia-Pacific leather goods market is expected to gain significant growth in the forecast period of 2023 to 2030. Data Bridge Market Research analyzes that the market is growing with a CAGR of 7.3% in the forecast period of 2023 to 2030 and is expected to reach USD 164,326.57 million by 2030. The major factor driving the market growth is the rapidly expanding fashion industry which has greatly increased consumer demand for high-quality, premium, and luxury leather products.
|
Report Metric |
Details |
|
Forecast Period |
2023 to 2030 |
|
Base Year |
2022 |
|
Historic Year |
2021 (Customizable to 2020-2015) |
|
Quantitative Units |
Revenue in USD Million |
|
Segments Covered |
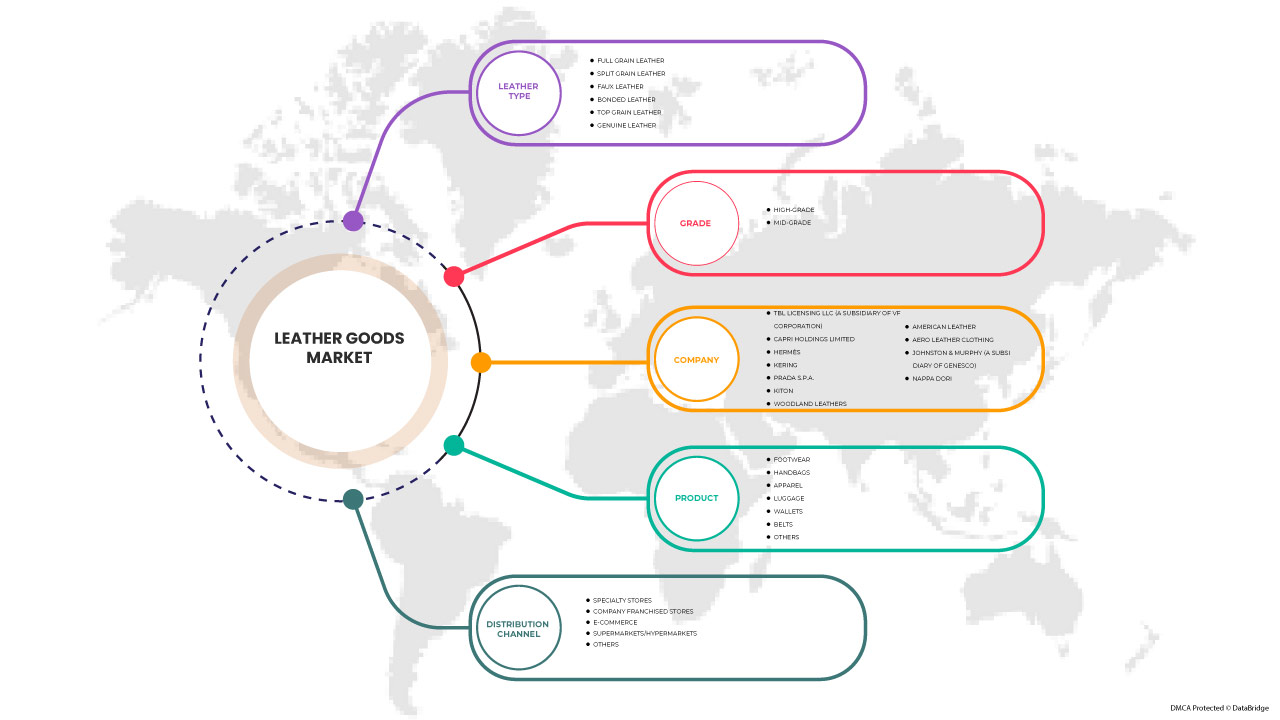
By Leather Type (Full Grain Leather, Split Grain Leather, Top Grain Leather, Genuine Leather, Faux Leather, and Bonded Leather), Product (Footwear, Handbags, Apparel, Luggage, Wallets, Belts, and Others), Grade (High-Grade and Mid-Grade), Distribution Channel (Specialty Stores, Company Franchised Stores, E-Commerce, Supermarkets/Hypermarkets, and Others). |
|
Countries Covered |
Japan, China, South Korea, India, Singapore, Thailand, Indonesia, Malaysia, Philippines, Australia & New Zealand, and rest of Asia-Pacific. |
|
Market Players Covered |
TBL Licensing LLC (A Subsidiary of VF Corporation), CAPRI HOLDINGS LIMITED, Hermès, KERING, PRADA S.P.A., Kiton, Woodland Leathers, American Leather, Aero Leather Clothing, JOHNSTON & MURPHY (A Subsidiary of Genesco), and NAPPA DORI among others. |
Market Definition
Leather goods are articles that are made out of leather. They can come in various products such as clothing, footwear, bags, gloves, and others. Due to the characteristics of leather such as dustproof, fireproof, and durability, leather goods are preferred over other resources. The increasing leather requirement in clothing production is driving market growth.
Asia-Pacific Leather Goods Market Dynamics
This section deals with understanding the market drivers, advantages, opportunities, restraints, and challenges. All of this is discussed in detail below:
Drivers
- Increase in the demand for premium and high-quality luxury leather products
The rapidly expanding fashion industry has greatly increased consumer demand for high-quality, premium, and luxury leather products. Customers value aesthetics and seek high-end products to create a fashion statement. Moreover, an increasing number of High-Net-Worth Individuals (HNWIs), coupled with the growing trend of designer and branded clothes in major markets, such as the U.S., France, and China, is boosting the demand for luxury leather products. Leather goods are exclusive and often premium priced.
- Low-cost and heavy-duty construction of synthetic leather products
Synthetic leather, which is also known as Faux leather, is cheaper than real leather, animal-friendly, can be produced in virtually every color, can be manufactured to feature a high gloss finish, can be easily cleaned with a damp cloth, requires little maintenance, does not crack as easy as real leather, is UV fade resistant and does not have the real leather smell, which is expected to draw its demand in the forecast period. Faux Leather is a man-made product and is very durable. These days Faux Leather is usually stronger than real leather. Artificial leather such as pleather, Naugahyde, vegan leather, barkcloth, cork, glazed cotton, and recycled PET polyester is available in the market. Pleather is commonly used to make artificial leather clothing. It is made from plastic and is less costly and lighter than genuine leather. Products made from pleather are available in a variety of colors. Another material used for leather is Naugahyde which looks similar to animal skin. All these factors and advantages offered by synthetic leather are expected to drive market growth.
- The rise in the demand for comfortable, trendy, fancy leather apparel, footwear, and accessories
Leather goods come in various products like gloves, bags, footwear, watches, furniture, and many others. The increase in the demand for leather in the production of clothing is one of the major driving factors that may positively affect the market growth. Moreover, the special characteristics of leather, such as the fireproof, dustproof, and crack-proof nature and durability of leather goods, are often preferred over other resources and materials, which has helped increase the demand and sales of the market.
Opportunities
- Increase in innovation in leather goods with new features and designs
Consumer behavior has changed substantially over the past decade. As the old technologies have been exploited more, especially in developing and marketing fashion products, companies are getting new possibilities for fulfilling customer needs with product varieties. The development of new surface finishes and embellishments with viable techniques is needed to develop innovative products and add uniqueness and value to the products.
With the fast evolution and changing lifestyle daily, and rising disposable income, consumers are more inclined toward fashionable products. Consumers are improving their living standards based on their disposable income and are consuming more fashionable products. So these kinds of consumer inclinations will create an opportunity for the market players operating in the market.
- Introduction of bio-biased leather
The bio-based leather manufacturing process has no adverse consequences on the ecosystem. Synthetic leather manufactured from natural fibers like flax cotton or cotton fibers coupled with corn, palm, soybean, and others should be the focus of manufacturers to gain a competitive market share in the Asia-Pacific leather goods market with the advent of bio-based leather. Apart from this, leaves of pineapple fruit are indeed being utilized to manufacture "Pinatex," a novel synthetic leather item. These pineapple leaves have an elastic and solid fiber that makes them excellent for usage in the manufacturing procedure.
Restraints/Challenges
- The availability of cheaper leather goods and the shortage of leather goods worldwide
The high cost of natural leather is a factor that has driven the need for natural leather replacements. The low quality of leather and the shortage of leather all over the world are bottlenecks for the leather goods industry. Some kinds of leather goods available in the market have low costs. It will also hamper the supply and demand for good quality leather products and their price. Moreover, the worldwide shortage of leather goods and raw materials, such as genuine leather, is driving up the price of these products. As a result, European buyers are looking for low-cost suppliers who can produce leather from exotic animals like pythons and alligators. These factors are restraining market growth. Also, the low availability of raw materials, the availability of synthetic alternatives such as plastic leather, and the availability of leather goods at low cost are some factors restraining market growth.
- Strict governmental regulations on the production and use of natural leather
Stringent government regulations in regions such as Europe and the U.S., among others, are closing various tanneries and leather processing units. These governments have enforced regulations regarding leather use, which will act as a restraint for market growth in the coming years. Government policies have made new synthetic alternatives, such as plastic leather, available in the market.
- Lack of skills, technology, intermediate inputs and processing equipment
The scarcity of home universities that offers leather technology degrees contributes to this situation. This has created a skill gap that needs to be the priority in the leather sector development. The lack of professionals and inadequate training centers to train technicians and operators required in the sector are the causes of the prevailing situation. The lack of technology, skill, and intermediate is a challenge for the leather goods market as these features help to produce high-quality leather goods. The quality of leather goods is most important for the industry to grow.
Recent Development
- In August 2017, the Swiss luxury brand, Bally, launched its first flagship store in India in a joint-venture partnership with Reliance Brands Limited. This store includes women's and men's shoes, accessories, and premium leather goods.
Asia-Pacific Leather Goods Market Scope
The Asia-Pacific leather goods market is categorized into four notable segments based on leather type, product, grade, and distribution channel. The growth amongst these segments will help you analyze major growth segments in the industries and provide the users with a valuable market overview and market insights to make strategic decisions to identify core market applications.
Leather Type
- Full Grain Leather
- Split Grain Leather
- Faux Leather
- Bonded Leather
- Top Grain Leather
Based on leather type, the market is segmented into full grain leather, split grain leather, top grain leather, genuine leather, faux leather, bonded leather, and others.
Product
- Footwear
- Handbags
- Apparel
- Luggage
- Wallets
- Belts
- Others
Based on product, the market is segmented into footwear, handbags, apparel, luggage, wallets, belts, and others.
Grade
- High-Grade
- Mid-Grade
Based on grade, the market is segmented into high-grade and mid-grade.
Distribution Channel
- Specialty Stores
- Company Franchised Stores
- E-Commerce
- Supermarkets/Hypermarkets
- Others
Based on distribution channel, the market is segmented into specialty stores, company franchised stores, e-commerce, supermarkets/hypermarkets, and others.
Asia-Pacific Leather Goods Market Regional Analysis/Insights
The Asia-Pacific leather goods market is segmented based on leather type, product, grade, and distribution channel.
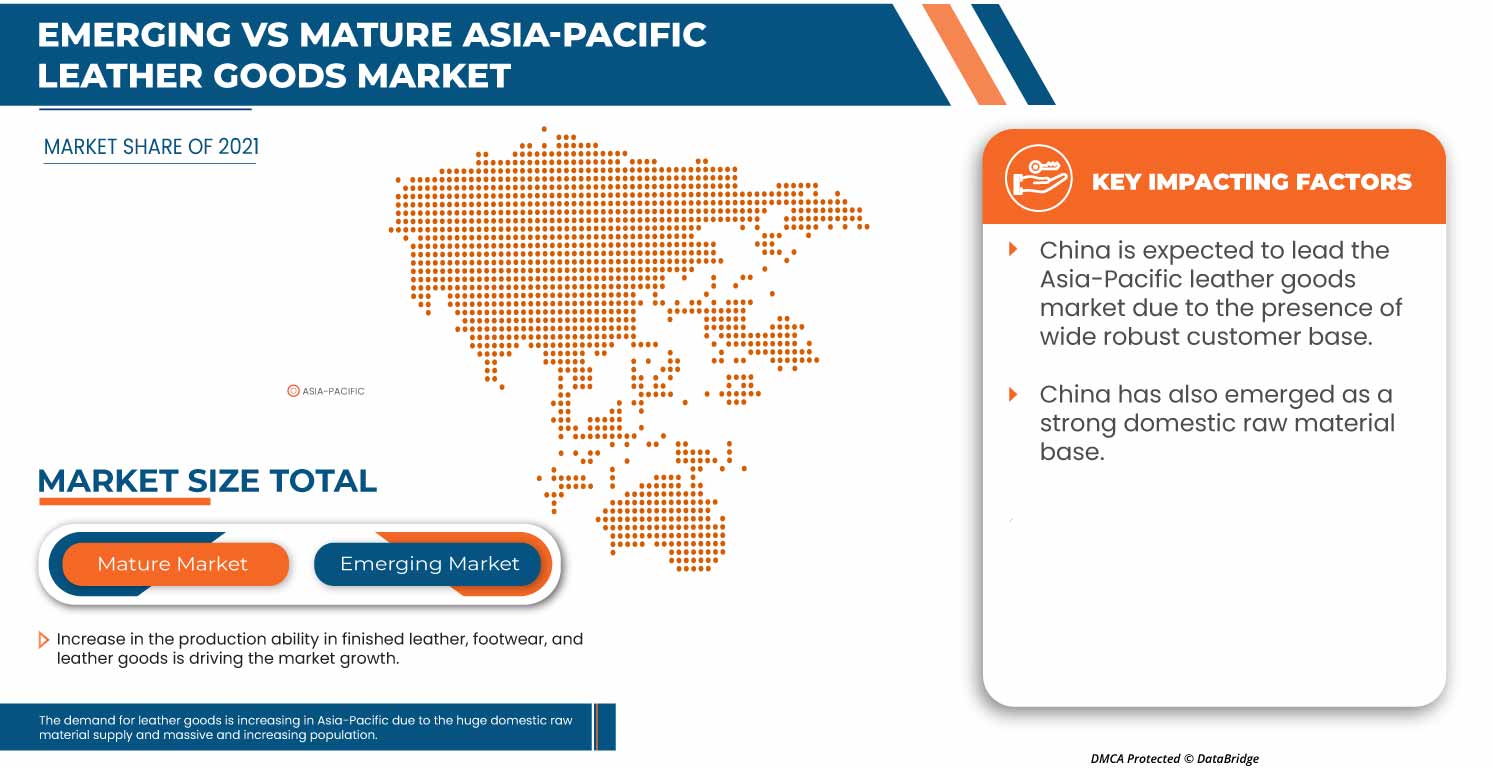
The countries in the Asia-Pacific leather goods market are Japan, China, South Korea, India, Singapore, Thailand, Indonesia, Malaysia, Philippines, Australia & New Zealand, and rest of Asia-Pacific. China is dominating the Asia-Pacific leather goods market in terms of market share and market revenue due to growing awareness of the excellent characteristics and properties of leather goods in the region.
The country section of the report also provides individual market-impacting factors and changes in market regulation that impact the current and future trends of the market. Data point downstream and upstream value chain analysis, technical trends porter's five forces analysis, and case studies are some of the pointers used to forecast the market scenario for individual countries. Also, the presence and availability of Asia-Pacific brands and their challenges faced due to large or scarce competition from local and domestic brands, the impact of domestic tariffs, and trade routes are considered while providing forecast analysis of the country data.
Competitive Landscape and Asia-Pacific Leather Goods Market Share Analysis
Asia-Pacific leather goods market competitive landscape provides details by competitors. Details included are company overview, company financials, revenue generated, market potential, investment in research and development, new market initiatives, production sites and facilities, company strengths and weaknesses, product launch, product trials pipelines, product approvals, patents, product width and breadth, application dominance, and technology lifeline curve. The above data points provided are only related to the companies’ focus related to the Asia-Pacific leather goods market.
Some of the prominent participants operating in the Asia-Pacific leather goods market are TBL Licensing LLC (A Subsidiary of VF Corporation), CAPRI HOLDINGS LIMITED, Hermès, KERING, PRADA S.P.A., Kiton, American Leather, Aero Leather Clothing, JOHNSTON & MURPHY (A Subsidiary of Genesco), and NAPPA DORI among others.
SKU-

- Interactive Data Analysis Dashboard
- Company Analysis Dashboard for high growth potential opportunities
- Research Analyst Access for customization & queries
- Competitor Analysis with Interactive dashboard
- Latest News, Updates & Trend analysis
- Harness the Power of Benchmark Analysis for Comprehensive Competitor Tracking
Table of Content
1 INTRODUCTION
1.1 OBJECTIVES OF THE STUDY
1.2 MARKET DEFINITION
1.3 OVERVIEW OF THE ASIA PACIFIC LEATHER GOODS MARKET
1.4 LIMITATIONS
1.5 MARKETS COVERED
2 MARKET SEGMENTATION
2.1 MARKETS COVERED
2.2 GEOGRAPHICAL SCOPE
2.3 YEARS CONSIDERED FOR THE STUDY
2.4 CURRENCY AND PRICING
2.5 DBMR TRIPOD DATA VALIDATION MODEL
2.6 PRODUCT LIFELINE CURVE
2.7 MULTIVARIATE MODELING
2.8 PRIMARY INTERVIEWS WITH KEY OPINION LEADERS
2.9 DBMR MARKET POSITION GRID
2.1 DBMR MARKET CHALLENGE MATRIX
2.11 DBMR VENDOR SHARE ANALYSIS
2.12 IMPORT-EXPORT DATA
2.13 SECONDARY SOURCES
2.14 ASSUMPTIONS
3 EXECUTIVE SUMMARY
4 PREMIUM INSIGHTS
5 MARKET OVERVIEW
5.1 DRIVERS
5.1.1 THE RISE IN THE DEMAND FOR COMFORTABLE, TRENDY, FANCY LEATHER APPAREL, FOOTWEAR, AND ACCESSORIES
5.1.2 INCREASE IN THE DEMAND FOR PREMIUM AND HIGH-QUALITY LUXURY LEATHER PRODUCTS
5.1.3 LOW-COST AND HEAVY-DUTY CONSTRUCTION OF SYNTHETIC LEATHER PRODUCTS
5.1.4 RISE IN THE EXPENDITURE ON HOME FURNISHING AND RENOVATION
5.2 RESTRAINTS
5.2.1 THE AVAILABILITY OF CHEAPER LEATHER GOODS AND THE SHORTAGE OF LEATHER GOODS WORLDWIDE
5.2.2 STRICT GOVERNMENTAL REGULATIONS ON THE PRODUCTION AND USE OF NATURAL LEATHER
5.3 OPPORTUNITIES
5.3.1 INCREASE IN INNOVATION IN LEATHER GOODS WITH NEW FEATURES AND DESIGNS
5.3.2 INTRODUCTION OF BIO-BIASED LEATHER
5.4 CHALLENGES
5.4.1 RISE IN THE AWARENESS REGARDING THE DETRIMENTAL EFFECTS OF UNETHICAL PRACTICES IN THE PRODUCTION OF LEATHER GOODS
5.4.2 LACK OF SKILLS, TECHNOLOGY, INTERMEDIATE INPUTS, AND PROCESSING EQUIPMENT
6 ASIA PACIFIC LEATHER GOODS MARKET, BY PRODUCT
6.1 OVERVIEW
6.2 FOOTWEAR
6.2.1 FOOTWEAR, BY TYPE
6.2.1.1 BOOTS
6.2.1.2 FORMAL SHOES
6.2.1.3 LOAFERS
6.2.1.4 BALLERINAS
6.2.1.5 SANDALS
6.2.1.6 OTHERS
6.3 HANDBAGS
6.3.1 HANDBAGS, BY TYPE
6.3.1.1 SLING BAG
6.3.1.2 CLUTCHES
6.3.1.3 SATCHEL BAG
6.3.1.4 TOTE BAGS
6.3.1.5 WRISTLET BAG
6.3.1.6 OTHERS
6.4 APPAREL
6.4.1 APPAREL, BY TYPE
6.4.1.1 JACKET
6.4.1.2 CAPS
6.4.1.3 SUIT
6.4.1.4 WAISTCOAT
6.4.1.5 SHIRTS
6.4.1.6 OTHERS
6.5 LUGGAGE
6.5.1 LUGGAGE, BY TYPE
6.5.1.1 TRAVEL BAGS
6.5.1.2 BUSINESS BAGS
6.5.1.3 DUFFEL BAGS
6.5.1.4 SUITCASE & BRIEFCASE
6.5.1.5 ROLLABLE LUGGAGE
6.5.1.6 OTHERS
6.6 WALLETS
6.7 BELTS
6.8 OTHERS
7 ASIA PACIFIC LEATHER GOODS MARKET, BY LEATHER TYPE
7.1 OVERVIEW
7.2 FULL GRAIN LEATHER
7.3 SPLIT GRAIN LEATHER
7.4 TOP GRAIN LEATHER
7.5 GENUINE LEATHER
7.6 FAUX LEATHER
7.7 BONDED LEATHER
8 ASIA PACIFIC LEATHER GOODS MARKET, BY GRADE
8.1 OVERVIEW
8.2 HIGH-GRADE
8.3 MID-GRADE
9 ASIA PACIFIC LEATHER GOODS MARKET, BY DISTRIBUTION CHANNEL
9.1 OVERVIEW
9.2 SPECIALTY STORES
9.3 COMPANY FRANCHISED STORES
9.4 E-COMMERCE
9.5 SUPERMARKETS/HYPERMARKETS
9.6 OTHERS
10 ASIA PACIFIC LEATHER GOODS MARKET, BY REGION
10.1 ASIA-PACIFIC
10.1.1 CHINA
10.1.2 INDIA
10.1.3 JAPAN
10.1.4 SOUTH KOREA
10.1.5 AUSTRALIA & NEW ZEALAND
10.1.6 SINGAPORE
10.1.7 THAILAND
10.1.8 INDONESIA
10.1.9 MALAYSIA
10.1.10 PHILIPPINES
10.1.11 REST OF ASIA-PACIFIC
11 ASIA PACIFIC LEATHER GOODS MARKET: COMPANY LANDSCAPE
11.1 COMPANY SHARE ANALYSIS: ASIA PACIFIC
11.2 EVENT
11.3 ACQUISITION
11.4 AWARD
12 SWOT ANALYSIS
13 COMPANY PROFILES
13.1 KERING
13.1.1 COMPANY SNAPSHOT
13.1.2 REVENUE ANALYSIS
13.1.3 COMPANY SHARE ANALYSIS
13.1.4 PRODUCT PORTFOLIO
13.1.5 RECENT DEVELOPMENTS
13.2 PRADA S.P.A.
13.2.1 COMPANY SNAPSHOT
13.2.2 REVENUE ANALYSIS
13.2.3 COMPANY SHARE ANALYSIS
13.2.4 PRODUCT PORTFOLIO
13.2.5 RECENT DEVELOPMENTS
13.3 CAPRI HOLDINGS LIMITED
13.3.1 COMPANY SNAPSHOT
13.3.2 REVENUE ANALYSIS
13.3.3 COMPANY SHARE ANALYSIS
13.3.4 PRODUCT PORTFOLIO
13.3.5 RECENT DEVELOPMENTS
13.4 HERMÈS
13.4.1 COMPANY SNAPSHOT
13.4.2 REVENUE ANALYSIS
13.4.3 COMPANY SHARE ANALYSIS
13.4.4 PRODUCT PORTFOLIO
13.4.5 RECENT DEVELOPMENTS
13.5 TBL LICENSING LLC (A SUBSIDIARY OF VF CORPORATION)
13.5.1 COMPANY SNAPSHOT
13.5.2 REVENUE ANALYSIS
13.5.3 COMPANY SHARE ANALYSIS
13.5.4 PRODUCT PORTFOLIO
13.5.5 RECENT DEVELOPMENTS
13.6 AERO LEATHER CLOTHING
13.6.1 COMPANY SNAPSHOT
13.6.2 PRODUCT PORTFOLIO
13.6.3 RECENT DEVELOPMENT
13.7 AMERICAN LEATHER
13.7.1 COMPANY SNAPSHOT
13.7.2 PRODUCT PORTFOLIO
13.7.3 RECENT DEVELOPMENTS
13.8 JOHNSTON & MURPHY (A SUBSIDIARY OF GENESCO)
13.8.1 COMPANY SNAPSHOT
13.8.2 REVENUE ANALYSIS
13.8.3 PRODUCT PORTFOLIO
13.8.4 RECENT DEVELOPMENTS
13.9 KITON
13.9.1 COMPANY SNAPSHOT
13.9.2 PRODUCT PORTFOLIO
13.9.3 RECENT UPDATES
13.1 NAPPA DORI
13.10.1 COMPANY SNAPSHOT
13.10.2 PRODUCT PORTFOLIO
13.10.3 RECENT DEVELOPMENTS
13.11 WOODLAND LEATHERS
13.11.1 COMPANY SNAPSHOT
13.11.2 PRODUCT PORTFOLIO
13.11.3 RECENT UPDATES
14 QUESTIONNAIRE
15 RELATED REPORTS
List of Table
TABLE 1 IMPORT DATA OF TRUNKS, SUITCASES, VANITY CASES, EXECUTIVE CASES, BRIEFCASES, SCHOOL SATCHELS, SPECTACLE CASES, AND OTHER GOODS PRODUCED USING LEATHER AND SIMILAR MATERIALS; HS CODE – 4202 (USD THOUSAND)
TABLE 2 EXPORT DATA OF TRUNKS, SUITCASES, VANITY CASES, EXECUTIVE CASES, BRIEFCASES, SCHOOL SATCHELS, SPECTACLE CASES, AND OTHER GOODS PRODUCED USING LEATHER AND SIMILAR MATERIALS; HS CODE – 4202 (USD THOUSAND)
TABLE 3 ASIA PACIFIC LEATHER GOODS MARKET, BY PRODUCT, 2021-2030 (USD MILLION)
TABLE 4 ASIA PACIFIC FOOTWEAR IN LEATHER GOODS MARKET, BY REGION, 2021-2030 (USD MILLION)
TABLE 5 ASIA PACIFIC FOOTWEAR IN LEATHER GOODS MARKET, BY TYPE, 2021-2030 (USD MILLION)
TABLE 6 ASIA PACIFIC HANDBAGS IN LEATHER GOODS MARKET, BY REGION, 2021-2030 (USD MILLION)
TABLE 7 ASIA PACIFIC HANDBAGS IN LEATHER GOODS MARKET, BY TYPE, 2021-2030 (USD MILLION)
TABLE 8 ASIA PACIFIC APPAREL IN LEATHER GOODS MARKET, BY REGION, 2021-2030 (USD MILLION)
TABLE 9 ASIA PACIFIC APPAREL IN LEATHER GOODS MARKET, BY TYPE, 2021-2030 (USD MILLION)
TABLE 10 ASIA PACIFIC LUGGAGE IN LEATHER GOODS MARKET, BY REGION, 2021-2030 (USD MILLION)
TABLE 11 ASIA PACIFIC LUGGAGE IN LEATHER GOODS MARKET, BY TYPE, 2021-2030 (USD MILLION)
TABLE 12 ASIA PACIFIC WALLETS IN LEATHER GOODS MARKET, BY REGION, 2021-2030 (USD MILLION)
TABLE 13 ASIA PACIFIC BELTS IN LEATHER GOODS MARKET, BY REGION, 2021-2030 (USD MILLION)
TABLE 14 ASIA PACIFIC OTHERS IN LEATHER GOODS MARKET, BY REGION, 2021-2030 (USD MILLION)
TABLE 15 ASIA PACIFIC LEATHER GOODS MARKET, BY LEATHER TYPE, 2021-2030 (USD MILLION)
TABLE 16 ASIA PACIFIC FULL GRAIN LEATHER IN LEATHER GOODS MARKET, BY REGION, 2021-2030 (USD MILLION)
TABLE 17 ASIA PACIFIC SPLIT GRAIN LEATHER IN LEATHER GOODS MARKET, BY REGION, 2021-2030 (USD MILLION)
TABLE 18 ASIA PACIFIC TOP GRAIN LEATHER IN LEATHER GOODS MARKET, BY REGION, 2021-2030 (USD MILLION)
TABLE 19 ASIA PACIFIC GENUINE LEATHER IN LEATHER GOODS MARKET, BY REGION, 2021-2030 (USD MILLION)
TABLE 20 ASIA PACIFIC FAUX LEATHER IN LEATHER GOODS MARKET, BY REGION, 2021-2030 (USD MILLION)
TABLE 21 ASIA PACIFIC BONDED LEATHER IN LEATHER GOODS MARKET, BY REGION, 2021-2030 (USD MILLION)
TABLE 22 ASIA PACIFIC LEATHER GOODS MARKET, BY GRADE, 2021-2030 (USD MILLION)
TABLE 23 ASIA PACIFIC HIGH-GRADE IN LEATHER GOODS MARKET, BY REGION, 2021-2030 (USD MILLION)
TABLE 24 ASIA PACIFIC MID-GRADE IN LEATHER GOODS MARKET, BY REGION, 2021-2030 (USD MILLION)
TABLE 25 ASIA PACIFIC LEATHER GOODS MARKET, BY DISTRIBUTION CHANNEL, 2021-2030 (USD MILLION)
TABLE 26 ASIA PACIFIC SPECIALTY STORES IN LEATHER GOODS MARKET, BY REGION, 2021-2030 (USD MILLION)
TABLE 27 ASIA PACIFIC COMPANY FRANCHISED STORES IN LEATHER GOODS MARKET, BY REGION, 2021-2030 (USD MILLION)
TABLE 28 ASIA PACIFIC E-COMMERCE IN LEATHER GOODS MARKET, BY REGION, 2021-2030 (USD MILLION)
TABLE 29 ASIA PACIFIC SUPERMARKETS/HYPERMARKETS IN LEATHER GOODS MARKET, BY REGION, 2021-2030 (USD MILLION)
TABLE 30 ASIA PACIFIC OTHERS IN LEATHER GOODS MARKET, BY REGION, 2021-2030 (USD MILLION)
TABLE 31 ASIA-PACIFIC LEATHER GOODS MARKET, BY COUNTRY, 2021-2030 (USD MILLION)
TABLE 32 ASIA-PACIFIC LEATHER GOODS MARKET, BY PRODUCT, 2021-2030 (USD MILLION)
TABLE 33 ASIA-PACIFIC FOOTWEAR IN LEATHER GOODS MARKET, BY TYPE, 2021-2030 (USD MILLION)
TABLE 34 ASIA-PACIFIC HANDBAGS IN LEATHER GOODS MARKET, BY TYPE, 2021-2030 (USD MILLION)
TABLE 35 ASIA-PACIFIC APPAREL IN LEATHER GOODS MARKET, BY TYPE, 2021-2030 (USD MILLION)
TABLE 36 ASIA-PACIFIC LUGGAGE IN LEATHER GOODS MARKET, BY TYPE, 2021-2030 (USD MILLION)
TABLE 37 ASIA-PACIFIC LEATHER GOODS MARKET, BY LEATHER TYPE, 2021-2030 (USD MILLION)
TABLE 38 ASIA-PACIFIC LEATHER GOODS MARKET, BY GRADE, 2021-2030 (USD MILLION)
TABLE 39 ASIA-PACIFIC LEATHER GOODS MARKET, BY DISTRIBUTION CHANNEL, 2021-2030 (USD MILLION)
TABLE 40 CHINA LEATHER GOODS MARKET, BY PRODUCT, 2021-2030 (USD MILLION)
TABLE 41 CHINA FOOTWEAR IN LEATHER GOODS MARKET, BY TYPE, 2021-2030 (USD MILLION)
TABLE 42 CHINA HANDBAGS IN LEATHER GOODS MARKET, BY TYPE, 2021-2030 (USD MILLION)
TABLE 43 CHINA APPAREL IN LEATHER GOODS MARKET, BY TYPE, 2021-2030 (USD MILLION)
TABLE 44 CHINA LUGGAGE IN LEATHER GOODS MARKET, BY TYPE, 2021-2030 (USD MILLION)
TABLE 45 CHINA LEATHER GOODS MARKET, BY LEATHER TYPE, 2021-2030 (USD MILLION)
TABLE 46 CHINA LEATHER GOODS MARKET, BY GRADE, 2021-2030 (USD MILLION)
TABLE 47 CHINA LEATHER GOODS MARKET, BY DISTRIBUTION CHANNEL, 2021-2030 (USD MILLION)
TABLE 48 INDIA LEATHER GOODS MARKET, BY PRODUCT, 2021-2030 (USD MILLION)
TABLE 49 INDIA FOOTWEAR IN LEATHER GOODS MARKET, BY TYPE, 2021-2030 (USD MILLION)
TABLE 50 INDIA HANDBAGS IN LEATHER GOODS MARKET, BY TYPE, 2021-2030 (USD MILLION)
TABLE 51 INDIA APPAREL IN LEATHER GOODS MARKET, BY TYPE, 2021-2030 (USD MILLION)
TABLE 52 INDIA LUGGAGE IN LEATHER GOODS MARKET, BY TYPE, 2021-2030 (USD MILLION)
TABLE 53 INDIA LEATHER GOODS MARKET, BY LEATHER TYPE, 2021-2030 (USD MILLION)
TABLE 54 INDIA LEATHER GOODS MARKET, BY GRADE, 2021-2030 (USD MILLION)
TABLE 55 INDIA LEATHER GOODS MARKET, BY DISTRIBUTION CHANNEL, 2021-2030 (USD MILLION)
TABLE 56 JAPAN LEATHER GOODS MARKET, BY PRODUCT, 2021-2030 (USD MILLION)
TABLE 57 JAPAN FOOTWEAR IN LEATHER GOODS MARKET, BY TYPE, 2021-2030 (USD MILLION)
TABLE 58 JAPAN HANDBAGS IN LEATHER GOODS MARKET, BY TYPE, 2021-2030 (USD MILLION)
TABLE 59 JAPAN APPAREL IN LEATHER GOODS MARKET, BY TYPE, 2021-2030 (USD MILLION)
TABLE 60 JAPAN LUGGAGE IN LEATHER GOODS MARKET, BY TYPE, 2021-2030 (USD MILLION)
TABLE 61 JAPAN LEATHER GOODS MARKET, BY LEATHER TYPE, 2021-2030 (USD MILLION)
TABLE 62 JAPAN LEATHER GOODS MARKET, BY GRADE, 2021-2030 (USD MILLION)
TABLE 63 JAPAN LEATHER GOODS MARKET, BY DISTRIBUTION CHANNEL, 2021-2030 (USD MILLION)
TABLE 64 SOUTH KOREA LEATHER GOODS MARKET, BY PRODUCT, 2021-2030 (USD MILLION)
TABLE 65 SOUTH KOREA FOOTWEAR IN LEATHER GOODS MARKET, BY TYPE, 2021-2030 (USD MILLION)
TABLE 66 SOUTH KOREA HANDBAGS IN LEATHER GOODS MARKET, BY TYPE, 2021-2030 (USD MILLION)
TABLE 67 SOUTH KOREA APPAREL IN LEATHER GOODS MARKET, BY TYPE, 2021-2030 (USD MILLION)
TABLE 68 SOUTH KOREA LUGGAGE IN LEATHER GOODS MARKET, BY TYPE, 2021-2030 (USD MILLION)
TABLE 69 SOUTH KOREA LEATHER GOODS MARKET, BY LEATHER TYPE, 2021-2030 (USD MILLION)
TABLE 70 SOUTH KOREA LEATHER GOODS MARKET, BY GRADE, 2021-2030 (USD MILLION)
TABLE 71 SOUTH KOREA LEATHER GOODS MARKET, BY DISTRIBUTION CHANNEL, 2021-2030 (USD MILLION)
TABLE 72 AUSTRALIA & NEW ZEALAND LEATHER GOODS MARKET, BY PRODUCT, 2021-2030 (USD MILLION)
TABLE 73 AUSTRALIA & NEW ZEALAND FOOTWEAR IN LEATHER GOODS MARKET, BY TYPE, 2021-2030 (USD MILLION)
TABLE 74 AUSTRALIA & NEW ZEALAND HANDBAGS IN LEATHER GOODS MARKET, BY TYPE, 2021-2030 (USD MILLION)
TABLE 75 AUSTRALIA & NEW ZEALAND APPAREL IN LEATHER GOODS MARKET, BY TYPE, 2021-2030 (USD MILLION)
TABLE 76 AUSTRALIA & NEW ZEALAND LUGGAGE IN LEATHER GOODS MARKET, BY TYPE, 2021-2030 (USD MILLION)
TABLE 77 AUSTRALIA & NEW ZEALAND LEATHER GOODS MARKET, BY LEATHER TYPE, 2021-2030 (USD MILLION)
TABLE 78 AUSTRALIA & NEW ZEALAND LEATHER GOODS MARKET, BY GRADE, 2021-2030 (USD MILLION)
TABLE 79 AUSTRALIA & NEW ZEALAND LEATHER GOODS MARKET, BY DISTRIBUTION CHANNEL, 2021-2030 (USD MILLION)
TABLE 80 SINGAPORE LEATHER GOODS MARKET, BY PRODUCT, 2021-2030 (USD MILLION)
TABLE 81 SINGAPORE FOOTWEAR IN LEATHER GOODS MARKET, BY TYPE, 2021-2030 (USD MILLION)
TABLE 82 SINGAPORE HANDBAGS IN LEATHER GOODS MARKET, BY TYPE, 2021-2030 (USD MILLION)
TABLE 83 SINGAPORE APPAREL IN LEATHER GOODS MARKET, BY TYPE, 2021-2030 (USD MILLION)
TABLE 84 SINGAPORE LUGGAGE IN LEATHER GOODS MARKET, BY TYPE, 2021-2030 (USD MILLION)
TABLE 85 SINGAPORE LEATHER GOODS MARKET, BY LEATHER TYPE, 2021-2030 (USD MILLION)
TABLE 86 SINGAPORE LEATHER GOODS MARKET, BY GRADE, 2021-2030 (USD MILLION)
TABLE 87 SINGAPORE LEATHER GOODS MARKET, BY DISTRIBUTION CHANNEL, 2021-2030 (USD MILLION)
TABLE 88 THAILAND LEATHER GOODS MARKET, BY PRODUCT, 2021-2030 (USD MILLION)
TABLE 89 THAILAND FOOTWEAR IN LEATHER GOODS MARKET, BY TYPE, 2021-2030 (USD MILLION)
TABLE 90 THAILAND HANDBAGS IN LEATHER GOODS MARKET, BY TYPE, 2021-2030 (USD MILLION)
TABLE 91 THAILAND APPAREL IN LEATHER GOODS MARKET, BY TYPE, 2021-2030 (USD MILLION)
TABLE 92 THAILAND LUGGAGE IN LEATHER GOODS MARKET, BY TYPE, 2021-2030 (USD MILLION)
TABLE 93 THAILAND LEATHER GOODS MARKET, BY LEATHER TYPE, 2021-2030 (USD MILLION)
TABLE 94 THAILAND LEATHER GOODS MARKET, BY GRADE, 2021-2030 (USD MILLION)
TABLE 95 THAILAND LEATHER GOODS MARKET, BY DISTRIBUTION CHANNEL, 2021-2030 (USD MILLION)
TABLE 96 INDONESIA LEATHER GOODS MARKET, BY PRODUCT, 2021-2030 (USD MILLION)
TABLE 97 INDONESIA FOOTWEAR IN LEATHER GOODS MARKET, BY TYPE, 2021-2030 (USD MILLION)
TABLE 98 INDONESIA HANDBAGS IN LEATHER GOODS MARKET, BY TYPE, 2021-2030 (USD MILLION)
TABLE 99 INDONESIA APPAREL IN LEATHER GOODS MARKET, BY TYPE, 2021-2030 (USD MILLION)
TABLE 100 INDONESIA LUGGAGE IN LEATHER GOODS MARKET, BY TYPE, 2021-2030 (USD MILLION)
TABLE 101 INDONESIA LEATHER GOODS MARKET, BY LEATHER TYPE, 2021-2030 (USD MILLION)
TABLE 102 INDONESIA LEATHER GOODS MARKET, BY GRADE, 2021-2030 (USD MILLION)
TABLE 103 INDONESIA LEATHER GOODS MARKET, BY DISTRIBUTION CHANNEL, 2021-2030 (USD MILLION)
TABLE 104 MALAYSIA LEATHER GOODS MARKET, BY PRODUCT, 2021-2030 (USD MILLION)
TABLE 105 MALAYSIA FOOTWEAR IN LEATHER GOODS MARKET, BY TYPE, 2021-2030 (USD MILLION)
TABLE 106 MALAYSIA HANDBAGS IN LEATHER GOODS MARKET, BY TYPE, 2021-2030 (USD MILLION)
TABLE 107 MALAYSIA APPAREL IN LEATHER GOODS MARKET, BY TYPE, 2021-2030 (USD MILLION)
TABLE 108 MALAYSIA LUGGAGE IN LEATHER GOODS MARKET, BY TYPE, 2021-2030 (USD MILLION)
TABLE 109 MALAYSIA LEATHER GOODS MARKET, BY LEATHER TYPE, 2021-2030 (USD MILLION)
TABLE 110 MALAYSIA LEATHER GOODS MARKET, BY GRADE, 2021-2030 (USD MILLION)
TABLE 111 MALAYSIA LEATHER GOODS MARKET, BY DISTRIBUTION CHANNEL, 2021-2030 (USD MILLION)
TABLE 112 PHILIPPINES LEATHER GOODS MARKET, BY PRODUCT, 2021-2030 (USD MILLION)
TABLE 113 PHILIPPINES FOOTWEAR IN LEATHER GOODS MARKET, BY TYPE, 2021-2030 (USD MILLION)
TABLE 114 PHILIPPINES HANDBAGS IN LEATHER GOODS MARKET, BY TYPE, 2021-2030 (USD MILLION)
TABLE 115 PHILIPPINES APPAREL IN LEATHER GOODS MARKET, BY TYPE, 2021-2030 (USD MILLION)
TABLE 116 PHILIPPINES LUGGAGE IN LEATHER GOODS MARKET, BY TYPE, 2021-2030 (USD MILLION)
TABLE 117 PHILIPPINES LEATHER GOODS MARKET, BY LEATHER TYPE, 2021-2030 (USD MILLION)
TABLE 118 PHILIPPINES LEATHER GOODS MARKET, BY GRADE, 2021-2030 (USD MILLION)
TABLE 119 PHILIPPINES LEATHER GOODS MARKET, BY DISTRIBUTION CHANNEL, 2021-2030 (USD MILLION)
TABLE 120 REST OF ASIA-PACIFIC LEATHER GOODS MARKET, BY PRODUCT, 2021-2030 (USD MILLION)
List of Figure
FIGURE 1 ASIA PACIFIC LEATHER GOODS MARKET
FIGURE 2 ASIA PACIFIC LEATHER GOODS MARKET: DATA TRIANGULATION
FIGURE 3 ASIA PACIFIC LEATHER GOODS MARKET: DROC ANALYSIS
FIGURE 4 ASIA PACIFIC LEATHER GOODS MARKET: ASIA PACIFIC VS REGIONAL MARKET ANALYSIS
FIGURE 5 ASIA PACIFIC LEATHER GOODS MARKET: COMPANY RESEARCH ANALYSIS
FIGURE 6 ASIA PACIFIC LEATHER GOODS MARKET: THE PRODUCT LIFE LINE CURVE
FIGURE 7 ASIA PACIFIC LEATHER GOODS MARKET: MULTIVARIATE MODELLING
FIGURE 8 ASIA PACIFIC LEATHER GOODS MARKET: INTERVIEW DEMOGRAPHICS
FIGURE 9 ASIA PACIFIC LEATHER GOODS MARKET: DBMR MARKET POSITION GRID
FIGURE 10 ASIA PACIFIC LEATHER GOODS MARKET: THE MARKET CHALLENGE MATRIX
FIGURE 11 ASIA PACIFIC LEATHER GOODS MARKET: VENDOR SHARE ANALYSIS
FIGURE 12 ASIA PACIFIC LEATHER GOODS MARKET: SEGMENTATION
FIGURE 13 RISING DEMAND FOR COMFORTABLE, TRENDY, AND FANCY LEATHER APPAREL, FOOTWEAR, AND ACCESSORIES IS EXPECTED TO DRIVE THE ASIA PACIFIC LEATHER GOODS MARKET IN THE FORECAST PERIOD
FIGURE 14 FOOTWEAR SEGMENT IS EXPECTED TO ACCOUNT FOR THE LARGEST SHARE OF THE ASIA PACIFIC LEATHER GOODS MARKET IN 2022 & 2029
FIGURE 15 DRIVERS, RESTRAINTS, OPPORTUNITIES, AND CHALLENGES OF THE ASIA PACIFIC LEATHER GOODS MARKET
FIGURE 16 ASIA PACIFIC LEATHER GOODS MARKET: BY PRODUCT, 2022
FIGURE 17 ASIA PACIFIC LEATHER GOODS MARKET: BY LEATHER TYPE, 2022
FIGURE 18 ASIA PACIFIC LEATHER GOODS MARKET: BY GRADE, 2022
FIGURE 19 ASIA PACIFIC LEATHER GOODS MARKET: BY DISTRIBUTION CHANNEL, 2022
FIGURE 20 ASIA-PACIFIC LEATHER GOODS MARKET: SNAPSHOT (2022)
FIGURE 21 ASIA-PACIFIC LEATHER GOODS MARKET: BY COUNTRY (2022)
FIGURE 22 ASIA-PACIFIC LEATHER GOODS MARKET: BY COUNTRY (2023 & 2030)
FIGURE 23 ASIA-PACIFIC LEATHER GOODS MARKET: BY COUNTRY (2022 & 2030)
FIGURE 24 ASIA-PACIFIC LEATHER GOODS MARKET: BY PRODUCT (2023 - 2030)
FIGURE 25 ASIA PACIFIC LEATHER GOODS MARKET: COMPANY SHARE 2022 (%)
Data collection and base year analysis are done using data collection modules with large sample sizes. The stage includes obtaining market information or related data through various sources and strategies. It includes examining and planning all the data acquired from the past in advance. It likewise envelops the examination of information inconsistencies seen across different information sources. The market data is analysed and estimated using market statistical and coherent models. Also, market share analysis and key trend analysis are the major success factors in the market report. To know more, please request an analyst call or drop down your inquiry.
The key research methodology used by DBMR research team is data triangulation which involves data mining, analysis of the impact of data variables on the market and primary (industry expert) validation. Data models include Vendor Positioning Grid, Market Time Line Analysis, Market Overview and Guide, Company Positioning Grid, Patent Analysis, Pricing Analysis, Company Market Share Analysis, Standards of Measurement, Global versus Regional and Vendor Share Analysis. To know more about the research methodology, drop in an inquiry to speak to our industry experts.
Data Bridge Market Research is a leader in advanced formative research. We take pride in servicing our existing and new customers with data and analysis that match and suits their goal. The report can be customized to include price trend analysis of target brands understanding the market for additional countries (ask for the list of countries), clinical trial results data, literature review, refurbished market and product base analysis. Market analysis of target competitors can be analyzed from technology-based analysis to market portfolio strategies. We can add as many competitors that you require data about in the format and data style you are looking for. Our team of analysts can also provide you data in crude raw excel files pivot tables (Fact book) or can assist you in creating presentations from the data sets available in the report.


