
Asia Pacific Premium Wine Market
Market Size in USD Million
 USD
11,250.16 Million
USD
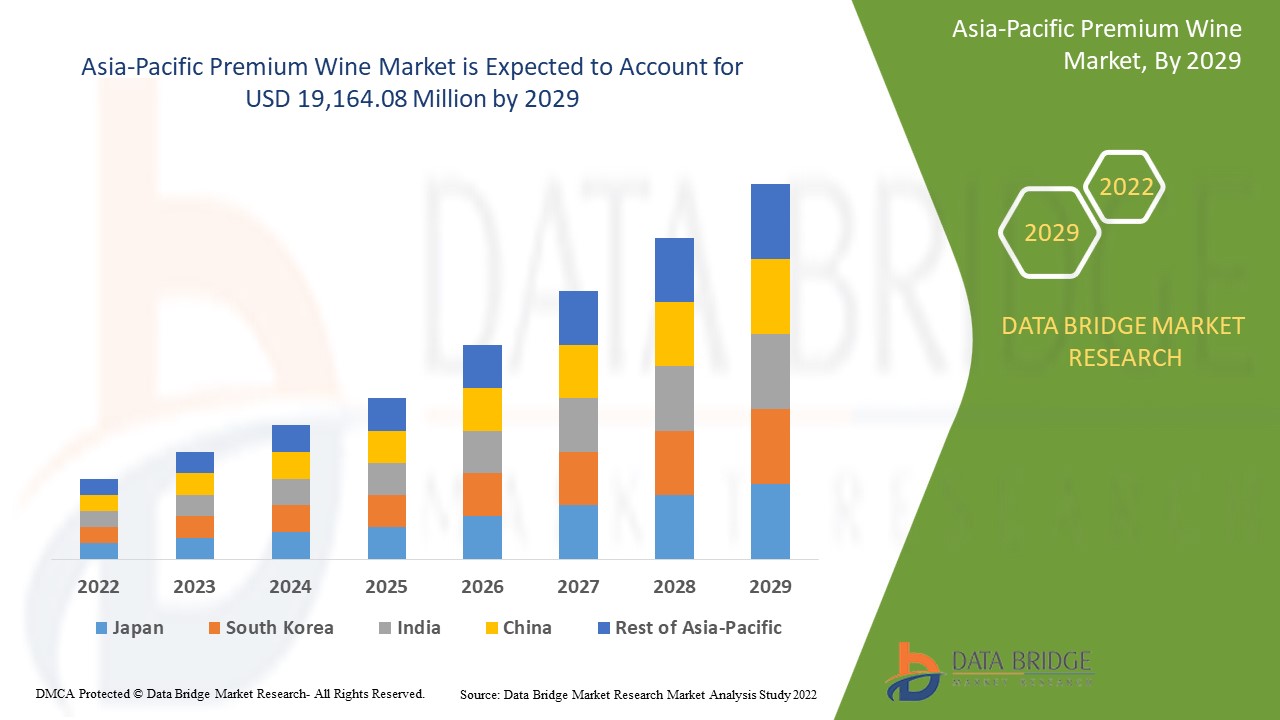
19,164.08 Million
2021
2029
USD
11,250.16 Million
USD
19,164.08 Million
2021
2029
| 2022 - 2029 | |
| USD 11,250.16 Million | |
| USD 19,164.08 Million | |
| % | |
|
Asia-Pacific Premium Wine Market Analysis and Insights
The growing demand of wine owing to different health benefits is helping to boost the overall market growth. The rising e-commerce, courier, wine delivery services are also attributing in the growth of the market. The major market players are highly focusing on various new wine launches. In addition, the rise in the alcohol socialization among consumers also contributing in the rising demand for the market.
The Asia-Pacific premium wine market is growing in the forecast year due to the rise in market players and the availability of various premium wine brands in the market. Along with this, manufacturers are engaged in producing different wines in the market. The increasing bars and restaurants is further boosting the market growth. However, the high cost of wine production and gradual shift of consumers toward other alcoholic beverages might hamper the growth of the Asia-Pacific premium wine market in the forecast period.
The various health benefits, changing lifestyle, strategic initiatives by market players are giving opportunities to the market. However, the over consumption of wine hampering to the various serious diseases, completion and complications in completing the consumer demand are key challenges for the market growth.
Asia-Pacific premium wine market is expected to gain market growth in the forecast period of 2022 to 2029. Data Bridge Market Research analyses that the market is growing with a CAGR of 7.0% in the forecast period of 2022 to 2029 and is expected to reach USD 19,164.08 million by 2029 from USD 11,250.16 million in 2021.
|
Report Metric |
Details |
|
Forecast Period |
2022 to 2029 |
|
Base Year |
2021 |
|
Historic Years |
2020 (Customisable to 2019-2014) |
|
Quantitative Units |
Revenue in USD Million |
|
Segments Covered |
By Wine Colour (Red Wine, White Wine, Rose Wine, and Others), Product Type (Still Wine, Fortified Wine, Sparkling Wine, Dessert Wine), Product Category (Alcoholic Wine and Non-Alcoholic Wine), Flavour (Original and Flavoured), Aging Years (1-17 Years, 18-24 Years, 25-44 Years, 45-64 Years and 65+ Years), Ageing Barrel Type (Oak, Maple, Cedar, Hickory and Others), Price Range (Premium and Super Premium), Distribution Channel (Store Based Retailers and Online Retailers) |
|
Countries Covered |
China, Japan, India, South Korea, Australia, Singapore, Thailand, Malaysia, Indonesia, Philippines, Vietnam, New Zealand, Rest of Asia-Pacific |
|
Market Players Covered |
The major companies which are dealing in the market are are Vina Concha Y Toro, Treasury Wine Estates, Mount Mary Vineyard, Vins Grands Crus, Sula Vineyards, Moss Wood, Leeuwin Estate, E. & J. Gallo Winery, Constellation Brands, Inc., Castel Freres, The Wine Group, Accolade Wines, Pernod Ricard, Rockford, Henschke Cellars, Gioconda, Cullen Wines, Bass Philip, Changyu Pioneer Wine Company, Casella, Chateau Cheval Blanc, Miguel Torres S.A., Fetzer, GRUPO PENFLOR and among others. |
Premium Wine Market Definition
Wine is an alcoholic beverage in which the alcohol is produced naturally through fermentation. Fermentation is the first step in the process, which is carried out by bacteria found on the skin of grapes. After that, a specific strain of yeast is added to the main fermented product to get the desired result. The sugar in grapes is converted to carbon dioxide and ethanol by yeast or bacteria in wine. Wines with a lot of sugar in them have a different taste, and desert wine is one of them. Crushing, alcoholic fermentation, malolactic fermentation, pulling the wine off the lees, stabilisation and ageing, and refining in bottle are the six fundamental processes involved in wine production.
Premium Wine Market Dynamics
Drivers
- Growing demand for wine owing to different health benefits
Wine consumption has increased in the past few years due to increased awareness about its different health benefits. According to researchers, moderate consumption of wine, which has an alcohol content of 12% -15% daily, helps prevent several diseases. Following are some of the health benefits of wine:
Wine has antioxidant properties. Antioxidants are compounds that prevent cellular damage caused by inflammation and oxidative stress. Grapes have high levels of polyphenols and antioxidants that have been shown to reduce oxidative stress and inflammation.
- Rising e-commerce, courier, and wine delivery services
The e-commerce industry is always changing and plays a vital role in our daily lives. E-commerce provides a platform for people to buy or sell whatever they want, whenever they want. Merchants are continuously creating and improving their e-commerce businesses' strategies and approaches to meet the changing demand of consumers.
E-commerce has transformed the way of business around the world. Much of the growth for the industry has been triggered by an increase in internet and smartphone penetration. Also, technological advancements and the growth of available marketplaces have made it easier to buy and sell goods through online portals. The Merchants and the delivery services continue to follow consumer demand in online platforms, flocking to e-commerce in record numbers.
- Rise in alcohol socialization among consumers
Wine production and consumption have grown rapidly in recent decades, increasing consumption. Nowadays, social engagements, modernization, and the rising embrace of western culture are some elements that encourage consumers to socialize with alcohol, which will further accelerate the market growth.
Alcohol consumption is becoming a sign of social status, supporting the market's growth of low alcoholic beverages. It is also gaining huge popularity among millennials and youngsters, owing to its refreshing appeal and low ABV (Alcohol by Volume) offerings. It is majorly associated with several occasions and served as a table drink with regular food in developing countries.
The increasing demand further encourages manufacturers to launch and introduce innovative products, which is also expected to boost market growth in upcoming years.
Opportunities
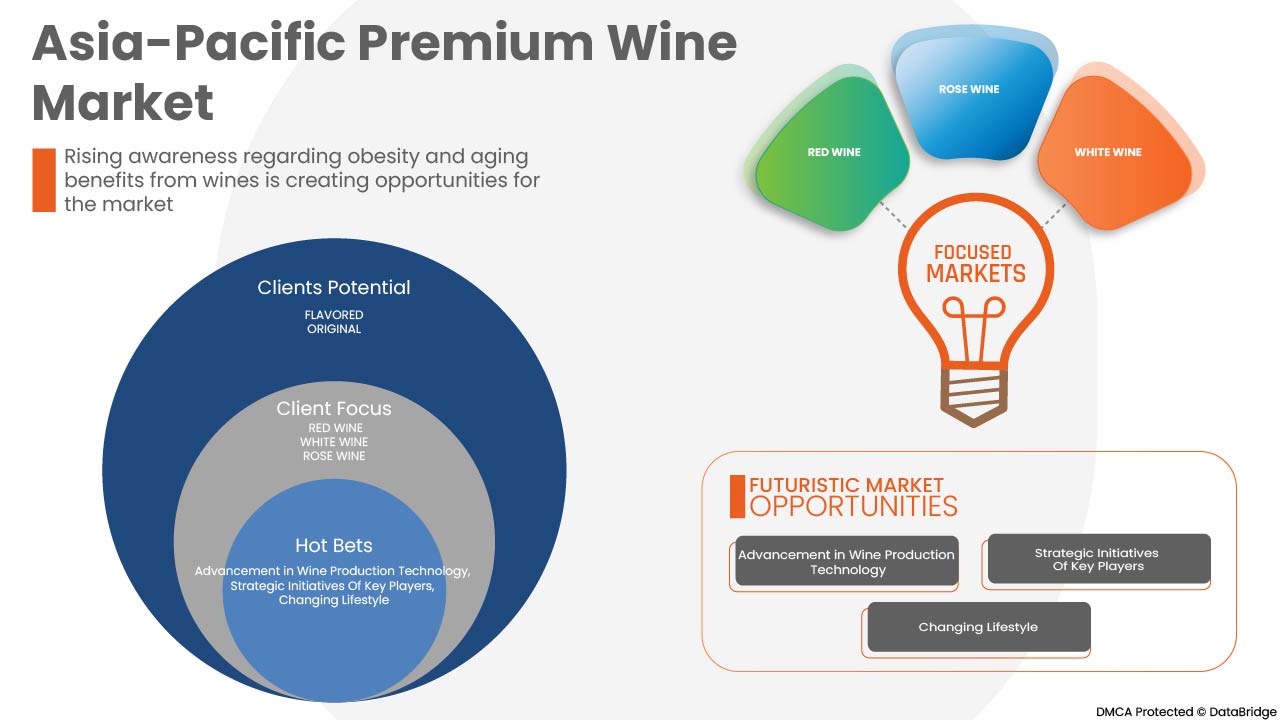
- Changing lifestyle
People prefer premium wine because of its authentic taste. The wines have become the social status and generic thing for parties and various occasions despite both healthful and unhealthful compounds. Epidemiologic studies from numerous disparate populations reveal that individuals with the habit of daily moderate wine consumption enjoy significant reductions in all-cause and particularly cardiovascular mortality compared to individuals who abstain or drink alcohol excessively
- Increasing number of bars and lounges
The demand for premium wine is increasing due to the rise in restaurants, bars, and special wine bars all around the globe. As these premium wines are easily available in the bars and lounges, the demand for particular wine bars is also increasing. The wine bars and lounges offering the annual subscription for authenticated premium wines are making people more indulged
Restraints/Challenges
- Increased cost of wine production
Worldwide, the costs of wine production have increased. Wine industries are facing several challenges, like the cost of goods and shipping them due to the rise in gas prices. The actual wine bottle is becoming more difficult to get, especially with challenges in the supply chain and increased gas prices. Because of Covid, increased gas prices, and inflation, it is not easy to get bottles of wine. The wine industry saw a 30-percent increase in costs in the year 2022. Hence, the increased cost of wine production is hampering the market growth
- Gradual shift of consumers toward other alcoholic beverages
The growing modernization and rise in alcohol consumption are ongoing trends across the globe, which has nudged alcohol producers to launch innovative and bold variants in alcoholic beverages. Consumers are gradually shifting preferences towards various alcoholic beverages such as liqueurs, spirits, beer, and others due to their availability at economical prices.
Post COVID-19 Impact on Premium Wine Market
The COVID-19 has negatively affected the market. Lockdowns and isolation during pandemics caused the closure for most of the bars and restaurants and thus, affected the sale of wine. Online wine purchase increased as compared to vendor purchase. Thus COVID-19 affected premium wine market negatively.
Recent Developments
- In June 2022, Pernod Ricard announced the launch of a digital label system to better inform consumers about the products they purchase as well as responsible drinking. This initiative aims to offer consumers an efficient solution to their desire for more transparency on product content and health information. A European pilot program has been launched in July 2022, before being rolled out globally across all brands in the Group’s portfolio by 2024. This has helped company to provide better services to consumers through such innovations in the organization.
- In August 2022, E. & J. Gallo Winery announced that the Gallo is the official Wine Sponsor of the National Football League (NFL). This has helped company to increase their Asia-Pacific presence in the market
Asia-Pacific Premium Wine Market Scope
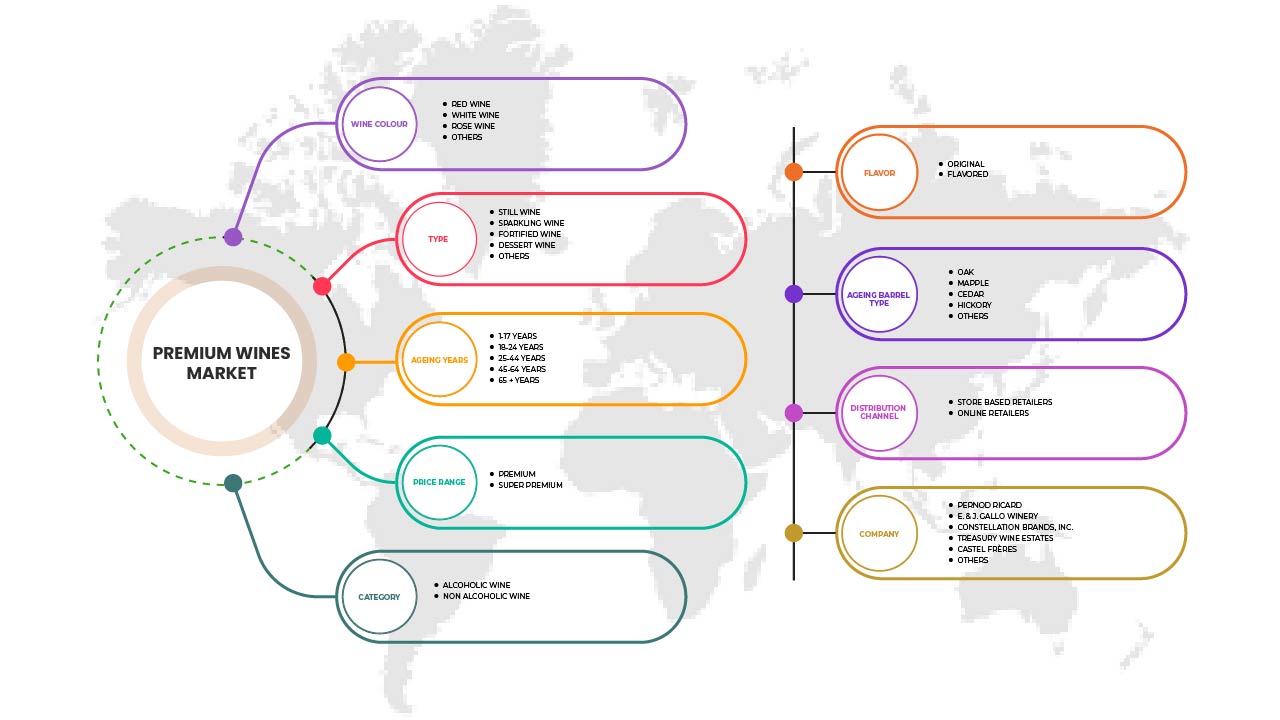
Asia-Pacific premium wine market is segmented into wine colour, product type, product category, ageing barrel type, by price range, distribution channel. The growth amongst these segments will help you analyse meagre growth segments in the industries and provide the users with a valuable market overview and market insights to make strategic decisions to identify core market applications.
Wine Colour
- Red Wine
- White Wine
- Rose Wine
- Others
On the basis of wine colour, the Asia-Pacific premium wine market is segmented into red wine, white wine, rose wine and others.
Product Type
- Still Wine
- Sparkling Wine
- Fortified Wine and
- Dessert Wine
Based on product type, the Asia-Pacific premium wine market is segmented into still wine, sparkling wine, fortified wine and dessert wine.
Product Category
- Alcoholic Wine
- Non-Alcoholic Wine
Based on product category, the Asia-Pacific premium wine market is segmented into alcoholic wine and non-alcoholic wine.
Flavour
- Original
- Flavored
Based on flavour, the Asia-Pacific premium wine market is segmented into original and flavoured.
Aging Years
- 1-7 Years
- 18-24 Years
- 25-44 Years
- 45-64 Years
- 65+ Years
Based on aging years, the Asia-Pacific premium wine market is segmented into 1-7 years, 18-24 years, 25-44 years, 45-64 years and 65+ years.
Ageing Barrel Type
- Oak
- Maple
- Cedar
- Hickory
- Others
Based on barrel type, the Asia-Pacific premium wine market is segmented into oak, maple, cedar, hickory and others.
By Price Range
- Premium
- Super Premium
Based on price range, the Asia-Pacific premium wine market is segmented into premium and super premium.
Distribution Channel
- Store Based Retailers
- Online Retailers
Based on distribution channel, the Asia-Pacific premium wine market is segmented into store based retailers and online retailers.
Premium Wine Market Regional Analysis/Insights
The premium wine market is analysed and market size insights and trends are provided by country, wine colour, product type, product category, ageing barrel type, by price range, distribution channel.
The countries in the premium wine market are China, Japan, India, South Korea, Australia, Singapore, Thailand, Malaysia, Indonesia, Philippines, Vietnam, New Zealand, Rest of Asia-Pacific.
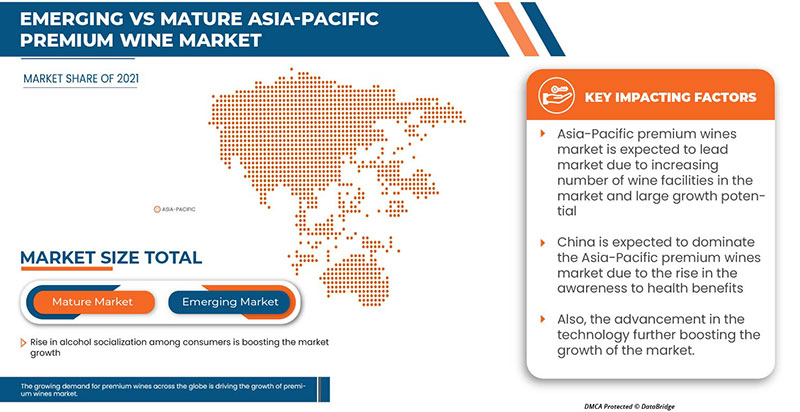
China dominates the premium wine marketing terms of market share and market revenue and will continue to flourish its dominance during the forecast period.
The China premium wine market is expected to grow due to a rise in wine consumption with meals, consumption of premium wine at social gatherings and celebrations, an increase in consumer preference for premium wines, Increase in options to customize the flavor, color, and packaging of premium wine are expected to drive the regional market in the forecasted period.
The rapid technological advancements and perfection in traditional art of wine making are increasing the demand for premium wine. The growing population of alcohol consuming adults is further fuelling the market growth. Moreover, the different packaging options of premium wine, along with its customization, online availability, presence of major market players in the region, and high living standards, are also boosting the market's growth.
Competitive Landscape and Premium Wine Market Share Analysis
The premium wine market competitive landscape provides details by the competitors. Details included are company overview, company financials, revenue generated, market potential, investment in research and development, new market initiatives, Asia-Pacific presence, production sites and facilities, production capacities, company strengths and weaknesses, product launch, product width and breadth, and application dominance. The above data points provided are only related to the companies' focus on premium wine market.
Some of the major players operating in the premium wine market are Vina Concha Y Toro, Treasury Wine Estates, Mount Mary Vineyard, Vins Grands Crus, Sula Vineyards, Moss Wood, Leeuwin Estate, E. & J. Gallo Winery, Constellation Brands, Inc., Castel Freres, The Wine Group, Accolade Wines, Pernod Ricard, Rockford, Henschke Cellars, Gioconda, Cullen Wines, Bass Philip, Changyu Pioneer Wine Company, Casella, Chateau Cheval Blanc, Miguel Torres S.A., Fetzer, GRUPO PENFLOR and among others.
Research Methodology
Data collection and base year analysis are done using data collection modules with large sample sizes. The market data is analysed and estimated using market statistical and coherent models. In addition, market share analysis and key trend analysis are the major success factors in the market report. The key research methodology used by DBMR research team is data triangulation which involves data mining, analysis of the impact of data variables on the market, and primary (industry expert) validation. Apart from this, data models include Vendor Positioning Grid, Market Time Line Analysis, Market Overview and Guide, Company Positioning Grid, Company Market Share Analysis, Standards of Measurement, Asia-Pacific vs. Regional and Vendor Share Analysis. Please request analyst call in case of further inquiry.
SKU-

- Interactive Data Analysis Dashboard
- Company Analysis Dashboard for high growth potential opportunities
- Research Analyst Access for customization & queries
- Competitor Analysis with Interactive dashboard
- Latest News, Updates & Trend analysis
- Harness the Power of Benchmark Analysis for Comprehensive Competitor Tracking
Table of Content
1 INTRODUCTION
1.1 OBJECTIVES OF THE STUDY
1.2 MARKET DEFINITION
1.3 OVERVIEW OF ASIA PACIFIC PREMIUM WINE MARKET
1.4 LIMITATIONS
1.5 MARKETS COVERED
2 MARKET SEGMENTATION
2.1 MARKETS COVERED
2.2 GEOGRAPHICAL SCOPE
2.3 YEARS CONSIDERED FOR THE STUDY
2.4 CURRENCY AND PRICING
2.5 DBMR TRIPOD DATA VALIDATION MODEL
2.6 MULTIVARIATE MODELLING
2.7 WINE COLOUR LIFELINE CURVE
2.8 PRIMARY INTERVIEWS WITH KEY OPINION LEADERS
2.9 DBMR MARKET POSITION GRID
2.1 MARKET WINE COLOUR COVERAGE GRID
2.11 VENDOR SHARE ANALYSIS
2.12 SECONDARY SOURCES
2.13 ASSUMPTIONS
3 EXECUTIVE SUMMARY
4 PREMIUM INSIGHTS
4.1 IMPORT EXPORT ANALYSIS
4.2 INDUSTRY TRENDS AND FUTURE PERSPECTIVES
4.3 REGULATORY FRAMEWORK AND GUIDELINES
4.3.1 ADVERTISING & PROMOTIONS –
4.4 TAXATION AND DUTY LEVIES
4.5 COMPARATIVE ANALYSIS OF TYPES OF WINE
4.6 DEMOGRAPHIC PREFERENCES
4.7 BRAND COMPETITIVE ANALYSIS
5 PRICING INDEX
6 PRODUCTION CAPACITY OF KEY MANUFACTURERS
7 ASIA PACIFIC PREMIUM WINE MARKET: REGULATIONS
8 IMPACT OF ECONOMIC SLOWDOWN ON MARKET
8.1 IMPACT ON PRICE
8.2 IMPACT ON SUPPLY CHAIN
8.3 IMPACT ON SHIPMENT
8.4 IMPACT ON COMPANY'S STRATEGIC DECISIONS
9 BRAND OUTLOOK –
9.1 COMPARATIVE BRAND ANALYSIS
9.2 PRODUCT VS BRAND OVERVIEW –
10 MARKET OVERVIEW
10.1 DRIVERS
10.1.1 GROWING DEMAND FOR WINE OWING TO DIFFERENT HEALTH BENEFITS
10.1.2 RISING E-COMMERCE, COURIER, AND WINE DELIVERY SERVICES
10.1.3 RISE IN ALCOHOL SOCIALIZATION AMONG CONSUMERS
10.2 RESTRAINTS
10.2.1 INCREASED COST OF WINE PRODUCTION
10.2.2 GRADUAL SHIFT OF CONSUMERS TOWARD OTHER ALCOHOLIC BEVERAGES
10.3 OPPORTUNITIES
10.3.1 CHANGING LIFESTYLE
10.3.2 INCREASING NUMBER OF BARS AND LOUNGES
10.3.3 RISING AWARENESS REGARDING OBESITY AND AGING BENEFITS FROM WINES
10.4 CHALLENGES
10.4.1 HIGH CONSUMPTION LEADING SEVERE HEALTH PROBLEMS
10.4.2 LABOUR-INTENSIVE AND TIME-CONSUMING
11 ASIA PACIFIC PREMIUM WINE MARKET, BY WINE COLOR
11.1 OVERVIEW
11.2 RED WINE
11.2.1 FULL-BODIED
11.2.2 MEDIUM-BODIED
11.2.3 LIGHT-BODIED
11.3 WHITE WINE
11.4 ROSE WINE
11.5 OTHERS
12 ASIA PACIFIC PREMIUM WINE MARKET, BY PRODUCT TYPE
12.1 OVERVIEW
12.2 STILL WINE
12.3 SPARKLING WINE
12.4 FORTIFIED WINE
12.5 DESSERT WINE
12.5.1 LIGHT SWEET
12.5.2 RICHLY SWEET
12.5.3 SWEET RED WINE
13 ASIA PACIFIC PREMIUM WINE MARKET, BY PRODUCT CATEGORY
13.1 OVERVIEW
13.2 ALCOHOLIC
13.3 NON-ALCOHOLIC
13.3.1 0.5% ABV
13.3.2 MORE THAN 0.05% ABV
13.3.3 0.05% ABV
13.3.4 LESS THAN 0.05% ABV
14 ASIA PACIFIC PREMIUM WINE MARKET, BY FLAVOR
14.1 OVERVIEW
14.2 FLAVORED
14.2.1 FRUITS
14.2.1.1 CHERRY
14.2.1.2 PEACH
14.2.1.3 LEMON
14.2.1.4 GREEN APPLE
14.2.1.5 ORANGE
14.2.1.6 POMOGRANATE
14.2.1.7 MELON
14.2.1.8 FIG
14.2.1.9 MANGO
14.2.1.10 PINEAPPLE
14.2.1.11 OTHERS
14.2.2 BERRY
14.2.2.1 CRANBERRIES
14.2.2.2 BLUEBERRY
14.2.2.3 RASPBERRY
14.2.2.4 STRAWBERRY
14.2.2.5 OTHERS
14.2.3 FLORAL
14.2.3.1 ROSE
14.2.3.2 HIBISCUS
14.2.3.3 OTHERS
14.2.4 HERBAL
14.2.4.1 SMOKED TOBACCO
14.2.4.2 TRUFFLE
14.2.4.3 OTHERS
14.2.5 SPICES
14.2.5.1 CINNAMON
14.2.5.2 NUTMEG
14.2.5.3 PEPPER
14.2.5.4 GINGER
14.2.5.5 CLOVES
14.2.5.6 OTHERS
14.2.6 CHOCOLATE
14.2.7 MAPLE
14.2.8 HONEY
14.2.9 VANILLA
14.2.10 CARAMEL
14.3 ORIGINAL
15 ASIA PACIFIC PREMIUM WINE MARKET, BY AGEING YEARS
15.1 OVERVIEW
15.2 1-17 YEARS
15.3 18-24 YEARS
15.4 25-44 YEARS
15.5 45-64 YEARS
15.6 65+ YEARS
16 ASIA PACIFIC PREMIUM WINE MARKET, BY AGEING BARREL TYPE
16.1 OVERVIEW
16.2 OAK
16.3 HICKORY
16.4 MAPLE
16.5 CEDAR
16.6 OTHERS
17 ASIA PACIFIC PREMIUM WINE MARKET, BY PRICE RANGE
17.1 OVERVIEW
17.2 PREMIUM
17.3 SUPER PREMIUM
18 ASIA PACIFIC PREMIUM WINE MARKET, BY DISTRIBUTION CHANNEL
18.1 OVERVIEW
18.2 STORE BASED RETAILERS
18.2.1 LIQUOR STORES
18.2.2 CONVENIENCE STORE
18.2.3 SUPERMARKETS/HYPERMARKETS
18.2.4 WHOLESALERS
18.2.5 SPECIALITY STORES
18.2.6 GROCERY STORES
18.2.7 OTHERS
18.3 ONLINE RETAILERS
19 ASIA PACIFIC PREMIUM WINE MARKET, BY REGION
19.1 ASIA-PACIFIC
19.1.1 CHINA
19.1.2 AUSTRALIA
19.1.3 JAPAN
19.1.4 SOUTH KOREA
19.1.5 INDIA
19.1.6 THAILAND
19.1.7 SINGAPORE
19.1.8 VIETNAM
19.1.9 NEW ZEALAND
19.1.10 MALAYSIA
19.1.11 PHILIPPINES
19.1.12 REST OF ASIA-PACIFIC
20 COMPANY LANDSCAPE
20.1 ASIA PACIFIC PREMIUM WINE MARKET: COMPANY LANDSCAPE
20.1.1 COMPANY SHARE ANALYSIS: ASIA PACIFIC
21 SWOT ANALYSIS
22 COMPANY PROFILE
22.1 PERNOD RICARD
22.1.1 COMPANY SNAPSHOT
22.1.2 REVENUE ANALYSIS
22.1.3 COMPANY SHARE ANALYSIS
22.1.4 PRODUCT PORTFOLIO
22.1.5 RECENT DEVELOPMENT
22.2 E. & J. GALLO WINERY
22.2.1 COMPANY SNAPSHOT
22.2.2 COMPANY SHARE ANALYSIS
22.2.3 PRODUCT PORTFOLIO
22.2.4 RECENT DEVELOPMENTS
22.3 CONSTELLATION BRANDS, INC.
22.3.1 COMPANY SNAPSHOT
22.3.2 REVENUE ANALYSIS
22.3.3 COMPANY SHARE ANALYSIS
22.3.4 PRODUCT PORTFOLIO
22.3.5 RECENT DEVELOPMENTS
22.4 TREASURY WINE ESTATES
22.4.1 COMPANY SNAPSHOT
22.4.2 REVENUE ANALYSIS
22.4.3 COMPANY SHARE ANALYSIS
22.4.4 PRODUCT PORTFOLIO
22.4.5 RECENT DEVELOPMENTS
22.5 CASTEL FRÈRES
22.5.1 COMPANY SNAPSHOT
22.5.2 PRODUCT PORTFOLIO
22.5.3 RECENT DEVELOPMENTS
22.6 ACCOLADE WINES
22.6.1 COMPANY SNAPSHOT
22.6.2 PRODUCT PORTFOLIO
22.6.3 RECENT DEVELOPMENTS
22.7 BASS PHILLIP WINES
22.7.1 COMPANY SNAPSHOT
22.7.2 PRODUCT PORTFOLIO
22.7.3 RECENT DEVELOPMENT
22.8 CASELLA
22.8.1 COMPANY SNAPSHOT
22.8.2 PRODUCT PORTFOLIO
22.8.3 RECENT DEVELOPMENT
22.9 CHANGYU
22.9.1 COMPANY SNAPSHOT
22.9.2 REVENUS ANALYSIS
22.9.3 PRODUCT PORTFOLIO
22.9.4 RECENT DEVELOPMENT
22.1 CHATEAU CHEVAL BLANC
22.10.1 COMPANY SNAPSHOT
22.10.2 PRODUCT PORTFOLIO
22.10.3 RECENT DEVELOPMENTS
22.11 CULLEN WINES
22.11.1 COMPANY SNAPSHOT
22.11.2 PRODUCT PORTFOLIO
22.11.3 RECENT DEVELOPMENTS
22.12 FETZER
22.12.1 COMPANY SNAPSHOT
22.12.2 PRODUCT PORTFOLIO
22.12.3 RECENT DEVELOPMENTS
22.13 GIACONDA MARKETING PTY. LTD.
22.13.1 COMPANY SNAPSHOT
22.13.2 PRODUCT PORTFOLIO
22.13.3 RECENT DEVELOPMENTS
22.14 GRUPO PEÑAFLOR
22.14.1 COMPANY SNAPSHOT
22.14.2 PRODUCT PORTFOLIO
22.14.3 RECENT DEVELOPMENTS
22.15 HENSCHKE
22.15.1 COMPANY SNAPSHOT
22.15.2 PRODUCT PORTFOLIO
22.15.3 RECENT DEVELOPMENTS
22.16 LEEUWIN ESTATE
22.16.1 COMPANY SNAPSHOT
22.16.2 PRODUCT PORTFOLIO
22.16.3 RECENT DEVELOPMENT
22.17 MIGUEL TORRES S.A
22.17.1 COMPANY SNAPSHOT
22.17.2 PRODUCT PORTFOLIO
22.17.3 RECENT DEVELOPMENTS
22.18 MOSS WOOD
22.18.1 COMANY SNAPSHOT
22.18.2 PRODUCT PORTFOLIO
22.18.3 RECENT DEVELOPMENT
22.19 MOUNT MARY VINEYARD
22.19.1 COMPANY SNAPSHOT
22.19.2 PRODUCT PORTFOLIO
22.19.3 RECENT DEVELOPMENTS
22.2 ROCKFORD
22.20.1 COMPANY SNAPSHOT
22.20.2 PRODUCT PORTFOLIO
22.20.3 RECENT DEVELOPMENTS
22.21 SULA VINEYARDS PVT. LTD.
22.21.1 COMPANY SNAPSHOT
22.21.2 PRODUCT PORTFOLIO
22.21.3 RECENT DEVELOPMENT
22.22 THE WINE GROUP
22.22.1 COMPANY SNAPSHOT
22.22.2 PRODUCT PORTFOLIO
22.22.3 RECENT DEVELOPMENTS
22.23 VINA CONCHA Y TORO
22.23.1 COMPANY SNAPSHOT
22.23.2 REVENUE ANALYSIS
22.23.3 PRODUCT PORTFOLIO
22.23.4 RECENT DEVELOPMENT
22.24 VINS GRAND CRUS
22.24.1 COMPANY SNAPSHOT
22.24.2 PRODUCT PORTFOLIO
22.24.3 RECENT DEVELOPMENTS
23 QUESTIONNAIRE
24 RELATED REPORTS
List of Table
TABLE 1 BELOW ARE THE MOST COMMON RED WINE TYPES BY AROMA, BODY, AND SWEETNESS:
TABLE 2 BELOW ARE THE MOST COMMON WHITE WINE TYPES BY AROMA, BODY, AND SWEETNESS:
TABLE 3 BELOW IS THE TABULAR REPRESENTATION OF THE OVERALL TOTAL CONSUMPTION OF WINE IN DIFFERENT COUNTRIES :
TABLE 4 THE PRICES OF THESE WINES VARY FROM REGION TO REGION. BELOW ARE THE PRICES OF SOME OF THE MOST POPULAR RED WINES ACROSS THE GLOBE.
TABLE 5 BELOW ARE THE PRICES OF SOME OF THE WORLD’S BEST WHITE WINES ACROSS THE GLOBE.
TABLE 6 ASIA PACIFIC PREMIUM WINE MARKET, BY WINE COLOR, 2020-2029 (USD MILLION)
TABLE 7 ASIA PACIFIC RED WINE IN PREMIUM WINE MARKET, BY REGION, 2020-2029 (USD MILLION)
TABLE 8 ASIA PACIFIC RED WINE IN PREMIUM WINE MARKET, BY WINE COLOR, 2020-2029 (USD MILLION)
TABLE 9 ASIA PACIFIC WHITE WINE IN PREMIUM WINE MARKET, BY REGION, 2020-2029 (USD MILLION)
TABLE 10 ASIA PACIFIC ROSE WINE IN PREMIUM WINE MARKET, BY REGION, 2020-2029 (USD MILLION)
TABLE 11 ASIA PACIFIC OTHERS IN PREMIUM WINE MARKET, BY REGION, 2020-2029 (USD MILLION)
TABLE 12 ASIA PACIFIC PREMIUM WINE MARKET, BY PRODUCT TYPE, 2020-2029 (USD MILLION)
TABLE 13 ASIA PACIFIC STILL WINE IN PREMIUM WINE MARKET, BY REGION, 2020-2029 (USD MILLION)
TABLE 14 ASIA PACIFIC SPARKLING WINE IN PREMIUM WINE MARKET, BY REGION, 2020-2029 (USD MILLION)
TABLE 15 ASIA PACIFIC FORTIFIED WINE IN PREMIUM WINE MARKET, BY REGION, 2020-2029 (USD MILLION)
TABLE 16 ASIA PACIFIC DESSERT WINE IN PREMIUM WINE MARKET, BY REGION, 2020-2029 (USD MILLION)
TABLE 17 ASIA PACIFIC DESSERT WINE IN PREMIUM WINE MARKET, BY PRODUCT TYPE, 2020-2029 (USD MILLION)
TABLE 18 ASIA PACIFIC PREMIUM WINE MARKET, BY PRODUCT CATEGORY, 2020-2029 (USD MILLION)
TABLE 19 ASIA PACIFIC ALCOHOLIC IN PREMIUM WINE MARKET, BY REGION, 2020-2029 (USD MILLION)
TABLE 20 ASIA PACIFIC NON-ALCOHOLIC IN PREMIUM WINE MARKET, BY REGION, 2020-2029 (USD MILLION)
TABLE 21 ASIA PACIFIC NON-ALCOHOLIC IN PREMIUM WINE MARKET, BY ABV %, 2020-2029 (USD MILLION)
TABLE 22 ASIA PACIFIC PREMIUM WINE MARKET, BY FLAVOR, 2020-2029 (USD MILLION)
TABLE 23 ASIA PACIFIC FLAVORED IN PREMIUM WINE MARKET, BY REGION, 2020-2029 (USD MILLION)
TABLE 24 ASIA PACIFIC FRUITS IN PREMIUM WINE MARKET, BY FLAVOR, 2020-2029 (USD MILLION)
TABLE 25 ASIA PACIFIC BERRY IN PREMIUM WINE MARKET, BY FLAVOR, 2020-2029 (USD MILLION)
TABLE 26 ASIA PACIFIC FLORAL IN PREMIUM WINE MARKET, BY FLAVOR, 2020-2029 (USD MILLION)
TABLE 27 ASIA PACIFIC HERBAL IN PREMIUM WINE MARKET, BY FLAVOR, 2020-2029 (USD MILLION)
TABLE 28 ASIA PACIFIC SPICES IN PREMIUM WINE MARKET, BY FLAVOR, 2020-2029 (USD MILLION)
TABLE 29 ASIA PACIFIC ORIGINAL IN PREMIUM WINE MARKET, BY REGION, 2020-2029 (USD MILLION)
TABLE 30 ASIA PACIFIC PREMIUM WINE MARKET, BY AGEING, 2020-2029 (USD MILLION)
TABLE 31 ASIA PACIFIC 1-17 YEARS IN PREMIUM WINE MARKET, BY REGION, 2020-2029 (USD MILLION)
TABLE 32 ASIA PACIFIC 18-24 YEARS IN PREMIUM WINE MARKET, BY REGION, 2020-2029 (USD MILLION)
TABLE 33 ASIA PACIFIC 25-44 YEARS IN PREMIUM WINE MARKET, BY REGION, 2020-2029 (USD MILLION)
TABLE 34 ASIA PACIFIC 45-64 YEARS IN PREMIUM WINE MARKET, BY REGION, 2020-2029 (USD MILLION)
TABLE 35 ASIA PACIFIC 65+ YEARS IN PREMIUM WINE MARKET, BY REGION, 2020-2029 (USD MILLION)
TABLE 36 ASIA PACIFIC PREMIUM WINE MARKET, BY AGEING BARREL TYPE, 2020-2029 (USD MILLION)
TABLE 37 ASIA PACIFIC OAK IN PREMIUM WINE MARKET, BY REGION, 2020-2029 (USD MILLION)
TABLE 38 ASIA PACIFIC HICKORY IN PREMIUM WINE MARKET, BY REGION, 2020-2029 (USD MILLION)
TABLE 39 ASIA PACIFIC MAPLE IN PREMIUM WINE MARKET, BY REGION, 2020-2029 (USD MILLION)
TABLE 40 ASIA PACIFIC CEDAR IN PREMIUM WINE MARKET, BY REGION, 2020-2029 (USD MILLION)
TABLE 41 ASIA PACIFIC OTHERS IN PREMIUM WINE MARKET, BY REGION, 2020-2029 (USD MILLION)
TABLE 42 ASIA PACIFIC PREMIUM WINE MARKET, BY PRICE RANGE, 2020-2029 (USD MILLION)
TABLE 43 ASIA PACIFIC PREMIUM WINE IN PREMIUM WINE MARKET, BY REGION, 2020-2029 (USD MILLION)
TABLE 44 ASIA PACIFIC SUPER PREMIUM WINE IN PREMIUM WINE MARKET, BY REGION, 2020-2029 (USD MILLION)
TABLE 45 ASIA PACIFIC PREMIUM WINE MARKET, BY DISTRIBUTION CHANNEL, 2020-2029 (USD MILLION)
TABLE 46 ASIA PACIFIC STORE BASED RETAILERS IN PREMIUM WINE MARKET, BY REGION, 2020-2029 (USD MILLION)
TABLE 47 ASIA PACIFIC STORE BASED RETAILERS IN PREMIUM WINE MARKET, BY DISTRIBUTION CHANNEL, 2020-2029 (USD MILLION)
TABLE 48 ASIA PACIFIC ONLINE RETAILERS IN PREMIUM WINE MARKET, BY REGION, 2020-2029 (USD MILLION)
TABLE 49 ASIA-PACIFIC PREMIUM WINE MARKET, BY COUNTRY, 2020-2029 (USD MILLION)
TABLE 50 ASIA-PACIFIC PREMIUM WINE MARKET, BY WINE COLOR, 2020-2029 (USD MILLION)
TABLE 51 ASIA-PACIFIC RED WINE IN PREMIUM WINE MARKET, BY TYPE, 2020-2029 (USD MILLION)
TABLE 52 ASIA-PACIFIC PREMIUM WINE MARKET, BY PRODUCT TYPE, 2020-2029 (USD MILLION)
TABLE 53 ASIA-PACIFIC DESSERT WINE IN PREMIUM WINE MARKET, BY PRODUCT TYPE, 2020-2029 (USD MILLION)
TABLE 54 ASIA-PACIFIC PREMIUM WINE MARKET, BY PRODUCT CATEGORY, 2020-2029 (USD MILLION)
TABLE 55 ASIA-PACIFIC NON-ALCOHOLIC WINE IN PREMIUM WINE MARKET, BY ABV % , 2020-2029 (USD MILLION)
TABLE 56 ASIA-PACIFIC PREMIUM WINE MARKET, BY FLAVOR, 2020-2029 (USD MILLION)
TABLE 57 ASIA-PACIFIC FLAVORED WINES IN PREMIUM WINE MARKET, BY FLAVOR, 2020-2029 (USD MILLION)
TABLE 58 ASIA-PACIFIC FRUIT IN PREMIUM WINE MARKET, BY FLAVOR, 2020-2029 (USD MILLION)
TABLE 59 ASIA-PACIFIC BERRY IN PREMIUM WINE MARKET, BY FLAVOR, 2020-2029 (USD MILLION)
TABLE 60 ASIA-PACIFIC FLORAL IN PREMIUM WINE MARKET, BY FLAVOR, 2020-2029 (USD MILLION)
TABLE 61 ASIA-PACIFIC HERBAL IN PREMIUM WINE MARKET, BY FLAVOR, 2020-2029 (USD MILLION)
TABLE 62 ASIA-PACIFIC SPICES IN PREMIUM WINE MARKET, BY FLAVOR, 2020-2029 (USD MILLION)
TABLE 63 ASIA-PACIFIC PREMIUM WINE MARKET, BY AGEING YEARS, 2020-2029 (USD MILLION)
TABLE 64 ASIA-PACIFIC PREMIUM WINE MARKET, BY AGEING BARREL TYPE, 2020-2029 (USD MILLION)
TABLE 65 ASIA-PACIFIC PREMIUM WINE MARKET, BY PRICE RANGE, 2020-2029 (USD MILLION)
TABLE 66 ASIA-PACIFIC PREMIUM WINE MARKET, BY DISTRIBUTION CHANNEL, 2020-2029 (USD MILLION)
TABLE 67 ASIA-PACIFIC STORE BASED RETAILERS IN PREMIUM WINE MARKET, BY DISTRIBUTION CHANNEL, 2020-2029 (USD MILLION)
TABLE 68 CHINA PREMIUM WINE MARKET, BY WINE COLOR, 2020-2029 (USD MILLION)
TABLE 69 CHINA RED WINE IN PREMIUM WINE MARKET, BY TYPE, 2020-2029 (USD MILLION)
TABLE 70 CHINA PREMIUM WINE MARKET, BY PRODUCT TYPE, 2020-2029 (USD MILLION)
TABLE 71 CHINA DESSERT WINE IN PREMIUM WINE MARKET, BY PRODUCT TYPE, 2020-2029 (USD MILLION)
TABLE 72 CHINA PREMIUM WINE MARKET, BY PRODUCT CATEGORY, 2020-2029 (USD MILLION)
TABLE 73 CHINA NON-ALCOHOLIC WINE IN PREMIUM WINE MARKET, BY ABV % , 2020-2029 (USD MILLION)
TABLE 74 CHINA PREMIUM WINE MARKET, BY FLAVOR, 2020-2029 (USD MILLION)
TABLE 75 CHINA FLAVORED WINES IN PREMIUM WINE MARKET, BY FLAVOR, 2020-2029 (USD MILLION)
TABLE 76 CHINA FRUIT IN PREMIUM WINE MARKET, BY FLAVOR, 2020-2029 (USD MILLION)
TABLE 77 CHINA BERRY IN PREMIUM WINE MARKET, BY FLAVOR, 2020-2029 (USD MILLION)
TABLE 78 CHINA FLORAL IN PREMIUM WINE MARKET, BY FLAVOR, 2020-2029 (USD MILLION)
TABLE 79 CHINA HERBAL IN PREMIUM WINE MARKET, BY FLAVOR, 2020-2029 (USD MILLION)
TABLE 80 CHINA SPICES IN PREMIUM WINE MARKET, BY FLAVOR, 2020-2029 (USD MILLION)
TABLE 81 CHINA PREMIUM WINE MARKET, BY AGEING YEARS, 2020-2029 (USD MILLION)
TABLE 82 CHINA PREMIUM WINE MARKET, BY AGEING BARREL TYPE, 2020-2029 (USD MILLION)
TABLE 83 CHINA PREMIUM WINE MARKET, BY PRICE RANGE, 2020-2029 (USD MILLION)
TABLE 84 CHINA PREMIUM WINE MARKET, BY DISTRIBUTION CHANNEL, 2020-2029 (USD MILLION)
TABLE 85 CHINA STORE BASED RETAILERS IN PREMIUM WINE MARKET, BY DISTRIBUTION CHANNEL, 2020-2029 (USD MILLION)
TABLE 86 AUSTRALIA PREMIUM WINE MARKET, BY WINE COLOR, 2020-2029 (USD MILLION)
TABLE 87 AUSTRALIA RED WINE IN PREMIUM WINE MARKET, BY TYPE, 2020-2029 (USD MILLION)
TABLE 88 AUSTRALIA PREMIUM WINE MARKET, BY PRODUCT TYPE, 2020-2029 (USD MILLION)
TABLE 89 AUSTRALIA DESSERT WINE IN PREMIUM WINE MARKET, BY PRODUCT TYPE, 2020-2029 (USD MILLION)
TABLE 90 AUSTRALIA PREMIUM WINE MARKET, BY PRODUCT CATEGORY, 2020-2029 (USD MILLION)
TABLE 91 AUSTRALIA NON-ALCOHOLIC WINE IN PREMIUM WINE MARKET, BY ABV % , 2020-2029 (USD MILLION)
TABLE 92 AUSTRALIA PREMIUM WINE MARKET, BY FLAVOR, 2020-2029 (USD MILLION)
TABLE 93 AUSTRALIA FLAVORED WINES IN PREMIUM WINE MARKET, BY FLAVOR, 2020-2029 (USD MILLION)
TABLE 94 AUSTRALIA FRUIT IN PREMIUM WINE MARKET, BY FLAVOR, 2020-2029 (USD MILLION)
TABLE 95 AUSTRALIA BERRY IN PREMIUM WINE MARKET, BY FLAVOR, 2020-2029 (USD MILLION)
TABLE 96 AUSTRALIA FLORAL IN PREMIUM WINE MARKET, BY FLAVOR, 2020-2029 (USD MILLION)
TABLE 97 AUSTRALIA HERBAL IN PREMIUM WINE MARKET, BY FLAVOR, 2020-2029 (USD MILLION)
TABLE 98 AUSTRALIA SPICES IN PREMIUM WINE MARKET, BY FLAVOR, 2020-2029 (USD MILLION)
TABLE 99 AUSTRALIA PREMIUM WINE MARKET, BY AGEING YEARS, 2020-2029 (USD MILLION)
TABLE 100 AUSTRALIA PREMIUM WINE MARKET, BY AGEING BARREL TYPE, 2020-2029 (USD MILLION)
TABLE 101 AUSTRALIA PREMIUM WINE MARKET, BY PRICE RANGE, 2020-2029 (USD MILLION)
TABLE 102 AUSTRALIA PREMIUM WINE MARKET, BY DISTRIBUTION CHANNEL, 2020-2029 (USD MILLION)
TABLE 103 AUSTRALIA STORE BASED RETAILERS IN PREMIUM WINE MARKET, BY DISTRIBUTION CHANNEL, 2020-2029 (USD MILLION)
TABLE 104 JAPAN PREMIUM WINE MARKET, BY WINE COLOR, 2020-2029 (USD MILLION)
TABLE 105 JAPAN RED WINE IN PREMIUM WINE MARKET, BY TYPE, 2020-2029 (USD MILLION)
TABLE 106 JAPAN PREMIUM WINE MARKET, BY PRODUCT TYPE, 2020-2029 (USD MILLION)
TABLE 107 JAPAN DESSERT WINE IN PREMIUM WINE MARKET, BY PRODUCT TYPE, 2020-2029 (USD MILLION)
TABLE 108 JAPAN PREMIUM WINE MARKET, BY PRODUCT CATEGORY, 2020-2029 (USD MILLION)
TABLE 109 JAPAN NON-ALCOHOLIC WINE IN PREMIUM WINE MARKET, BY ABV % , 2020-2029 (USD MILLION)
TABLE 110 JAPAN PREMIUM WINE MARKET, BY FLAVOR, 2020-2029 (USD MILLION)
TABLE 111 JAPAN FLAVORED WINES IN PREMIUM WINE MARKET, BY FLAVOR, 2020-2029 (USD MILLION)
TABLE 112 JAPAN FRUIT IN PREMIUM WINE MARKET, BY FLAVOR, 2020-2029 (USD MILLION)
TABLE 113 JAPAN BERRY IN PREMIUM WINE MARKET, BY FLAVOR, 2020-2029 (USD MILLION)
TABLE 114 JAPAN FLORAL IN PREMIUM WINE MARKET, BY FLAVOR, 2020-2029 (USD MILLION)
TABLE 115 JAPAN HERBAL IN PREMIUM WINE MARKET, BY FLAVOR, 2020-2029 (USD MILLION)
TABLE 116 JAPAN SPICES IN PREMIUM WINE MARKET, BY FLAVOR, 2020-2029 (USD MILLION)
TABLE 117 JAPAN PREMIUM WINE MARKET, BY AGEING YEARS, 2020-2029 (USD MILLION)
TABLE 118 JAPAN PREMIUM WINE MARKET, BY AGEING BARREL TYPE, 2020-2029 (USD MILLION)
TABLE 119 JAPAN PREMIUM WINE MARKET, BY PRICE RANGE, 2020-2029 (USD MILLION)
TABLE 120 JAPAN PREMIUM WINE MARKET, BY DISTRIBUTION CHANNEL, 2020-2029 (USD MILLION)
TABLE 121 JAPAN STORE BASED RETAILERS IN PREMIUM WINE MARKET, BY DISTRIBUTION CHANNEL, 2020-2029 (USD MILLION)
TABLE 122 SOUTH KOREA PREMIUM WINE MARKET, BY WINE COLOR, 2020-2029 (USD MILLION)
TABLE 123 SOUTH KOREA RED WINE IN PREMIUM WINE MARKET, BY TYPE, 2020-2029 (USD MILLION)
TABLE 124 SOUTH KOREA PREMIUM WINE MARKET, BY PRODUCT TYPE, 2020-2029 (USD MILLION)
TABLE 125 SOUTH KOREA DESSERT WINE IN PREMIUM WINE MARKET, BY PRODUCT TYPE, 2020-2029 (USD MILLION)
TABLE 126 SOUTH KOREA PREMIUM WINE MARKET, BY PRODUCT CATEGORY, 2020-2029 (USD MILLION)
TABLE 127 SOUTH KOREA NON-ALCOHOLIC WINE IN PREMIUM WINE MARKET, BY ABV % , 2020-2029 (USD MILLION)
TABLE 128 SOUTH KOREA PREMIUM WINE MARKET, BY FLAVOR, 2020-2029 (USD MILLION)
TABLE 129 SOUTH KOREA FLAVORED WINES IN PREMIUM WINE MARKET, BY FLAVOR, 2020-2029 (USD MILLION)
TABLE 130 SOUTH KOREA FRUIT IN PREMIUM WINE MARKET, BY FLAVOR, 2020-2029 (USD MILLION)
TABLE 131 SOUTH KOREA BERRY IN PREMIUM WINE MARKET, BY FLAVOR, 2020-2029 (USD MILLION)
TABLE 132 SOUTH KOREA FLORAL IN PREMIUM WINE MARKET, BY FLAVOR, 2020-2029 (USD MILLION)
TABLE 133 SOUTH KOREA HERBAL IN PREMIUM WINE MARKET, BY FLAVOR, 2020-2029 (USD MILLION)
TABLE 134 SOUTH KOREA SPICES IN PREMIUM WINE MARKET, BY FLAVOR, 2020-2029 (USD MILLION)
TABLE 135 SOUTH KOREA PREMIUM WINE MARKET, BY AGEING YEARS, 2020-2029 (USD MILLION)
TABLE 136 SOUTH KOREA PREMIUM WINE MARKET, BY AGEING BARREL TYPE, 2020-2029 (USD MILLION)
TABLE 137 SOUTH KOREA PREMIUM WINE MARKET, BY PRICE RANGE, 2020-2029 (USD MILLION)
TABLE 138 SOUTH KOREA PREMIUM WINE MARKET, BY DISTRIBUTION CHANNEL, 2020-2029 (USD MILLION)
TABLE 139 SOUTH KOREA STORE BASED RETAILERS IN PREMIUM WINE MARKET, BY DISTRIBUTION CHANNEL, 2020-2029 (USD MILLION)
TABLE 140 INDIA PREMIUM WINE MARKET, BY WINE COLOR, 2020-2029 (USD MILLION)
TABLE 141 INDIA RED WINE IN PREMIUM WINE MARKET, BY TYPE, 2020-2029 (USD MILLION)
TABLE 142 INDIA PREMIUM WINE MARKET, BY PRODUCT TYPE, 2020-2029 (USD MILLION)
TABLE 143 INDIA DESSERT WINE IN PREMIUM WINE MARKET, BY PRODUCT TYPE, 2020-2029 (USD MILLION)
TABLE 144 INDIA PREMIUM WINE MARKET, BY PRODUCT CATEGORY, 2020-2029 (USD MILLION)
TABLE 145 INDIA NON-ALCOHOLIC WINE IN PREMIUM WINE MARKET, BY ABV % , 2020-2029 (USD MILLION)
TABLE 146 INDIA PREMIUM WINE MARKET, BY FLAVOR, 2020-2029 (USD MILLION)
TABLE 147 INDIA FLAVORED WINES IN PREMIUM WINE MARKET, BY FLAVOR, 2020-2029 (USD MILLION)
TABLE 148 INDIA FRUIT IN PREMIUM WINE MARKET, BY FLAVOR, 2020-2029 (USD MILLION)
TABLE 149 INDIA BERRY IN PREMIUM WINE MARKET, BY FLAVOR, 2020-2029 (USD MILLION)
TABLE 150 INDIA FLORAL IN PREMIUM WINE MARKET, BY FLAVOR, 2020-2029 (USD MILLION)
TABLE 151 INDIA HERBAL IN PREMIUM WINE MARKET, BY FLAVOR, 2020-2029 (USD MILLION)
TABLE 152 INDIA PREMIUM WINE MARKET, BY AGEING YEARS, 2020-2029 (USD MILLION)
TABLE 153 INDIA PREMIUM WINE MARKET, BY AGEING BARREL TYPE, 2020-2029 (USD MILLION)
TABLE 154 INDIA PREMIUM WINE MARKET, BY PRICE RANGE, 2020-2029 (USD MILLION)
TABLE 155 INDIA PREMIUM WINE MARKET, BY DISTRIBUTION CHANNEL, 2020-2029 (USD MILLION)
TABLE 156 INDIA STORE BASED RETAILERS IN PREMIUM WINE MARKET, BY DISTRIBUTION CHANNEL, 2020-2029 (USD MILLION)
TABLE 157 THAILAND PREMIUM WINE MARKET, BY WINE COLOR, 2020-2029 (USD MILLION)
TABLE 158 THAILAND RED WINE IN PREMIUM WINE MARKET, BY TYPE, 2020-2029 (USD MILLION)
TABLE 159 THAILAND PREMIUM WINE MARKET, BY PRODUCT TYPE, 2020-2029 (USD MILLION)
TABLE 160 THAILAND DESSERT WINE IN PREMIUM WINE MARKET, BY PRODUCT TYPE, 2020-2029 (USD MILLION)
TABLE 161 THAILAND PREMIUM WINE MARKET, BY PRODUCT CATEGORY, 2020-2029 (USD MILLION)
TABLE 162 THAILAND NON-ALCOHOLIC WINE IN PREMIUM WINE MARKET, BY ABV % , 2020-2029 (USD MILLION)
TABLE 163 THAILAND PREMIUM WINE MARKET, BY FLAVOR, 2020-2029 (USD MILLION)
TABLE 164 THAILAND FLAVORED WINES IN PREMIUM WINE MARKET, BY FLAVOR, 2020-2029 (USD MILLION)
TABLE 165 THAILAND FRUIT IN PREMIUM WINE MARKET, BY FLAVOR, 2020-2029 (USD MILLION)
TABLE 166 THAILAND BERRY IN PREMIUM WINE MARKET, BY FLAVOR, 2020-2029 (USD MILLION)
TABLE 167 THAILAND FLORAL IN PREMIUM WINE MARKET, BY FLAVOR, 2020-2029 (USD MILLION)
TABLE 168 THAILAND HERBAL IN PREMIUM WINE MARKET, BY FLAVOR, 2020-2029 (USD MILLION)
TABLE 169 THAILAND SPICES IN PREMIUM WINE MARKET, BY FLAVOR, 2020-2029 (USD MILLION)
TABLE 170 THAILAND PREMIUM WINE MARKET, BY AGEING YEARS, 2020-2029 (USD MILLION)
TABLE 171 THAILAND PREMIUM WINE MARKET, BY AGEING BARREL TYPE, 2020-2029 (USD MILLION)
TABLE 172 THAILAND PREMIUM WINE MARKET, BY PRICE RANGE, 2020-2029 (USD MILLION)
TABLE 173 THAILAND PREMIUM WINE MARKET, BY DISTRIBUTION CHANNEL, 2020-2029 (USD MILLION)
TABLE 174 THAILAND STORE BASED RETAILERS IN PREMIUM WINE MARKET, BY DISTRIBUTION CHANNEL, 2020-2029 (USD MILLION)
TABLE 175 SINGAPORE PREMIUM WINE MARKET, BY WINE COLOR, 2020-2029 (USD MILLION)
TABLE 176 SINGAPORE RED WINE IN PREMIUM WINE MARKET, BY TYPE, 2020-2029 (USD MILLION)
TABLE 177 SINGAPORE PREMIUM WINE MARKET, BY PRODUCT TYPE, 2020-2029 (USD MILLION)
TABLE 178 SINGAPORE DESSERT WINE IN PREMIUM WINE MARKET, BY PRODUCT TYPE, 2020-2029 (USD MILLION)
TABLE 179 SINGAPORE PREMIUM WINE MARKET, BY PRODUCT CATEGORY, 2020-2029 (USD MILLION)
TABLE 180 SINGAPORE NON-ALCOHOLIC WINE IN PREMIUM WINE MARKET, BY ABV % , 2020-2029 (USD MILLION)
TABLE 181 SINGAPORE FLAVORED WINES IN PREMIUM WINE MARKET, BY FLAVOR, 2020-2029 (USD MILLION)
TABLE 182 SINGAPORE FRUIT IN PREMIUM WINE MARKET, BY FLAVOR, 2020-2029 (USD MILLION)
TABLE 183 SINGAPORE BERRY IN PREMIUM WINE MARKET, BY FLAVOR, 2020-2029 (USD MILLION)
TABLE 184 SINGAPORE FLORAL IN PREMIUM WINE MARKET, BY FLAVOR, 2020-2029 (USD MILLION)
TABLE 185 SINGAPORE HERBAL IN PREMIUM WINE MARKET, BY FLAVOR, 2020-2029 (USD MILLION)
TABLE 186 SINGAPORE SPICES IN PREMIUM WINE MARKET, BY FLAVOR, 2020-2029 (USD MILLION)
TABLE 187 SINGAPORE PREMIUM WINE MARKET, BY AGEING YEARS, 2020-2029 (USD MILLION)
TABLE 188 SINGAPORE PREMIUM WINE MARKET, BY AGEING BARREL TYPE, 2020-2029 (USD MILLION)
TABLE 189 SINGAPORE PREMIUM WINE MARKET, BY PRICE RANGE, 2020-2029 (USD MILLION)
TABLE 190 SINGAPORE PREMIUM WINE MARKET, BY DISTRIBUTION CHANNEL, 2020-2029 (USD MILLION)
TABLE 191 SINGAPORE STORE BASED RETAILERS IN PREMIUM WINE MARKET, BY DISTRIBUTION CHANNEL, 2020-2029 (USD MILLION)
TABLE 192 VIETNAM PREMIUM WINE MARKET, BY WINE COLOR, 2020-2029 (USD MILLION)
TABLE 193 VIETNAM RED WINE IN PREMIUM WINE MARKET, BY TYPE, 2020-2029 (USD MILLION)
TABLE 194 VIETNAM PREMIUM WINE MARKET, BY PRODUCT TYPE, 2020-2029 (USD MILLION)
TABLE 195 VIETNAM DESSERT WINE IN PREMIUM WINE MARKET, BY PRODUCT TYPE, 2020-2029 (USD MILLION)
TABLE 196 VIETNAM PREMIUM WINE MARKET, BY PRODUCT CATEGORY, 2020-2029 (USD MILLION)
TABLE 197 VIETNAM NON-ALCOHOLIC WINE IN PREMIUM WINE MARKET, BY ABV % , 2020-2029 (USD MILLION)
TABLE 198 VIETNAM PREMIUM WINE MARKET, BY FLAVOR, 2020-2029 (USD MILLION)
TABLE 199 VIETNAM FLAVORED WINES IN PREMIUM WINE MARKET, BY FLAVOR, 2020-2029 (USD MILLION)
TABLE 200 VIETNAM FRUIT IN PREMIUM WINE MARKET, BY FLAVOR, 2020-2029 (USD MILLION)
TABLE 201 VIETNAM BERRY IN PREMIUM WINE MARKET, BY FLAVOR, 2020-2029 (USD MILLION)
TABLE 202 VIETNAM FLORAL IN PREMIUM WINE MARKET, BY FLAVOR, 2020-2029 (USD MILLION)
TABLE 203 VIETNAM HERBAL IN PREMIUM WINE MARKET, BY FLAVOR, 2020-2029 (USD MILLION)
TABLE 204 VIETNAM SPICES IN PREMIUM WINE MARKET, BY FLAVOR, 2020-2029 (USD MILLION)
TABLE 205 VIETNAM PREMIUM WINE MARKET, BY AGEING YEARS, 2020-2029 (USD MILLION)
TABLE 206 VIETNAM PREMIUM WINE MARKET, BY AGEING BARREL TYPE, 2020-2029 (USD MILLION)
TABLE 207 VIETNAM PREMIUM WINE MARKET, BY PRICE RANGE, 2020-2029 (USD MILLION)
TABLE 208 VIETNAM PREMIUM WINE MARKET, BY DISTRIBUTION CHANNEL, 2020-2029 (USD MILLION)
TABLE 209 VIETNAM STORE BASED RETAILERS IN PREMIUM WINE MARKET, BY DISTRIBUTION CHANNEL, 2020-2029 (USD MILLION)
TABLE 210 NEW ZEALAND PREMIUM WINE MARKET, BY WINE COLOR, 2020-2029 (USD MILLION)
TABLE 211 NEW ZEALAND RED WINE IN PREMIUM WINE MARKET, BY TYPE, 2020-2029 (USD MILLION)
TABLE 212 NEW ZEALAND PREMIUM WINE MARKET, BY PRODUCT TYPE, 2020-2029 (USD MILLION)
TABLE 213 NEW ZEALAND DESSERT WINE IN PREMIUM WINE MARKET, BY PRODUCT TYPE, 2020-2029 (USD MILLION)
TABLE 214 NEW ZEALAND PREMIUM WINE MARKET, BY PRODUCT CATEGORY, 2020-2029 (USD MILLION)
TABLE 215 NEW ZEALAND NON-ALCOHOLIC WINE IN PREMIUM WINE MARKET, BY ABV % , 2020-2029 (USD MILLION)
TABLE 216 NEW ZEALAND PREMIUM WINE MARKET, BY FLAVOR, 2020-2029 (USD MILLION)
TABLE 217 NEW ZEALAND FLAVORED WINES IN PREMIUM WINE MARKET, BY FLAVOR, 2020-2029 (USD MILLION)
TABLE 218 NEW ZEALAND FRUIT IN PREMIUM WINE MARKET, BY FLAVOR, 2020-2029 (USD MILLION)
TABLE 219 NEW ZEALAND BERRY IN PREMIUM WINE MARKET, BY FLAVOR, 2020-2029 (USD MILLION)
TABLE 220 NEW ZEALAND FLORAL IN PREMIUM WINE MARKET, BY FLAVOR, 2020-2029 (USD MILLION)
TABLE 221 NEW ZEALAND HERBAL IN PREMIUM WINE MARKET, BY FLAVOR, 2020-2029 (USD MILLION)
TABLE 222 NEW ZEALAND SPICES IN PREMIUM WINE MARKET, BY FLAVOR, 2020-2029 (USD MILLION)
TABLE 223 NEW ZEALAND PREMIUM WINE MARKET, BY AGEING YEARS, 2020-2029 (USD MILLION)
TABLE 224 NEW ZEALAND PREMIUM WINE MARKET, BY AGEING BARREL TYPE, 2020-2029 (USD MILLION)
TABLE 225 NEW ZEALAND PREMIUM WINE MARKET, BY PRICE RANGE, 2020-2029 (USD MILLION)
TABLE 226 NEW ZEALAND PREMIUM WINE MARKET, BY DISTRIBUTION CHANNEL, 2020-2029 (USD MILLION)
TABLE 227 NEW ZEALAND STORE BASED RETAILERS IN PREMIUM WINE MARKET, BY DISTRIBUTION CHANNEL, 2020-2029 (USD MILLION)
TABLE 228 MALAYSIA PREMIUM WINE MARKET, BY WINE COLOR, 2020-2029 (USD MILLION)
TABLE 229 MALAYSIA RED WINE IN PREMIUM WINE MARKET, BY TYPE, 2020-2029 (USD MILLION)
TABLE 230 MALAYSIA PREMIUM WINE MARKET, BY PRODUCT TYPE, 2020-2029 (USD MILLION)
TABLE 231 MALAYSIA DESSERT WINE IN PREMIUM WINE MARKET, BY PRODUCT TYPE, 2020-2029 (USD MILLION)
TABLE 232 MALAYSIA PREMIUM WINE MARKET, BY PRODUCT CATEGORY, 2020-2029 (USD MILLION)
TABLE 233 MALAYSIA NON-ALCOHOLIC WINE IN PREMIUM WINE MARKET, BY ABV % , 2020-2029 (USD MILLION)
TABLE 234 MALAYSIA PREMIUM WINE MARKET, BY FLAVOR, 2020-2029 (USD MILLION)
TABLE 235 MALAYSIA FLAVORED WINES IN PREMIUM WINE MARKET, BY FLAVOR, 2020-2029 (USD MILLION)
TABLE 236 MALAYSIA FRUIT IN PREMIUM WINE MARKET, BY FLAVOR, 2020-2029 (USD MILLION)
TABLE 237 MALAYSIA BERRY IN PREMIUM WINE MARKET, BY FLAVOR, 2020-2029 (USD MILLION)
TABLE 238 MALAYSIA FLORAL IN PREMIUM WINE MARKET, BY FLAVOR, 2020-2029 (USD MILLION)
TABLE 239 MALAYSIA HERBAL IN PREMIUM WINE MARKET, BY FLAVOR, 2020-2029 (USD MILLION)
TABLE 240 MALAYSIA SPICES IN PREMIUM WINE MARKET, BY FLAVOR, 2020-2029 (USD MILLION)
TABLE 241 MALAYSIA PREMIUM WINE MARKET, BY AGEING YEARS, 2020-2029 (USD MILLION)
TABLE 242 MALAYSIA PREMIUM WINE MARKET, BY AGEING BARREL TYPE, 2020-2029 (USD MILLION)
TABLE 243 MALAYSIA PREMIUM WINE MARKET, BY PRICE RANGE, 2020-2029 (USD MILLION)
TABLE 244 MALAYSIA PREMIUM WINE MARKET, BY DISTRIBUTION CHANNEL, 2020-2029 (USD MILLION)
TABLE 245 MALAYSIA STORE BASED RETAILERS IN PREMIUM WINE MARKET, BY DISTRIBUTION CHANNEL, 2020-2029 (USD MILLION)
TABLE 246 PHILIPPINES PREMIUM WINE MARKET, BY WINE COLOR, 2020-2029 (USD MILLION)
TABLE 247 PHILIPPINES RED WINE IN PREMIUM WINE MARKET, BY TYPE, 2020-2029 (USD MILLION)
TABLE 248 PHILIPPINES PREMIUM WINE MARKET, BY PRODUCT TYPE, 2020-2029 (USD MILLION)
TABLE 249 PHILIPPINES DESSERT WINE IN PREMIUM WINE MARKET, BY PRODUCT TYPE, 2020-2029 (USD MILLION)
TABLE 250 PHILIPPINES PREMIUM WINE MARKET, BY PRODUCT CATEGORY, 2020-2029 (USD MILLION)
TABLE 251 PHILIPPINES NON-ALCOHOLIC WINE IN PREMIUM WINE MARKET, BY ABV % , 2020-2029 (USD MILLION)
TABLE 252 PHILIPPINES PREMIUM WINE MARKET, BY FLAVOR, 2020-2029 (USD MILLION)
TABLE 253 PHILIPPINES FLAVORED WINES IN PREMIUM WINE MARKET, BY FLAVOR, 2020-2029 (USD MILLION)
TABLE 254 PHILIPPINES FRUIT IN PREMIUM WINE MARKET, BY FLAVOR, 2020-2029 (USD MILLION)
TABLE 255 PHILIPPINES BERRY IN PREMIUM WINE MARKET, BY FLAVOR, 2020-2029 (USD MILLION)
TABLE 256 PHILIPPINES FLORAL IN PREMIUM WINE MARKET, BY FLAVOR, 2020-2029 (USD MILLION)
TABLE 257 PHILIPPINES HERBAL IN PREMIUM WINE MARKET, BY FLAVOR, 2020-2029 (USD MILLION)
TABLE 258 PHILIPPINES SPICES IN PREMIUM WINE MARKET, BY FLAVOR, 2020-2029 (USD MILLION)
TABLE 259 PHILIPPINES PREMIUM WINE MARKET, BY AGEING YEARS, 2020-2029 (USD MILLION)
TABLE 260 PHILIPPINES PREMIUM WINE MARKET, BY AGEING BARREL TYPE, 2020-2029 (USD MILLION)
TABLE 261 PHILIPPINES PREMIUM WINE MARKET, BY PRICE RANGE, 2020-2029 (USD MILLION)
TABLE 262 PHILIPPINES PREMIUM WINE MARKET, BY DISTRIBUTION CHANNEL, 2020-2029 (USD MILLION)
TABLE 263 PHILIPPINES STORE BASED RETAILERS IN PREMIUM WINE MARKET, BY DISTRIBUTION CHANNEL, 2020-2029 (USD MILLION)
TABLE 264 REST OF ASIA-PACIFIC PREMIUM WINE MARKET, BY WINE COLOR, 2020-2029 (USD MILLION)
List of Figure
FIGURE 1 ASIA PACIFIC PREMIUM WINE MARKET: SEGMENTATION
FIGURE 2 ASIA PACIFIC PREMIUM WINE MARKET: DATA TRIANGULATION
FIGURE 3 ASIA PACIFIC PREMIUM WINE MARKET: DROC ANALYSIS
FIGURE 4 ASIA PACIFIC PREMIUM WINE MARKET: ASIA PACIFIC VS REGIONAL MARKET ANALYSIS
FIGURE 5 ASIA PACIFIC PREMIUM WINE MARKET: COMPANY RESEARCH ANALYSIS
FIGURE 6 ASIA PACIFIC PREMIUM WINE MARKET: INTERVIEW DEMOGRAPHICS
FIGURE 7 ASIA PACIFIC PREMIUM WINE MARKET: DBMR MARKET POSITION GRID
FIGURE 8 ASIA PACIFIC PREMIUM WINE MARKET: MARKET WINE COLOUR COVERAGE GRID
FIGURE 9 ASIA PACIFIC PREMIUM WINE MARKET: VENDOR SHARE ANALYSIS
FIGURE 10 ASIA PACIFIC PREMIUM WINE MARKET: SEGMENTATION
FIGURE 11 THE GROWING DEMAND OF WINE OWING TO DIFFERENT HEALTH BENEFITS AND RISING E-COMMERCE, COURIER AND WINE DELIVERY SERVICES ARE EXPECTED TO DRIVE THE ASIA PACIFIC PREMIUM WINE MARKET IN THE FORECAST PERIOD OF 2022 TO 2029
FIGURE 12 RED WINE SEGMENT IS EXPECTED TO ACCOUNT FOR THE LARGEST SHARE OF THE ASIA PACIFIC PREMIUM WINE MARKET IN 2022 & 2029
FIGURE 13 DRIVERS, RESTRAINTS, OPPORTUNITIES, AND CHALLENGES OF THE ASIA PACIFIC PREMIUM WINE MARKET
FIGURE 14 THE FOLLOWING GRAPH SHOWCASES THE INCREASE IN THE CONSUMPTION OF WINE IN THE U.S.
FIGURE 15 TOP FIVE LARGEST E-COMMERCE MARKETS IN 2019 (USD BILLION)
FIGURE 16 ASIA PACIFIC PREMIUM WINE MARKET: BY WINE COLOR, 2021
FIGURE 17 ASIA PACIFIC PREMIUM WINE MARKET: BY WINE COLOR, 2022-2029 (USD MILLION)
FIGURE 18 ASIA PACIFIC PREMIUM WINE MARKET: BY WINE COLOR, CAGR (2022-2029)
FIGURE 19 ASIA PACIFIC PREMIUM WINE MARKET: BY WINE COLOR, LIFELINE CURVE
FIGURE 20 ASIA PACIFIC PREMIUM WINE MARKET: BY PRODUCT TYPE, 2021
FIGURE 21 ASIA PACIFIC PREMIUM WINE MARKET: BY PRODUCT TYPE, 2022-2029 (USD MILLION)
FIGURE 22 ASIA PACIFIC PREMIUM WINE MARKET: BY PRODUCT TYPE, CAGR (2022-2029)
FIGURE 23 ASIA PACIFIC PREMIUM WINE MARKET: BY PRODUCT TYPE, LIFELINE CURVE
FIGURE 24 ASIA PACIFIC PREMIUM WINE MARKET: BY PRODUCT CATEGORY, 2021
FIGURE 25 ASIA PACIFIC PREMIUM WINE MARKET: BY PRODUCT CATEGORY, 2022-2029 (USD MILLION)
FIGURE 26 ASIA PACIFIC PREMIUM WINE MARKET: BY PRODUCT CATEGORY, CAGR (2022-2029)
FIGURE 27 ASIA PACIFIC PREMIUM WINE MARKET: BY PRODUCT CATEGORY, LIFELINE CURVE
FIGURE 28 ASIA PACIFIC PREMIUM WINE MARKET: BY FLAVOR, 2021
FIGURE 29 ASIA PACIFIC PREMIUM WINE MARKET: BY FLAVOR, 2022-2029 (USD MILLION)
FIGURE 30 ASIA PACIFIC PREMIUM WINE MARKET: BY FLAVOR, CAGR (2022-2029)
FIGURE 31 ASIA PACIFIC PREMIUM WINE MARKET: BY FLAVOR, LIFELINE CURVE
FIGURE 32 ASIA PACIFIC PREMIUM WINE MARKET: BY AGEING YEARS, 2021
FIGURE 33 ASIA PACIFIC PREMIUM WINE MARKET: BY AGEING YEARS, 2022-2029 (USD MILLION)
FIGURE 34 ASIA PACIFIC PREMIUM WINE MARKET: BY AGEING YEARS, CAGR (2022-2029)
FIGURE 35 ASIA PACIFIC PREMIUM WINE MARKET: BY AGEING YEARS, LIFELINE CURVE
FIGURE 36 ASIA PACIFIC PREMIUM WINE MARKET: BY AGEING BARREL TYPE, 2021
FIGURE 37 ASIA PACIFIC PREMIUM WINE MARKET: BY AGEING BARREL TYPE, 2022-2029 (USD MILLION)
FIGURE 38 ASIA PACIFIC PREMIUM WINE MARKET: BY AGEING BARREL TYPE, CAGR (2022-2029)
FIGURE 39 ASIA PACIFIC PREMIUM WINE MARKET: BY AGEING BARREL TYPE, LIFELINE CURVE
FIGURE 40 ASIA PACIFIC PREMIUM WINE MARKET: BY PRICE RANGE, 2021
FIGURE 41 ASIA PACIFIC PREMIUM WINE MARKET: BY PRICE RANGE, 2022-2029 (USD MILLION)
FIGURE 42 ASIA PACIFIC PREMIUM WINE MARKET: BY PRICE RANGE, CAGR (2022-2029)
FIGURE 43 ASIA PACIFIC PREMIUM WINE MARKET: BY PRICE RANGE, LIFELINE
FIGURE 44 ASIA PACIFIC PREMIUM WINE MARKET: BY DISTRIBUTION CHANNEL, 2021
FIGURE 45 ASIA PACIFIC PREMIUM WINE MARKET: BY DISTRIBUTION CHANNEL, 2022-2029 (USD MILLION)
FIGURE 46 ASIA PACIFIC PREMIUM WINE MARKET: BY DISTRIBUTION CHANNEL, CAGR (2022-2029)
FIGURE 47 ASIA PACIFIC PREMIUM WINE MARKET: BY DISTRIBUTION CHANNEL, LIFELINE
FIGURE 48 ASIA-PACIFIC PREMIUM WINE MARKET: SNAPSHOT (2021)
FIGURE 49 ASIA-PACIFIC PREMIUM WINE MARKET: BY COUNTRY (2021)
FIGURE 50 ASIA-PACIFIC PREMIUM WINE MARKET: BY COUNTRY (2022 & 2029)
FIGURE 51 ASIA-PACIFIC PREMIUM WINE MARKET: BY COUNTRY (2021 & 2029)
FIGURE 52 ASIA-PACIFIC PREMIUM WINE MARKET: BY WINE COLOUR (2022-2029)
FIGURE 53 ASIA PACIFIC PREMIUM WINE MARKET: COMPANY SHARE 2021 (%)
Asia Pacific Premium Wine Market, Supply Chain Analysis and Ecosystem Framework
To support market growth and help clients navigate the impact of geopolitical shifts, DBMR has integrated in-depth supply chain analysis into its Asia Pacific Premium Wine Market research reports. This addition empowers clients to respond effectively to global changes affecting their industries. The supply chain analysis section includes detailed insights such as Asia Pacific Premium Wine Market consumption and production by country, price trend analysis, the impact of tariffs and geopolitical developments, and import and export trends by country and HSN code. It also highlights major suppliers with data on production capacity and company profiles, as well as key importers and exporters. In addition to research, DBMR offers specialized supply chain consulting services backed by over a decade of experience, providing solutions like supplier discovery, supplier risk assessment, price trend analysis, impact evaluation of inflation and trade route changes, and comprehensive market trend analysis.
Data collection and base year analysis are done using data collection modules with large sample sizes. The stage includes obtaining market information or related data through various sources and strategies. It includes examining and planning all the data acquired from the past in advance. It likewise envelops the examination of information inconsistencies seen across different information sources. The market data is analysed and estimated using market statistical and coherent models. Also, market share analysis and key trend analysis are the major success factors in the market report. To know more, please request an analyst call or drop down your inquiry.
The key research methodology used by DBMR research team is data triangulation which involves data mining, analysis of the impact of data variables on the market and primary (industry expert) validation. Data models include Vendor Positioning Grid, Market Time Line Analysis, Market Overview and Guide, Company Positioning Grid, Patent Analysis, Pricing Analysis, Company Market Share Analysis, Standards of Measurement, Global versus Regional and Vendor Share Analysis. To know more about the research methodology, drop in an inquiry to speak to our industry experts.
Data Bridge Market Research is a leader in advanced formative research. We take pride in servicing our existing and new customers with data and analysis that match and suits their goal. The report can be customized to include price trend analysis of target brands understanding the market for additional countries (ask for the list of countries), clinical trial results data, literature review, refurbished market and product base analysis. Market analysis of target competitors can be analyzed from technology-based analysis to market portfolio strategies. We can add as many competitors that you require data about in the format and data style you are looking for. Our team of analysts can also provide you data in crude raw excel files pivot tables (Fact book) or can assist you in creating presentations from the data sets available in the report.


