
Asia-Pacific Semiconductor Manufacturing Equipment Market Analysis and Insights
The semiconductor manufacturing equipment market is growing substantially due to the increased adoption of semiconductor equipment in connected devices and the automobile industry. As the designs of I.C. are becoming more complex, more semiconductor products are being embedded in the creation of I.C. The semiconductor has become integral to the electronic design process, as it helps reduce the cost of I.C. development, increase end-product value, accelerate time-to-market and reduce time-to-volume. It helps companies to fill the design gap of I.C.
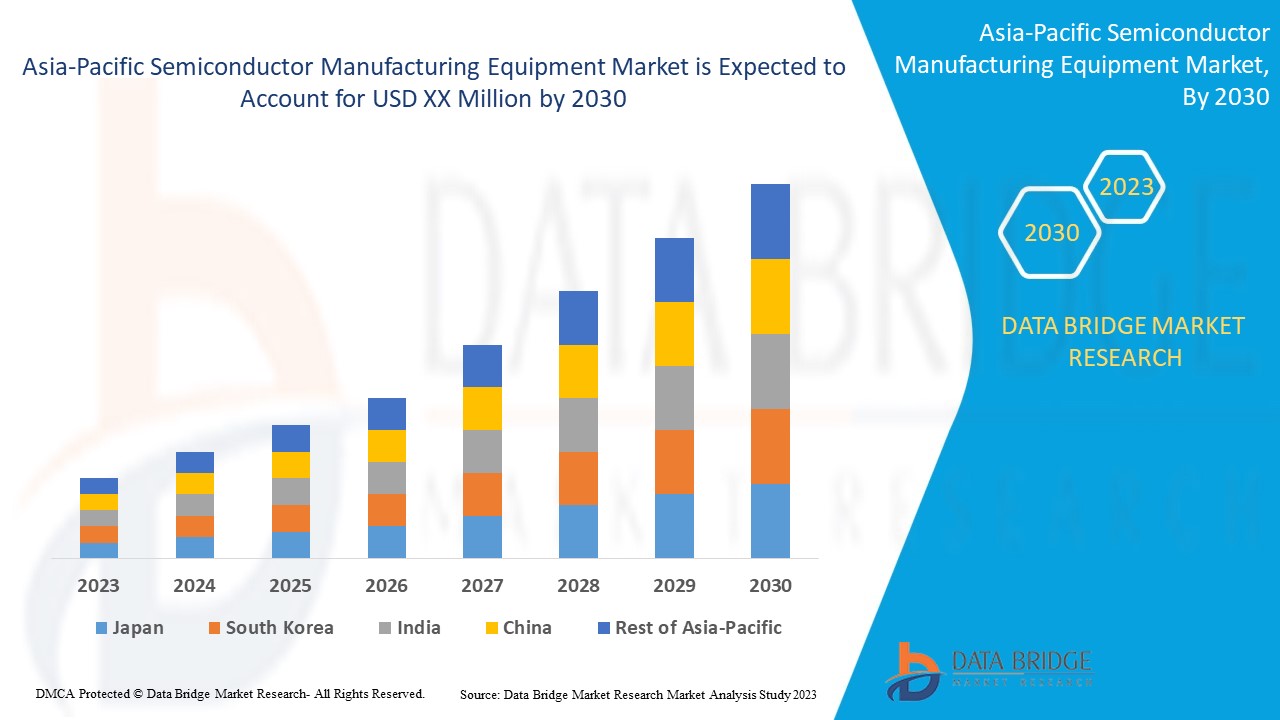
Data Bridge Market Research analyses that Asia-Pacific semiconductor manufacturing equipment market will grow at a CAGR of 9.7% during the forecast period of 2023 to 2030.
|
Report Metric |
Details |
|
Forecast Period |
2023 to 2030 |
|
Base Year |
2022 |
|
Historic Years |
2021 (Customizable to 2020 - 2015) |
|
Quantitative Units |
Revenue in USD Million, Volumes in Units, Pricing in USD |
|
Segments Covered |
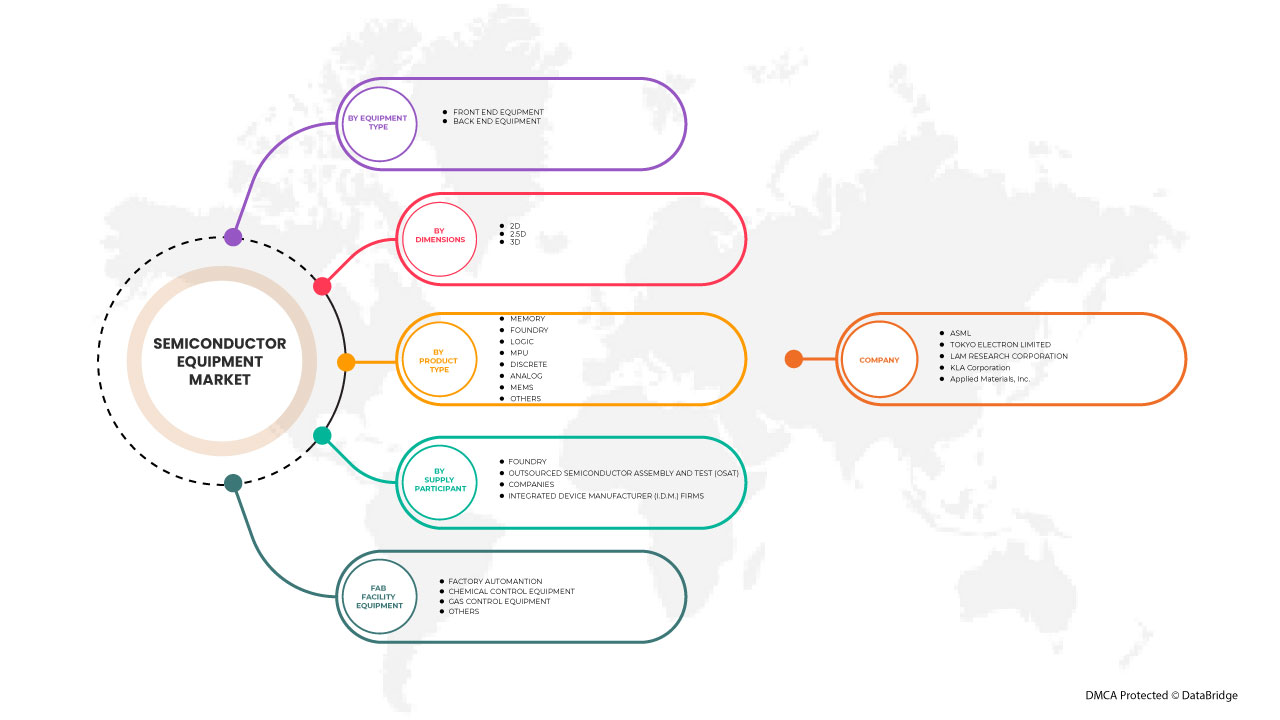
By Equipment Type (Front End Equipment and Back End Equipment), Dimensions (3D, 2.5D and 2D), Product Type (Memory, MEMS, Foundry, Anolog, MPU, Logic, Discrete, Others), Supply Chain Participant (Foundry, Outsourced Semiconductor Assembly And Test (OSAT) Companies, And Integrated Device Manufacturer (I.D.M.) Firms) and Fab Facility Equipment (Factory Automation, Gas Control Equipment, Chemical Control Equipment). |
|
Countries Covered |
China, Japan, India, South Korea, Singapore, Malaysia, Australia, Thailand, Indonesia, Philippines, Rest of Asia-Pacific (APAC) in the Asia-Pacific (APAC). |
|
Market Players Covered |
ASML, KLA Corporation., Plasma-Therm, LAM RESEARCH CORPORATION., Veeco Instruments Inc., EV Group, Tokyo Electron Limited, Canon Machinery Inc., Nordson Corporation, Hitachi High-Tech Corporation, Advanced Dicing Technologies., Evatec AG., NOIVION, Modutek.com, QP Technologies, Applied Materials, Inc., SCREEN Holdings Co., Ltd., Teradyne Inc., Onto Innovation, ADVANTEST CORPORATION, TOKYO SEIMITSU CO., LTD., SÜSS MicroTec SE, ASMPT , FormFactor, UNITES Systems a.s., Gigaphoton Inc. and Palomar Technologies among others. |
Semiconductor Manufacturing Equipment Definition
Semiconductor equipment generally refers to the production equipment required to produce various semiconductor products and belongs to the key supporting link of the semiconductor industry chain. Semiconductor equipment is the technological leader in the semiconductor industry. Chip design, wafer manufacturing, and packaging and testing must be designed and manufactured within the scope of equipment technology. The advancement of equipment technology also promotes the development of the semiconductor industry.
Semiconductor Manufacturing Equipment Market Dynamics
This section deals with understanding the market drivers, advantages, opportunities, restraints and challenges. All of this is discussed in detail as below:
Drivers
-
INCREASING CONSUMPTION OF CONSUMER ELECTRONICS
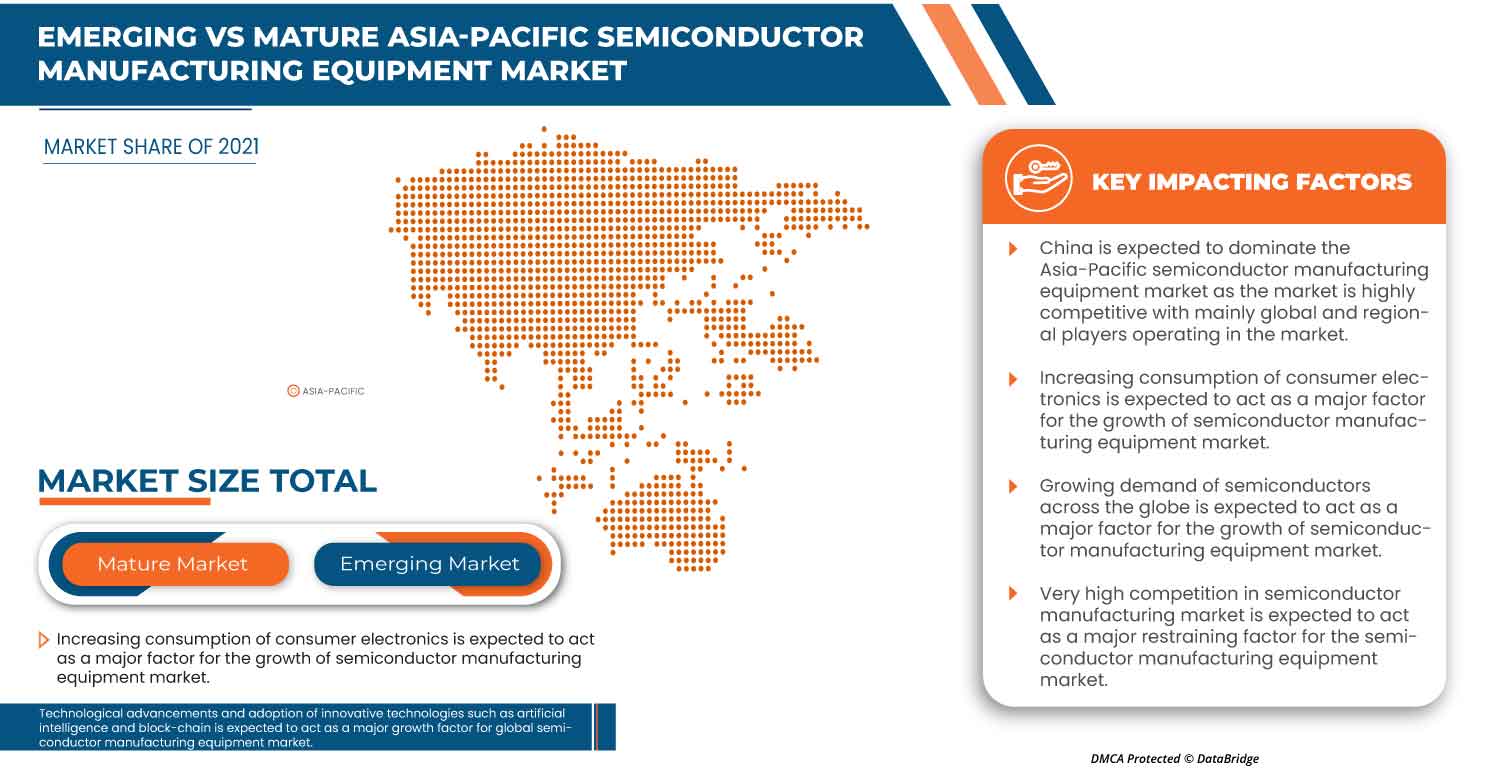
Increasing consumers' disposable income and need for advanced electronic products drive the consumer electronics market. Consumers are becoming techno-savvy and adopting new technologies at work, in daily routines, in personal entertainment, and others. Smart devices are adopting the major market share owing to improved control, features, and other functions. Consumers are ready to spend extra money on advanced gadgets to enhance their experiences and living standards. The flexible electronics equipped with flexible sensors are available in the market under premium category products; hence acceptance for premium products is driving the market growth.
-
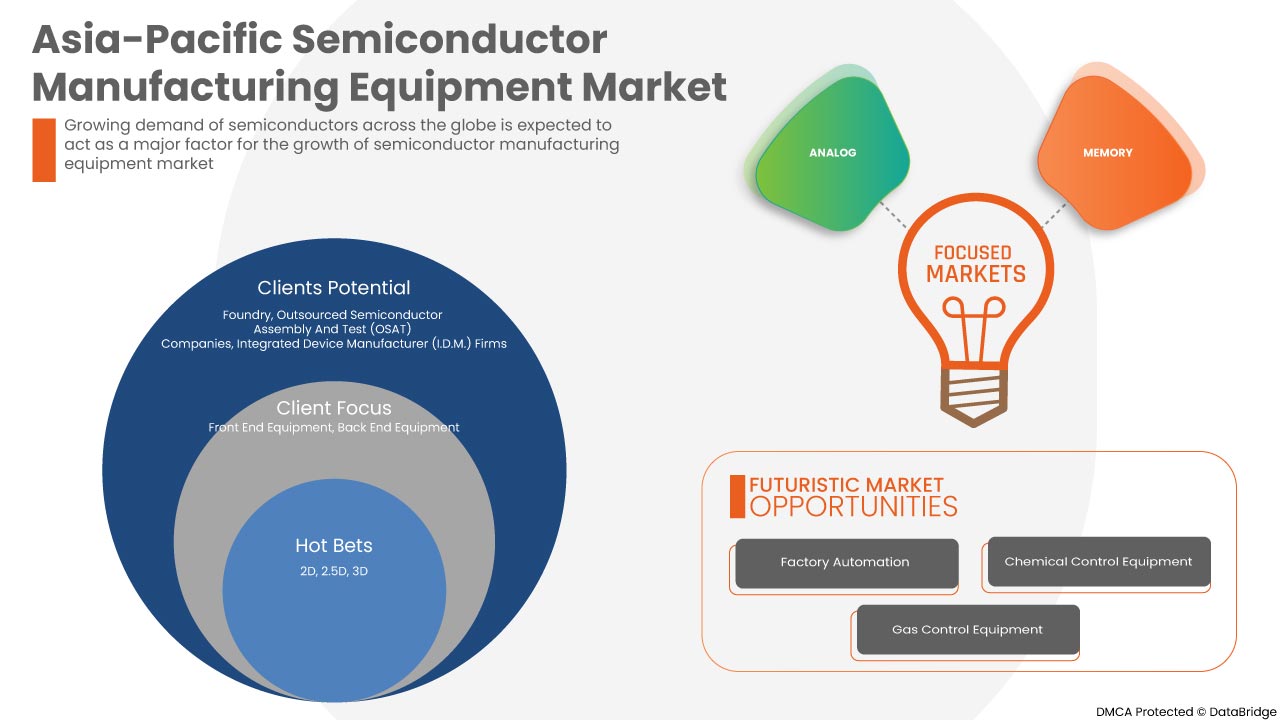
GROWING DEMAND FOR SEMICONDUCTORS ACROSS THE GLOBE
A substance with specialised electrical properties called a semiconductor can be used as the basis for computers and other electronic devices. Typically, it is a solid chemical element or compound that, in some circumstances, transmits electricity but not in others. Because of this, it is the perfect medium for controlling electrical current and common electrical appliances.
Semiconductors are microscopic electrical devices comprised of silicon, germanium, or gallium arsenide compounds. The semiconductor industry develops and produces semiconductors. Almost every electronic device includes semiconductors, including televisions, computers, medical diagnostic tools, cell phones, and video games. The big, cumbersome vacuum tube technology of the past has been replaced by the modern, ever-shrinking semiconductor thanks to advancements made in the semiconductor industry since 1960, allowing for the creation of smaller, faster, and even more dependable electronic devices. Electronics firms and manufacturers in the United States, Japan, China, South Korea, France, and Italy currently make up the USD 300 billion semiconductor sector.
Opportunity
-
RISE IN DIGITAL SUPPLY CHAIN ACROSS THE GLOBE
A supply chain that uses data analytics and digital technologies to make decisions, improve performance, and react swiftly to changing circumstances is known as a "digital supply chain." Digital supply networks are fundamentally driven by data generated by current supply chains, which is stored in data warehouses and evaluated for useful insights.
As a necessary initial step, historical supply chain management technologies such as demand planning, asset management, warehouse management, transportation and logistics management, procurement, and order fulfillment must be fully integrated. However, to digitise a supply chain, data from those operations must also be mined, and the equipment that enables them to provide the required data must be instrumented.
The emergence of the Cloud, the rollout of 5G, connected vehicles, and digitalization have all contributed to a never-before-seen demand for high-performance computing. The most coveted semiconductor market is also racing to board the digitalization train. A key element of improved supply chain resilience is data insights. Semiconductor firms may make quicker, data-driven choices by utilizing technology and applications to capture precise data and analytics at al l supply chain points.
Restraints/Challenges
- DISRUPTION IN THE SUPPLY CHAIN INDUSTRY
The war for semiconductors, specifically contested by the automotive and high-tech consumer industries, is one of the biggest Asia-Pacific issues affecting supply chains in specialized industries.
The Covid-19 pandemic, which shut down auto manufacturing while skyrocketing Asia-Pacific consumption of domestic electronics, was the conflict's major cause. However, the source of the problem predates the Asia-Pacific lockdown.
Manufacturing suddenly decreased in 2020 due to hastily canceled orders and just-in-time procedures when the pandemic lockdown began. However, as customers used more laptop computers, 5G phones, gaming consoles, and other .T.I.T. devices, demand for silicon chips soared due to the epidemic working circumstances. A V-shaped recovery for personal computers, mobile devices, cars, and wireless communications resulted from a fall in semiconductor demand by the end of 2020.
Recent Development
- In September 2022, Onto Innovation. announced its first lot to deliver the Company’s Dragonfly G3 system with the new EB40 module to a top three semiconductor manufacturer. This helps the company expand its product portfolio and the offering to the market.
Semiconductor Manufacturing Equipment Market Scope
The semiconductor manufacturing equipment market is segmented on the basis of by equipment type, dimensions, product type, supply chain participant and fab facility equipment. The growth amongst these segments will help you analyze major growth segments in the industries and provide the users with a valuable market overview and market insights to help them make strategic decisions for identifying core market applications.
Equipment Type
- Front End Equipment
- Back End Equipment
On the basis of equipment type, the market is segmented into front end equipment and back end equipment.
Dimensions
- 2D
- 2.5D
- 3D
On the basis of dimensions, the market is segmented into 2D, 2.5D, and 3D.
Product Type
- Memory
- Foundry
- Logic
- MPU
- Discrete
- Analog
- MEMS
- Other
On the basis of product type, the market is segmented into memory, foundry, logic, M.P.U., discrete, analog, MEMS, and others.
Supply Chain Participant
- Foundry
- Outsourced Semiconductor Assembly And Test (OSAT) Companies
- Integrated Device Manufacturer (I.D.M.) Firms
On the basis of supply chain participant, the market is segmented into foundry, outsourced semiconductor assembly and test (OSAT) companies, and integrated device manufacturer (I.D.M.) firms.
Fab Facility Equipment
- Factory Automation
- Chemical Control Equipment
- Gas Control Equipment
- Other
On the basis of fab facility equipment, the market is segmented into factory automation, chemical control equipment, gas control equipment, and others.
Semiconductor Manufacturing Equipment Market Regional Analysis/Insights
The semiconductor manufacturing equipment market is analysed and market size insights and trends are provided by equipment type, dimensions, product type, supply chain participant and fab facility equipment.
The countries covered in the semiconductor manufacturing equipment market report are China, Japan, India, South Korea, Singapore, Malaysia, Australia, Thailand, Indonesia, Philippines, Rest of Asia-Pacific (APAC) in the Asia-Pacific (APAC).
Asia-Pacific region is expected to dominate the semiconductor manufacturing equipment market globally as the region has a higher demand for automotive and automation in the manufacturing industry than other regions. In Asia-Pacific, the China is expected to dominate the market due to the increasing consumption of consumer electronics.
The country section of the report also provides individual market impacting factors and changes in regulations in the market domestically that impacts the current and future trends of the market. Data points such as new sales, replacement sales, country demographics, disease epidemiology and import-export tariffs are some of the major pointers used to forecast the market scenario for individual countries. Also, presence and availability of Asia-Pacific brands and their challenges faced due to large or scarce competition from local and domestic brands, impact of sales channels are considered while providing forecast analysis of the country data.
Competitive Landscape and Semiconductor Manufacturing Equipment Market Share Analysis
The semiconductor manufacturing equipment market competitive landscape provides details by competitor. Details included are company overview, company financials, revenue generated, market potential, investment in research and development, new market initiatives, Asia-Pacific presence, production sites and facilities, production capacities, company strengths and weaknesses, solution launch, product width and breadth, application dominance. The above data points provided are only related to the companies' focus related to semiconductor manufacturing equipment market.
Some of the major players operating in the Asia-Pacific semiconductor manufacturing equipment market are ASML, K.L.A. Corporation., Plasma-Therm, LAM RESEARCH CORPORATION., Veeco Instruments Inc., E.V. Group, Tokyo Electron Limited, Canon Machinery Inc., Nordson Corporation, Hitachi High-Tech Corporation, Advanced Dicing Technologies., Evatec AG., NOIVION, Modutek.com, QP Technologies, Applied Materials, Inc., SCREEN Holdings Co., Ltd., Teradyne Inc., Onto Innovation, ADVANTEST CORPORATION, TOKYO SEIMITSU CO., LTD., SÜSS MicroTec SE, ASMPT , FormFactor, UNITES Systems a.s., Gigaphoton Inc. and Palomar Technologies among others.
SKU-

- Interactive Data Analysis Dashboard
- Company Analysis Dashboard for high growth potential opportunities
- Research Analyst Access for customization & queries
- Competitor Analysis with Interactive dashboard
- Latest News, Updates & Trend analysis
- Harness the Power of Benchmark Analysis for Comprehensive Competitor Tracking
Table of Content
1 INTRODUCTION
1.1 OBJECTIVES OF THE STUDY
1.2 MARKET DEFINITION
1.3 OVERVIEW OF THE ASIA PACIFIC SEMICONDUCTOR MANUFACTURING EQUIPMENT MARKET
1.4 CURRENCY AND PRICING
1.5 LIMITATIONS
1.6 MARKETS COVERED
2 MARKET SEGMENTATION
2.1 MARKETS COVERED
2.2 GEOGRAPHICAL SCOPE
2.3 YEARS CONSIDERED FOR THE STUDY
2.4 DBMR TRIPOD DATA VALIDATION MODEL
2.5 PRIMARY INTERVIEWS WITH KEY OPINION LEADERS
2.6 DBMR MARKET POSITION GRID
2.7 VENDOR SHARE ANALYSIS
2.8 MULTIVARIATE MODELING
2.9 COMPONENT TYPE TIMELINE CURVE
2.1 SECONDARY SOURCES
2.11 ASSUMPTIONS
3 EXECUTIVE SUMMARY
4 PREMIUM INSIGHTS
5 MARKET OVERVIEW
5.1 DRIVERS
5.1.1 INCREASING CONSUMPTION OF CONSUMER ELECTRONICS
5.1.2 GROWING DEMAND FOR SEMICONDUCTORS ACROSS THE GLOBE
5.1.3 EMERGENCE OF A LARGE NUMBER OF SEMICONDUCTOR MANUFACTURING FACILITIES
5.1.4 TECHNOLOGICAL ADVANCEMENTS AND THE ADOPTION OF INNOVATIVE TECHNOLOGIES SUCH AS ARTIFICIAL INTELLIGENCE AND BLOCKCHAIN
5.1.5 GROWING ADOPTION OF IOT ACROSS THE SEMICONDUCTOR INDUSTRY
5.2 RESTRAINTS
5.2.1 HIGH COMPETITION IN THE SEMICONDUCTOR MANUFACTURING MARKET
5.2.2 HIGH R&D COST IN THE SEMICONDUCTOR EQUIPMENT MARKET
5.3 OPPORTUNITIES
5.3.1 RISE IN DIGITAL SUPPLY CHAIN ACROSS THE GLOBE
5.3.2 INTRODUCTION OF KERFLESS WAFER OVER TRADITIONAL WAFER
5.3.3 VERY HIGH GROWTH OF THE AUTOMOBILE INDUSTRY
5.4 CHALLENGES
5.4.1 DISRUPTION IN THE SUPPLY CHAIN INDUSTRY
5.4.2 ENVIRONMENTAL CONCERNS RAISED DUE TO SEMICONDUCTOR PRODUCTION
6 ASIA PACIFIC SEMICONDUCTOR MANUFACTURING EQUIPMENT MARKET, BY EQUIPMENT TYPE
6.1 OVERVIEW
6.2 FRONT END EQUIPMENT
6.2.1 LITHOGRAPHY
6.2.1.1 DUV
6.2.1.2 EUV
6.2.2 DEPOSITION
6.2.2.1 PVD
6.2.2.2 CVD
6.2.3 WAFER SURFACE CONDITIONING
6.2.3.1 ETCHING
6.2.3.2 CHEMICAL
6.2.4 CLEANING
6.2.4.1 BATCH SPRAY CLEANING SYSTEM
6.2.4.2 SINGLE-WAFER SPRAY SYSTEM
6.2.4.3 SINGLE-WAFER CRYOGENIC SYSTEM
6.2.4.4 BATCH IMMERSION CLEANING SYSTEM
6.2.4.5 SCRUBBER
6.2.5 OTHER EQUIPMENT
6.3 BACK END EQUIPMENT
6.3.1 TESTING
6.3.2 ASSEMBLY AND PACKING
6.3.3 DICING EQUIPMENT
6.3.4 BONDING EQUIPMENT
6.3.5 METROLOGY
7 ASIA PACIFIC SEMICONDUCTOR MANUFACTURING EQUIPMENT MARKET, BY DIMENSIONS
7.1 OVERVIEW
7.2 3D
7.3 2.5D
7.4 2D
8 ASIA PACIFIC SEMICONDUCTOR MANUFACTURING EQUIPMENT MARKET, BY PRODUCT TYPE
8.1 OVERVIEW
8.2 MEMORY
8.3 MEMS
8.4 FOUNDRY
8.5 ANALOG
8.6 MPU
8.7 LOGIC
8.8 DISCRETE
8.9 OTHERS
9 ASIA PACIFIC SEMICONDUCTOR MANUFACTURING EQUIPMENT MARKET, BY SUPPLY CHAIN PARTICIPANT
9.1 OVERVIEW
9.2 INTEGRATED DEVICE MANUFACTURER (IDM) FIRMS
9.3 FOUNDRY
9.4 OUTSOURCED SEMICONDUCTOR ASSEMBLY AND TEST (OSAT) COMPANIES
10 ASIA PACIFIC SEMICONDUCTOR MANUFACTURING EQUIPMENT MARKET, BY FAB FACILITY EQUIPMENT
10.1 OVERVIEW
10.2 FACTORY AUTOMATION
10.2.1 FRONT END EQUIPMENT
10.2.2 BACK END EQUIPMENT
10.3 GAS CONTROL EQUIPMENT
10.3.1 FRONT END EQUIPMENT
10.3.2 BACK END EQUIPMENT
10.4 CHEMICAL CONTROL EQUIPMENT
10.4.1 FRONT END EQUIPMENT
10.4.2 BACK END EQUIPMENT
10.5 OTHERS
11 ASIA PACIFIC SEMICONDUCTOR MANUFACTURING EQUIPMENT MARKET, BY REGION
11.1 ASIA-PACIFIC
11.1.1 CHINA
11.1.2 TAIWAN
11.1.3 JAPAN
11.1.4 SOUTH KOREA
11.1.5 SINGAPORE
11.1.6 AUSTRALIA
11.1.7 INDIA
11.1.8 THAILAND
11.1.9 MALAYSIA
11.1.10 PHILIPPINES
11.1.11 REST OF ASIA-PACIFIC
12 ASIA PACIFIC SEMICONDUCTOR MANUFACTURING EQUIPMENT MARKET: COMPANY LANDSCAPE
12.1 COMPANY SHARE ANALYSIS: ASIA PACIFIC
13 SWOT ANALYSIS
14 COMPANY PROFILE
14.1 ASML
14.1.1 COMPANY SNAPSHOT
14.1.2 REVENUE ANALYSIS
14.1.3 COMPANY SHARE ANALYSIS
14.1.4 PRODUCT PORTFOLIO
14.1.5 RECENT DEVELOPMENT
14.2 TOKYO ELECTRON LIMITED
14.2.1 COMPANY SNAPSHOT
14.2.2 REVENUE ANALYSIS
14.2.3 COMPANY SHARE ANALYSIS
14.2.4 PRODUCT PORTFOLIO
14.2.5 RECENT DEVELOPMENTS
14.3 LAM RESEARCH CORPORATION
14.3.1 COMPANY SNAPSHOT
14.3.2 REVENUE ANALYSIS
14.3.3 COMPANY SHARE ANALYSIS
14.3.4 PRODUCT PORTFOLIO
14.3.5 RECENT DEVELOPMENT
14.4 KLA CORPORATION
14.4.1 COMPANY SNAPSHOT
14.4.2 REVENUE ANALYSIS
14.4.3 COMPANY SHARE ANALYSIS
14.4.4 PRODUCT PORTFOLIO
14.4.5 RECENT DEVELOPMENT
14.5 APPLIED MATERIALS, I.N.C.
14.5.1 COMPANY SNAPSHOT
14.5.2 REVENUE ANALYSIS
14.5.3 COMPANY SHARE ANALYSIS
14.5.4 PRODUCT AND TECHNOLOGIES PORTFOLIO
14.5.5 RECENT DEVELOPMENTS
14.6 ADVANCED DICING TECHNOLOGIES
14.6.1 COMPANY SNAPSHOT
14.6.2 PRODUCT PORTFOLIO
14.6.3 RECENT DEVELOPMENTS
14.7 ADVANTEST CORPORATION
14.7.1 COMPANY SNAPSHOT
14.7.2 REVENUE ANALYSIS
14.7.3 PRODUCTS PORTFOLIO
14.7.4 RECENT DEVELOPMENTS
14.8 ASMPT
14.8.1 COMPANY SNAPSHOT
14.8.2 REVENUE ANALYSIS
14.8.3 PRODUCTS PORTFOLIO
14.8.4 RECENT DEVELOPMENTS
14.9 CANON MACHINERY INC.
14.9.1 COMPANY SNAPSHOT
14.9.2 PRODUCT PORTFOLIO
14.9.3 RECENT DEVELOPMENT
14.1 EV GROUP
14.10.1 COMPANY SNAPSHOT
14.10.2 PRODUCT PORTFOLIO
14.10.3 RECENT DEVELOPMENTS
14.11 EVATEC AG
14.11.1 COMPANY SNAPSHOT
14.11.2 PRODUCT PORTFOLIO
14.11.3 RECENT DEVELOPMENT
14.12 FORMFACTOR.
14.12.1 COMPANY SNAPSHOT
14.12.2 REVENUE ANALYSIS
14.12.3 PRODUCTS PORTFOLIO
14.12.4 RECENT DEVELOPMENTS
14.13 GIGAPHOTON INC.
14.13.1 COMPANY SNAPSHOT
14.13.2 PRODUCTS PORTFOLIO
14.13.3 RECENT DEVELOPMENTS
14.14 HITACHI HIGH-TECH CORPORATION
14.14.1 COMPANY SNAPSHOT
14.14.2 PRODUCT PORTFOLIO
14.14.3 RECENT DEVELOPMENTS
14.15 MODUTEK CORPORATION
14.15.1 COMPANY SNAPSHOT
14.15.2 PRODUCT PORTFOLIO
14.15.3 RECENT DEVELOPMENTS
14.16 NOIVION S.R.L.
14.16.1 COMPANY SNAPSHOT
14.16.2 PRODUCT PORTFOLIO
14.16.3 RECENT DEVELOPMENTS
14.17 NORDSON CORPORATION
14.17.1 COMPANY SNAPSHOT
14.17.2 REVENUE ANALYSIS
14.17.3 PRODUCT PORTFOLIO
14.17.4 RECENT DEVELOPMENTS
14.18 ONTO INNOVATION.
14.18.1 COMPANY SNAPSHOT
14.18.2 REVENUE ANALYSIS
14.18.3 PRODUCTS PORTFOLIO
14.18.4 RECENT DEVELOPMENTS
14.19 PALOMAR TECHNOLOGIES
14.19.1 COMPANY SNAPSHOT
14.19.2 PRODUCTS PORTFOLIO
14.19.3 RECENT DEVELOPMENTS
14.2 PLASMA-THERM
14.20.1 COMPANY SNAPSHOT
14.20.2 PRODUCT PORTFOLIO
14.20.3 RECENT DEVELOPMENTS
14.21 QP TECHNOLOGIES
14.21.1 COMPANY SNAPSHOT
14.21.2 SERVICE PORTFOLIO
14.21.3 RECENT DEVELOPMENT
14.22 SCREEN HOLDINGS CO., LTD.
14.22.1 COMPANY SNAPSHOT
14.22.2 REVENUE ANALYSIS
14.22.3 PRODUCTS PORTFOLIO
14.22.4 RECENT DEVELOPMENTS
14.23 SÜSS MICROTEC SE
14.23.1 COMPANY SNAPSHOT
14.23.2 REVENUE ANALYSIS
14.23.3 PRODUCT PORTFOLIO
14.23.4 RECENT DEVELOPMENTS
14.24 TERADYNE INC.
14.24.1 COMPANY SNAPSHOT
14.24.2 REVENUE ANALYSIS
14.24.3 PRODUCTS PORTFOLIO
14.24.4 RECENT DEVELOPMENTS
14.25 TOKYO SEIMITSU CO., LTD
14.25.1 COMPANY SNAPSHOT
14.25.2 REVENUE ANALYSIS
14.25.3 PRODUCTS PORTFOLIO
14.25.4 RECENT DEVELOPMENTS
14.26 UNITES SYSTEMS A.S.
14.26.1 COMPANY SNAPSHOT
14.26.2 PRODUCT PORTFOLIO
14.26.3 RECENT DEVELOPMENTS
14.27 VEECO INSTRUMENTS INC.
14.27.1 COMPANY SNAPSHOT
14.27.2 REVENUE ANALYSIS
14.27.3 PRODUCT PORTFOLIO
14.27.4 RECENT DEVELOPMENT
15 QUESTIONNAIRE
16 RELATED REPORTS
List of Table
TABLE 1 ASIA PACIFIC SEMICONDUCTOR MANUFACTURING EQUIPMENT MARKET, BY EQUIPMENT TYPE, 2021-2030 (USD MILLION)
TABLE 2 ASIA PACIFIC FRONT END EQUIPMENT IN SEMICONDUCTOR MANUFACTURING EQUIPMENT MARKET, BY REGION, 2021-2030 (USD MILLION)
TABLE 3 ASIA PACIFIC FRONT END EQUIPMENT IN SEMICONDUCTOR MANUFACTURING EQUIPMENT MARKET, BY TYPE, 2021-2030 (USD MILLION)
TABLE 4 ASIA PACIFIC LITHOGRAPHY IN SEMICONDUCTOR MANUFACTURING EQUIPMENT MARKET, BY TYPE, 2021-2030 (USD MILLION)
TABLE 5 ASIA PACIFIC DEPOSITION IN SEMICONDUCTOR MANUFACTURING EQUIPMENT MARKET, BY TYPE, 2021-2030 (USD MILLION)
TABLE 6 ASIA PACIFIC WAFER SURFACE CONDITIONING IN SEMICONDUCTOR MANUFACTURING EQUIPMENT MARKET, BY TYPE, 2021-2030 (USD MILLION)
TABLE 7 ASIA PACIFIC CLEANING IN SEMICONDUCTOR MANUFACTURING EQUIPMENT MARKET, BY INDUSTRY, 2021-2030 (USD MILLION)
TABLE 8 ASIA PACIFIC BACK END EQUIPMENT IN SEMICONDUCTOR MANUFACTURING EQUIPMENT MARKET, BY REGION, 2021-2030 (USD MILLION)
TABLE 9 ASIA PACIFIC BACK END EQUIPMENT IN SEMICONDUCTOR MANUFACTURING EQUIPMENT MARKET, BY TYPE, 2021-2030 (USD MILLION)
TABLE 10 ASIA PACIFIC SEMICONDUCTOR MANUFACTURING EQUIPMENT MARKET, BY DIMENSIONS, 2021-2030 (USD MILLION)
TABLE 11 ASIA PACIFIC 3D IN SEMICONDUCTOR MANUFACTURING EQUIPMENT MARKET, BY REGION, 2021-2030 (USD MILLION)
TABLE 12 ASIA PACIFIC 2.5D IN SEMICONDUCTOR MANUFACTURING EQUIPMENT MARKET, BY REGION, 2021-2030 (USD MILLION)
TABLE 13 ASIA PACIFIC 2D IN SEMICONDUCTOR MANUFACTURING EQUIPMENT MARKET, BY REGION, 2021-2030 (USD MILLION)
TABLE 14 ASIA PACIFIC SEMICONDUCTOR MANUFACTURING EQUIPMENT MARKET, BY PRODUCT TYPE, 2021-2030 (USD MILLION)
TABLE 15 ASIA PACIFIC MEMORY IN SEMICONDUCTOR MANUFACTURING EQUIPMENT MARKET, BY REGION, 2021-2030 (USD MILLION)
TABLE 16 ASIA PACIFIC MEMS IN SEMICONDUCTOR MANUFACTURING EQUIPMENT MARKET, BY REGION, 2021-2030 (USD MILLION)
TABLE 17 ASIA PACIFIC FOUNDRY IN SEMICONDUCTOR MANUFACTURING EQUIPMENT MARKET, BY REGION, 2021-2030 (USD MILLION)
TABLE 18 ASIA PACIFIC ANALOG IN SEMICONDUCTOR MANUFACTURING EQUIPMENT MARKET, BY REGION, 2021-2030 (USD MILLION)
TABLE 19 ASIA PACIFIC MPU IN SEMICONDUCTOR MANUFACTURING EQUIPMENT MARKET, BY REGION, 2021-2030 (USD MILLION)
TABLE 20 ASIA PACIFIC LOGIC IN SEMICONDUCTOR MANUFACTURING EQUIPMENT MARKET, BY REGION, 2021-2030 (USD MILLION)
TABLE 21 ASIA PACIFIC DISCRETE IN SEMICONDUCTOR MANUFACTURING EQUIPMENT MARKET, BY REGION, 2021-2030 (USD MILLION)
TABLE 22 ASIA PACIFIC OTHERS IN SEMICONDUCTOR MANUFACTURING EQUIPMENT MARKET, BY REGION, 2021-2030 (USD MILLION)
TABLE 23 ASIA PACIFIC SEMICONDUCTOR MANUFACTURING EQUIPMENT MARKET, BY SUPPLY CHAIN PARTICIPANT, 2021-2030 (USD MILLION)
TABLE 24 ASIA PACIFIC INTEGRATED DEVICE MANUFACTURER (IDM) FIRMS IN SEMICONDUCTOR MANUFACTURING EQUIPMENT MARKET, BY REGION, 2021-2030 (USD MILLION)
TABLE 25 ASIA PACIFIC FOUNDRY IN SEMICONDUCTOR MANUFACTURING EQUIPMENT MARKET, BY REGION, 2021-2030 (USD MILLION)
TABLE 26 ASIA PACIFIC OUTSOURCED SEMICONDUCTOR ASSEMBLY AND TEST (OSAT) COMPANIES IN SEMICONDUCTOR MANUFACTURING EQUIPMENT MARKET, BY REGION, 2021-2030 (USD MILLION)
TABLE 27 ASIA PACIFIC SEMICONDUCTOR MANUFACTURING EQUIPMENT MARKET, BY FAB FACILITY EQUIPMENT, 2021-2030 (USD MILLION)
TABLE 28 ASIA PACIFIC FACTORY AUTOMATION IN SEMICONDUCTOR MANUFACTURING EQUIPMENT MARKET, BY REGION, 2021-2030 (USD MILLION)
TABLE 29 ASIA PACIFIC FACTORY AUTOMATION IN SEMICONDUCTOR MANUFACTURING EQUIPMENT MARKET, BY EQUIPMENT TYPE, 2021-2030 (USD MILLION)
TABLE 30 ASIA PACIFIC GAS CONTROL EQUIPMENT IN SEMICONDUCTOR MANUFACTURING EQUIPMENT MARKET, BY REGION, 2021-2030 (USD MILLION)
TABLE 31 ASIA PACIFIC GAS CONTROL EQUIPMENT IN SEMICONDUCTOR MANUFACTURING EQUIPMENT MARKET, BY EQUIPMENT TYPE, 2021-2030 (USD MILLION)
TABLE 32 ASIA PACIFIC CHEMICAL CONTROL EQUIPMENT IN SEMICONDUCTOR MANUFACTURING EQUIPMENT MARKET, BY REGION, 2021-2030 (USD MILLION)
TABLE 33 ASIA PACIFIC CHEMICAL CONTROL EQUIPMENT IN SEMICONDUCTOR MANUFACTURING EQUIPMENT MARKET, BY EQUIPMENT TYPE, 2021-2030 (USD MILLION)
TABLE 34 ASIA PACIFIC OTHERS IN SEMICONDUCTOR MANUFACTURING EQUIPMENT MARKET, BY REGION, 2021-2030 (USD MILLION)
TABLE 35 ASIA-PACIFIC SEMICONDUCTOR MANUFACTURING EQUIPMENT MARKET, BY COUNTRY, 2021-2030 (USD MILLION)
TABLE 36 ASIA-PACIFIC SEMICONDUCTOR MANUFACTURING EQUIPMENT MARKET, BY EQUIPMENT TYPE, 2021-2030 (USD MILLION)
TABLE 37 ASIA-PACIFIC FRONT END EQUIPMENT IN SEMICONDUCTOR MANUFACTURING EQUIPMENT MARKET, BY TYPE, 2021-2030 (USD MILLION)
TABLE 38 ASIA-PACIFIC LITHOGRAPHY IN SEMICONDUCTOR MANUFACTURING EQUIPMENT MARKET, BY TYPE, 2021-2030 (USD MILLION)
TABLE 39 ASIA-PACIFIC DEPOSITION IN SEMICONDUCTOR MANUFACTURING EQUIPMENT MARKET, BY TYPE, 2021-2030 (USD MILLION)
TABLE 40 ASIA-PACIFIC WAFER SURFACE CONDITIONING IN SEMICONDUCTOR MANUFACTURING EQUIPMENT MARKET, BY TYPE, 2021-2030 (USD MILLION)
TABLE 41 ASIA-PACIFIC CLEANING IN SEMICONDUCTOR MANUFACTURING EQUIPMENT MARKET, BY INDUSTRY, 2021-2030 (USD MILLION)
TABLE 42 ASIA-PACIFIC BACK END EQUIPMENT IN SEMICONDUCTOR MANUFACTURING EQUIPMENT MARKET, BY TYPE, 2021-2030 (USD MILLION)
TABLE 43 ASIA-PACIFIC SEMICONDUCTOR MANUFACTURING EQUIPMENT MARKET, BY DIMENSIONS, 2021-2030 (USD MILLION)
TABLE 44 ASIA-PACIFIC SEMICONDUCTOR MANUFACTURING EQUIPMENT MARKET, BY PRODUCT TYPE, 2021-2030 (USD MILLION)
TABLE 45 ASIA-PACIFIC SEMICONDUCTOR MANUFACTURING EQUIPMENT MARKET, BY SUPPLY CHAIN PARTICIPANT, 2021-2030 (USD MILLION)
TABLE 46 ASIA-PACIFIC SEMICONDUCTOR MANUFACTURING EQUIPMENT MARKET, BY FAB FACILITY EQUIPMENT, 2021-2030 (USD MILLION)
TABLE 47 ASIA-PACIFIC FACTORY AUTOMATION IN SEMICONDUCTOR MANUFACTURING EQUIPMENT MARKET, BY EQUIPMENT TYPE, 2021-2030 (USD MILLION)
TABLE 48 ASIA-PACIFIC GAS CONTROL EQUIPMENT IN SEMICONDUCTOR MANUFACTURING EQUIPMENT MARKET, BY EQUIPMENT TYPE, 2021-2030 (USD MILLION)
TABLE 49 ASIA-PACIFIC CHEMICAL CONTROL EQUIPMENT IN SEMICONDUCTOR MANUFACTURING EQUIPMENT MARKET, BY EQUIPMENT TYPE, 2021-2030 (USD MILLION)
TABLE 50 CHINA SEMICONDUCTOR MANUFACTURING EQUIPMENT MARKET, BY EQUIPMENT TYPE, 2021-2030 (USD MILLION)
TABLE 51 CHINA FRONT END EQUIPMENT IN SEMICONDUCTOR MANUFACTURING EQUIPMENT MARKET, BY TYPE, 2021-2030 (USD MILLION)
TABLE 52 CHINA LITHOGRAPHY IN SEMICONDUCTOR MANUFACTURING EQUIPMENT MARKET, BY TYPE, 2021-2030 (USD MILLION)
TABLE 53 CHINA DEPOSITION IN SEMICONDUCTOR MANUFACTURING EQUIPMENT MARKET, BY TYPE, 2021-2030 (USD MILLION)
TABLE 54 CHINA WAFER SURFACE CONDITIONING IN SEMICONDUCTOR MANUFACTURING EQUIPMENT MARKET, BY TYPE, 2021-2030 (USD MILLION)
TABLE 55 CHINA CLEANING IN SEMICONDUCTOR MANUFACTURING EQUIPMENT MARKET, BY INDUSTRY, 2021-2030 (USD MILLION)
TABLE 56 CHINA BACK END EQUIPMENT IN SEMICONDUCTOR MANUFACTURING EQUIPMENT MARKET, BY TYPE, 2021-2030 (USD MILLION)
TABLE 57 CHINA SEMICONDUCTOR MANUFACTURING EQUIPMENT MARKET, BY DIMENSIONS, 2021-2030 (USD MILLION)
TABLE 58 CHINA SEMICONDUCTOR MANUFACTURING EQUIPMENT MARKET, BY PRODUCT TYPE, 2021-2030 (USD MILLION)
TABLE 59 CHINA SEMICONDUCTOR MANUFACTURING EQUIPMENT MARKET, BY SUPPLY CHAIN PARTICIPANT, 2021-2030 (USD MILLION)
TABLE 60 CHINA SEMICONDUCTOR MANUFACTURING EQUIPMENT MARKET, BY FAB FACILITY EQUIPMENT, 2021-2030 (USD MILLION)
TABLE 61 CHINA FACTORY AUTOMATION IN SEMICONDUCTOR MANUFACTURING EQUIPMENT MARKET, BY EQUIPMENT TYPE, 2021-2030 (USD MILLION)
TABLE 62 CHINA GAS CONTROL EQUIPMENT IN SEMICONDUCTOR MANUFACTURING EQUIPMENT MARKET, BY EQUIPMENT TYPE, 2021-2030 (USD MILLION)
TABLE 63 CHINA CHEMICAL CONTROL EQUIPMENT IN SEMICONDUCTOR MANUFACTURING EQUIPMENT MARKET, BY EQUIPMENT TYPE, 2021-2030 (USD MILLION)
TABLE 64 TAIWAN SEMICONDUCTOR MANUFACTURING EQUIPMENT MARKET, BY EQUIPMENT TYPE, 2021-2030 (USD MILLION)
TABLE 65 TAIWAN FRONT END EQUIPMENT IN SEMICONDUCTOR MANUFACTURING EQUIPMENT MARKET, BY TYPE, 2021-2030 (USD MILLION)
TABLE 66 TAIWAN LITHOGRAPHY IN SEMICONDUCTOR MANUFACTURING EQUIPMENT MARKET, BY TYPE, 2021-2030 (USD MILLION)
TABLE 67 TAIWAN DEPOSITION IN SEMICONDUCTOR MANUFACTURING EQUIPMENT MARKET, BY TYPE, 2021-2030 (USD MILLION)
TABLE 68 TAIWAN WAFER SURFACE CONDITIONING IN SEMICONDUCTOR MANUFACTURING EQUIPMENT MARKET, BY TYPE, 2021-2030 (USD MILLION)
TABLE 69 TAIWAN CLEANING IN SEMICONDUCTOR MANUFACTURING EQUIPMENT MARKET, BY INDUSTRY, 2021-2030 (USD MILLION)
TABLE 70 TAIWAN BACK END EQUIPMENT IN SEMICONDUCTOR MANUFACTURING EQUIPMENT MARKET, BY TYPE, 2021-2030 (USD MILLION)
TABLE 71 TAIWAN SEMICONDUCTOR MANUFACTURING EQUIPMENT MARKET, BY DIMENSIONS, 2021-2030 (USD MILLION)
TABLE 72 TAIWAN SEMICONDUCTOR MANUFACTURING EQUIPMENT MARKET, BY PRODUCT TYPE, 2021-2030 (USD MILLION)
TABLE 73 TAIWAN SEMICONDUCTOR MANUFACTURING EQUIPMENT MARKET, BY SUPPLY CHAIN PARTICIPANT, 2021-2030 (USD MILLION)
TABLE 74 TAIWAN SEMICONDUCTOR MANUFACTURING EQUIPMENT MARKET, BY FAB FACILITY EQUIPMENT, 2021-2030 (USD MILLION)
TABLE 75 TAIWAN FACTORY AUTOMATION IN SEMICONDUCTOR MANUFACTURING EQUIPMENT MARKET, BY EQUIPMENT TYPE, 2021-2030 (USD MILLION)
TABLE 76 TAIWAN GAS CONTROL EQUIPMENT IN SEMICONDUCTOR MANUFACTURING EQUIPMENT MARKET, BY EQUIPMENT TYPE, 2021-2030 (USD MILLION)
TABLE 77 TAIWAN CHEMICAL CONTROL EQUIPMENT IN SEMICONDUCTOR MANUFACTURING EQUIPMENT MARKET, BY EQUIPMENT TYPE, 2021-2030 (USD MILLION)
TABLE 78 JAPAN SEMICONDUCTOR MANUFACTURING EQUIPMENT MARKET, BY EQUIPMENT TYPE, 2021-2030 (USD MILLION)
TABLE 79 JAPAN FRONT END EQUIPMENT IN SEMICONDUCTOR MANUFACTURING EQUIPMENT MARKET, BY TYPE, 2021-2030 (USD MILLION)
TABLE 80 JAPAN LITHOGRAPHY IN SEMICONDUCTOR MANUFACTURING EQUIPMENT MARKET, BY TYPE, 2021-2030 (USD MILLION)
TABLE 81 JAPAN DEPOSITION IN SEMICONDUCTOR MANUFACTURING EQUIPMENT MARKET, BY TYPE, 2021-2030 (USD MILLION)
TABLE 82 JAPAN WAFER SURFACE CONDITIONING IN SEMICONDUCTOR MANUFACTURING EQUIPMENT MARKET, BY TYPE, 2021-2030 (USD MILLION)
TABLE 83 JAPAN CLEANING IN SEMICONDUCTOR MANUFACTURING EQUIPMENT MARKET, BY INDUSTRY, 2021-2030 (USD MILLION)
TABLE 84 JAPAN BACK END EQUIPMENT IN SEMICONDUCTOR MANUFACTURING EQUIPMENT MARKET, BY TYPE, 2021-2030 (USD MILLION)
TABLE 85 JAPAN SEMICONDUCTOR MANUFACTURING EQUIPMENT MARKET, BY DIMENSIONS, 2021-2030 (USD MILLION)
TABLE 86 JAPAN SEMICONDUCTOR MANUFACTURING EQUIPMENT MARKET, BY PRODUCT TYPE, 2021-2030 (USD MILLION)
TABLE 87 JAPAN SEMICONDUCTOR MANUFACTURING EQUIPMENT MARKET, BY SUPPLY CHAIN PARTICIPANT, 2021-2030 (USD MILLION)
TABLE 88 JAPAN SEMICONDUCTOR MANUFACTURING EQUIPMENT MARKET, BY FAB FACILITY EQUIPMENT, 2021-2030 (USD MILLION)
TABLE 89 JAPAN FACTORY AUTOMATION IN SEMICONDUCTOR MANUFACTURING EQUIPMENT MARKET, BY EQUIPMENT TYPE, 2021-2030 (USD MILLION)
TABLE 90 JAPAN GAS CONTROL EQUIPMENT IN SEMICONDUCTOR MANUFACTURING EQUIPMENT MARKET, BY EQUIPMENT TYPE, 2021-2030 (USD MILLION)
TABLE 91 JAPAN CHEMICAL CONTROL EQUIPMENT IN SEMICONDUCTOR MANUFACTURING EQUIPMENT MARKET, BY EQUIPMENT TYPE, 2021-2030 (USD MILLION)
TABLE 92 SOUTH KOREA SEMICONDUCTOR MANUFACTURING EQUIPMENT MARKET, BY EQUIPMENT TYPE, 2021-2030 (USD MILLION)
TABLE 93 SOUTH KOREA FRONT END EQUIPMENT IN SEMICONDUCTOR MANUFACTURING EQUIPMENT MARKET, BY TYPE, 2021-2030 (USD MILLION)
TABLE 94 SOUTH KOREA LITHOGRAPHY IN SEMICONDUCTOR MANUFACTURING EQUIPMENT MARKET, BY TYPE, 2021-2030 (USD MILLION)
TABLE 95 SOUTH KOREA DEPOSITION IN SEMICONDUCTOR MANUFACTURING EQUIPMENT MARKET, BY TYPE, 2021-2030 (USD MILLION)
TABLE 96 SOUTH KOREA WAFER SURFACE CONDITIONING IN SEMICONDUCTOR MANUFACTURING EQUIPMENT MARKET, BY TYPE, 2021-2030 (USD MILLION)
TABLE 97 SOUTH KOREA CLEANING IN SEMICONDUCTOR MANUFACTURING EQUIPMENT MARKET, BY INDUSTRY, 2021-2030 (USD MILLION)
TABLE 98 SOUTH KOREA BACK END EQUIPMENT IN SEMICONDUCTOR MANUFACTURING EQUIPMENT MARKET, BY TYPE, 2021-2030 (USD MILLION)
TABLE 99 SOUTH KOREA SEMICONDUCTOR MANUFACTURING EQUIPMENT MARKET, BY DIMENSIONS, 2021-2030 (USD MILLION)
TABLE 100 SOUTH KOREA SEMICONDUCTOR MANUFACTURING EQUIPMENT MARKET, BY PRODUCT TYPE, 2021-2030 (USD MILLION)
TABLE 101 SOUTH KOREA SEMICONDUCTOR MANUFACTURING EQUIPMENT MARKET, BY SUPPLY CHAIN PARTICIPANT, 2021-2030 (USD MILLION)
TABLE 102 SOUTH KOREA SEMICONDUCTOR MANUFACTURING EQUIPMENT MARKET, BY FAB FACILITY EQUIPMENT, 2021-2030 (USD MILLION)
TABLE 103 SOUTH KOREA FACTORY AUTOMATION IN SEMICONDUCTOR MANUFACTURING EQUIPMENT MARKET, BY EQUIPMENT TYPE, 2021-2030 (USD MILLION)
TABLE 104 SOUTH KOREA GAS CONTROL EQUIPMENT IN SEMICONDUCTOR MANUFACTURING EQUIPMENT MARKET, BY EQUIPMENT TYPE, 2021-2030 (USD MILLION)
TABLE 105 SOUTH KOREA CHEMICAL CONTROL EQUIPMENT IN SEMICONDUCTOR MANUFACTURING EQUIPMENT MARKET, BY EQUIPMENT TYPE, 2021-2030 (USD MILLION)
TABLE 106 SINGAPORE SEMICONDUCTOR MANUFACTURING EQUIPMENT MARKET, BY EQUIPMENT TYPE, 2021-2030 (USD MILLION)
TABLE 107 SINGAPORE FRONT END EQUIPMENT IN SEMICONDUCTOR MANUFACTURING EQUIPMENT MARKET, BY TYPE, 2021-2030 (USD MILLION)
TABLE 108 SINGAPORE LITHOGRAPHY IN SEMICONDUCTOR MANUFACTURING EQUIPMENT MARKET, BY TYPE, 2021-2030 (USD MILLION)
TABLE 109 SINGAPORE DEPOSITION IN SEMICONDUCTOR MANUFACTURING EQUIPMENT MARKET, BY TYPE, 2021-2030 (USD MILLION)
TABLE 110 SINGAPORE WAFER SURFACE CONDITIONING IN SEMICONDUCTOR MANUFACTURING EQUIPMENT MARKET, BY TYPE, 2021-2030 (USD MILLION)
TABLE 111 SINGAPORE CLEANING IN SEMICONDUCTOR MANUFACTURING EQUIPMENT MARKET, BY INDUSTRY, 2021-2030 (USD MILLION)
TABLE 112 SINGAPORE BACK END EQUIPMENT IN SEMICONDUCTOR MANUFACTURING EQUIPMENT MARKET, BY TYPE, 2021-2030 (USD MILLION)
TABLE 113 SINGAPORE SEMICONDUCTOR MANUFACTURING EQUIPMENT MARKET, BY DIMENSIONS, 2021-2030 (USD MILLION)
TABLE 114 SINGAPORE SEMICONDUCTOR MANUFACTURING EQUIPMENT MARKET, BY PRODUCT TYPE, 2021-2030 (USD MILLION)
TABLE 115 SINGAPORE SEMICONDUCTOR MANUFACTURING EQUIPMENT MARKET, BY SUPPLY CHAIN PARTICIPANT, 2021-2030 (USD MILLION)
TABLE 116 SINGAPORE SEMICONDUCTOR MANUFACTURING EQUIPMENT MARKET, BY FAB FACILITY EQUIPMENT, 2021-2030 (USD MILLION)
TABLE 117 SINGAPORE FACTORY AUTOMATION IN SEMICONDUCTOR MANUFACTURING EQUIPMENT MARKET, BY EQUIPMENT TYPE, 2021-2030 (USD MILLION)
TABLE 118 SINGAPORE GAS CONTROL EQUIPMENT IN SEMICONDUCTOR MANUFACTURING EQUIPMENT MARKET, BY EQUIPMENT TYPE, 2021-2030 (USD MILLION)
TABLE 119 SINGAPORE CHEMICAL CONTROL EQUIPMENT IN SEMICONDUCTOR MANUFACTURING EQUIPMENT MARKET, BY EQUIPMENT TYPE, 2021-2030 (USD MILLION)
TABLE 120 AUSTRALIA SEMICONDUCTOR MANUFACTURING EQUIPMENT MARKET, BY EQUIPMENT TYPE, 2021-2030 (USD MILLION)
TABLE 121 AUSTRALIA FRONT END EQUIPMENT IN SEMICONDUCTOR MANUFACTURING EQUIPMENT MARKET, BY TYPE, 2021-2030 (USD MILLION)
TABLE 122 AUSTRALIA LITHOGRAPHY IN SEMICONDUCTOR MANUFACTURING EQUIPMENT MARKET, BY TYPE, 2021-2030 (USD MILLION)
TABLE 123 AUSTRALIA DEPOSITION IN SEMICONDUCTOR MANUFACTURING EQUIPMENT MARKET, BY TYPE, 2021-2030 (USD MILLION)
TABLE 124 AUSTRALIA WAFER SURFACE CONDITIONING IN SEMICONDUCTOR MANUFACTURING EQUIPMENT MARKET, BY TYPE, 2021-2030 (USD MILLION)
TABLE 125 AUSTRALIA CLEANING IN SEMICONDUCTOR MANUFACTURING EQUIPMENT MARKET, BY INDUSTRY, 2021-2030 (USD MILLION)
TABLE 126 AUSTRALIA BACK END EQUIPMENT IN SEMICONDUCTOR MANUFACTURING EQUIPMENT MARKET, BY TYPE, 2021-2030 (USD MILLION)
TABLE 127 AUSTRALIA SEMICONDUCTOR MANUFACTURING EQUIPMENT MARKET, BY DIMENSIONS, 2021-2030 (USD MILLION)
TABLE 128 AUSTRALIA SEMICONDUCTOR MANUFACTURING EQUIPMENT MARKET, BY PRODUCT TYPE, 2021-2030 (USD MILLION)
TABLE 129 AUSTRALIA SEMICONDUCTOR MANUFACTURING EQUIPMENT MARKET, BY SUPPLY CHAIN PARTICIPANT, 2021-2030 (USD MILLION)
TABLE 130 AUSTRALIA SEMICONDUCTOR MANUFACTURING EQUIPMENT MARKET, BY FAB FACILITY EQUIPMENT, 2021-2030 (USD MILLION)
TABLE 131 AUSTRALIA FACTORY AUTOMATION IN SEMICONDUCTOR MANUFACTURING EQUIPMENT MARKET, BY EQUIPMENT TYPE, 2021-2030 (USD MILLION)
TABLE 132 AUSTRALIA GAS CONTROL EQUIPMENT IN SEMICONDUCTOR MANUFACTURING EQUIPMENT MARKET, BY EQUIPMENT TYPE, 2021-2030 (USD MILLION)
TABLE 133 AUSTRALIA CHEMICAL CONTROL EQUIPMENT IN SEMICONDUCTOR MANUFACTURING EQUIPMENT MARKET, BY EQUIPMENT TYPE, 2021-2030 (USD MILLION)
TABLE 134 INDIA SEMICONDUCTOR MANUFACTURING EQUIPMENT MARKET, BY EQUIPMENT TYPE, 2021-2030 (USD MILLION)
TABLE 135 INDIA FRONT END EQUIPMENT IN SEMICONDUCTOR MANUFACTURING EQUIPMENT MARKET, BY TYPE, 2021-2030 (USD MILLION)
TABLE 136 INDIA LITHOGRAPHY IN SEMICONDUCTOR MANUFACTURING EQUIPMENT MARKET, BY TYPE, 2021-2030 (USD MILLION)
TABLE 137 INDIA DEPOSITION IN SEMICONDUCTOR MANUFACTURING EQUIPMENT MARKET, BY TYPE, 2021-2030 (USD MILLION)
TABLE 138 INDIA WAFER SURFACE CONDITIONING IN SEMICONDUCTOR MANUFACTURING EQUIPMENT MARKET, BY TYPE, 2021-2030 (USD MILLION)
TABLE 139 INDIA CLEANING IN SEMICONDUCTOR MANUFACTURING EQUIPMENT MARKET, BY INDUSTRY, 2021-2030 (USD MILLION)
TABLE 140 INDIA BACK END EQUIPMENT IN SEMICONDUCTOR MANUFACTURING EQUIPMENT MARKET, BY TYPE, 2021-2030 (USD MILLION)
TABLE 141 INDIA SEMICONDUCTOR MANUFACTURING EQUIPMENT MARKET, BY DIMENSIONS, 2021-2030 (USD MILLION)
TABLE 142 INDIA SEMICONDUCTOR MANUFACTURING EQUIPMENT MARKET, BY PRODUCT TYPE, 2021-2030 (USD MILLION)
TABLE 143 INDIA SEMICONDUCTOR MANUFACTURING EQUIPMENT MARKET, BY SUPPLY CHAIN PARTICIPANT, 2021-2030 (USD MILLION)
TABLE 144 INDIA SEMICONDUCTOR MANUFACTURING EQUIPMENT MARKET, BY FAB FACILITY EQUIPMENT, 2021-2030 (USD MILLION)
TABLE 145 INDIA FACTORY AUTOMATION IN SEMICONDUCTOR MANUFACTURING EQUIPMENT MARKET, BY EQUIPMENT TYPE, 2021-2030 (USD MILLION)
TABLE 146 INDIA GAS CONTROL EQUIPMENT IN SEMICONDUCTOR MANUFACTURING EQUIPMENT MARKET, BY EQUIPMENT TYPE, 2021-2030 (USD MILLION)
TABLE 147 INDIA CHEMICAL CONTROL EQUIPMENT IN SEMICONDUCTOR MANUFACTURING EQUIPMENT MARKET, BY EQUIPMENT TYPE, 2021-2030 (USD MILLION)
TABLE 148 THAILAND SEMICONDUCTOR MANUFACTURING EQUIPMENT MARKET, BY EQUIPMENT TYPE, 2021-2030 (USD MILLION)
TABLE 149 THAILAND FRONT END EQUIPMENT IN SEMICONDUCTOR MANUFACTURING EQUIPMENT MARKET, BY TYPE, 2021-2030 (USD MILLION)
TABLE 150 THAILAND LITHOGRAPHY IN SEMICONDUCTOR MANUFACTURING EQUIPMENT MARKET, BY TYPE, 2021-2030 (USD MILLION)
TABLE 151 THAILAND DEPOSITION IN SEMICONDUCTOR MANUFACTURING EQUIPMENT MARKET, BY TYPE, 2021-2030 (USD MILLION)
TABLE 152 THAILAND WAFER SURFACE CONDITIONING IN SEMICONDUCTOR MANUFACTURING EQUIPMENT MARKET, BY TYPE, 2021-2030 (USD MILLION)
TABLE 153 THAILAND CLEANING IN SEMICONDUCTOR MANUFACTURING EQUIPMENT MARKET, BY INDUSTRY, 2021-2030 (USD MILLION)
TABLE 154 THAILAND BACK END EQUIPMENT IN SEMICONDUCTOR MANUFACTURING EQUIPMENT MARKET, BY TYPE, 2021-2030 (USD MILLION)
TABLE 155 THAILAND SEMICONDUCTOR MANUFACTURING EQUIPMENT MARKET, BY DIMENSIONS, 2021-2030 (USD MILLION)
TABLE 156 THAILAND SEMICONDUCTOR MANUFACTURING EQUIPMENT MARKET, BY PRODUCT TYPE, 2021-2030 (USD MILLION)
TABLE 157 THAILAND SEMICONDUCTOR MANUFACTURING EQUIPMENT MARKET, BY SUPPLY CHAIN PARTICIPANT, 2021-2030 (USD MILLION)
TABLE 158 THAILAND SEMICONDUCTOR MANUFACTURING EQUIPMENT MARKET, BY FAB FACILITY EQUIPMENT, 2021-2030 (USD MILLION)
TABLE 159 THAILAND FACTORY AUTOMATION IN SEMICONDUCTOR MANUFACTURING EQUIPMENT MARKET, BY EQUIPMENT TYPE, 2021-2030 (USD MILLION)
TABLE 160 THAILAND GAS CONTROL EQUIPMENT IN SEMICONDUCTOR MANUFACTURING EQUIPMENT MARKET, BY EQUIPMENT TYPE, 2021-2030 (USD MILLION)
TABLE 161 THAILAND CHEMICAL CONTROL EQUIPMENT IN SEMICONDUCTOR MANUFACTURING EQUIPMENT MARKET, BY EQUIPMENT TYPE, 2021-2030 (USD MILLION)
TABLE 162 MALAYSIA SEMICONDUCTOR MANUFACTURING EQUIPMENT MARKET, BY EQUIPMENT TYPE, 2021-2030 (USD MILLION)
TABLE 163 MALAYSIA FRONT END EQUIPMENT IN SEMICONDUCTOR MANUFACTURING EQUIPMENT MARKET, BY TYPE, 2021-2030 (USD MILLION)
TABLE 164 MALAYSIA LITHOGRAPHY IN SEMICONDUCTOR MANUFACTURING EQUIPMENT MARKET, BY TYPE, 2021-2030 (USD MILLION)
TABLE 165 MALAYSIA DEPOSITION IN SEMICONDUCTOR MANUFACTURING EQUIPMENT MARKET, BY TYPE, 2021-2030 (USD MILLION)
TABLE 166 MALAYSIA WAFER SURFACE CONDITIONING IN SEMICONDUCTOR MANUFACTURING EQUIPMENT MARKET, BY TYPE, 2021-2030 (USD MILLION)
TABLE 167 MALAYSIA CLEANING IN SEMICONDUCTOR MANUFACTURING EQUIPMENT MARKET, BY INDUSTRY, 2021-2030 (USD MILLION)
TABLE 168 MALAYSIA BACK END EQUIPMENT IN SEMICONDUCTOR MANUFACTURING EQUIPMENT MARKET, BY TYPE, 2021-2030 (USD MILLION)
TABLE 169 MALAYSIA SEMICONDUCTOR MANUFACTURING EQUIPMENT MARKET, BY DIMENSIONS, 2021-2030 (USD MILLION)
TABLE 170 MALAYSIA SEMICONDUCTOR MANUFACTURING EQUIPMENT MARKET, BY PRODUCT TYPE, 2021-2030 (USD MILLION)
TABLE 171 MALAYSIA SEMICONDUCTOR MANUFACTURING EQUIPMENT MARKET, BY SUPPLY CHAIN PARTICIPANT, 2021-2030 (USD MILLION)
TABLE 172 MALAYSIA SEMICONDUCTOR MANUFACTURING EQUIPMENT MARKET, BY FAB FACILITY EQUIPMENT, 2021-2030 (USD MILLION)
TABLE 173 MALAYSIA FACTORY AUTOMATION IN SEMICONDUCTOR MANUFACTURING EQUIPMENT MARKET, BY EQUIPMENT TYPE, 2021-2030 (USD MILLION)
TABLE 174 MALAYSIA GAS CONTROL EQUIPMENT IN SEMICONDUCTOR MANUFACTURING EQUIPMENT MARKET, BY EQUIPMENT TYPE, 2021-2030 (USD MILLION)
TABLE 175 MALAYSIA CHEMICAL CONTROL EQUIPMENT IN SEMICONDUCTOR MANUFACTURING EQUIPMENT MARKET, BY EQUIPMENT TYPE, 2021-2030 (USD MILLION)
TABLE 176 PHILIPPINES SEMICONDUCTOR MANUFACTURING EQUIPMENT MARKET, BY EQUIPMENT TYPE, 2021-2030 (USD MILLION)
TABLE 177 PHILIPPINES FRONT END EQUIPMENT IN SEMICONDUCTOR MANUFACTURING EQUIPMENT MARKET, BY TYPE, 2021-2030 (USD MILLION)
TABLE 178 PHILIPPINES LITHOGRAPHY IN SEMICONDUCTOR MANUFACTURING EQUIPMENT MARKET, BY TYPE, 2021-2030 (USD MILLION)
TABLE 179 PHILIPPINES DEPOSITION IN SEMICONDUCTOR MANUFACTURING EQUIPMENT MARKET, BY TYPE, 2021-2030 (USD MILLION)
TABLE 180 PHILIPPINES WAFER SURFACE CONDITIONING IN SEMICONDUCTOR MANUFACTURING EQUIPMENT MARKET, BY TYPE, 2021-2030 (USD MILLION)
TABLE 181 PHILIPPINES CLEANING IN SEMICONDUCTOR MANUFACTURING EQUIPMENT MARKET, BY INDUSTRY, 2021-2030 (USD MILLION)
TABLE 182 PHILIPPINES BACK END EQUIPMENT IN SEMICONDUCTOR MANUFACTURING EQUIPMENT MARKET, BY TYPE, 2021-2030 (USD MILLION)
TABLE 183 PHILIPPINES SEMICONDUCTOR MANUFACTURING EQUIPMENT MARKET, BY DIMENSIONS, 2021-2030 (USD MILLION)
TABLE 184 PHILIPPINES SEMICONDUCTOR MANUFACTURING EQUIPMENT MARKET, BY PRODUCT TYPE, 2021-2030 (USD MILLION)
TABLE 185 PHILIPPINES SEMICONDUCTOR MANUFACTURING EQUIPMENT MARKET, BY SUPPLY CHAIN PARTICIPANT, 2021-2030 (USD MILLION)
TABLE 186 PHILIPPINES SEMICONDUCTOR MANUFACTURING EQUIPMENT MARKET, BY FAB FACILITY EQUIPMENT, 2021-2030 (USD MILLION)
TABLE 187 PHILIPPINES FACTORY AUTOMATION IN SEMICONDUCTOR MANUFACTURING EQUIPMENT MARKET, BY EQUIPMENT TYPE, 2021-2030 (USD MILLION)
TABLE 188 PHILIPPINES GAS CONTROL EQUIPMENT IN SEMICONDUCTOR MANUFACTURING EQUIPMENT MARKET, BY EQUIPMENT TYPE, 2021-2030 (USD MILLION)
TABLE 189 PHILIPPINES CHEMICAL CONTROL EQUIPMENT IN SEMICONDUCTOR MANUFACTURING EQUIPMENT MARKET, BY EQUIPMENT TYPE, 2021-2030 (USD MILLION)
TABLE 190 REST OF ASIA-PACIFIC SEMICONDUCTOR MANUFACTURING EQUIPMENT MARKET, BY EQUIPMENT TYPE, 2021-2030 (USD MILLION)
List of Figure
FIGURE 1 ASIA PACIFIC SEMICONDUCTOR MANUFACTURING EQUIPMENT MARKET: SEGMENTATION
FIGURE 2 ASIA PACIFIC SEMICONDUCTOR MANUFACTURING EQUIPMENT MARKET: DATA TRIANGULATION
FIGURE 3 ASIA PACIFIC SEMICONDUCTOR MANUFACTURING EQUIPMENT MARKET: DROC ANALYSIS
FIGURE 4 ASIA PACIFIC SEMICONDUCTOR MANUFACTURING EQUIPMENT MARKET: ASIA PACIFIC VS REGIONAL MARKET ANALYSIS
FIGURE 5 ASIA PACIFIC SEMICONDUCTOR MANUFACTURING EQUIPMENT MARKET: COMPANY RESEARCH ANALYSIS
FIGURE 6 ASIA PACIFIC SEMICONDUCTOR MANUFACTURING EQUIPMENT MARKET: INTERVIEW DEMOGRAPHICS
FIGURE 7 ASIA PACIFIC SEMICONDUCTOR MANUFACTURING EQUIPMENT MARKET :DBMR MARKET POSITION GRID
FIGURE 8 ASIA PACIFIC SEMICONDUCTOR MANUFACTURING EQUIPMENT MARKET: VENDOR SHARE ANALYSIS
FIGURE 9 ASIA PACIFIC SEMICONDUCTOR MANUFACTURING EQUIPMENT MARKET: SEGMENTATION
FIGURE 10 GROWING DEMAND FOR SEMICONDUCTOR ACROSS THE GLOBE IS BOOSTING THE GROWTH OF THE SEMICONDUCTOR MANUFACTURING EQUIPMENT MARKET IN THE FORECAST PERIOD OF 2023 -2030
FIGURE 11 EQUIPMENT TYPE SEGMENT IS EXPECTED TO ACCOUNT FOR THE LARGEST SHARE OF THE ASIA PACIFIC SEMICONDUCTOR MANUFACTURING EQUIPMENT MARKET IN 2023 - 2030
FIGURE 12 DRIVERS, RESTRAINTS, OPPORTUNITIES, AND CHALLENGES OF ASIA PACIFIC SEMICONDUCTOR MANUFACTURING EQUIPMENT MARKET
FIGURE 13 DESKTOP VS MOBILE VS TABLET MARKET SHARE WORLDWIDE, APRIL 2020
FIGURE 14 ASIA PACIFIC SEMICONDUCTOR MANUFACTURING EQUIPMENT MARKET: BY EQUIPMENT TYPE, 2022
FIGURE 15 ASIA PACIFIC SEMICONDUCTOR MANUFACTURING EQUIPMENT MARKET: BY DIMENSIONS, 2022
FIGURE 16 ASIA PACIFIC SEMICONDUCTOR MANUFACTURING EQUIPMENT MARKET: BY PRODUCT TYPE, 2022
FIGURE 17 ASIA PACIFIC SEMICONDUCTOR MANUFACTURING EQUIPMENT MARKET: BY SUPPLY CHAIN PARTICIPANT, 2022
FIGURE 18 ASIA PACIFIC SEMICONDUCTOR MANUFACTURING EQUIPMENT MARKET: BY FAB FACILITY EQUIPMENT, 2022
FIGURE 19 ASIA-PACIFIC SEMICONDUCTOR MANUFACTURING EQUIPMENT MARKET: SNAPSHOT (2022)
FIGURE 20 ASIA-PACIFIC SEMICONDUCTOR MANUFACTURING EQUIPMENT MARKET: BY COUNTRY (2022)
FIGURE 21 ASIA-PACIFIC SEMICONDUCTOR MANUFACTURING EQUIPMENT MARKET: BY COUNTRY (2023 & 2030)
FIGURE 22 ASIA-PACIFIC SEMICONDUCTOR MANUFACTURING EQUIPMENT MARKET: BY COUNTRY (2022 & 2030)
FIGURE 23 ASIA-PACIFIC SEMICONDUCTOR MANUFACTURING EQUIPMENT MARKET: BY EQUIPMENT TYPE (2023-2030)
FIGURE 24 ASIA PACIFIC SEMICONDUCTOR MANUFACTURING EQUIPMENT MARKET: COMPANY SHARE 2022 (%)
Asia Pacific Semiconductor Manufacturing Equipment Market, Supply Chain Analysis and Ecosystem Framework
To support market growth and help clients navigate the impact of geopolitical shifts, DBMR has integrated in-depth supply chain analysis into its Asia Pacific Semiconductor Manufacturing Equipment Market research reports. This addition empowers clients to respond effectively to global changes affecting their industries. The supply chain analysis section includes detailed insights such as Asia Pacific Semiconductor Manufacturing Equipment Market consumption and production by country, price trend analysis, the impact of tariffs and geopolitical developments, and import and export trends by country and HSN code. It also highlights major suppliers with data on production capacity and company profiles, as well as key importers and exporters. In addition to research, DBMR offers specialized supply chain consulting services backed by over a decade of experience, providing solutions like supplier discovery, supplier risk assessment, price trend analysis, impact evaluation of inflation and trade route changes, and comprehensive market trend analysis.
Data collection and base year analysis are done using data collection modules with large sample sizes. The stage includes obtaining market information or related data through various sources and strategies. It includes examining and planning all the data acquired from the past in advance. It likewise envelops the examination of information inconsistencies seen across different information sources. The market data is analysed and estimated using market statistical and coherent models. Also, market share analysis and key trend analysis are the major success factors in the market report. To know more, please request an analyst call or drop down your inquiry.
The key research methodology used by DBMR research team is data triangulation which involves data mining, analysis of the impact of data variables on the market and primary (industry expert) validation. Data models include Vendor Positioning Grid, Market Time Line Analysis, Market Overview and Guide, Company Positioning Grid, Patent Analysis, Pricing Analysis, Company Market Share Analysis, Standards of Measurement, Global versus Regional and Vendor Share Analysis. To know more about the research methodology, drop in an inquiry to speak to our industry experts.
Data Bridge Market Research is a leader in advanced formative research. We take pride in servicing our existing and new customers with data and analysis that match and suits their goal. The report can be customized to include price trend analysis of target brands understanding the market for additional countries (ask for the list of countries), clinical trial results data, literature review, refurbished market and product base analysis. Market analysis of target competitors can be analyzed from technology-based analysis to market portfolio strategies. We can add as many competitors that you require data about in the format and data style you are looking for. Our team of analysts can also provide you data in crude raw excel files pivot tables (Fact book) or can assist you in creating presentations from the data sets available in the report.


