
Europe Agriculture Nets Market Analysis and Insights
The Europe agriculture nets market is fragmented in nature, as it consists of many players such as, Garware Technical Fibres Limited, and Thrace Group. The presence of these companies produce best agriculture nets products for various applications to farmers and other users at regional and international level. These manufacturers and suppliers of agriculture nets offer products for all budget range with various characteristics.
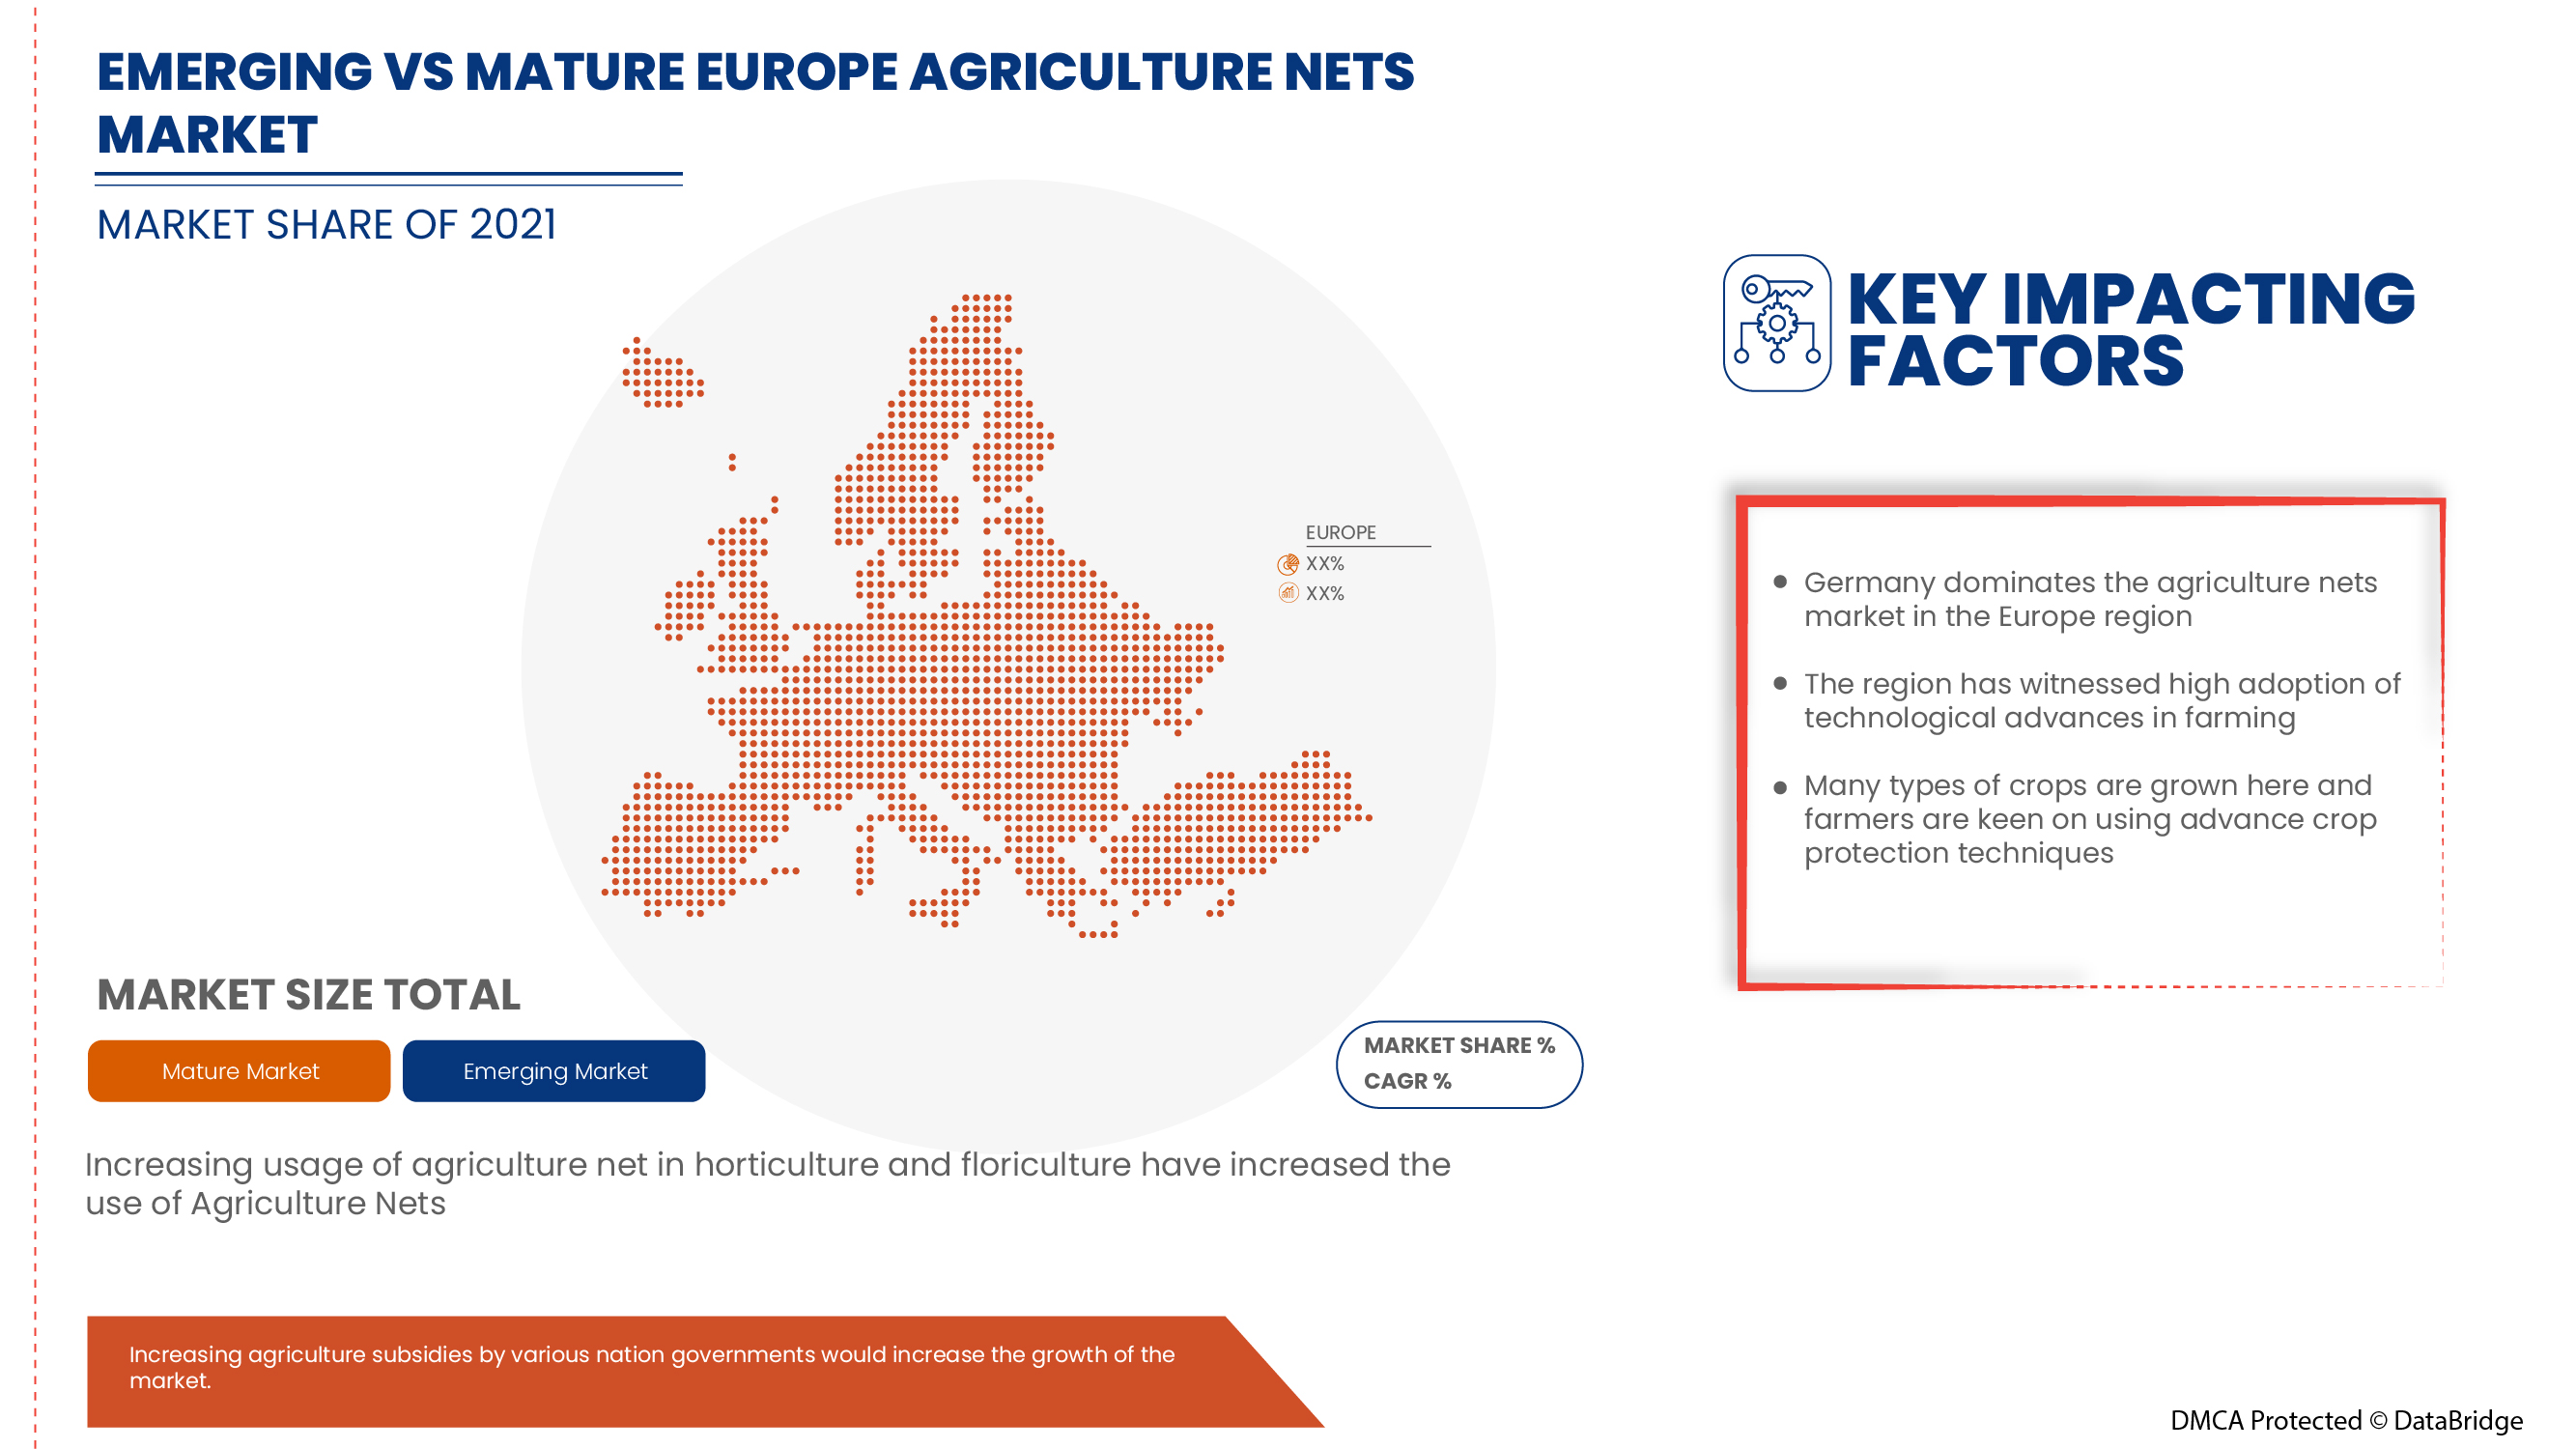
Growing initiatives for food security across the region and increasing usage of agriculture net in horticulture and floriculture is driving the Europe agriculture nets market as these nets enable the farmers to produce more farm output. However, increasing agriculture plastic pollution and environmental concerns regarding use of plastic agriculture nets is expected to act as a restraint for the market growth. But, the increasing agriculture subsidies by various nation governments and increasing practice of terrace or rooftop agriculture is expected to provide an opportunity to widen the application and use of agriculture nets.
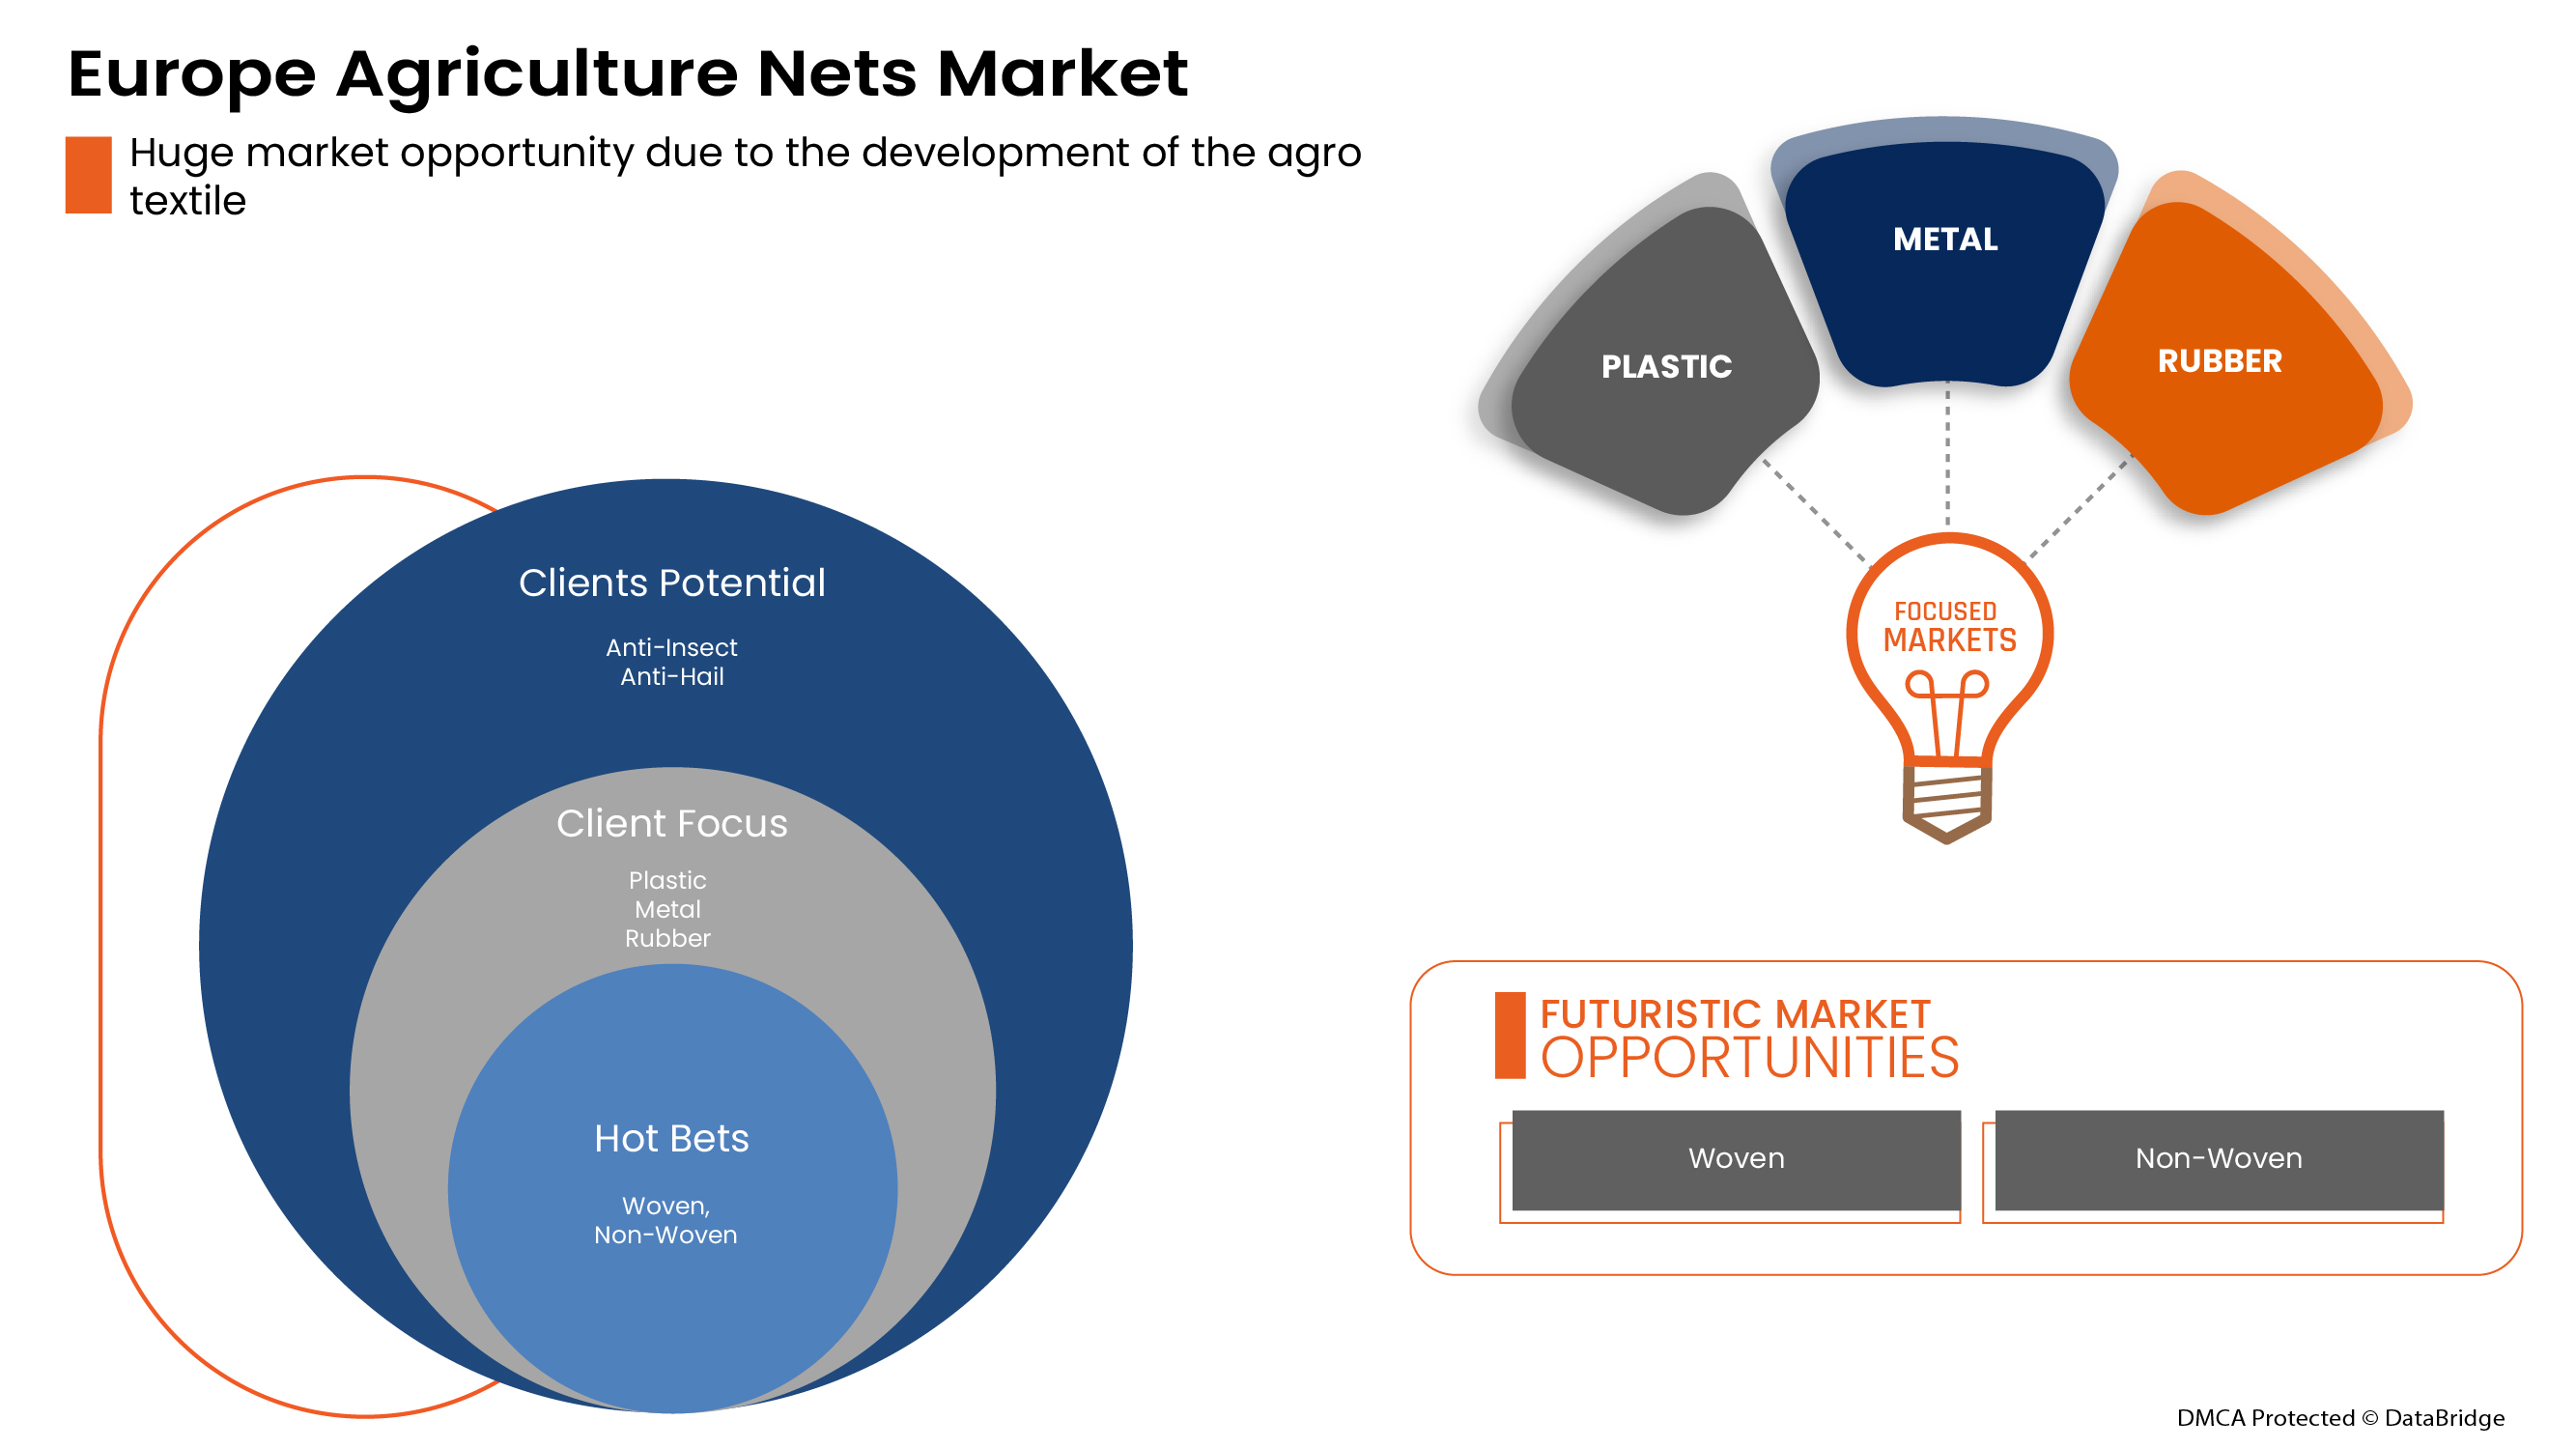
Moreover, the development of the agro textile and increasing usage of agriculture nets in other applications such as forestry is expected to boost the Europe agriculture nets market growth in future.
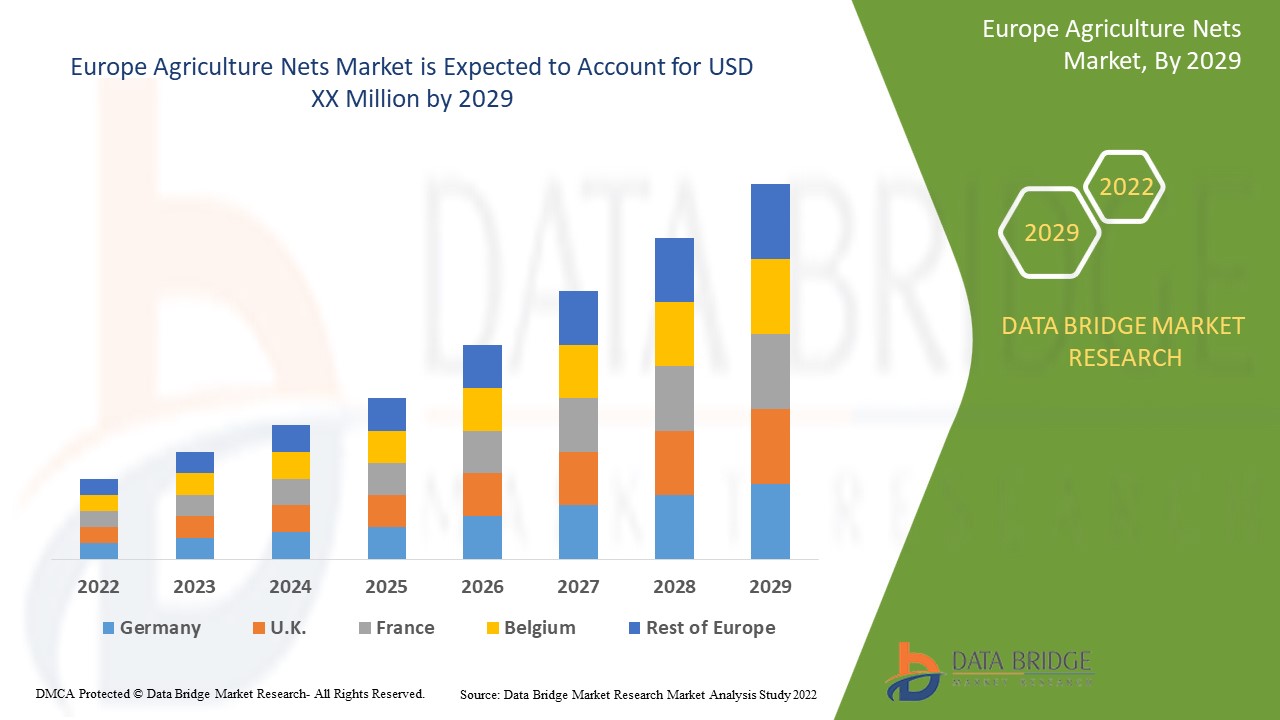
Data Bridge Market Research analyzes that the Europe agriculture nets market will grow at a CAGR of 6.5% during the forecast period of 2022 to 2029.
|
Report Metric |
Details |
|
Forecast Period |
2022 to 2029 |
|
Base Year |
2021 |
|
Historic Years |
2020 (Customizable to 2019 - 2015) |
|
Quantitative Units |
Revenue in USD Million, Pricing in USD |
|
Segments Covered |
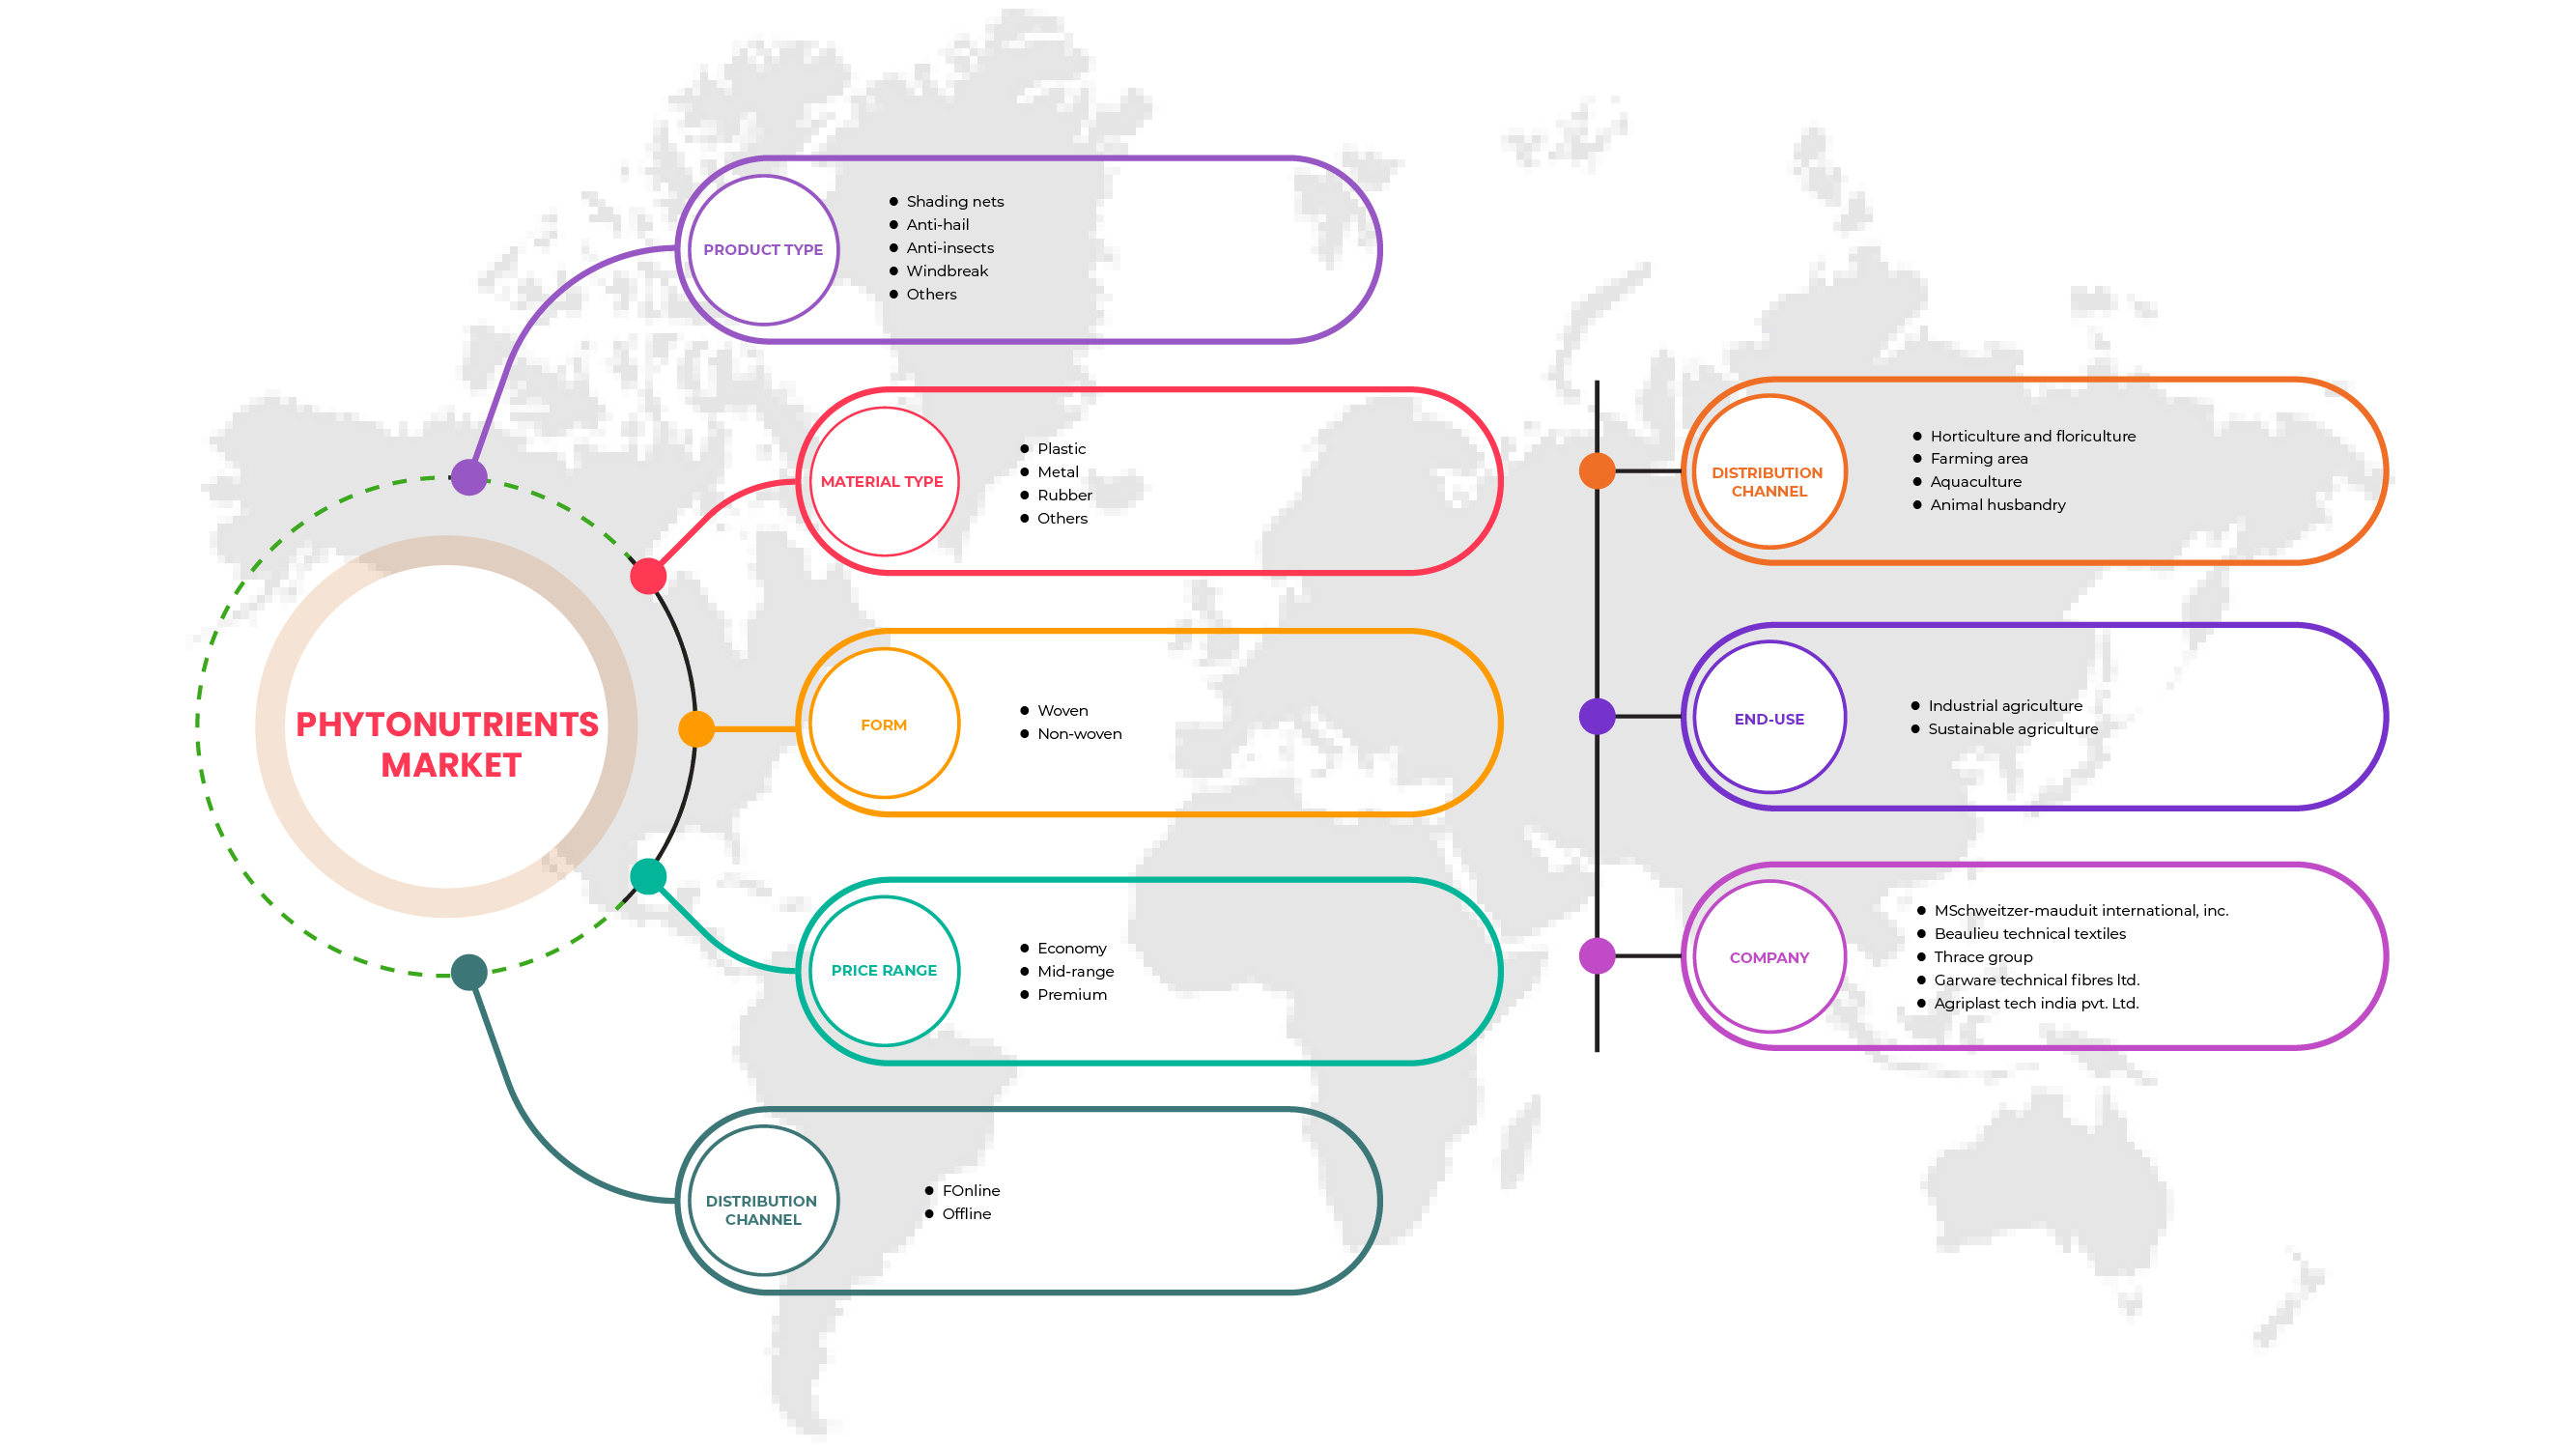
By Product Type (Shading Nets, Anti-Hail, Anti-Insects, Windbreak and Others), Material Type (Plastic, Rubber, Metal and Others), Form (Woven and Non-Woven), Price Range (Economy, Mid-Range and Premium), Distribution Channel (Offline and Online), Application (Horticulture and Floriculture, Farming Area, Animal Husbandry and Aquaculture), End Use (Industrial Agriculture and Sustainable Agriculture) |
|
Countries Covered |
U.K., Germany, France, Spain, Italy, Netherlands, Luxembourg, Switzerland, Russia, Belgium, Turkey, and rest of Europe |
|
Market Players Covered |
Belton Industries., Smart Net Systems Ltd., Diatex, Garware Technical Fibres Limited, Thrace Group, Inc., Agriplast Tech India Pvt. Ltd., Schweitzer-Mauduit International, Inc., wellcoindustries, Alphatex, Cittadini S.p.A, Zhongshan Hongjun Nonwovens Co. Ltd., Beaulieu Technical Textiles |
Market Definition
Agriculture nets are made of materials such as rubber, metals, fabrics or high-density polyethylene, also known as HDPE. The agriculture nets are majorly used in the farming industry to protect plants from solar radiations, UV rays, and harsh weather conditions. Major advantages provided by agriculture nets are protection from UV rays and ability to create micro-environment for the crops. They are used in the non-woven and woven form. Apart from agriculture, these nets are also used in floriculture, horticulture, and animal husbandry. They have widespread application in household and commercial sectors for construction of provisional fences, car parking, fishing nets, window sheds, and scaffolding. Length and width of the nets vary from 1 m to 20 m and 25 m to 300 m depending on application. Increasing applications of these nets in agriculture and allied sectors and in other sectors such as construction, household is boosting the Europe agriculture nets market.
Europe Agriculture Nets Market Dynamics
Drivers
- Increasing usage of agriculture net in horticulture and floriculture
The agriculture nets are becoming more useful and important in horticulture as they provide shade for the crops and prevent crops from excessive heat. The anti-hail nets also help to prevent crops from hails and improve the micro-environments that can boost the productivity and yield of the cultivation. The agriculture nets are used in horticulture and floriculture sectors for many applications and functions such as radiation scattering, photo-selectivity. The horticulture segment productivity is highly dependent on the shadings and nets used in the practice, making agriculture nets one of the essential components in the practice.
Thus, with the increasing practices of horticulture and floriculture across the region, the demand of agriculture nets is increasing rapidly which is acting as a driver for the growth of the Europe agriculture nets market.
- Growing initiatives for food security across the globe
In present times, the Europe region governments have been trying to increase their national food self-efficiency and food security by various initiatives since green revolution. Additionally, in past few decades with the increasing population and growing food demands, various nations have increased their focus on national food security. This has acted as the driving factor for the Europe agriculture nets market, as these initiatives focus on increasing the agriculture production and ways through which local farmers can achieve it, thus as a result the demand for agriculture nets has increased.
Opportunity
- Increasing practice of terrace or rooftop agriculture
Rooftop agriculture practices are increasing rapidly especially in the urban areas as people are using blank space of roof for producing fresh vegetables, herbs, fruits, edible flowers. Productive green roofs combine food production with ecological sustainability, such as reduced rainwater run-off, provide temperature benefits such as potential reduction of heating and cooling requirements (resulting in reduced emissions), improved aesthetic value and air quality. The increasing practice of terrace agriculture has resulted in rise of demands in shading nets, anti-insect nets and wind break nets across Europe, providing a growth opportunity for the Europe agriculture nets market.
Restraint/Challenge
- Environmental concerns regarding use of agriculture nets
The agriculture nets are used in the agriculture, horticulture, aquaculture, and animal husbandry for various applications. Agriculture nets are used to protect cultivated crops from birds, insects, little animals, and other factors such as UV radiations and harsh weather conditions. The materials that these agriculture nets are made up of are mainly plastic, rubber, and metals. As the plastic nets are less costly with respect to other materials, they are produced on mass scale. The sustainability of plastic nets is causing environmental concerns as bio based plastic nets are easily biodegradable but conventional plastic nets such as High-Density Polyethylene (HDPE), Polyethylene (PE), and polyvinyl chloride are not eco-friendly. Thus, the non-ecofriendly feature of agriculture nets may hamper the market's growth.
Post-COVID-19 Impact on Europe Agriculture Nets Market
The COVID-19 pandemic has affected the Europe agriculture nets market significantly. The persistence of COVID-19 for a longer period has affected the supply chain as it got disrupted, and it became difficult to supply the raw products to the manufacturers, initially decreasing the production rate of agriculture nets. However, post-COVID-19, the demand for agriculture nets has increased significantly owing to increased awareness about the agriculture nets benefits and the rise of horticulture and floriculture sectors. Consumers are trying to use the nets to boost yields and produce profit from the agriculture and allied sectors. Thus, post-COVID-19 the Europe agriculture nets market is expected to bloom due to increasing initiatives for food security across the region and increasing usage of agriculture nets in other applications.
Recent Development
- In May 2022, Schweitzer-Mauduit International, Inc. and Neenah, Inc. announced a partnership under which both companies will form a team for future developments. This step intends to use both companies' potential to produce technical products in the textile industry. The company aims to offer new, technically advanced products in the Europe agriculture nets market with this partnership
Europe Agriculture Nets Market Scope
The Europe agriculture nets market is segmented on the basis of product type, material type, form, price range, distribution channel, application, and end use. The growth amongst these segments will help you analyze major growth segments in the industries and provide the users with a valuable market overview and market insights to make strategic decisions to identify core market applications.
Product Type
- Shading Nets
- Anti-Hail
- Anti-Insects
- Windbreak
- Others
On the basis of product type, the Europe agriculture nets market is segmented into shading nets, anti-hail, anti-insects, windbreak and others.
Material Type
- Plastic
- Metal
- Rubber
- Others
On the basis of material type, the Europe agriculture nets market is segmented into plastic, rubber, metal and others.
Form
- Woven
- Non-Woven
On the basis of form, the Europe agriculture nets market is segmented into woven and non-woven.
Price Range
- Economy
- Mid-Range
- Premium
On the basis of price range, the Europe agriculture nets market is segmented into economy, mid-range and premium.
Distribution Channel
- Online
- Offline
On the basis of distribution channel, the Europe agriculture nets market is segmented into offline and online.
Application
- Horticulture And Floriculture
- Farming Area
- Animal Husbandry
- Aquaculture
On the basis of application, the Europe agriculture nets market is segmented into horticulture and floriculture, farming area, animal husbandry and aquaculture.
End Use
- Industrial Agriculture
- Sustainable Agriculture
on the basis of end use, the Europe agriculture nets market is segmented into industrial agriculture and sustainable agriculture.
Europe Agriculture Nets Market Regional Analysis/Insights
The Europe agriculture nets market is analyzed and market size insights and trends are provided by country, product type, material type, form, price range, distribution channel, application and end use as referenced above.
The countries covered in the Europe agriculture nets market report are U.K., Germany, France, Spain, Italy, Netherlands, Luxembourg, Switzerland, Russia, Belgium, Turkey, and rest of Europe.
Germany is expected to dominate the Europe agriculture nets market regarding market share and revenue. It is estimated to maintain its dominance during the forecast period due to the rising trend of horticulture and floriculture.
The region section of the report also provides individual market impacting factors and changes in regulations in the market that impact the current and future trends of the market. Data points, such as new and replacement sales, country demographics, disease epidemiology, and import-export tariffs, are some of the major pointers used to forecast the market scenario for individual countries. In addition, the presence and availability of Europe brands and their challenges faced due to high competition from local and domestic brands and the impact of sales channels are considered while providing forecast analysis of the country data.
Competitive Landscape and Europe Agriculture Nets Market Share Analysis
The Europe agriculture nets market competitive landscape details the competitors. Details include company overview, company financials, revenue generated, market potential, investment in research and development, new market initiatives, Europe presence, production sites and facilities, production capacities, company strengths and weaknesses, product launch, product width and breadth, and application dominance. The above data points are only related to the companies' focus on Europe agriculture nets market.
Some of the major players operating in the Europe agriculture nets market are Belton Industries., Smart Net Systems Ltd., Diatex, Garware Technical Fibres Limited, Thrace Group, U.S. Netting, Inc., Fiberwebindia Ltd., Schweitzer-Mauduit International, Inc., Alphatex, Cittadini S.p.A, Zhongshan Hongjun Nonwovens Co. Ltd., Beaulieu Technical Textiles among others.
Research Methodology
Data collection and base year analysis are done using data collection modules with large sample sizes. The market data is analyzed and estimated using market statistical and coherent models. In addition, market share analysis and key trend analysis are the major success factors in the market report. The key research methodology used by the DBMR research team is data triangulation which involves data mining, analysis of the impact of data variables on the market, and primary (industry expert) validation. Apart from this, data models include Vendor Positioning grids, Market Time Line Analysis, Market Overview and Guide, Company Positioning grids, Company Market Share Analysis, Standards of Measurement, Global Vs Regional, and Vendor Share Analysis. Please request an analyst call in case of further inquiry.
SKU-

- Interactive Data Analysis Dashboard
- Company Analysis Dashboard for high growth potential opportunities
- Research Analyst Access for customization & queries
- Competitor Analysis with Interactive dashboard
- Latest News, Updates & Trend analysis
- Harness the Power of Benchmark Analysis for Comprehensive Competitor Tracking
Table of Content
1 INTRODUCTION
1.1 OBJECTIVES OF THE STUDY
1.2 MARKET DEFINITION
1.3 OVERVIEW OF THE EUROPE AGRICULTURE NETS MARKET
1.4 CURRENCY AND PRICING
1.5 LIMITATIONS
1.6 MARKETS COVERED
2 MARKET SEGMENTATION
2.1 MARKETS COVERED
2.2 YEARS CONSIDERED FOR THE STUDY
2.3 GEOGRAPHIC SCOPE
2.4 DBMR TRIPOD DATA VALIDATION MODEL
2.5 PRIMARY INTERVIEWS WITH KEY OPINION LEADERS
2.6 DBMR MARKET POSITION GRID
2.7 VENDOR SHARE ANALYSIS
2.8 MARKET END-USER COVERAGE GRID
2.9 MULTIVARIATE MODELLING
2.1 PRODUCT TYPE CURVE
2.11 CHALLENGE MATRIX
2.12 SECONDARY SOURCES
2.13 ASSUMPTIONS
3 EXECUTIVE SUMMARY
4 PREMIUM INSIGHTS
4.1 PRODUCTION-CONSUMPTION ANALYSIS
4.2 IMPORT EXPORT SCENARIO
4.3 PRICE TREND ANALYSIS
4.4 RAW MATERIAL PRODUCTION COVERAGE
4.5 TECHNOLOGICAL ADVANCEMENT BY MANUFACTURERS
4.6 LIST OF KEY BUYERS
4.7 PORTER’S FIVE FORCE ANALYSIS
4.8 VENDOR SELECTION CRITERIA
4.9 PESTEL ANALYSIS
4.1 REGULATIONS COVERAGE
5 SUPPLY CHAIN ANALYSIS
5.1 OVERVIEW
5.2 LOGISTIC COST SCENARIO
5.3 IMPORTANCE OF LOGISTIC SERVICE PROVIDERS
6 MARKET OVERVIEW
6.1 DRIVERS
6.1.1 GROWING INITIATIVES FOR FOOD SECURITY ACROSS GLOBE
6.1.2 RISING DEMAND FOR AGRICULTURE NETS DUE TO INCREASING INTEREST IN GARDENING
6.1.3 USE OF AGRICULTURE NETS IN AQUACULTURE AND ANIMAL HUSBANDRY
6.1.4 INCREASING USAGE OF AGRICULTURE NET IN HORTICULTURE AND FLORICULTURE
6.2 RESTRAINTS
6.2.1 LESS LIFE SPAN OF NETS
6.2.2 ENVIRONMENTAL CONCERNS REGARDING THE USE OF AGRICULTURE NETS
6.2.3 INCREASING AGRICULTURE PLASTIC POLLUTION
6.3 OPPORTUNITIES
6.3.1 THE DEVELOPMENT OF THE AGRO TEXTILE
6.3.2 EUROPELY INCREASING PRACTICE OF TERRACE OR ROOFTOP AGRICULTURE
6.3.3 INCREASING USAGE OF AGRICULTURE NETS IN OTHER APPLICATIONS
6.3.4 INCREASING AGRICULTURE SUBSIDIES BY VARIOUS NATION GOVERNMENTS
6.4 CHALLENGES
6.4.1 THE VARYING COSTS OF THE RAW MATERIALS USED IN AGRO-TEXTILE
6.4.2 GEOGRAPHICAL SHORTCOMING OF AGRICULTURE NETS
7 EUROPE AGRICULTURE NETS MARKET, BY PRODUCT TYPE
7.1 OVERVIEW
7.2 SHADING NETS
7.3 WINDBREAK
7.4 ANTI-INSECT
7.5 ANTI-HAIL
7.6 OTHERS
8 EUROPE AGRICULTURE NETS MARKET, BY MATERIAL TYPE
8.1 OVERVIEW
8.2 PLASTIC
8.3 METAL
8.4 RUBBER
8.5 OTHERS
9 EUROPE AGRICULTURE NETS MARKET, BY PRICE RANGE
9.1 OVERVIEW
9.2 ECONOMY
9.3 MID-RANGE
9.4 PREMIUM
10 EUROPE AGRICULTURE NETS MARKET, BY FORM
10.1 OVERVIEW
10.2 WOVEN
10.3 NON-WOVEN
11 EUROPE AGRICULTURE NETS MARKET, BY DISTRIBUTION CHANNEL
11.1 OVERVIEW
11.2 OFFLINE
11.3 ONLINE
12 EUROPE AGRICULTURE NETS MARKET , BY APPLICATION
12.1 OVERVIEW
12.2 HORTICULTURE AND FLORICULTURE
12.3 FARMING AREA
12.4 AQUACULTURE
12.5 ANIMAL HUSBANDRY
13 EUROPE AGRICULTURE NETS MARKET, BY END USE
13.1 OVERVIEW
13.1.1 INDUSTRIAL AGRICULTURE
13.1.1.1 SHADING NETS
13.1.1.2 WINDBREAK
13.1.1.3 ANTI-INSECTS
13.1.1.4 ANTI-HAIL
13.1.1.5 OTHERS
13.1.2 SUSTAINABLE AGRICULTURE
13.1.2.1 SHADING NETS
13.1.2.2 WINDBREAK
13.1.2.3 ANTI-INSECTS
13.1.2.4 ANTI-HAIL
13.1.2.5 OTHERS
14 EUROPE AGRICULTURE NETS MARKET, BY REGION
14.1 EUROPE
14.1.1 GERMANY
14.1.2 U.K.
14.1.3 SPAIN
14.1.4 NETHERLANDS
14.1.5 FRANCE
14.1.6 ITALY
14.1.7 TURKEY
14.1.8 LUXEMBOURG
14.1.9 BELGIUM
14.1.10 RUSSIA
14.1.11 SWITZERLAND
14.1.12 REST OF EUROPE
15 EUROPE AGRICULTURE NETS MARKET: COMPANY LANDSCAPE
15.1 COMPANY SHARE ANALYSIS: EUROPE
16 SWOT ANALYSIS
17 COMPANY PROFILE
17.1 SCHWEITZER-MAUDUIT INTERNATIONAL, INC. (2021)
17.1.1 COMPANY SNAPSHOT
17.1.2 REVENUE ANALYSIS
17.1.3 PRODUCT PORTFOLIO
17.1.4 RECENT DEVELOPMENTS
17.2 BEAULIEU TECHNICAL TEXTILES
17.2.1 COMPANY SNAPSHOT
17.2.2 PRODUCT PORTFOLIO
17.2.3 RECENT DEVELOPMENT
17.3 THRACE GROUP
17.3.1 COMPANY SNAPSHOT
17.3.2 REVENUE ANALYSIS
17.3.3 PRODUCT PORTFOLIO
17.3.4 RECENT DEVELOPMENTS
17.4 GARWARE TECHNICAL FIBRES LIMITED (2021)
17.4.1 COMPANY SNAPSHOT
17.4.2 REVENUE ANALYSIS
17.4.3 PRODUCT PORTFOLIO
17.4.4 RECENT DEVELOPMENT
17.5 AGRIPLAST TECH INDIA PVT. L.T.D.
17.5.1 COMPANY SNAPSHOT
17.5.2 PRODUCT PORTFOLIO
17.5.3 RECENT DEVELOPMENTS
17.6 ALPHATEX
17.6.1 COMPANY SNAPSHOT
17.6.2 PRODUCT PORTFOLIO
17.6.3 RECENT DEVELOPMENTS
17.7 B&V AGRO IRRIGATION CO.
17.7.1 COMPANY SNAPSHOT
17.7.2 PRODUCT PORTFOLIO
17.7.3 RECENT DEVELOPMENTS
17.8 BELTON INDUSTRIES.
17.8.1 COMPANY SNAPSHOT
17.8.2 PRODUCT PORTFOLIO
17.8.3 RECENT DEVELOPMENTS
17.9 CITTADINI S.P.A
17.9.1 COMPANY SNAPSHOT
17.9.2 PRODUCT PORTFOLIO
17.9.3 RECENT DEVELOPMENTS
17.1 DIATEX
17.10.1 COMPANY SNAPSHOT
17.10.2 PRODUCT PORTFOLIO
17.10.3 RECENT DEVELOPMENT
17.11 FIBERWEBINDIA LTD. (2021)
17.11.1 COMPANY SNAPSHOT
17.11.2 REVENUE ANALYSIS
17.11.3 PRODUCT PORTFOLIO
17.11.4 RECENT DEVELOPMENTS
17.12 NETKING
17.12.1 COMPANY SNAPSHOT
17.12.2 PRODUCT PORTFOLIO
17.12.3 RECENT DEVELOPMENT
17.13 SHAKTI POLYWEAVE PVT. LTD
17.13.1 COMPANY SNAPSHOT
17.13.2 PRODUCT PORTFOLIO
17.13.3 RECENT DEVELOPMENT
17.14 SHREE TARPAULIN INDUSTRIES
17.14.1 COMPANY SNAPSHOT
17.14.2 PRODUCT PORTFOLIO
17.14.3 RECENT DEVELOPMENT
17.15 SMART NET SYSTEMS LTD.
17.15.1 COMPANY SNAPSHOT
17.15.2 PRODUCT PORTFOLIO
17.15.3 RECENT DEVELOPMENT
17.16 SUNSAFE AGROTEXTILES PVT. L.T.D.
17.16.1 COMPANY SNAPSHOT
17.16.2 PRODUCT PORTFOLIO
17.16.3 RECENT DEVELOPMENTS
17.17 TUFLEX INDIA.
17.17.1 COMPANY SNAPSHOT
17.17.2 PRODUCT PORTFOLIO
17.17.3 RECENT DEVELOPMENT
17.18 U.S. NETTING, I.N.C.
17.18.1 COMPANY SNAPSHOT
17.18.2 PRODUCT PORTFOLIO
17.18.3 RECENT DEVELOPMENTS
17.19 WELLCOINDUSTRIES
17.19.1 COMPANY SNAPSHOT
17.19.2 PRODUCT PORTFOLIO
17.19.3 RECENT DEVELOPMENT
17.2 ZHONGSHAN HONGJUN NONWOVENS CO., LTD.
17.20.1 COMPANY SNAPSHOT
17.20.2 PRODUCT PORTFOLIO
17.20.3 RECENT DEVELOPMENT
18 QUESTIONNAIRE
19 RELATED REPORTS
List of Table
TABLE 1 DIFFERENT TYPES OF AGRO-TEXTILE PRODUCTS WITH CONSTITUENT FIBER
TABLE 2 COST VARIATION AS PER MATERIAL USED
TABLE 3 SET OF ITALIAN STANDARD REGARDING AGRICULTURAL NETS
TABLE 4 CLASSIFICATION OF AGRO-TEXTILES PRODUCT WITH THE FABRIC TYPE
TABLE 5 ROOFTOP FARMS ACROSS THE GLOBE
TABLE 6 INSTANCES OF SUITABLE PLANTS FOR DIFFERENT ROOFTOP AGRICULTURE SYSTEMS
TABLE 7 LIGHT SCATTERING UNDER COLORED SHADE NETS COMPARED WITH NO NET
TABLE 8 EUROPE AGRICULTURE NETS MARKET, BY PRODUCT TYPE, 2020-2029 (USD THOUSAND)
TABLE 9 EUROPE SHADING NETS IN AGRICULTURE NETS MARKET, BY REGION, 2020-2029 (USD THOUSAND)
TABLE 10 EUROPE WINDBREAK IN AGRICULTURE NETS MARKET, BY REGION, 2020-2029 (USD THOUSAND)
TABLE 11 EUROPE ANTI-INSECT IN AGRICULTURE NETS MARKET, BY REGION, 2020-2029 (USD THOUSAND)
TABLE 12 EUROPE ANTI-HAIL IN AGRICULTURE NETS MARKET, BY REGION, 2020-2029 (USD THOUSAND)
TABLE 13 EUROPE OTHERS IN AGRICULTURE NETS MARKET, BY REGION, 2020-2029 (USD THOUSAND)
TABLE 14 EUROPE AGRICULTURE NETS MARKET, BY MATERIAL TYPE, 2020-2029 (USD THOUSAND)
TABLE 15 EUROPE PLASTIC IN AGRICULTURE NETS MARKET, BY REGION, 2020-2029 (USD THOUSAND)
TABLE 16 EUROPE METAL IN AGRICULTURE NETS MARKET, BY REGION, 2020-2029 (USD THOUSAND)
TABLE 17 EUROPE RUBBER IN AGRICULTURE NETS MARKET, BY REGION, 2020-2029 (USD THOUSAND)
TABLE 18 EUROPE OTHERS IN AGRICULTURE NETS MARKET, BY REGION, 2020-2029 (USD THOUSAND)
TABLE 19 EUROPE AGRICULTURE NETS MARKET, BY PRICE RANGE, 2020-2029 (USD THOUSAND)
TABLE 20 EUROPE ECONOMY IN AGRICULTURE NETS MARKET, BY REGION, 2020-2029 (USD THOUSAND)
TABLE 21 EUROPE MID-RANGE IN AGRICULTURE NETS MARKET, BY REGION, 2020-2029 (USD THOUSAND)
TABLE 22 EUROPE PREMIUM IN AGRICULTURE NETS MARKET, BY REGION, 2020-2029 (USD THOUSAND)
TABLE 23 EUROPE AGRICULTURE NETS MARKET, BY FORM, 2020-2029 (USD THOUSAND)
TABLE 24 EUROPE WOVEN IN AGRICULTURE NETS MARKET, BY REGION, 2020-2029 (USD THOUSAND)
TABLE 25 EUROPE NON-WOVEN IN AGRICULTURE NETS MARKET, BY REGION, 2020-2029 (USD THOUSAND)
TABLE 26 EUROPE AGRICULTURE NETS MARKET, BY DISTRIBUTION CHANNEL, 2020-2029 (USD THOUSAND)
TABLE 27 EUROPE OFFLINE IN AGRICULTURE NETS MARKET, BY REGION, 2020-2029 (USD THOUSAND)
TABLE 28 EUROPE ONLINE IN AGRICULTURE NETS MARKET, BY REGION, 2020-2029 (USD THOUSAND)
TABLE 29 EUROPE AGRICULTURE NETS MARKET, BY APPLICATION, 2020-2029 (USD THOUSAND))
TABLE 30 EUROPE HORTICULTURE AND FLORICULTURE IN AGRICULTURE NETS MARKET, BY REGION, 2020-2029 (USD THOUSAND)
TABLE 31 EUROPE FARMING AREA IN AGRICULTURE NETS MARKET, BY REGION, 2020-2029 (USD THOUSAND)
TABLE 32 EUROPE AQUACULTURE IN AGRICULTURE NETS MARKET, BY REGION, 2020-2029 (USD THOUSAND)
TABLE 33 EUROPE ANIMAL HUSBANDRY IN AGRICULTURE NETS MARKET, BY REGION, 2020-2029 (USD THOUSAND)
TABLE 34 EUROPE AGRICULTURE NETS MARKET, BY END-USE, 2020-2029 (USD THOUSAND)
TABLE 35 EUROPE INDUSTRIAL AGRICULTURE IN AGRICULTURE NETS MARKET, BY REGION, 2020-2029 (USD THOUSAND)
TABLE 36 EUROPE INDUSTRIAL AGRICULTURE IN AGRICULTURE NETS MARKET, BY PRODUCT TYPE, 2020-2029 (USD THOUSAND)
TABLE 37 EUROPE SUSTAINABLE AGRICULTURE IN AGRICULTURE NETS MARKET, BY REGION, 2020-2029 (USD THOUSAND)
TABLE 38 EUROPE SUSTAINABLE AGRICULTURE IN AGRICULTURE NETS MARKET, BY PRODUCT TYPE, 2020-2029 (USD THOUSAND)
TABLE 39 EUROPE AGRICULTURE NETS MARKET, BY COUNTRY, 2020-2029 (USD THOUSAND)
TABLE 40 EUROPE AGRICULTURE NETS MARKET, BY PRODUCT TYPE, 2020-2029 (USD THOUSAND)
TABLE 41 EUROPE AGRICULTURE NETS MARKET, BY MATERIAL TYPE, 2020-2029 (USD THOUSAND)
TABLE 42 EUROPE AGRICULTURE NETS MARKET, BY FORM, 2020-2029 (USD THOUSAND)
TABLE 43 EUROPE AGRICULTURE NETS MARKET, BY PRICE RANGE, 2020-2029 (USD THOUSAND)
TABLE 44 EUROPE AGRICULTURE NETS MARKET, BY DISTRIBUTION CHANNEL, 2020-2029 (USD THOUSAND)
TABLE 45 EUROPE AGRICULTURE NETS MARKET, BY APPLICATION, 2020-2029 (USD THOUSAND)
TABLE 46 EUROPE AGRICULTURE NETS MARKET, BY END-USE, 2020-2029 (USD THOUSAND)
TABLE 47 EUROPE INDUSTRIAL AGRICULTURE IN AGRICULTURE NETS MARKET, BY PRODUCT TYPE, 2020-2029 (USD THOUSAND)
TABLE 48 EUROPE SUSTAINABLE AGRICULTURE IN AGRICULTURE NETS MARKET, BY PRODUCT TYPE, 2020-2029 (USD THOUSAND)
TABLE 49 GERMANY AGRICULTURE NETS MARKET, BY PRODUCT TYPE, 2020-2029 (USD THOUSAND)
TABLE 50 GERMANY AGRICULTURE NETS MARKET, BY MATERIAL TYPE, 2020-2029 (USD THOUSAND)
TABLE 51 GERMANY AGRICULTURE NETS MARKET, BY FORM, 2020-2029 (USD THOUSAND)
TABLE 52 GERMANY AGRICULTURE NETS MARKET, BY PRICE RANGE, 2020-2029 (USD THOUSAND)
TABLE 53 GERMANY AGRICULTURE NETS MARKET, BY DISTRIBUTION CHANNEL, 2020-2029 (USD THOUSAND)
TABLE 54 GERMANY AGRICULTURE NETS MARKET, BY APPLICATION, 2020-2029 (USD THOUSAND)
TABLE 55 GERMANY AGRICULTURE NETS MARKET, BY END-USE, 2020-2029 (USD THOUSAND)
TABLE 56 GERMANY INDUSTRIAL AGRICULTURE IN AGRICULTURE NETS MARKET, BY PRODUCT TYPE, 2020-2029 (USD THOUSAND)
TABLE 57 GERMANY SUSTAINABLE AGRICULTURE IN AGRICULTURE NETS MARKET, BY PRODUCT TYPE, 2020-2029 (USD THOUSAND)
TABLE 58 U.K. AGRICULTURE NETS MARKET, BY PRODUCT TYPE, 2020-2029 (USD THOUSAND)
TABLE 59 U.K. AGRICULTURE NETS MARKET, BY MATERIAL TYPE, 2020-2029 (USD THOUSAND)
TABLE 60 U.K. AGRICULTURE NETS MARKET, BY FORM, 2020-2029 (USD THOUSAND)
TABLE 61 U.K. AGRICULTURE NETS MARKET, BY PRICE RANGE, 2020-2029 (USD THOUSAND)
TABLE 62 U.K. AGRICULTURE NETS MARKET, BY DISTRIBUTION CHANNEL, 2020-2029 (USD THOUSAND)
TABLE 63 U.K. AGRICULTURE NETS MARKET, BY APPLICATION, 2020-2029 (USD THOUSAND)
TABLE 64 U.K. AGRICULTURE NETS MARKET, BY END-USE, 2020-2029 (USD THOUSAND)
TABLE 65 U.K. INDUSTRIAL AGRICULTURE IN AGRICULTURE NETS MARKET, BY PRODUCT TYPE, 2020-2029 (USD THOUSAND)
TABLE 66 U.K. SUSTAINABLE AGRICULTURE IN AGRICULTURE NETS MARKET, BY PRODUCT TYPE, 2020-2029 (USD THOUSAND)
TABLE 67 SPAIN AGRICULTURE NETS MARKET, BY PRODUCT TYPE, 2020-2029 (USD THOUSAND)
TABLE 68 SPAIN AGRICULTURE NETS MARKET, BY MATERIAL TYPE, 2020-2029 (USD THOUSAND)
TABLE 69 SPAIN AGRICULTURE NETS MARKET, BY FORM, 2020-2029 (USD THOUSAND)
TABLE 70 SPAIN AGRICULTURE NETS MARKET, BY PRICE RANGE, 2020-2029 (USD THOUSAND)
TABLE 71 SPAIN AGRICULTURE NETS MARKET, BY DISTRIBUTION CHANNEL, 2020-2029 (USD THOUSAND)
TABLE 72 SPAIN AGRICULTURE NETS MARKET, BY APPLICATION, 2020-2029 (USD THOUSAND)
TABLE 73 SPAIN AGRICULTURE NETS MARKET, BY END-USE, 2020-2029 (USD THOUSAND)
TABLE 74 SPAIN INDUSTRIAL AGRICULTURE IN AGRICULTURE NETS MARKET, BY PRODUCT TYPE, 2020-2029 (USD THOUSAND)
TABLE 75 SPAIN SUSTAINABLE AGRICULTURE IN AGRICULTURE NETS MARKET, BY PRODUCT TYPE, 2020-2029 (USD THOUSAND)
TABLE 76 NETHERLANDS AGRICULTURE NETS MARKET, BY PRODUCT TYPE, 2020-2029 (USD THOUSAND)
TABLE 77 NETHERLANDS AGRICULTURE NETS MARKET, BY MATERIAL TYPE, 2020-2029 (USD THOUSAND)
TABLE 78 NETHERLANDS AGRICULTURE NETS MARKET, BY FORM, 2020-2029 (USD THOUSAND)
TABLE 79 NETHERLANDS AGRICULTURE NETS MARKET, BY PRICE RANGE, 2020-2029 (USD THOUSAND)
TABLE 80 NETHERLANDS AGRICULTURE NETS MARKET, BY DISTRIBUTION CHANNEL, 2020-2029 (USD THOUSAND)
TABLE 81 NETHERLANDS AGRICULTURE NETS MARKET, BY APPLICATION, 2020-2029 (USD THOUSAND)
TABLE 82 NETHERLANDS AGRICULTURE NETS MARKET, BY END-USE, 2020-2029 (USD THOUSAND)
TABLE 83 NETHERLANDS INDUSTRIAL AGRICULTURE IN AGRICULTURE NETS MARKET, BY PRODUCT TYPE, 2020-2029 (USD THOUSAND)
TABLE 84 NETHERLANDS SUSTAINABLE AGRICULTURE IN AGRICULTURE NETS MARKET, BY PRODUCT TYPE, 2020-2029 (USD THOUSAND)
TABLE 85 FRANCE AGRICULTURE NETS MARKET, BY PRODUCT TYPE, 2020-2029 (USD THOUSAND)
TABLE 86 FRANCE AGRICULTURE NETS MARKET, BY MATERIAL TYPE, 2020-2029 (USD THOUSAND)
TABLE 87 FRANCE AGRICULTURE NETS MARKET, BY FORM, 2020-2029 (USD THOUSAND)
TABLE 88 FRANCE AGRICULTURE NETS MARKET, BY PRICE RANGE, 2020-2029 (USD THOUSAND)
TABLE 89 FRANCE AGRICULTURE NETS MARKET, BY DISTRIBUTION CHANNEL, 2020-2029 (USD THOUSAND)
TABLE 90 FRANCE AGRICULTURE NETS MARKET, BY APPLICATION, 2020-2029 (USD THOUSAND)
TABLE 91 FRANCE AGRICULTURE NETS MARKET, BY END-USE, 2020-2029 (USD THOUSAND)
TABLE 92 FRANCE INDUSTRIAL AGRICULTURE IN AGRICULTURE NETS MARKET, BY PRODUCT TYPE, 2020-2029 (USD THOUSAND)
TABLE 93 FRANCE SUSTAINABLE AGRICULTURE IN AGRICULTURE NETS MARKET, BY PRODUCT TYPE, 2020-2029 (USD THOUSAND)
TABLE 94 ITALY AGRICULTURE NETS MARKET, BY PRODUCT TYPE, 2020-2029 (USD THOUSAND)
TABLE 95 ITALY AGRICULTURE NETS MARKET, BY MATERIAL TYPE, 2020-2029 (USD THOUSAND)
TABLE 96 ITALY AGRICULTURE NETS MARKET, BY FORM, 2020-2029 (USD THOUSAND)
TABLE 97 ITALY AGRICULTURE NETS MARKET, BY PRICE RANGE, 2020-2029 (USD THOUSAND)
TABLE 98 ITALY AGRICULTURE NETS MARKET, BY DISTRIBUTION CHANNEL, 2020-2029 (USD THOUSAND)
TABLE 99 ITALY AGRICULTURE NETS MARKET, BY APPLICATION, 2020-2029 (USD THOUSAND)
TABLE 100 ITALY AGRICULTURE NETS MARKET, BY END-USE, 2020-2029 (USD THOUSAND)
TABLE 101 ITALY INDUSTRIAL AGRICULTURE IN AGRICULTURE NETS MARKET, BY PRODUCT TYPE, 2020-2029 (USD THOUSAND)
TABLE 102 ITALY SUSTAINABLE AGRICULTURE IN AGRICULTURE NETS MARKET, BY PRODUCT TYPE, 2020-2029 (USD THOUSAND)
TABLE 103 TURKEY AGRICULTURE NETS MARKET, BY PRODUCT TYPE, 2020-2029 (USD THOUSAND)
TABLE 104 TURKEY AGRICULTURE NETS MARKET, BY MATERIAL TYPE, 2020-2029 (USD THOUSAND)
TABLE 105 TURKEY AGRICULTURE NETS MARKET, BY FORM, 2020-2029 (USD THOUSAND)
TABLE 106 TURKEY AGRICULTURE NETS MARKET, BY PRICE RANGE, 2020-2029 (USD THOUSAND)
TABLE 107 TURKEY AGRICULTURE NETS MARKET, BY DISTRIBUTION CHANNEL, 2020-2029 (USD THOUSAND)
TABLE 108 TURKEY AGRICULTURE NETS MARKET, BY APPLICATION, 2020-2029 (USD THOUSAND)
TABLE 109 TURKEY AGRICULTURE NETS MARKET, BY END-USE, 2020-2029 (USD THOUSAND)
TABLE 110 TURKEY INDUSTRIAL AGRICULTURE IN AGRICULTURE NETS MARKET, BY PRODUCT TYPE, 2020-2029 (USD THOUSAND)
TABLE 111 TURKEY SUSTAINABLE AGRICULTURE IN AGRICULTURE NETS MARKET, BY PRODUCT TYPE, 2020-2029 (USD THOUSAND)
TABLE 112 LUXEMBOURG AGRICULTURE NETS MARKET, BY PRODUCT TYPE, 2020-2029 (USD THOUSAND)
TABLE 113 LUXEMBOURG AGRICULTURE NETS MARKET, BY MATERIAL TYPE, 2020-2029 (USD THOUSAND)
TABLE 114 LUXEMBOURG AGRICULTURE NETS MARKET, BY FORM, 2020-2029 (USD THOUSAND)
TABLE 115 LUXEMBOURG AGRICULTURE NETS MARKET, BY PRICE RANGE, 2020-2029 (USD THOUSAND)
TABLE 116 LUXEMBOURG AGRICULTURE NETS MARKET, BY DISTRIBUTION CHANNEL, 2020-2029 (USD THOUSAND)
TABLE 117 LUXEMBOURG AGRICULTURE NETS MARKET, BY APPLICATION, 2020-2029 (USD THOUSAND)
TABLE 118 LUXEMBOURG AGRICULTURE NETS MARKET, BY END-USE, 2020-2029 (USD THOUSAND)
TABLE 119 LUXEMBOURG INDUSTRIAL AGRICULTURE IN AGRICULTURE NETS MARKET, BY PRODUCT TYPE, 2020-2029 (USD THOUSAND)
TABLE 120 LUXEMBOURG SUSTAINABLE AGRICULTURE IN AGRICULTURE NETS MARKET, BY PRODUCT TYPE, 2020-2029 (USD THOUSAND)
TABLE 121 BELGIUM AGRICULTURE NETS MARKET, BY PRODUCT TYPE, 2020-2029 (USD THOUSAND)
TABLE 122 BELGIUM AGRICULTURE NETS MARKET, BY MATERIAL TYPE, 2020-2029 (USD THOUSAND)
TABLE 123 BELGIUM AGRICULTURE NETS MARKET, BY FORM, 2020-2029 (USD THOUSAND)
TABLE 124 BELGIUM AGRICULTURE NETS MARKET, BY PRICE RANGE, 2020-2029 (USD THOUSAND)
TABLE 125 BELGIUM AGRICULTURE NETS MARKET, BY DISTRIBUTION CHANNEL, 2020-2029 (USD THOUSAND)
TABLE 126 BELGIUM AGRICULTURE NETS MARKET, BY APPLICATION, 2020-2029 (USD THOUSAND)
TABLE 127 BELGIUM AGRICULTURE NETS MARKET, BY END-USE, 2020-2029 (USD THOUSAND)
TABLE 128 BELGIUM INDUSTRIAL AGRICULTURE IN AGRICULTURE NETS MARKET, BY PRODUCT TYPE, 2020-2029 (USD THOUSAND)
TABLE 129 BELGIUM SUSTAINABLE AGRICULTURE IN AGRICULTURE NETS MARKET, BY PRODUCT TYPE, 2020-2029 (USD THOUSAND)
TABLE 130 RUSSIA AGRICULTURE NETS MARKET, BY PRODUCT TYPE, 2020-2029 (USD THOUSAND)
TABLE 131 RUSSIA AGRICULTURE NETS MARKET, BY MATERIAL TYPE, 2020-2029 (USD THOUSAND)
TABLE 132 RUSSIA AGRICULTURE NETS MARKET, BY FORM, 2020-2029 (USD THOUSAND)
TABLE 133 RUSSIA AGRICULTURE NETS MARKET, BY PRICE RANGE, 2020-2029 (USD THOUSAND)
TABLE 134 RUSSIA AGRICULTURE NETS MARKET, BY DISTRIBUTION CHANNEL, 2020-2029 (USD THOUSAND)
TABLE 135 RUSSIA AGRICULTURE NETS MARKET, BY APPLICATION, 2020-2029 (USD THOUSAND)
TABLE 136 RUSSIA AGRICULTURE NETS MARKET, BY END-USE, 2020-2029 (USD THOUSAND)
TABLE 137 RUSSIA INDUSTRIAL AGRICULTURE IN AGRICULTURE NETS MARKET, BY PRODUCT TYPE, 2020-2029 (USD THOUSAND)
TABLE 138 RUSSIA SUSTAINABLE AGRICULTURE IN AGRICULTURE NETS MARKET, BY PRODUCT TYPE, 2020-2029 (USD THOUSAND)
TABLE 139 SWITZERLAND AGRICULTURE NETS MARKET, BY PRODUCT TYPE, 2020-2029 (USD THOUSAND)
TABLE 140 SWITZERLAND AGRICULTURE NETS MARKET, BY MATERIAL TYPE, 2020-2029 (USD THOUSAND)
TABLE 141 SWITZERLAND AGRICULTURE NETS MARKET, BY FORM, 2020-2029 (USD THOUSAND)
TABLE 142 SWITZERLAND AGRICULTURE NETS MARKET, BY PRICE RANGE, 2020-2029 (USD THOUSAND)
TABLE 143 SWITZERLAND AGRICULTURE NETS MARKET, BY DISTRIBUTION CHANNEL, 2020-2029 (USD THOUSAND)
TABLE 144 SWITZERLAND AGRICULTURE NETS MARKET, BY APPLICATION, 2020-2029 (USD THOUSAND)
TABLE 145 SWITZERLAND AGRICULTURE NETS MARKET, BY END-USE, 2020-2029 (USD THOUSAND)
TABLE 146 SWITZERLAND INDUSTRIAL AGRICULTURE IN AGRICULTURE NETS MARKET, BY PRODUCT TYPE, 2020-2029 (USD THOUSAND)
TABLE 147 SWITZERLAND SUSTAINABLE AGRICULTURE IN AGRICULTURE NETS MARKET, BY PRODUCT TYPE, 2020-2029 (USD THOUSAND)
TABLE 148 REST OF EUROPE AGRICULTURE NETS MARKET, BY PRODUCT TYPE, 2020-2029 (USD THOUSAND)
List of Figure
FIGURE 1 EUROPE AGRICULTURE NETS MARKET: SEGMENTATION
FIGURE 2 EUROPE AGRICULTURE NETS MARKET : DATA TRIANGULATION
FIGURE 3 EUROPE AGRICULTURE NETS MARKET: DROC ANALYSIS
FIGURE 4 EUROPE AGRICULTURE NETS MARKET: EUROPE VS REGIONAL MARKET ANALYSIS
FIGURE 5 EUROPE AGRICULTURE NETS MARKET: COMPANY RESEARCH ANALYSIS
FIGURE 6 EUROPE AGRICULTURE NETS MARKET: INTERVIEW DEMOGRAPHICS
FIGURE 7 EUROPE AGRICULTURE NETS MARKET: DBMR MARKET POSITION GRID
FIGURE 8 EUROPE AGRICULTURE NETS MARKET: VENDOR SHARE ANALYSIS
FIGURE 9 EUROPE AGRICULTURE NETS MARKET: MARKET END-USER COVERAGE GRID
FIGURE 10 EUROPE AGRICULTURE NETS MARKET: SEGMENTATION
FIGURE 11 GROWING INITIATIVES FOR FOOD SECURITY ACROSS THE GLOBE IS EXPECTED TO DRIVE THE EUROPE AGRICULTURE NETS MARKET IN THE FORECAST PERIOD OF 2022 TO 2029
FIGURE 12 SHADING NETS SEGMENT IS EXPECTED TO ACCOUNT FOR THE LARGEST SHARE OF THE EUROPE AGRICULTURE NETS MARKET IN 2022 TO 2029
FIGURE 13 DRIVERS, RESTRAINTS, OPPORTUNITIES AND CHALLENGES OF EUROPE AGRICULTURE NETS MARKET
FIGURE 14 EUROPE AGRICULTURE NETS MARKET : BY PRODUCT TYPE, 2021
FIGURE 15 EUROPE AGRICULTURE NETS MARKET : BY MATERIAL TYPE, 2021
FIGURE 16 EUROPE AGRICULTURE NETS MARKET : BY PRICE RANGE, 2021
FIGURE 17 EUROPE AGRICULTURE NETS MARKET: BY FORM, 2021
FIGURE 18 EUROPE AGRICULTURE NETS MARKET : BY DISTRIBUTION CHANNEL, 2021
FIGURE 19 EUROPE AGRICULTURE NETS MARKET : BY APPLICATION, 2021
FIGURE 20 EUROPE AGRICULTURE NETS MARKET : BY END USE, 2021
FIGURE 21 EUROPE AGRICULTURE NETS MARKET: SNAPSHOT (2021)
FIGURE 22 EUROPE AGRICULTURE NETS MARKET: BY COUNTRY (2021)
FIGURE 23 EUROPE AGRICULTURE NETS MARKET: BY COUNTRY (2022 & 2029)
FIGURE 24 EUROPE AGRICULTURE NETS MARKET : BY COUNTRY (2021 & 2029)
FIGURE 25 EUROPE AGRICULTURE NETS MARKET : BY PRODUCT TYPE (2022-2029)
FIGURE 26 EUROPE AGRICULTURE NETS MARKET: COMPANY SHARE 2021 (%)
Data collection and base year analysis are done using data collection modules with large sample sizes. The stage includes obtaining market information or related data through various sources and strategies. It includes examining and planning all the data acquired from the past in advance. It likewise envelops the examination of information inconsistencies seen across different information sources. The market data is analysed and estimated using market statistical and coherent models. Also, market share analysis and key trend analysis are the major success factors in the market report. To know more, please request an analyst call or drop down your inquiry.
The key research methodology used by DBMR research team is data triangulation which involves data mining, analysis of the impact of data variables on the market and primary (industry expert) validation. Data models include Vendor Positioning Grid, Market Time Line Analysis, Market Overview and Guide, Company Positioning Grid, Patent Analysis, Pricing Analysis, Company Market Share Analysis, Standards of Measurement, Global versus Regional and Vendor Share Analysis. To know more about the research methodology, drop in an inquiry to speak to our industry experts.
Data Bridge Market Research is a leader in advanced formative research. We take pride in servicing our existing and new customers with data and analysis that match and suits their goal. The report can be customized to include price trend analysis of target brands understanding the market for additional countries (ask for the list of countries), clinical trial results data, literature review, refurbished market and product base analysis. Market analysis of target competitors can be analyzed from technology-based analysis to market portfolio strategies. We can add as many competitors that you require data about in the format and data style you are looking for. Our team of analysts can also provide you data in crude raw excel files pivot tables (Fact book) or can assist you in creating presentations from the data sets available in the report.


