
Europe Battery Energy Storage System Market
Market Size in USD Billion
 USD
25.02 Billion
USD
87.65 Billion
2024
2032
USD
25.02 Billion
USD
87.65 Billion
2024
2032
| 2025 - 2032 | |
| USD 25.02 Billion | |
| USD 87.65 Billion | |
| % | |
|
Battery Energy Storage System Market Analysis
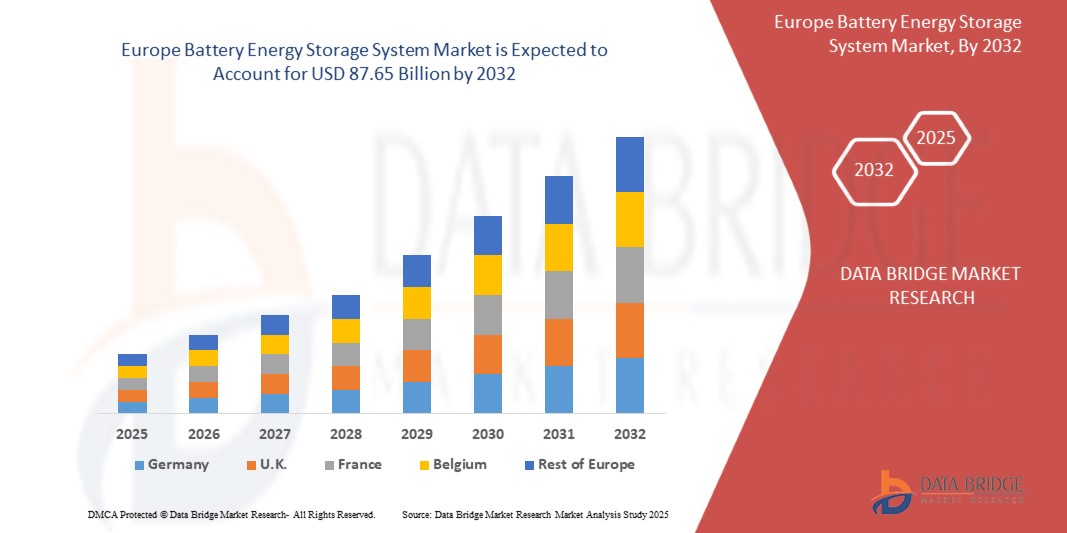
The Europe battery energy storage system (BESS) market is expanding rapidly, driven by increasing renewable energy integration, grid stability needs, and electrification trends. Lithium-ion batteries dominate due to their efficiency and cost-effectiveness, though alternatives such as solid-state and flow batteries are emerging. Key applications include peak shaving, load shifting, and backup power for residential, commercial, and utility-scale projects. Leading players include Tesla, LG Energy Solution, and Fluence. Government incentives, carbon reduction policies, and falling battery costs propel market growth. The Asia-Pacific region leads, followed by North America and Europe. Challenges include high initial investments, supply chain constraints, and battery disposal concerns. Future advancements in technology and energy management will further drive adoption and market expansion.
Battery Energy Storage System Market Size
The Europe battery energy storage system market is expected to reach USD 87.65 billion by 2032 from USD 25.02 billion in 2024, growing with a substantial CAGR of 17.07% in the forecast period of 2025 to 2032.
In addition to the insights on market scenarios such as market value, growth rate, segmentation, geographical coverage, and major players, the market reports curated by the Data Bridge Market Research also include import export analysis, production capacity overview, production consumption analysis, price trend analysis, climate change scenario, supply chain analysis, value chain analysis, raw material/consumables overview, vendor selection criteria, PESTLE Analysis, Porter Analysis, and regulatory framework.
Battery Energy Storage System Market Trends
“Integration of Renewable Energy, Grid Stabilization Needs, and Electrification Trends”
The Europe battery energy storage system (BESS) market is expanding rapidly, driven by the integration of renewable energy, grid stabilization needs, and electrification trends. Lithium-ion batteries dominate due to their efficiency and declining costs, while advancements in solid-state and flow batteries promise enhanced performance. Governments worldwide are introducing policies and incentives to promote energy storage, with regions such as Asia-Pacific (China, India), North America, and Europe leading in adoption. Utility-scale storage is growing to support grid resilience, while residential and commercial deployments are rising due to energy independence and cost savings. Challenges include supply chain constraints, raw material costs, and recycling concerns. Future trends point to AI-driven energy management, hybrid storage solutions, and second-life battery applications.
Report Scope and Battery Energy Storage System Market Segmentation
|
Attributes |
Battery Energy Storage System Market Insights |
|
Segments Covered |
|
|
Countries Covered |
Germany, U.K., France, Italy, Spain, Russia, Switzerland, Netherlands, Belgium, Turkey, Rest of Europe |
|
Key Market Players |
BYD COMPANY LTD (China), LG Energy Solution (south Korea), ABB (Switzerland), Bosch Limited (Germany), The AES Corporation (U.S.), Wärtsilä (Finland), Schneider Electric (France), SMA Solar Technology AG (Germany), Freudenberg Group (Germany), Eos Energy Enterprises (U.S.), ATX Networks Corp. (Canada), and Beacon Power, LLC (U.S.) |
|
Market Opportunities |
|
|
Value Added Data Infosets |
In addition to the insights on market scenarios such as market value, growth rate, segmentation, geographical coverage, and major players, the market reports curated by the Data Bridge Market Research also include import export analysis, production capacity overview, production consumption analysis, price trend analysis, climate change scenario, supply chain analysis, value chain analysis, raw material/consumables overview, vendor selection criteria, PESTLE Analysis, Porter Analysis, and regulatory framework. |
Battery Energy Storage System Market Definition
A Battery Energy Storage System (BESS) is a technology that stores electrical energy in rechargeable batteries for later use. It plays a crucial role in stabilizing power grids, integrating renewable energy sources such as solar and wind, and enhancing energy efficiency. BESS can provide backup power, manage peak demand, and improve grid reliability by balancing supply and demand. Lithium-ion batteries dominate the market due to their high energy density and efficiency, but alternative chemistries such as solid-state and flow batteries are emerging.
Battery Energy Storage System Market Dynamics
Drivers
- Rising Renewable Energy Integration and Adoption
As the world moves toward cleaner energy, the use of renewable sources such as solar and wind power is increasing rapidly. However, these energy sources are not always available when needed. The sun does not shine at night, and the wind does not always blow. This creates a challenge in maintaining a steady supply of electricity. Battery Energy Storage Systems (BESS) help solve this problem. These systems store excess electricity generated from renewable sources and release it when demand is high or when renewable generation is low. This ensures a stable and reliable power supply, reducing dependence on traditional fossil fuels. One major driver for the adoption of BESS is the falling cost of battery technology. Advances in lithium-ion and other battery types have made energy storage more affordable. Governments and businesses are investing in these systems to improve energy efficiency and support clean energy goals.
For instance,
- In March 2019, an article published by Chary Publications Pvt. Ltd. stated that Battery Energy Storage Systems (BESS) support renewable energy integration by storing excess power and releasing it when needed, ensuring grid stability. With advancements in battery technology and cost reductions, BESS adoption is rising. Government incentives and policies further drive investment, making renewable energy more reliable and accessible
- According to a post published by Business Prizm, Battery Energy Storage Systems (BESS) play a crucial role in renewable energy integration by storing excess power and ensuring grid stability. As renewable adoption grows, BESS helps balance supply and demand, reducing blackouts and enhancing energy reliability. Government incentives and technological advancements further drive adoption
- In February 2025, an article published by Guardian News & Media Limited reported that Australia's investment in large-scale wind and solar projects reached a six-year peak of $9 billion in 2024, driven by policy support and falling renewable energy costs. The country aims to achieve 82% renewable energy generation by 2030, accelerating the adoption of clean energy solutions
Growing Demand For Grid Stability and Energy Resilience
The demand for a stable and reliable power supply is increasing as energy systems become more complex. Power grids must handle growing electricity demand, fluctuations from renewable sources such as solar and wind, and unexpected outages. To ensure smooth energy flow, Battery Energy Storage Systems (BESS) are becoming essential.
BESS helps maintain grid stability by storing extra electricity when supply is high and releasing it when demand rises. This prevents blackouts and ensures a steady flow of power, even during peak usage hours. When there are sudden power shortages, BESS can quickly step in, keeping homes, businesses, and industries running without interruptions.
Another major benefit of BESS is energy resilience. Natural disasters, extreme weather, and cyber threats can disrupt power grids, leading to outages. With battery storage, electricity can be stored and used when the grid fails, ensuring essential services such as hospitals, emergency centers, and communication networks continue to operate.
For Instance,
- According to a post published by WElink, Battery Energy Storage Systems (BESS) enhance grid stability by storing excess energy and releasing it during peak demand, ensuring a steady power supply. They respond within milliseconds to balance frequency deviations, preventing outages and improving energy resilience. BESS supports renewable energy integration for a more reliable grid
- In February 2025, according to an article published by Reuters, falling costs of solar panels and batteries are expanding the role of renewables in the power market. Lower prices make clean energy projects more affordable, driving Europe adoption. As storage becomes cheaper, renewable energy can provide a more stable and reliable power supply
- In February 2025, according to an article published by Reuters, Australia’s AGL Energy plans to develop 1.4 gigawatts of grid-scale battery storage to support the green transition and achieve net-zero emissions by 2035. The company is investing in energy storage to enhance grid stability and integrate more renewables into the power system
Opportunities
- Advancements and Innovations in Battery Technologies
Advancements and innovations in battery technologies are creating significant opportunities in the Europe Battery Energy Storage System (BESS) Market. With the increasing demand for renewable energy integration, grid stability, and electrification across industries, battery storage solutions are becoming essential. One of the key drivers of market growth is the development of next-generation batteries, such as solid-state, lithium-sulfur, and sodium-ion batteries, which offer improved energy density, safety, and lifespan compared to traditional lithium-ion batteries. These innovations enhance the efficiency of energy storage systems, making them more cost-effective and reliable.
In addition, the decline in battery costs due to advancements in materials, manufacturing processes, and recycling technologies is expanding market adoption. Governments and private entities are heavily investing in battery research and production to reduce dependency on limited raw materials such as lithium and cobalt. Innovations in recycling and second-life battery usage further contribute to sustainability and cost reduction, making BESS more attractive to utilities, commercial, and residential users.
Another major opportunity is the growth of grid-scale energy storage systems to address intermittency issues associated with renewable energy sources such as solar and wind. Enhanced battery performance enables better load balancing, frequency regulation, and peak demand management, thus improving grid reliability. Furthermore, vehicle-to-grid (V2G) technology and bidirectional charging allow electric vehicles (EVs) to serve as distributed energy storage units, fostering a more decentralized energy infrastructure
For instance,
- According to blog by Saft, the development of solid-state, lithium-sulfur, and sodium-ion batteries is revolutionizing the battery energy storage market by offering higher energy density, improved safety, and longer lifespan. Saft highlights these technologies as key innovations that could power future energy storage solutions, enhancing grid reliability and renewable energy integration
- According to blog by Heila Technologies, AI-driven battery management systems (BMS) and smart energy storage solutions are optimizing battery performance and efficiency. Heila Technologies highlights how AI and decentralized energy networks enhance real-time monitoring, predictive maintenance, and grid reliability, enabling better energy management and seamless renewable integration
Rising Investments in Large-Scale Utility Storage
Rising investments in large-scale utility storage are creating significant opportunities in the Europe Battery Energy Storage System (BESS) Market. As the Europe energy landscape shifts toward renewable energy sources, utility-scale battery storage has become essential for ensuring grid stability, energy reliability, and efficient power management. Governments, utilities, and private sector companies are allocating substantial funds to develop and deploy advanced battery storage projects, driven by the increasing need to store excess energy from solar and wind power plants.
One of the primary factors fueling investments is the growing demand for grid modernization. Traditional power grids struggle with fluctuating energy supply from renewables, and large-scale battery storage systems help mitigate these challenges by providing load balancing, frequency regulation, and peak shaving capabilities. Investments in long-duration energy storage (LDES) technologies, such as flow batteries and hybrid energy storage systems, are further enabling the transition to 24/7 renewable power availability.
The declining costs of lithium-ion batteries and advancements in next-generation battery chemistries—including solid-state, sodium-ion, and lithium-sulfur batteries—are making utility-scale storage more affordable and efficient. Energy storage capacity expansions are also being driven by government incentives, tax credits, and policy mandates. Countries such as the United States, China, Germany, and Australia are implementing ambitious targets for battery storage deployment, providing financial backing for large-scale projects.
For instance,
- According to an article by Alexa Capital, The Alexa Capital report highlights that Europe investments in energy storage have surged, with a growing focus on utility-scale projects. This trend is driven by the need to support renewable energy integration and improve grid reliability, with continued investments expected to bolster the energy transition over the next decade
Restraints/Challenges
- High Initial Investment and Installation Costs
Battery Energy Storage Systems (BESS) are becoming essential for renewable energy integration and grid stability. However, one of the biggest restraints hindering their widespread adoption is the high initial investment and installation costs. Setting up a BESS involves significant expenses in battery procurement, advanced power electronics, installation, and infrastructure development.
The cost of lithium-ion batteries, which dominate the BESS market, remains high despite recent price declines. Other factors, such as inverter costs, thermal management systems, and control software, add to the overall expense. In addition, site preparation, labor costs, and compliance with regulatory requirements further increase the financial burden on businesses and utilities looking to implement these systems.
For many renewable energy developers and grid operators, the upfront capital required for a large-scale BESS project is a major deterrent. Even though these systems can generate long-term savings by reducing peak electricity costs and enhancing energy reliability, the initial costs can be prohibitive, especially for small and medium-sized enterprises (SMEs) or developing markets with limited financial resources.
Furthermore, the return on investment (ROI) for BESS depends on multiple factors, including electricity price fluctuations, government incentives, and market demand for grid services. Without strong financial incentives, subsidies, or supportive policies, many potential investors hesitate to deploy large-scale BESS solutions.
For instance,
- In December 2023, according to a report published by The Hindu Business Line, India's Power Ministry estimated the cost of Battery Energy Storage Systems (BESS) at ₹2.20-2.40 crore per megawatt-hour (MWh). The high capital investment remains a key challenge for large-scale adoption, impacting the feasibility of energy storage projects
- In January 2024, according to an article published by NenPower.com, the cost of setting up a Battery Energy Storage System (BESS) ranges from $300 to $800 per kilowatt-hour, depending on capacity and technology. The high initial investment remains a key restraint, impacting large-scale adoption despite long-term energy savings and grid stability benefits.
Environmental Sustainability Concerns Regarding Battery Recycling And Disposal
Environmental sustainability concerns regarding battery recycling and disposal present significant challenges for the Europe Battery Energy Storage System (BESS) Market. As demand for energy storage solutions and Electric Vehicles (EVs) grows, the resulting increase in battery production raises concerns about their end-of-life management. Batteries, especially lithium-ion, are composed of hazardous materials such as heavy metals and toxic chemicals. Improper disposal or recycling can result in environmental contamination, posing risks to soil, water, and air quality. This challenge is exacerbated by the limited infrastructure and capacity for safe and efficient battery recycling on a Europe scale.
One of the primary concerns is the lack of recycling technology that can recover critical materials such as lithium, cobalt, and nickel from used batteries in an environmentally friendly manner. While the recycling process can reclaim these valuable materials, it often involves high costs, low recovery rates, and inefficient methods that fail to meet the growing demand for raw materials. Inadequate recycling infrastructure further compounds this issue, particularly in developing regions, where regulations and technology for proper battery disposal are often lacking. This creates a growing supply chain dependency on mining, which itself has environmental consequences, such as deforestation and pollution.
Moreover, battery waste management is becoming an increasing challenge as the number of electric vehicles and energy storage systems continues to rise. Battery disposal at landfills or incineration results in the release of harmful chemicals into the environment, contributing to long-term pollution. Recycling and repurposing programs are essential for addressing this, but many regions still struggle to establish efficient systems, which increases the risk of improper disposal.
For instance,
- According to an article by Invinity Energy Systems, Invinity emphasizes the growing problem of battery waste, especially as the use of electric vehicles (EVs) and energy storage systems expands. The lack of efficient recycling infrastructure and low recovery rates for valuable materials such as lithium and cobalt exacerbates the environmental impact, highlighting the need for better recycling technologies and practices
- In January 2024, according to an article by Centurian Media Limited, The International Fire and Safety Journal highlights the environmental risks of improper battery disposal, including contamination from toxic chemicals and metals when batteries are discarded in landfills or incinerated. Effective battery recycling and repurposing programs are crucial to mitigate pollution and promote sustainable disposal methods
Impact and Current Market Scenario of Raw Material Shortage and Shipping Delays
Data Bridge Market Research offers a high-level analysis of the market and delivers information by keeping in account the impact and current market environment of raw material shortage and shipping delays. This translates into assessing strategic possibilities, creating effective action plans, and assisting businesses in making important decisions.
Apart from the standard report, we also offer in-depth analysis of the procurement level from forecasted shipping delays, distributor mapping by region, commodity analysis, production analysis, price mapping trends, sourcing, category performance analysis, supply chain risk management solutions, advanced benchmarking, and other services for procurement and strategic support.
Expected Impact of Economic Slowdown on the Pricing and Availability of Products
When economic activity slows, industries begin to suffer. The forecasted effects of the economic downturn on the pricing and accessibility of the products are taken into account in the market insight reports and intelligence services provided by DBMR. With this, our clients can typically keep one step ahead of their competitors, project their sales and revenue, and estimate their profit and loss expenditures.
Battery Energy Storage System Market Scope
The market is segmented on the basis of element, connection type, ownership, energy capacity, and application. The growth amongst these segments will help you analyze meagre growth segments in the industries and provide the users with a valuable market overview and market insights to help them make strategic decisions for identifying core market applications.
Element
- Battery
- Battery, By Element
- Lithium-Ion Batteries
- Advanced Lead-Acid Batteries
- Flow Batteries
- Sodium-Sulfur Batteries
- Other Battery Technologies
- Battery, By Element
- Hardware
Connection Type
- On-Grid (Grid-Tied) Systems
- Off-Grid (Standalone) Systems
Ownership
- Customer-Owned
- Utility-Owned
- Third-Party Owned
Energy Capacity
- Above 500 MWh
- Between 100 and 500 MWh
- Below 100 MWh
Application
- Residential
- Non-Residential
- Utilities
- Military & Defence
- Remote & Off-Grid Areas
- Others
Battery Energy Storage System Market Regional Analysis
The market is analyzed and market size insights and trends are provided by country, element, connection type, ownership, energy capacity, and application as referenced above.
The countries covered in the market are Germany, U.K., France, Italy, Spain, Russia, Switzerland, Netherlands, Belgium, Turkey, Rest of Europe.
Germany is expected to dominate the battery energy storage system market due to rapid industrialization, increasing renewable energy adoption, government incentives, and the growing demand for reliable energy storage solutions.
U.K. is the fastest-growing battery energy storage system (BESS) market due to strong government incentives, rising renewable energy adoption, grid modernization efforts, and increasing demand for energy reliability.
The country section of the report also provides individual market impacting factors and changes in regulation in the market domestically that impacts the current and future trends of the market. Data points such as down-stream and upstream value chain analysis, technical trends and porter's five forces analysis, case studies are some of the pointers used to forecast the market scenario for individual countries. Also, the presence and availability of Europe brands and their challenges faced due to large or scarce competition from local and domestic brands, impact of domestic tariffs and trade routes are considered while providing forecast analysis of the country data.
Battery Energy Storage System Market Share
The market competitive landscape provides details by competitors. Details included are company overview, company financials, revenue generated, market potential, investment in research and development, new market initiatives, Europe presence, production sites and facilities, production capacities, company strengths and weaknesses, product launch, product width and breadth, application dominance. The above data points provided are only related to the companies' focus related to market.
Battery Energy Storage System Market Leaders Operating in the Market Are:
- BYD COMPANY LTD (China)
- LG Energy Solution (south Korea)
- ABB (Switzerland)
- Bosch Limited (Germany)
- The AES Corporation (U.S.)
- Wärtsilä (Finland)
- Schneider Electric (France)
- SMA Solar Technology AG (Germany)
- Freudenberg Group (Germany)
- Eos Energy Enterprises (U.S.)
- ATX Networks Corp. (Canada)
- Beacon Power, LLC (U.S.)
Latest Developments in Battery Energy Storage System Market
- In October 2024, BYD announced a Europe strategic partnership with Black Myth: Wukong, becoming the game’s exclusive automotive brand partner. Black Myth: Wukong, China’s first AAA game, achieved record-breaking Europe sales, surpassing 10 million copies within three days of release
- In December 2024, Eos Energy Enterprises is expanding its manufacturing footprint to meet growing demand for zinc-based energy storage in the U.S. In addition to its Mon Valley Works expansion under Project AMAZE, the company is searching for a new facility, Factory 2 Works, to support its mission for safe, cost-effective, and sustainable energy storage. This expansion is key to addressing the increasing need for long-duration energy storage to support renewable energy sources and stabilize the grid
- In October 2024, Schneider Electric has partnered with Noida International Airport to implement building and energy management solutions, including Electrical SCADA and Advanced Distribution Management Systems. The collaboration aims to enhance operational efficiency, sustainability, and reduce energy consumption. Schneider Electric will provide innovative technologies for monitoring HVAC, electrical, and plumbing systems, as well as integrate various airport sub-systems. This partnership will help the airport achieve its sustainability goals and improve overall operational effectiveness
- In April 2024, SMA Solar Technology AG has introduced the SMA eCharger, a new PV-optimized charging solution for electric vehicles. Combining solar and grid power, it charges EVs up to 50% faster than standard wallboxes. Seamlessly integrated with the SMA Home Energy Solution and managed via Sunny Home Manager 2.0, it maximizes self-generated solar energy use. With easy installation, automatic updates, and future-ready technology, the SMA eCharger supports sustainable mobility and offers installers a new e-mobility solution to drive the energy transition forward
- In December 2024, Wärtsilä has been selected by Origin Energy to deliver Stage 3 of the Eraring battery project at the Eraring Power Station in New South Wales, Australia. This expansion adds 700 MWh of storage, bringing the total facility capacity to 700 MW / 2,800 MWh, making it the largest battery project in Australia and one of the largest Europely. Wärtsilä’s Quantum energy storage system and GEMS Digital Energy Platform will enhance grid stability and support Origin’s transition away from coal. Completion of Stage 3 is expected by end of 2025
SKU-

- Interactive Data Analysis Dashboard
- Company Analysis Dashboard for high growth potential opportunities
- Research Analyst Access for customization & queries
- Competitor Analysis with Interactive dashboard
- Latest News, Updates & Trend analysis
- Harness the Power of Benchmark Analysis for Comprehensive Competitor Tracking
Table of Content
1 INTRODUCTION
1.1 OBJECTIVES OF THE STUDY
1.2 MARKET DEFINITION
1.3 OVERVIEW
1.4 LIMITATIONS
1.5 MARKETS COVERED
2 MARKET SEGMENTATION
2.1 MARKETS COVERED
2.2 GEOGRAPHICAL SCOPE
2.3 YEARS CONSIDERED FOR THE STUDY
2.4 CURRENCY AND PRICING
2.5 DBMR TRIPOD DATA VALIDATION MODEL
2.6 MULTIVARIATE MODELING
2.7 PRIMARY INTERVIEWS WITH KEY OPINION LEADERS
2.8 DBMR MARKET POSITION GRID
2.9 DBMR VENDOR SHARE ANALYSIS
2.1 MARKET APPLICATION COVERAGE GRID
2.11 SECONDARY SOURCES
2.12 ASSUMPTIONS
3 EXECUTIVE SUMMARY
4 PREMIUM INSIGHTS
4.1 PESTEL ANALYSIS
4.1.1 POLITICAL FACTORS
4.1.2 ECONOMIC FACTORS
4.1.3 SOCIAL FACTORS
4.1.4 TECHNOLOGICAL FACTORS
4.1.5 ENVIRONMENTAL FACTORS
4.1.6 LEGAL FACTORS
4.2 PORTER’S FIVE FORCES ANALYSIS
4.2.1 THREAT OF NEW ENTRANTS
4.2.2 BARGAINING POWER OF SUPPLIERS
4.2.3 BARGAINING POWER OF BUYERS
4.2.4 THREAT OF SUBSTITUTES
4.2.5 INTERNAL COMPETITION
4.3 SUPPLY CHAIN ANALYSIS
4.3.1 OVERVIEW
4.3.2 LOGISTIC COST SCENARIO
4.3.3 IMPORTANCE OF LOGISTICS SERVICE PROVIDERS
4.4 TECHNOLOGICAL ADVANCEMENTS BY MANUFACTURERS
4.4.1 ADVANCES IN BATTERY CHEMISTRY AND DESIGN
4.4.2 ADVANCES IN BATTERY MANAGEMENT SYSTEMS (BMS)
4.4.3 ENERGY DENSITY IMPROVEMENTS
4.4.4 ADVANCEMENTS IN BATTERY RECYCLING AND REPURPOSING TECHNOLOGIES
4.4.5 INTEGRATION WITH RENEWABLE ENERGY SYSTEMS
4.4.6 ULTRA-FAST CHARGING TECHNOLOGIES
4.4.7 GRID-SCALE ENERGY STORAGE SOLUTIONS
5 MARKET OVERVIEW
5.1 DRIVERS
5.1.1 RISING RENEWABLE ENERGY INTEGRATION AND ADOPTION
5.1.2 GROWING DEMAND FOR GRID STABILITY AND ENERGY RESILIENCE
5.1.3 DECLINING BATTERY COSTS AND IMPROVED EFFICIENCY
5.1.4 ELECTRIFICATION OF TRANSPORTATION AND EV CHARGING INFRASTRUCTURE
5.2 RESTRAINTS
5.2.1 HIGH INITIAL INVESTMENT AND INSTALLATION COSTS
5.2.2 LIMITED BATTERY LIFESPAN AND DEGRADATION ISSUES
5.3 OPPORTUNITIES
5.3.1 ADVANCEMENTS AND INNOVATIONS IN BATTERY TECHNOLOGIES
5.3.2 RISING INVESTMENTS IN LARGE-SCALE UTILITY STORAGE
5.3.3 DEVELOPMENT OF SECOND-LIFE BATTERY MARKET
5.4 CHALLENGES
5.4.1 ENVIRONMENTAL SUSTAINABILITY CONCERNS REGARDING BATTERY RECYCLING AND DISPOSAL
5.4.2 SUPPLY CHAIN DISRUPTIONS AND RAW MATERIAL SHORTAGE
6 EUROPE BATTERY ENERGY STORAGE SYSTEM MARKET, BY ELEMENT
6.1 OVERVIEW
6.2 BATTERY
6.3 HARDWARE
7 EUROPE BATTERY ENERGY STORAGE SYSTEM MARKET, BY CONNECTION TYPE
7.1 OVERVIEW
7.2 ON-GRID (GRID-TIED) SYSTEMS
7.3 OFF-GRID (STANDALONE) SYSTEMS
8 EUROPE BATTERY ENERGY STORAGE SYSTEM MARKET, BY OWNERSHIP
8.1 OVERVIEW
8.2 CUSTOMER-OWNED
8.3 THIRD-PARTY OWNED
8.4 UTILITY-OWNED
9 EUROPE BATTERY ENERGY STORAGE SYSTEM MARKET, BY ENERGY CAPACITY
9.1 OVERVIEW
9.2 ABOVE 500 MWH
9.3 BETWEEN 100 AND 500 MWH
9.4 BELOW 100 MWH
10 EUROPE BATTERY ENERGY STORAGE SYSTEM MARKET, BY APPLICATION
10.1 OVERVIEW
10.2 RESIDENTIAL
10.3 NON-RESIDENTIAL
10.4 UTILITIES
10.5 MILITARY & DEFENSE
10.6 REMOTE & OFF-GRID AREAS
10.7 OTHERS
11 EUROPE BATTERY ENERGY STORAGE SYSTEM MARKET, BY GEOGRAPHY
11.1 EUROPE
11.1.1 GERMANY
11.1.2 FRANCE
11.1.3 U.K.
11.1.4 SPAIN
11.1.5 ITALY
11.1.6 TURKEY
11.1.7 DENMARK
11.1.8 RUSSIA
11.1.9 NETHERLANDS
11.1.10 NORWAY
11.1.11 POLAND
11.1.12 REST OF EUROPE
12 EUROPE BATTERY ENERGY STORAGE SYSTEM MARKET: COMPANY LANDSCAPE
12.1 COMPANY SHARE ANALYSIS: GLOBAL
13 SWOT ANALYSIS
14 COMPANY PROFILE
14.1 BYD COMPANY LTD
14.1.1 COMPANY SNAPSHOT
14.1.2 COMPANY SHARE ANALYSIS
14.1.3 PRODUCT PORTFOLIO
14.1.4 RECENT DEVELOPMENT
14.2 LG ENERGY SOLUTION
14.2.1 COMPANY SNAPSHOT
14.2.2 REVENUE ANALYSIS
14.2.3 COMPANY SHARE ANALYSIS
14.2.4 PRODUCT PORTFOLIO
14.2.5 RECENT DEVELOPMENT
14.3 ABB
14.3.1 COMPANY SNAPSHOT
14.3.2 REVENUE ANALYSIS
14.3.3 COMPANY SHARE ANALYSIS
14.3.4 PRODUCT PORTFOLIO
14.3.5 RECENT NEWS
14.4 BOSCH LIMITED
14.4.1 COMPANY SNAPSHOT
14.4.2 REVENUE ANALYSIS
14.4.3 COMPANY SHARE ANALYSIS
14.4.4 PRODUCT PORTFOLIO
14.4.5 RECENT DEVELOPMENT
14.5 THE AES CORPORATION
14.5.1 COMPANY SNAPSHOT
14.5.2 REVENUE ANALYSIS
14.5.3 COMPANY SHARE ANALYSIS
14.5.4 PRODUCT PORTFOLIO
14.5.5 RECENT DEVELOPMENT
14.6 ATX NETWORKS CORP.
14.6.1 COMPANY SNAPSHOT
14.6.2 PRODUCT PORTFOLIO
14.6.3 RECENT DEVELOPMENT
14.7 BEACON POWER, LLC
14.7.1 COMPANY SNAPSHOT
14.7.2 PRODUCT PORTFOLIO
14.7.3 RECENT DEVELOPMENT
14.8 EOS ENERGY ENTERPRISES
14.8.1 COMPANY SNAPSHOT
14.8.2 REVENUE ANALYSIS
14.8.3 PRODUCT PORTFOLIO
14.8.4 RECENT DEVELOPMENT
14.9 FREUDENBERG GROUP
14.9.1 COMPANY SNAPSHOT
14.9.2 PRODUCT PORTFOLIO
14.9.3 RECENT DEVELOPMENT
14.1 SCHNEIDER ELECTRIC
14.10.1 COMPANY SNAPSHOT
14.10.2 REVENUE ANALYSIS
14.10.3 PRODUCT PORTFOLIO
14.10.4 RECENT DEVELOPMENT
14.11 SMA SOLAR TECHNOLOGY AG
14.11.1 COMPANY SNAPSHOT
14.11.2 REVENUE ANALYSIS
14.11.3 PRODUCT PORTFOLIO
14.11.4 RECENT DEVELOPMENT
14.12 WÄRTSILÄ
14.12.1 COMPANY SNAPSHOT
14.12.2 REVENUE ANALYSIS
14.12.3 PRODUCT PORTFOLIO
14.12.4 RECENT DEVELOPMENT
15 QUESTIONNAIRE
16 RELATED REPORTS
List of Table
TABLE 1 EUROPE BATTERY ENERGY STORAGE SYSTEM MARKET, BY ELEMENT, 2018-2032 (USD THOUSAND)
TABLE 2 EUROPE BATTERY ENERGY STORAGE SYSTEM MARKET, BY ELEMENT, 2018-2032 (THOUSAND UNITS)
TABLE 3 EUROPE BATTERY ENERGY STORAGE SYSTEM MARKET, BY ELEMENT, 2018-2032 (USD/UNIT)
TABLE 4 EUROPE BATTERY IN BATTERY ENERGY STORAGE SYSTEM MARKET, BY REGION, 2018-2032, (USD THOUSAND)
TABLE 5 EUROPE BATTERY IN BATTERY ENERGY STORAGE SYSTEM MARKET, BY REGION, 2018-2032, (THOUSAND UNITS)
TABLE 6 EUROPE BATTERY IN BATTERY ENERGY STORAGE SYSTEM MARKET, BY ELEMENT, 2018-2032 (USD THOUSAND)
TABLE 7 EUROPE BATTERY IN BATTERY ENERGY STORAGE SYSTEM MARKET, BY ELEMENT, 2018-2032 (THOUSAND UNITS)
TABLE 8 EUROPE BATTERY IN BATTERY ENERGY STORAGE SYSTEM MARKET, BY ELEMENT, 2018-2032 (USD/UNITS)
TABLE 9 EUROPE HARDWARE IN BATTERY ENERGY STORAGE SYSTEM MARKET, BY REGION, 2018-2032, (USD THOUSAND)
TABLE 10 EUROPE HARDWARE IN BATTERY ENERGY STORAGE SYSTEM MARKET, BY REGION, 2018-2032, (THOUSAND UNITS)
TABLE 11 EUROPE BATTERY ENERGY STORAGE SYSTEM MARKET, BY CONNECTION TYPE, 2018-2032 (USD THOUSAND)
TABLE 12 EUROPE BATTERY ENERGY STORAGE SYSTEM MARKET, BY CONNECTION TYPE, 2018-2032 (THOUSAND UNITS)
TABLE 13 EUROPE BATTERY ENERGY STORAGE SYSTEM MARKET: BY ELEMENT, 2018-2032 (USD/UNIT)
TABLE 14 EUROPE ON-GRID (GRID-TIED) SYSTEMS IN BATTERY ENERGY STORAGE SYSTEM MARKET, BY REGION, 2018-2032, (USD THOUSAND)
TABLE 15 EUROPE ON-GRID (GRID-TIED) SYSTEMS IN BATTERY ENERGY STORAGE SYSTEM MARKET, BY REGION, 2018-2032, (THOUSAND UNITS)
TABLE 16 EUROPE OFF-GRID (STANDALONE) SYSTEMS IN BATTERY ENERGY STORAGE SYSTEM MARKET, BY REGION, 2018-2032, (USD THOUSAND)
TABLE 17 EUROPE OFF-GRID (STANDALONE) SYSTEMS IN BATTERY ENERGY STORAGE SYSTEM MARKET, BY REGION, 2018-2032, (THOUSAND UNITS)
TABLE 18 EUROPE BATTERY ENERGY STORAGE SYSTEM MARKET: BY OWNERSHIP, 2018-2032 (USD THOUSAND)
TABLE 19 EUROPE BATTERY ENERGY STORAGE SYSTEM MARKET: BY OWNERSHIP, 2018-2032 (THOUSAND UNITS)
TABLE 20 EUROPE BATTERY ENERGY STORAGE SYSTEM MARKET: BY OWNERSHIP, 2018-2032 (USD/UNIT)
TABLE 21 EUROPE CUSTOMER-OWNED IN BATTERY ENERGY STORAGE SYSTEM MARKET, BY REGION, 2018-2032, (USD THOUSAND)
TABLE 22 EUROPE CUSTOMER-OWNED IN BATTERY ENERGY STORAGE SYSTEM MARKET, BY REGION, 2018-2032, (THOUSAND UNITS)
TABLE 23 EUROPE THIRD-PARTY OWNED IN BATTERY ENERGY STORAGE SYSTEM MARKET, BY REGION, 2018-2032, (USD THOUSAND)
TABLE 24 EUROPE THIRD-PARTY OWNED IN BATTERY ENERGY STORAGE SYSTEM MARKET, BY REGION, 2018-2032, (THOUSAND UNITS)
TABLE 25 EUROPE UTILITY-OWNED IN BATTERY ENERGY STORAGE SYSTEM MARKET, BY REGION, 2018-2032, (USD THOUSAND)
TABLE 26 EUROPE UTILITY-OWNED IN BATTERY ENERGY STORAGE SYSTEM MARKET, BY REGION, 2018-2032, (THOUSAND UNITS)
TABLE 27 EUROPE BATTERY ENERGY STORAGE SYSTEM MARKET: BY ENERGY CAPACITY, 2018-2032 (USD THOUSAND)
TABLE 28 EUROPE BATTERY ENERGY STORAGE SYSTEM MARKET: BY ENERGY CAPACITY, 2018-2032 (THOUSAND UNITS)
TABLE 29 EUROPE BATTERY ENERGY STORAGE SYSTEM MARKET: BY ENERGY CAPACITY, 2018-2032 (USD/UNIT)
TABLE 30 EUROPE ABOVE 500 MWH IN BATTERY ENERGY STORAGE SYSTEM MARKET, BY REGION, 2018-2032, (USD THOUSAND)
TABLE 31 EUROPE ABOVE 500 MWH IN BATTERY ENERGY STORAGE SYSTEM MARKET, BY REGION, 2018-2032, (THOUSAND UNITS)
TABLE 32 EUROPE BETWEEN 100 AND 500 MWH IN BATTERY ENERGY STORAGE SYSTEM MARKET, BY REGION, 2018-2032, (USD THOUSAND)
TABLE 33 EUROPE BETWEEN 100 AND 500 MWH IN BATTERY ENERGY STORAGE SYSTEM MARKET, BY REGION, 2018-2032, (THOUSAND UNITS)
TABLE 34 EUROPE BELOW 100 MWH IN BATTERY ENERGY STORAGE SYSTEM MARKET, BY REGION, 2018-2032, (USD THOUSAND)
TABLE 35 EUROPE BELOW 100 MWH IN BATTERY ENERGY STORAGE SYSTEM MARKET, BY REGION, 2018-2032, (THOUSAND UNITS)
TABLE 36 EUROPE BATTERY ENERGY STORAGE SYSTEM MARKET: BY APPLICATION, 2018-2032 (USD THOUSAND)
TABLE 37 EUROPE BATTERY ENERGY STORAGE SYSTEM MARKET: BY APPLICATION, 2018-2032 (THOUSAND UNITS)
TABLE 38 EUROPE BATTERY ENERGY STORAGE SYSTEM MARKET: BY APPLICATION, 2018-2032 (USD/UNIT)
TABLE 39 EUROPE RESIDENTIAL IN BATTERY ENERGY STORAGE SYSTEM MARKET, BY REGION, 2018-2032, (USD THOUSAND)
TABLE 40 EUROPE RESIDENTIAL IN BATTERY ENERGY STORAGE SYSTEM MARKET, BY REGION, 2018-2032, (THOUSAND UNITS)
TABLE 41 EUROPE NON-RESIDENTIAL IN BATTERY ENERGY STORAGE SYSTEM MARKET, BY REGION, 2018-2032, (USD THOUSAND)
TABLE 42 EUROPE NON-RESIDENTIAL IN BATTERY ENERGY STORAGE SYSTEM MARKET, BY REGION, 2018-2032, (THOUSAND UNITS)
TABLE 43 EUROPE UTILITIES IN BATTERY ENERGY STORAGE SYSTEM MARKET, BY REGION, 2018-2032, (USD THOUSAND)
TABLE 44 EUROPE UTILITIES IN BATTERY ENERGY STORAGE SYSTEM MARKET, BY REGION, 2018-2032, (THOUSAND UNITS)
TABLE 45 EUROPE MILITARY & DEFENSE IN BATTERY ENERGY STORAGE SYSTEM MARKET, BY REGION, 2018-2032, (USD THOUSAND)
TABLE 46 EUROPE MILITARY & DEFENSE IN BATTERY ENERGY STORAGE SYSTEM MARKET, BY REGION, 2018-2032, (THOUSAND UNITS)
TABLE 47 EUROPE REMOTE & OFF-GRID AREAS IN BATTERY ENERGY STORAGE SYSTEM MARKET, BY REGION, 2018-2032, (USD THOUSAND)
TABLE 48 EUROPE REMOTE & OFF-GRID AREAS IN BATTERY ENERGY STORAGE SYSTEM MARKET, BY REGION, 2018-2032, (THOUSAND UNITS)
TABLE 49 EUROPE OTHERS AREAS IN BATTERY ENERGY STORAGE SYSTEM MARKET, BY REGION, 2018-2032, (USD THOUSAND)
TABLE 50 EUROPE OTHERS AREAS IN BATTERY ENERGY STORAGE SYSTEM MARKET, BY REGION, 2018-2032, (THOUSAND UNITS)
TABLE 51 EUROPE BATTERY ENERGY STORAGE SYSTEM MARKET, BY COUNTRY, 2018-2032 (USD THOUSAND)
TABLE 52 EUROPE BATTERY ENERGY STORAGE SYSTEM MARKET, BY COUNTRY, 2018-2032 (THOUSAND UNITS)
TABLE 53 EUROPE BATTERY ENERGY STORAGE SYSTEM MARKET, BY COUNTRY, 2018-2032 (USD/ UNIT)
TABLE 54 EUROPE BATTERY ENERGY STORAGE SYSTEM MARKET, BY ELEMENT, 2018-2032 (USD THOUSAND)
TABLE 55 EUROPE BATTERY ENERGY STORAGE SYSTEM MARKET, BY ELEMENT, 2018-2032 (THOUSAND UNITS)
TABLE 56 EUROPE BATTERY ENERGY STORAGE SYSTEM MARKET, BY ELEMENT, 2018-2032 (USD/ UNIT)
TABLE 57 EUROPE BATTERY IN BATTERY ENERGY STORAGE SYSTEM MARKET, BY ELEMENT, 2018-2032 (USD THOUSAND)
TABLE 58 EUROPE BATTERY IN BATTERY ENERGY STORAGE SYSTEM MARKET, BY ELEMENT, 2018-2032 (THOUSAND UNITS)
TABLE 59 EUROPE BATTERY IN BATTERY ENERGY STORAGE SYSTEM MARKET, BY ELEMENT, 2018-2032 (USD/ UNIT)
TABLE 60 EUROPE BATTERY ENERGY STORAGE SYSTEM MARKET, BY CONNECTION TYPE, 2018-2032 (USD THOUSAND)
TABLE 61 EUROPE BATTERY ENERGY STORAGE SYSTEM MARKET, BY CONNECTION TYPE, 2018-2032 (THOUSAND UNITS)
TABLE 62 EUROPE BATTERY ENERGY STORAGE SYSTEM MARKET, BY CONNECTION TYPE, 2018-2032 (USD/ UNIT)
TABLE 63 EUROPE BATTERY ENERGY STORAGE SYSTEM MARKET, BY OWNERSHIP, 2018-2032 (USD THOUSAND)
TABLE 64 EUROPE BATTERY ENERGY STORAGE SYSTEM MARKET, BY OWNERSHIP, 2018-2032 (THOUSAND UNITS)
TABLE 65 EUROPE BATTERY ENERGY STORAGE SYSTEM MARKET, BY OWNERSHIP, 2018-2032 (USD/ UNIT)
TABLE 66 EUROPE BATTERY ENERGY STORAGE SYSTEM MARKET, BY ENERGY CAPACITY, 2018-2032 (USD THOUSAND)
TABLE 67 EUROPE BATTERY ENERGY STORAGE SYSTEM MARKET, BY ENERGY CAPACITY, 2018-2032 (THOUSAND UNITS)
TABLE 68 EUROPE BATTERY ENERGY STORAGE SYSTEM MARKET, BY ENERGY CAPACITY, 2018-2032 (USD/ UNIT)
TABLE 69 EUROPE BATTERY ENERGY STORAGE SYSTEM MARKET, BY APPLICATION, 2018-2032 (USD THOUSAND)
TABLE 70 EUROPE BATTERY ENERGY STORAGE SYSTEM MARKET, BY APPLICATION, 2018-2032 (THOUSAND UNITS)
TABLE 71 EUROPE BATTERY ENERGY STORAGE SYSTEM MARKET, BY APPLICATION, 2018-2032 (USD/ UNIT)
TABLE 72 GERMANY BATTERY ENERGY STORAGE SYSTEM MARKET, BY ELEMENT, 2018-2032 (USD THOUSAND)
TABLE 73 GERMANY BATTERY ENERGY STORAGE SYSTEM MARKET, BY ELEMENT, 2018-2032 (THOUSAND UNITS)
TABLE 74 GERMANY BATTERY ENERGY STORAGE SYSTEM MARKET, BY ELEMENT, 2018-2032 (USD/ UNIT)
TABLE 75 GERMANY BATTERY IN BATTERY ENERGY STORAGE SYSTEM MARKET, BY ELEMENT, 2018-2032 (USD THOUSAND)
TABLE 76 GERMANY BATTERY IN BATTERY ENERGY STORAGE SYSTEM MARKET, BY ELEMENT, 2018-2032 (THOUSAND UNITS)
TABLE 77 GERMANY BATTERY IN BATTERY ENERGY STORAGE SYSTEM MARKET, BY ELEMENT, 2018-2032 (USD/ UNIT)
TABLE 78 GERMANY BATTERY ENERGY STORAGE SYSTEM MARKET, BY CONNECTION TYPE, 2018-2032 (USD THOUSAND)
TABLE 79 GERMANY BATTERY ENERGY STORAGE SYSTEM MARKET, BY CONNECTION TYPE, 2018-2032 (THOUSAND UNITS)
TABLE 80 GERMANY BATTERY ENERGY STORAGE SYSTEM MARKET, BY CONNECTION TYPE, 2018-2032 (USD/ UNIT)
TABLE 81 GERMANY BATTERY ENERGY STORAGE SYSTEM MARKET, BY OWNERSHIP, 2018-2032 (USD THOUSAND)
TABLE 82 GERMANY BATTERY ENERGY STORAGE SYSTEM MARKET, BY OWNERSHIP, 2018-2032 (THOUSAND UNITS)
TABLE 83 GERMANY BATTERY ENERGY STORAGE SYSTEM MARKET, BY OWNERSHIP, 2018-2032 (USD/ UNIT)
TABLE 84 GERMANY BATTERY ENERGY STORAGE SYSTEM MARKET, BY ENERGY CAPACITY, 2018-2032 (USD THOUSAND)
TABLE 85 GERMANY BATTERY ENERGY STORAGE SYSTEM MARKET, BY ENERGY CAPACITY, 2018-2032 (THOUSAND UNITS)
TABLE 86 GERMANY BATTERY ENERGY STORAGE SYSTEM MARKET, BY ENERGY CAPACITY, 2018-2032 (USD/ UNIT)
TABLE 87 GERMANY BATTERY ENERGY STORAGE SYSTEM MARKET, BY APPLICATION, 2018-2032 (USD THOUSAND)
TABLE 88 GERMANY BATTERY ENERGY STORAGE SYSTEM MARKET, BY APPLICATION, 2018-2032 (THOUSAND UNITS)
TABLE 89 GERMANY BATTERY ENERGY STORAGE SYSTEM MARKET, BY APPLICATION, 2018-2032 (USD/ UNIT)
TABLE 90 FRANCE BATTERY ENERGY STORAGE SYSTEM MARKET, BY ELEMENT, 2018-2032 (USD THOUSAND)
TABLE 91 FRANCE BATTERY ENERGY STORAGE SYSTEM MARKET, BY ELEMENT, 2018-2032 (THOUSAND UNITS)
TABLE 92 FRANCE BATTERY ENERGY STORAGE SYSTEM MARKET, BY ELEMENT, 2018-2032 (USD/ UNIT)
TABLE 93 FRANCE BATTERY IN BATTERY ENERGY STORAGE SYSTEM MARKET, BY ELEMENT, 2018-2032 (USD THOUSAND)
TABLE 94 FRANCE BATTERY IN BATTERY ENERGY STORAGE SYSTEM MARKET, BY ELEMENT, 2018-2032 (THOUSAND UNITS)
TABLE 95 FRANCE BATTERY IN BATTERY ENERGY STORAGE SYSTEM MARKET, BY ELEMENT, 2018-2032 (USD/ UNIT)
TABLE 96 FRANCE BATTERY ENERGY STORAGE SYSTEM MARKET, BY CONNECTION TYPE, 2018-2032 (USD THOUSAND)
TABLE 97 FRANCE BATTERY ENERGY STORAGE SYSTEM MARKET, BY CONNECTION TYPE, 2018-2032 (THOUSAND UNITS)
TABLE 98 FRANCE BATTERY ENERGY STORAGE SYSTEM MARKET, BY CONNECTION TYPE, 2018-2032 (USD/ UNIT)
TABLE 99 FRANCE BATTERY ENERGY STORAGE SYSTEM MARKET, BY OWNERSHIP, 2018-2032 (USD THOUSAND)
TABLE 100 FRANCE BATTERY ENERGY STORAGE SYSTEM MARKET, BY OWNERSHIP, 2018-2032 (THOUSAND UNITS)
TABLE 101 FRANCE BATTERY ENERGY STORAGE SYSTEM MARKET, BY OWNERSHIP, 2018-2032 (USD/ UNIT)
TABLE 102 FRANCE BATTERY ENERGY STORAGE SYSTEM MARKET, BY ENERGY CAPACITY, 2018-2032 (USD THOUSAND)
TABLE 103 FRANCE BATTERY ENERGY STORAGE SYSTEM MARKET, BY ENERGY CAPACITY, 2018-2032 (THOUSAND UNITS)
TABLE 104 FRANCE BATTERY ENERGY STORAGE SYSTEM MARKET, BY ENERGY CAPACITY, 2018-2032 (USD/ UNIT)
TABLE 105 FRANCE BATTERY ENERGY STORAGE SYSTEM MARKET, BY APPLICATION, 2018-2032 (USD THOUSAND)
TABLE 106 FRANCE BATTERY ENERGY STORAGE SYSTEM MARKET, BY APPLICATION, 2018-2032 (THOUSAND UNITS)
TABLE 107 FRANCE BATTERY ENERGY STORAGE SYSTEM MARKET, BY APPLICATION, 2018-2032 (USD/ UNIT)
TABLE 108 U.K. BATTERY ENERGY STORAGE SYSTEM MARKET, BY ELEMENT, 2018-2032 (USD THOUSAND)
TABLE 109 U.K. BATTERY ENERGY STORAGE SYSTEM MARKET, BY ELEMENT, 2018-2032 (THOUSAND UNITS)
TABLE 110 U.K. BATTERY ENERGY STORAGE SYSTEM MARKET, BY ELEMENT, 2018-2032 (USD/ UNIT)
TABLE 111 U.K. BATTERY IN BATTERY ENERGY STORAGE SYSTEM MARKET, BY ELEMENT, 2018-2032 (USD THOUSAND)
TABLE 112 U.K. BATTERY IN BATTERY ENERGY STORAGE SYSTEM MARKET, BY ELEMENT, 2018-2032 (THOUSAND UNITS)
TABLE 113 U.K. BATTERY IN BATTERY ENERGY STORAGE SYSTEM MARKET, BY ELEMENT, 2018-2032 (USD/ UNIT)
TABLE 114 U.K. BATTERY ENERGY STORAGE SYSTEM MARKET, BY CONNECTION TYPE, 2018-2032 (USD THOUSAND)
TABLE 115 U.K. BATTERY ENERGY STORAGE SYSTEM MARKET, BY CONNECTION TYPE, 2018-2032 (THOUSAND UNITS)
TABLE 116 U.K. BATTERY ENERGY STORAGE SYSTEM MARKET, BY CONNECTION TYPE, 2018-2032 (USD/ UNIT)
TABLE 117 U.K. BATTERY ENERGY STORAGE SYSTEM MARKET, BY OWNERSHIP, 2018-2032 (USD THOUSAND)
TABLE 118 U.K. BATTERY ENERGY STORAGE SYSTEM MARKET, BY OWNERSHIP, 2018-2032 (THOUSAND UNITS)
TABLE 119 U.K. BATTERY ENERGY STORAGE SYSTEM MARKET, BY OWNERSHIP, 2018-2032 (USD/ UNIT)
TABLE 120 U.K. BATTERY ENERGY STORAGE SYSTEM MARKET, BY ENERGY CAPACITY, 2018-2032 (USD THOUSAND)
TABLE 121 U.K. BATTERY ENERGY STORAGE SYSTEM MARKET, BY ENERGY CAPACITY, 2018-2032 (THOUSAND UNITS)
TABLE 122 U.K. BATTERY ENERGY STORAGE SYSTEM MARKET, BY ENERGY CAPACITY, 2018-2032 (USD/ UNIT)
TABLE 123 U.K. BATTERY ENERGY STORAGE SYSTEM MARKET, BY APPLICATION, 2018-2032 (USD THOUSAND)
TABLE 124 U.K. BATTERY ENERGY STORAGE SYSTEM MARKET, BY APPLICATION, 2018-2032 (THOUSAND UNITS)
TABLE 125 U.K. BATTERY ENERGY STORAGE SYSTEM MARKET, BY APPLICATION, 2018-2032 (USD/ UNIT)
TABLE 126 SPAIN BATTERY ENERGY STORAGE SYSTEM MARKET, BY ELEMENT, 2018-2032 (USD THOUSAND)
TABLE 127 SPAIN BATTERY ENERGY STORAGE SYSTEM MARKET, BY ELEMENT, 2018-2032 (THOUSAND UNITS)
TABLE 128 SPAIN BATTERY ENERGY STORAGE SYSTEM MARKET, BY ELEMENT, 2018-2032 (USD/ UNIT)
TABLE 129 SPAIN BATTERY IN BATTERY ENERGY STORAGE SYSTEM MARKET, BY ELEMENT, 2018-2032 (USD THOUSAND)
TABLE 130 SPAIN BATTERY IN BATTERY ENERGY STORAGE SYSTEM MARKET, BY ELEMENT, 2018-2032 (THOUSAND UNITS)
TABLE 131 SPAIN BATTERY IN BATTERY ENERGY STORAGE SYSTEM MARKET, BY ELEMENT, 2018-2032 (USD/ UNIT)
TABLE 132 SPAIN BATTERY ENERGY STORAGE SYSTEM MARKET, BY CONNECTION TYPE, 2018-2032 (USD THOUSAND)
TABLE 133 SPAIN BATTERY ENERGY STORAGE SYSTEM MARKET, BY CONNECTION TYPE, 2018-2032 (THOUSAND UNITS)
TABLE 134 SPAIN BATTERY ENERGY STORAGE SYSTEM MARKET, BY CONNECTION TYPE, 2018-2032 (USD/ UNIT)
TABLE 135 SPAIN BATTERY ENERGY STORAGE SYSTEM MARKET, BY OWNERSHIP, 2018-2032 (USD THOUSAND)
TABLE 136 SPAIN BATTERY ENERGY STORAGE SYSTEM MARKET, BY OWNERSHIP, 2018-2032 (THOUSAND UNITS)
TABLE 137 SPAIN BATTERY ENERGY STORAGE SYSTEM MARKET, BY OWNERSHIP, 2018-2032 (USD/ UNIT)
TABLE 138 SPAIN BATTERY ENERGY STORAGE SYSTEM MARKET, BY ENERGY CAPACITY, 2018-2032 (USD THOUSAND)
TABLE 139 SPAIN BATTERY ENERGY STORAGE SYSTEM MARKET, BY ENERGY CAPACITY, 2018-2032 (THOUSAND UNITS)
TABLE 140 SPAIN BATTERY ENERGY STORAGE SYSTEM MARKET, BY ENERGY CAPACITY, 2018-2032 (USD/ UNIT)
TABLE 141 SPAIN BATTERY ENERGY STORAGE SYSTEM MARKET, BY APPLICATION, 2018-2032 (USD THOUSAND)
TABLE 142 SPAIN BATTERY ENERGY STORAGE SYSTEM MARKET, BY APPLICATION, 2018-2032 (THOUSAND UNITS)
TABLE 143 SPAIN BATTERY ENERGY STORAGE SYSTEM MARKET, BY APPLICATION, 2018-2032 (USD/ UNIT)
TABLE 144 ITALY BATTERY ENERGY STORAGE SYSTEM MARKET, BY ELEMENT, 2018-2032 (USD THOUSAND)
TABLE 145 ITALY BATTERY ENERGY STORAGE SYSTEM MARKET, BY ELEMENT, 2018-2032 (THOUSAND UNITS)
TABLE 146 ITALY BATTERY ENERGY STORAGE SYSTEM MARKET, BY ELEMENT, 2018-2032 (USD/ UNIT)
TABLE 147 ITALY BATTERY IN BATTERY ENERGY STORAGE SYSTEM MARKET, BY ELEMENT, 2018-2032 (USD THOUSAND)
TABLE 148 ITALY BATTERY IN BATTERY ENERGY STORAGE SYSTEM MARKET, BY ELEMENT, 2018-2032 (THOUSAND UNITS)
TABLE 149 ITALY BATTERY IN BATTERY ENERGY STORAGE SYSTEM MARKET, BY ELEMENT, 2018-2032 (USD/ UNIT)
TABLE 150 ITALY BATTERY ENERGY STORAGE SYSTEM MARKET, BY CONNECTION TYPE, 2018-2032 (USD THOUSAND)
TABLE 151 ITALY BATTERY ENERGY STORAGE SYSTEM MARKET, BY CONNECTION TYPE, 2018-2032 (THOUSAND UNITS)
TABLE 152 ITALY BATTERY ENERGY STORAGE SYSTEM MARKET, BY CONNECTION TYPE, 2018-2032 (USD/ UNIT)
TABLE 153 ITALY BATTERY ENERGY STORAGE SYSTEM MARKET, BY OWNERSHIP, 2018-2032 (USD THOUSAND)
TABLE 154 ITALY BATTERY ENERGY STORAGE SYSTEM MARKET, BY OWNERSHIP, 2018-2032 (THOUSAND UNITS)
TABLE 155 ITALY BATTERY ENERGY STORAGE SYSTEM MARKET, BY OWNERSHIP, 2018-2032 (USD/ UNIT)
TABLE 156 ITALY BATTERY ENERGY STORAGE SYSTEM MARKET, BY ENERGY CAPACITY, 2018-2032 (USD THOUSAND)
TABLE 157 ITALY BATTERY ENERGY STORAGE SYSTEM MARKET, BY ENERGY CAPACITY, 2018-2032 (THOUSAND UNITS)
TABLE 158 ITALY BATTERY ENERGY STORAGE SYSTEM MARKET, BY ENERGY CAPACITY, 2018-2032 (USD/ UNIT)
TABLE 159 ITALY BATTERY ENERGY STORAGE SYSTEM MARKET, BY APPLICATION, 2018-2032 (USD THOUSAND)
TABLE 160 ITALY BATTERY ENERGY STORAGE SYSTEM MARKET, BY APPLICATION, 2018-2032 (THOUSAND UNITS)
TABLE 161 ITALY BATTERY ENERGY STORAGE SYSTEM MARKET, BY APPLICATION, 2018-2032 (USD/ UNIT)
TABLE 162 TURKEY BATTERY ENERGY STORAGE SYSTEM MARKET, BY ELEMENT, 2018-2032 (USD THOUSAND)
TABLE 163 TURKEY BATTERY ENERGY STORAGE SYSTEM MARKET, BY ELEMENT, 2018-2032 (THOUSAND UNITS)
TABLE 164 TURKEY BATTERY ENERGY STORAGE SYSTEM MARKET, BY ELEMENT, 2018-2032 (USD/ UNIT)
TABLE 165 TURKEY BATTERY IN BATTERY ENERGY STORAGE SYSTEM MARKET, BY ELEMENT, 2018-2032 (USD THOUSAND)
TABLE 166 TURKEY BATTERY IN BATTERY ENERGY STORAGE SYSTEM MARKET, BY ELEMENT, 2018-2032 (THOUSAND UNITS)
TABLE 167 TURKEY BATTERY IN BATTERY ENERGY STORAGE SYSTEM MARKET, BY ELEMENT, 2018-2032 (USD/ UNIT)
TABLE 168 TURKEY BATTERY ENERGY STORAGE SYSTEM MARKET, BY CONNECTION TYPE, 2018-2032 (USD THOUSAND)
TABLE 169 TURKEY BATTERY ENERGY STORAGE SYSTEM MARKET, BY CONNECTION TYPE, 2018-2032 (THOUSAND UNITS)
TABLE 170 TURKEY BATTERY ENERGY STORAGE SYSTEM MARKET, BY CONNECTION TYPE, 2018-2032 (USD/ UNIT)
TABLE 171 TURKEY BATTERY ENERGY STORAGE SYSTEM MARKET, BY OWNERSHIP, 2018-2032 (USD THOUSAND)
TABLE 172 TURKEY BATTERY ENERGY STORAGE SYSTEM MARKET, BY OWNERSHIP, 2018-2032 (THOUSAND UNITS)
TABLE 173 TURKEY BATTERY ENERGY STORAGE SYSTEM MARKET, BY OWNERSHIP, 2018-2032 (USD/ UNIT)
TABLE 174 TURKEY BATTERY ENERGY STORAGE SYSTEM MARKET, BY ENERGY CAPACITY, 2018-2032 (USD THOUSAND)
TABLE 175 TURKEY BATTERY ENERGY STORAGE SYSTEM MARKET, BY ENERGY CAPACITY, 2018-2032 (THOUSAND UNITS)
TABLE 176 TURKEY BATTERY ENERGY STORAGE SYSTEM MARKET, BY ENERGY CAPACITY, 2018-2032 (USD/ UNIT)
TABLE 177 TURKEY BATTERY ENERGY STORAGE SYSTEM MARKET, BY APPLICATION, 2018-2032 (USD THOUSAND)
TABLE 178 TURKEY BATTERY ENERGY STORAGE SYSTEM MARKET, BY APPLICATION, 2018-2032 (THOUSAND UNITS)
TABLE 179 TURKEY BATTERY ENERGY STORAGE SYSTEM MARKET, BY APPLICATION, 2018-2032 (USD/ UNIT)
TABLE 180 DENMARK BATTERY ENERGY STORAGE SYSTEM MARKET, BY ELEMENT, 2018-2032 (USD THOUSAND)
TABLE 181 DENMARK BATTERY ENERGY STORAGE SYSTEM MARKET, BY ELEMENT, 2018-2032 (THOUSAND UNITS)
TABLE 182 DENMARK BATTERY ENERGY STORAGE SYSTEM MARKET, BY ELEMENT, 2018-2032 (USD/ UNIT)
TABLE 183 DENMARK BATTERY IN BATTERY ENERGY STORAGE SYSTEM MARKET, BY ELEMENT, 2018-2032 (USD THOUSAND)
TABLE 184 DENMARK BATTERY IN BATTERY ENERGY STORAGE SYSTEM MARKET, BY ELEMENT, 2018-2032 (THOUSAND UNITS)
TABLE 185 DENMARK BATTERY IN BATTERY ENERGY STORAGE SYSTEM MARKET, BY ELEMENT, 2018-2032 (USD/ UNIT)
TABLE 186 DENMARK BATTERY ENERGY STORAGE SYSTEM MARKET, BY CONNECTION TYPE, 2018-2032 (USD THOUSAND)
TABLE 187 DENMARK BATTERY ENERGY STORAGE SYSTEM MARKET, BY CONNECTION TYPE, 2018-2032 (THOUSAND UNITS)
TABLE 188 DENMARK BATTERY ENERGY STORAGE SYSTEM MARKET, BY CONNECTION TYPE, 2018-2032 (USD/ UNIT)
TABLE 189 DENMARK BATTERY ENERGY STORAGE SYSTEM MARKET, BY OWNERSHIP, 2018-2032 (USD THOUSAND)
TABLE 190 DENMARK BATTERY ENERGY STORAGE SYSTEM MARKET, BY OWNERSHIP, 2018-2032 (THOUSAND UNITS)
TABLE 191 DENMARK BATTERY ENERGY STORAGE SYSTEM MARKET, BY OWNERSHIP, 2018-2032 (USD/ UNIT)
TABLE 192 DENMARK BATTERY ENERGY STORAGE SYSTEM MARKET, BY ENERGY CAPACITY, 2018-2032 (USD THOUSAND)
TABLE 193 DENMARK BATTERY ENERGY STORAGE SYSTEM MARKET, BY ENERGY CAPACITY, 2018-2032 (THOUSAND UNITS)
TABLE 194 DENMARK BATTERY ENERGY STORAGE SYSTEM MARKET, BY ENERGY CAPACITY, 2018-2032 (USD/ UNIT)
TABLE 195 DENMARK BATTERY ENERGY STORAGE SYSTEM MARKET, BY APPLICATION, 2018-2032 (USD THOUSAND)
TABLE 196 DENMARK BATTERY ENERGY STORAGE SYSTEM MARKET, BY APPLICATION, 2018-2032 (THOUSAND UNITS)
TABLE 197 DENMARK BATTERY ENERGY STORAGE SYSTEM MARKET, BY APPLICATION, 2018-2032 (USD/ UNIT)
TABLE 198 RUSSIA BATTERY ENERGY STORAGE SYSTEM MARKET, BY ELEMENT, 2018-2032 (USD THOUSAND)
TABLE 199 RUSSIA BATTERY ENERGY STORAGE SYSTEM MARKET, BY ELEMENT, 2018-2032 (THOUSAND UNITS)
TABLE 200 RUSSIA BATTERY ENERGY STORAGE SYSTEM MARKET, BY ELEMENT, 2018-2032 (USD/ UNIT)
TABLE 201 RUSSIA BATTERY IN BATTERY ENERGY STORAGE SYSTEM MARKET, BY ELEMENT, 2018-2032 (USD THOUSAND)
TABLE 202 RUSSIA BATTERY IN BATTERY ENERGY STORAGE SYSTEM MARKET, BY ELEMENT, 2018-2032 (THOUSAND UNITS)
TABLE 203 RUSSIA BATTERY IN BATTERY ENERGY STORAGE SYSTEM MARKET, BY ELEMENT, 2018-2032 (USD/ UNIT)
TABLE 204 RUSSIA BATTERY ENERGY STORAGE SYSTEM MARKET, BY CONNECTION TYPE, 2018-2032 (USD THOUSAND)
TABLE 205 RUSSIA BATTERY ENERGY STORAGE SYSTEM MARKET, BY CONNECTION TYPE, 2018-2032 (THOUSAND UNITS)
TABLE 206 RUSSIA BATTERY ENERGY STORAGE SYSTEM MARKET, BY CONNECTION TYPE, 2018-2032 (USD/ UNIT)
TABLE 207 RUSSIA BATTERY ENERGY STORAGE SYSTEM MARKET, BY OWNERSHIP, 2018-2032 (USD THOUSAND)
TABLE 208 RUSSIA BATTERY ENERGY STORAGE SYSTEM MARKET, BY OWNERSHIP, 2018-2032 (THOUSAND UNITS)
TABLE 209 RUSSIA BATTERY ENERGY STORAGE SYSTEM MARKET, BY OWNERSHIP, 2018-2032 (USD/ UNIT)
TABLE 210 RUSSIA BATTERY ENERGY STORAGE SYSTEM MARKET, BY ENERGY CAPACITY, 2018-2032 (USD THOUSAND)
TABLE 211 RUSSIA BATTERY ENERGY STORAGE SYSTEM MARKET, BY ENERGY CAPACITY, 2018-2032 (THOUSAND UNITS)
TABLE 212 RUSSIA BATTERY ENERGY STORAGE SYSTEM MARKET, BY ENERGY CAPACITY, 2018-2032 (USD/ UNIT)
TABLE 213 RUSSIA BATTERY ENERGY STORAGE SYSTEM MARKET, BY APPLICATION, 2018-2032 (USD THOUSAND)
TABLE 214 RUSSIA BATTERY ENERGY STORAGE SYSTEM MARKET, BY APPLICATION, 2018-2032 (THOUSAND UNITS)
TABLE 215 RUSSIA BATTERY ENERGY STORAGE SYSTEM MARKET, BY APPLICATION, 2018-2032 (USD/ UNIT)
TABLE 216 NETHERLANDS BATTERY ENERGY STORAGE SYSTEM MARKET, BY ELEMENT, 2018-2032 (USD THOUSAND)
TABLE 217 NETHERLANDS BATTERY ENERGY STORAGE SYSTEM MARKET, BY ELEMENT, 2018-2032 (THOUSAND UNITS)
TABLE 218 NETHERLANDS BATTERY ENERGY STORAGE SYSTEM MARKET, BY ELEMENT, 2018-2032 (USD/ UNIT)
TABLE 219 NETHERLANDS BATTERY IN BATTERY ENERGY STORAGE SYSTEM MARKET, BY ELEMENT, 2018-2032 (USD THOUSAND)
TABLE 220 NETHERLANDS BATTERY IN BATTERY ENERGY STORAGE SYSTEM MARKET, BY ELEMENT, 2018-2032 (THOUSAND UNITS)
TABLE 221 NETHERLANDS BATTERY IN BATTERY ENERGY STORAGE SYSTEM MARKET, BY ELEMENT, 2018-2032 (USD/ UNIT)
TABLE 222 NETHERLANDS BATTERY ENERGY STORAGE SYSTEM MARKET, BY CONNECTION TYPE, 2018-2032 (USD THOUSAND)
TABLE 223 NETHERLANDS BATTERY ENERGY STORAGE SYSTEM MARKET, BY CONNECTION TYPE, 2018-2032 (THOUSAND UNITS)
TABLE 224 NETHERLANDS BATTERY ENERGY STORAGE SYSTEM MARKET, BY CONNECTION TYPE, 2018-2032 (USD/ UNIT)
TABLE 225 NETHERLANDS BATTERY ENERGY STORAGE SYSTEM MARKET, BY OWNERSHIP, 2018-2032 (USD THOUSAND)
TABLE 226 NETHERLANDS BATTERY ENERGY STORAGE SYSTEM MARKET, BY OWNERSHIP, 2018-2032 (THOUSAND UNITS)
TABLE 227 NETHERLANDS BATTERY ENERGY STORAGE SYSTEM MARKET, BY OWNERSHIP, 2018-2032 (USD/ UNIT)
TABLE 228 NETHERLANDS BATTERY ENERGY STORAGE SYSTEM MARKET, BY ENERGY CAPACITY, 2018-2032 (USD THOUSAND)
TABLE 229 NETHERLANDS BATTERY ENERGY STORAGE SYSTEM MARKET, BY ENERGY CAPACITY, 2018-2032 (THOUSAND UNITS)
TABLE 230 NETHERLANDS BATTERY ENERGY STORAGE SYSTEM MARKET, BY ENERGY CAPACITY, 2018-2032 (USD/ UNIT)
TABLE 231 NETHERLANDS BATTERY ENERGY STORAGE SYSTEM MARKET, BY APPLICATION, 2018-2032 (USD THOUSAND)
TABLE 232 NETHERLANDS BATTERY ENERGY STORAGE SYSTEM MARKET, BY APPLICATION, 2018-2032 (THOUSAND UNITS)
TABLE 233 NETHERLANDS BATTERY ENERGY STORAGE SYSTEM MARKET, BY APPLICATION, 2018-2032 (USD/ UNIT)
TABLE 234 NORWAY BATTERY ENERGY STORAGE SYSTEM MARKET, BY ELEMENT, 2018-2032 (USD THOUSAND)
TABLE 235 NORWAY BATTERY ENERGY STORAGE SYSTEM MARKET, BY ELEMENT, 2018-2032 (THOUSAND UNITS)
TABLE 236 NORWAY BATTERY ENERGY STORAGE SYSTEM MARKET, BY ELEMENT, 2018-2032 (USD/ UNIT)
TABLE 237 NORWAY BATTERY IN BATTERY ENERGY STORAGE SYSTEM MARKET, BY ELEMENT, 2018-2032 (USD THOUSAND)
TABLE 238 NORWAY BATTERY IN BATTERY ENERGY STORAGE SYSTEM MARKET, BY ELEMENT, 2018-2032 (THOUSAND UNITS)
TABLE 239 NORWAY BATTERY IN BATTERY ENERGY STORAGE SYSTEM MARKET, BY ELEMENT, 2018-2032 (USD/ UNIT)
TABLE 240 NORWAY BATTERY ENERGY STORAGE SYSTEM MARKET, BY CONNECTION TYPE, 2018-2032 (USD THOUSAND)
TABLE 241 NORWAY BATTERY ENERGY STORAGE SYSTEM MARKET, BY CONNECTION TYPE, 2018-2032 (THOUSAND UNITS)
TABLE 242 NORWAY BATTERY ENERGY STORAGE SYSTEM MARKET, BY CONNECTION TYPE, 2018-2032 (USD/ UNIT)
TABLE 243 NORWAY BATTERY ENERGY STORAGE SYSTEM MARKET, BY OWNERSHIP, 2018-2032 (USD THOUSAND)
TABLE 244 NORWAY BATTERY ENERGY STORAGE SYSTEM MARKET, BY OWNERSHIP, 2018-2032 (THOUSAND UNITS)
TABLE 245 NORWAY BATTERY ENERGY STORAGE SYSTEM MARKET, BY OWNERSHIP, 2018-2032 (USD/ UNIT)
TABLE 246 NORWAY BATTERY ENERGY STORAGE SYSTEM MARKET, BY ENERGY CAPACITY, 2018-2032 (USD THOUSAND)
TABLE 247 NORWAY BATTERY ENERGY STORAGE SYSTEM MARKET, BY ENERGY CAPACITY, 2018-2032 (THOUSAND UNITS)
TABLE 248 NORWAY BATTERY ENERGY STORAGE SYSTEM MARKET, BY ENERGY CAPACITY, 2018-2032 (USD/ UNIT)
TABLE 249 NORWAY BATTERY ENERGY STORAGE SYSTEM MARKET, BY APPLICATION, 2018-2032 (USD THOUSAND)
TABLE 250 NORWAY BATTERY ENERGY STORAGE SYSTEM MARKET, BY APPLICATION, 2018-2032 (THOUSAND UNITS)
TABLE 251 NORWAY BATTERY ENERGY STORAGE SYSTEM MARKET, BY APPLICATION, 2018-2032 (USD/ UNIT)
TABLE 252 POLAND BATTERY ENERGY STORAGE SYSTEM MARKET, BY ELEMENT, 2018-2032 (USD THOUSAND)
TABLE 253 POLAND BATTERY ENERGY STORAGE SYSTEM MARKET, BY ELEMENT, 2018-2032 (THOUSAND UNITS)
TABLE 254 POLAND BATTERY ENERGY STORAGE SYSTEM MARKET, BY ELEMENT, 2018-2032 (USD/ UNIT)
TABLE 255 POLAND BATTERY IN BATTERY ENERGY STORAGE SYSTEM MARKET, BY ELEMENT, 2018-2032 (USD THOUSAND)
TABLE 256 POLAND BATTERY IN BATTERY ENERGY STORAGE SYSTEM MARKET, BY ELEMENT, 2018-2032 (THOUSAND UNITS)
TABLE 257 POLAND BATTERY IN BATTERY ENERGY STORAGE SYSTEM MARKET, BY ELEMENT, 2018-2032 (USD/ UNIT)
TABLE 258 POLAND BATTERY ENERGY STORAGE SYSTEM MARKET, BY CONNECTION TYPE, 2018-2032 (USD THOUSAND)
TABLE 259 POLAND BATTERY ENERGY STORAGE SYSTEM MARKET, BY CONNECTION TYPE, 2018-2032 (THOUSAND UNITS)
TABLE 260 POLAND BATTERY ENERGY STORAGE SYSTEM MARKET, BY CONNECTION TYPE, 2018-2032 (USD/ UNIT)
TABLE 261 POLAND BATTERY ENERGY STORAGE SYSTEM MARKET, BY OWNERSHIP, 2018-2032 (USD THOUSAND)
TABLE 262 POLAND BATTERY ENERGY STORAGE SYSTEM MARKET, BY OWNERSHIP, 2018-2032 (THOUSAND UNITS)
TABLE 263 POLAND BATTERY ENERGY STORAGE SYSTEM MARKET, BY OWNERSHIP, 2018-2032 (USD/ UNIT)
TABLE 264 POLAND BATTERY ENERGY STORAGE SYSTEM MARKET, BY ENERGY CAPACITY, 2018-2032 (USD THOUSAND)
TABLE 265 POLAND BATTERY ENERGY STORAGE SYSTEM MARKET, BY ENERGY CAPACITY, 2018-2032 (THOUSAND UNITS)
TABLE 266 POLAND BATTERY ENERGY STORAGE SYSTEM MARKET, BY ENERGY CAPACITY, 2018-2032 (USD/ UNIT)
TABLE 267 POLAND BATTERY ENERGY STORAGE SYSTEM MARKET, BY APPLICATION, 2018-2032 (USD THOUSAND)
TABLE 268 POLAND BATTERY ENERGY STORAGE SYSTEM MARKET, BY APPLICATION, 2018-2032 (THOUSAND UNITS)
TABLE 269 POLAND BATTERY ENERGY STORAGE SYSTEM MARKET, BY APPLICATION, 2018-2032 (USD/ UNIT)
TABLE 270 REST OF EUROPE BATTERY ENERGY STORAGE SYSTEM MARKET, BY ELEMENT, 2018-2032 (USD THOUSAND)
TABLE 271 REST OF EUROPE BATTERY ENERGY STORAGE SYSTEM MARKET, BY ELEMENT, 2018-2032 (THOUSAND UNITS)
TABLE 272 REST OF EUROPE BATTERY ENERGY STORAGE SYSTEM MARKET, BY ELEMENT, 2018-2032 (USD/ UNIT)
List of Figure
FIGURE 1 EUROPE BATTERY ENERGY STORAGE SYSTEM MARKET
FIGURE 2 EUROPE BATTERY ENERGY STORAGE SYSTEM MARKET: DATA TRIANGULATION
FIGURE 3 EUROPE BATTERY ENERGY STORAGE SYSTEM MARKET: DROC ANALYSIS
FIGURE 4 EUROPE BATTERY ENERGY STORAGE SYSTEM MARKET: REGIONAL MARKET ANALYSIS
FIGURE 5 EUROPE BATTERY ENERGY STORAGE SYSTEM MARKET: COMPANY RESEARCH ANALYSIS
FIGURE 6 EUROPE BATTERY ENERGY STORAGE SYSTEM MARKET: MULTIVARIATE MODELLING
FIGURE 7 EUROPE BATTERY ENERGY STORAGE SYSTEM MARKET: INTERVIEW DEMOGRAPHICS
FIGURE 8 EUROPE BATTERY ENERGY STORAGE SYSTEM MARKET: DBMR MARKET POSITION GRID
FIGURE 9 EUROPE BATTERY ENERGY STORAGE SYSTEM MARKET: VENDOR SHARE ANALYSIS
FIGURE 10 MARKET APPLICATION COVERAGE GRID
FIGURE 11 EUROPE BATTERY ENERGY STORAGE SYSTEM MARKET: SEGMENTATION
FIGURE 12 EXECUTIVE SUMMARY
FIGURE 13 TWO SEGMENTS COMPRISE THE EUROPE BATTERY ENERGY STORAGE SYSTEM MARKET, BY ELEMENT (2024)
FIGURE 14 STRATEGIC DECISIONS
FIGURE 15 EUROPE BATTERY ENERGY STORAGE SYSTEM MARKET: REGIONAL ANALYSIS
FIGURE 16 GROWING INDUSTRIAL AUTOMATION ENHANCES DEMAND FOR SYNCHRONOUS MOTORS GLOBALLY IS EXPECTED TO DRIVE THE EUROPE BATTERY ENERGY STORAGE SYSTEM MARKET IN THE FORECAST PERIOD (2025-2032)
FIGURE 17 THE BATTERY SEGMENT IS EXPECTED TO ACCOUNT FOR THE LARGEST SHARE OF THE EUROPE BATTERY ENERGY STORAGE SYSTEM MARKET IN 2025 AND 2032
FIGURE 19 PESTEL ANALYSIS
FIGURE 20 PORTER’S FIVE FORCES ANALYSIS
FIGURE 21 DRIVERS, RESTRAINTS, OPPORTUNITIES, AND CHALLENGES OF THE EUROPE BATTERY ENERGY STORAGE SYSTEM MARKET
FIGURE 22 EUROPE BATTERY ENERGY STORAGE SYSTEM MARKET, BY ELEMENT, 2024
FIGURE 23 EUROPE BATTERY ENERGY STORAGE SYSTEM MARKET, BY CONNECTION TYPE, 2024
FIGURE 24 EUROPE BATTERY ENERGY STORAGE SYSTEM MARKET, BY OWNERSHIP, 2024
FIGURE 25 EUROPE BATTERY ENERGY STORAGE SYSTEM MARKET, BY ENERGY CAPACITY, 2024
FIGURE 26 EUROPE BATTERY ENERGY STORAGE SYSTEM MARKET: BY APPLICATION, 2024
FIGURE 27 EUROPE BATTERY ENERGY STORAGE SYSTEM MARKET: SNAPSHOT (2024)
FIGURE 28 EUROPE BATTERY ENERGY STORAGE SYSTEM MARKET: COMPANY SHARE 2024 (%)
Europe Battery Energy Storage System Market, Supply Chain Analysis and Ecosystem Framework
To support market growth and help clients navigate the impact of geopolitical shifts, DBMR has integrated in-depth supply chain analysis into its Europe Battery Energy Storage System Market research reports. This addition empowers clients to respond effectively to global changes affecting their industries. The supply chain analysis section includes detailed insights such as Europe Battery Energy Storage System Market consumption and production by country, price trend analysis, the impact of tariffs and geopolitical developments, and import and export trends by country and HSN code. It also highlights major suppliers with data on production capacity and company profiles, as well as key importers and exporters. In addition to research, DBMR offers specialized supply chain consulting services backed by over a decade of experience, providing solutions like supplier discovery, supplier risk assessment, price trend analysis, impact evaluation of inflation and trade route changes, and comprehensive market trend analysis.
Data collection and base year analysis are done using data collection modules with large sample sizes. The stage includes obtaining market information or related data through various sources and strategies. It includes examining and planning all the data acquired from the past in advance. It likewise envelops the examination of information inconsistencies seen across different information sources. The market data is analysed and estimated using market statistical and coherent models. Also, market share analysis and key trend analysis are the major success factors in the market report. To know more, please request an analyst call or drop down your inquiry.
The key research methodology used by DBMR research team is data triangulation which involves data mining, analysis of the impact of data variables on the market and primary (industry expert) validation. Data models include Vendor Positioning Grid, Market Time Line Analysis, Market Overview and Guide, Company Positioning Grid, Patent Analysis, Pricing Analysis, Company Market Share Analysis, Standards of Measurement, Global versus Regional and Vendor Share Analysis. To know more about the research methodology, drop in an inquiry to speak to our industry experts.
Data Bridge Market Research is a leader in advanced formative research. We take pride in servicing our existing and new customers with data and analysis that match and suits their goal. The report can be customized to include price trend analysis of target brands understanding the market for additional countries (ask for the list of countries), clinical trial results data, literature review, refurbished market and product base analysis. Market analysis of target competitors can be analyzed from technology-based analysis to market portfolio strategies. We can add as many competitors that you require data about in the format and data style you are looking for. Our team of analysts can also provide you data in crude raw excel files pivot tables (Fact book) or can assist you in creating presentations from the data sets available in the report.


