
Europe Dental Aligners Market
Market Size in USD Million
CAGR :
% 
 USD
2.13 Million
USD
6.72 Million
2025
2033
USD
2.13 Million
USD
6.72 Million
2025
2033
| 2026 –2033 | |
| USD 2.13 Million | |
| USD 6.72 Million | |
| % | |
|
Europe Dental Aligners Market Size
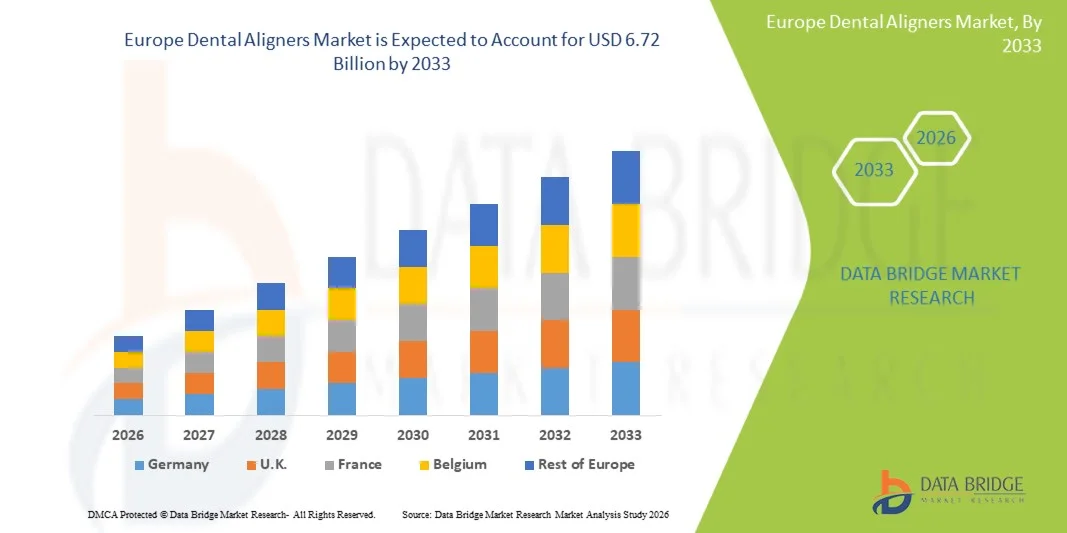
- The Europe Dental Aligners Market was valued at USD 2.13 Billion in 2025 and is expected to reach USD 6.72 Billion by 2033
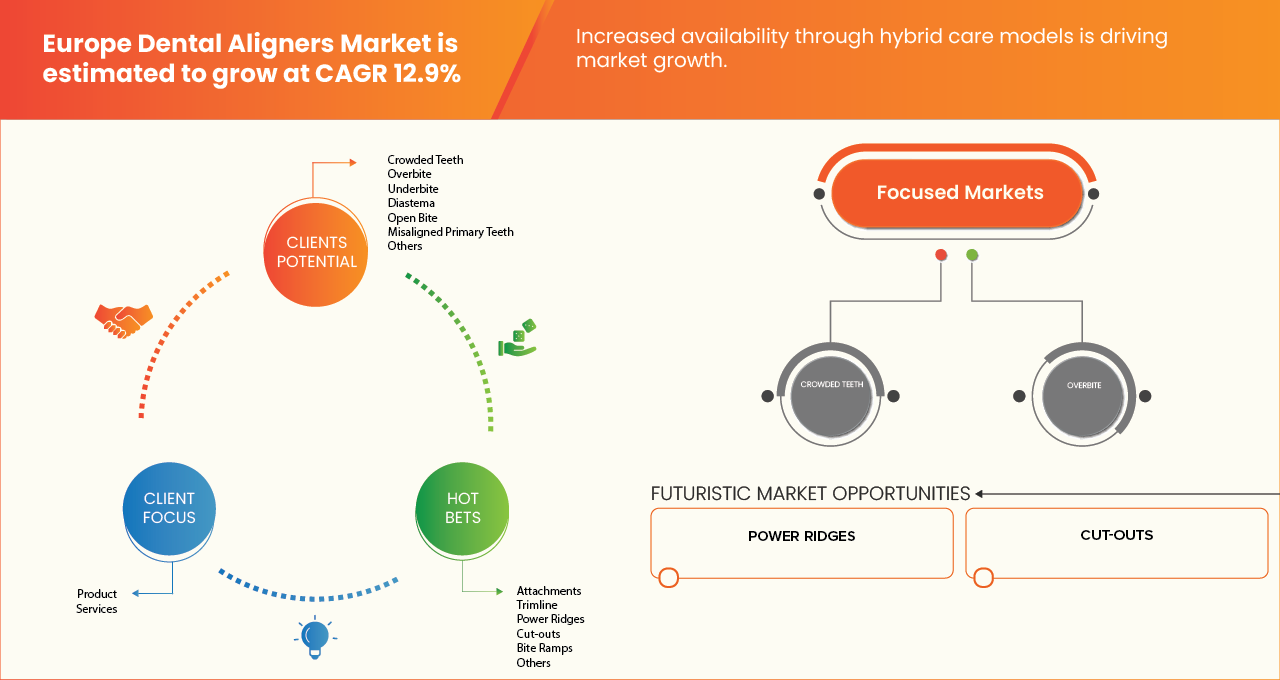
- During the forecast period of 2026 to 2033 the market is likely to grow at a CAGR of 12.9%, supported primarily by rising aesthetic awareness, increasing adult orthodontic adoption, and growing preference for clear, removable aligners over traditional braces.
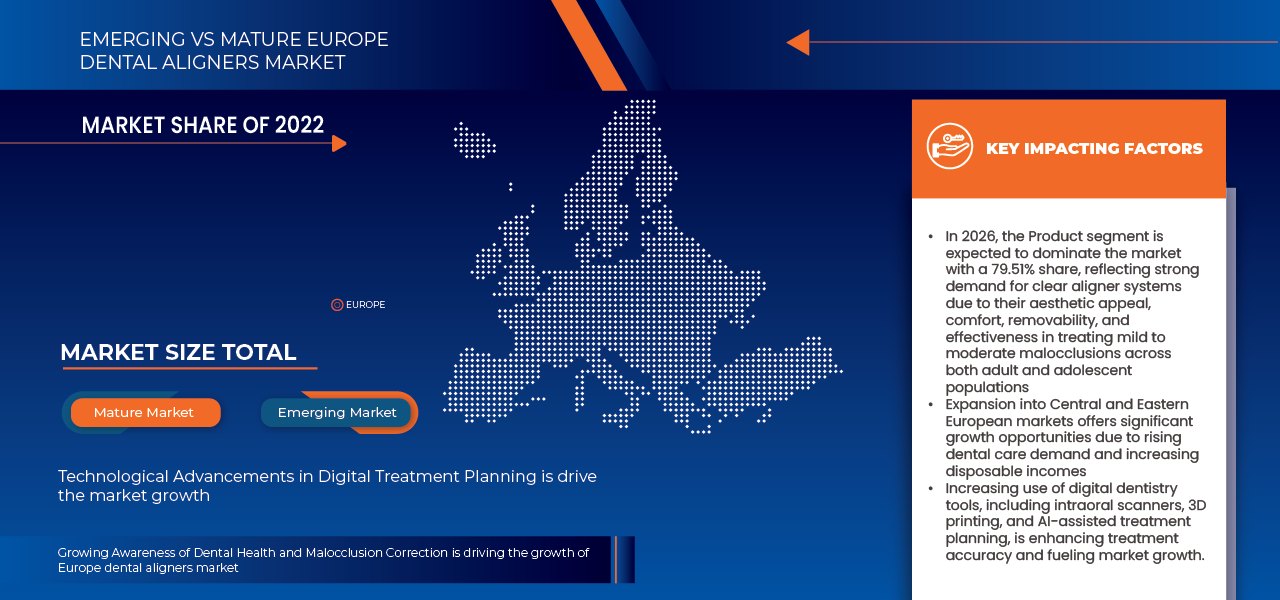
- Additionally, advancements in digital dentistry, 3D printing technologies, and expanding availability of direct-to-consumer and clinic-based aligner solutions—supported by favorable reimbursement trends and strong dental infrastructure—continue to reinforce steady market growth across Europe.
Europe Dental Aligners Market Analysis
- The Europe Dental Aligners Market is advancing rapidly as manufacturers and dental service providers adopt digital dentistry, AI-driven treatment planning, and automated aligner manufacturing to improve efficiency, treatment accuracy, and patient engagement. Technologies such as 3D scanning, CAD/CAM modeling, and automated thermoforming are increasingly shaping aligner production across orthodontic clinics and dental labs.
- These innovations are strengthening the regional value chain by reducing treatment time, minimizing manual errors, improving case predictability, and enabling scalable, cost-efficient production. AI-based simulation tools, digital workflows, and cloud-based case management platforms support faster turnaround times and consistent aligner quality for clinics and DTC providers.
- Germany is expected to dominate the Europe Dental Aligners Market with the largest revenue share of 20.08% in 2026, supported by strong dental infrastructure, high adoption of advanced orthodontic technologies, and significant investments in digital healthcare and precision manufacturing.
- The U.K. is projected to be the fastest-growing market, registering a CAGR of 16.6%, driven by rising adult orthodontic demand, increasing acceptance of cosmetic dentistry, and expanding availability of direct-to-consumer and clinic-based aligner solutions.
- In 2026, the Product segment is expected to dominate the market with a 79.51% share, reflecting strong demand for clear aligner systems due to their aesthetic appeal, comfort, removability, and effectiveness in treating mild to moderate malocclusions across both adult and adolescent populations.
Report Scope and Europe Dental Aligners Market Segmentation
|
Attributes |
Europe Dental Aligners Key Market Insights |
|
Segments Covered |
|
|
Countries Covered |
Europe
|
|
Key Market Players |
|
|
Market Opportunities |
|
|
Value Added Data Infosets |
In addition to the insights on, and major players, the market reports curated by the Data market scenarios such as market value, growth rate, segmentation, geographical coverage Bridge Market Research also include porter’s five forces, Epidemiology, company evaluation quadrant, pricing analysis, production capacity of key manufacturers, climate change scenario, industry ecosystem analysis, brand outlook, consumer buying behaviour, cost analysis breakdown, innovation tracker and strategic analysis, patent analysis, profit margins scenario, raw material coverage, supply chain analysis, technological advancements, value chain analysis, vendor selection criteria, current tariff impact on the market, regulatory coverage. |
Europe Dental Aligners Market Trends
“Expansion Into Central and Eastern European Markets”
- Expansion into Central and Eastern European markets presents a significant growth opportunity for the orthodontic sector, particularly in the adoption of clear aligner therapy. These regions, including countries such as Poland, Hungary, the Czech Republic, and Romania, exhibit rising disposable incomes, growing awareness of dental health, and increasing demand for cosmetic and corrective dental treatments. Despite lower market penetration compared to Western Europe, the combination of improving healthcare infrastructure, enhanced access to dental services, and a younger, urbanizing population is creating favorable conditions for orthodontic providers to introduce advanced treatment solutions. Strategic market entry in these regions allows companies to capitalize on unmet demand and expand their European footprint.
- As presented in Frontiers in Public Health in January 2025, a study on healthcare service networks in Hungary demonstrated that the development of integrated dental clusters is improving access to preventive and corrective dental care, thereby creating opportunities for increased adoption of clear aligners in Central Europe.
- As reported by BMC Oral Health in March 2024, a survey of young adults in Poland indicated a significant interest in clear aligner therapy, reflecting growing awareness and demand for orthodontic treatment in Central Europe.
- As evidenced by a BMC Oral Health study in May 2025, surveys in Romania revealed that rising disposable incomes and urbanization are motivating young adults to seek corrective dental treatments such as clear aligners, signaling an untapped growth potential in Eastern Europe.
- The expansion into Central and Eastern European markets presents a significant growth opportunity for the orthodontic sector. Rising awareness of dental health, increasing disposable incomes, and improving oral healthcare infrastructure are driving demand for advanced treatments, including clear aligners, in countries such as Poland, Hungary, the Czech Republic, and Romania. Despite lower market penetration compared to Western Europe, these regions exhibit strong potential due to growing urban populations and enhanced access to dental services. Strategic entry and investment in these markets allow orthodontic providers to capitalize on unmet demand, expand their European presence, and establish long-term growth in emerging Central and Eastern European regions.
Europe Dental Aligners Market Dynamics
Driver
“Increase In Prevalence of Malocclusion ”
- Occlusion refers to the alignment and contact relationship between the upper and lower teeth. Any deviation from normal alignment is termed malocclusion, a condition characterized by improper positioning of teeth and an incorrect relationship between the maxillary and mandibular dental arches. Common forms of malocclusion include overcrowding, spacing issues, overbites, underbites, and crossbites, which often lead to functional bite problems. In European patients, misalignment of upper teeth may result in cheek or lip biting, while lower dental misalignment frequently causes tongue irritation and discomfort.
- Malocclusion is widely recognized as one of the most prevalent oral conditions, following dental caries and periodontal disease. Across Europe, malocclusion is often regarded as a natural biological variation rather than a disease, with treatment decisions influenced by functional needs, long-term oral health considerations, and psychosocial factors such as facial aesthetics and self-confidence. Evidence from European studies highlights notable geographic and ethnic variations in malocclusion prevalence, reflecting differences in genetics, dietary patterns, and access to orthodontic care, which collectively support sustained demand for orthodontic and clear aligner treatments across the region.
- In 2020, according to the National Institute of Health, worldwide prevalence of malocclusion among children and adolescents was found to be 56% globally without any relevant gender difference.
- In 2020, according to the study by National Institute of Health, the prevalence of malocclusion varies from region to region and was found to be 81% in African countries and 72% in Europe, which showed highest percentages. However, prevalence rate in America was found to be 53% and was observed least in Asia (48%).
- As presented in a systematic review published in Healthcare in July 2024, malocclusion prevalence in Europe was reported at approximately 61.5 % across primary dentition studies, highlighting a consistently high burden of dental misalignments that may drive demand for orthodontic interventions including clear aligners
- The consistently high and widely reported prevalence of malocclusion across European populations highlights a sustained and structurally embedded need for orthodontic intervention. Evidence from academic and clinical studies indicates that alignment irregularities are present from early childhood and often persist into adolescence and adulthood, driven by genetic factors, dietary transitions, reduced masticatory function, and evolving craniofacial growth patterns. This widespread occurrence across both deciduous and permanent dentitions underscores malocclusion as a long-term oral health concern rather than a transient condition.
Restraint/Challenge
“High Cost of Dental Aligners ”
- Modern, technology-driven dental aligner systems enable effective correction of dental conditions such as severe crowding, spacing irregularities, and complex bite issues while preserving the aesthetic expectations of patients. In Europe, clear aligners are increasingly preferred due to their discreet appearance and compatibility with professional and social lifestyles. However, the overall cost of aligner treatment continues to vary widely across countries and care settings, reflecting differences in healthcare systems, practitioner expertise, and levels of digital adoption.
- The cost of dental aligner treatment is influenced by multiple factors, including case complexity, duration of treatment, number of refinement stages, type of aligner system used, post-treatment retention requirements, and the experience of the treating clinician. The reliance on advanced digital technologies—such as intraoral scanning, computer-aided treatment planning, and 3D printing—contributes significantly to treatment expenses. As a result, the relatively high cost of advanced orthodontic solutions, including clear aligners and customized retainers, remains a key barrier to broader adoption, particularly among price-sensitive patient segments, thereby restraining the growth potential of the Europe Dental Aligners Market.
- As reported by Aide BTS Assurance in 2025, Invisalign® clear aligner treatment in major European countries typically ranged from approximately USD 0.0016 million to USD 0.0070 million per case, depending on treatment complexity and duration, highlighting the substantial out-of-pocket financial burden on patients.
- As indicated by Dentovex Orthodontics in 2025, the cost of clear aligner therapy across Europe ranged from around USD 0.0022 million to USD 0.0065 million per patient, reflecting the relatively high expense of aesthetic orthodontic interventions
- As documented in clinic-level pricing data in March 2025, average clear aligner treatments in parts of Europe cost approximately USD 0.0016 million to USD 0.0030 million per case for standard cases, with higher charges for complex treatments, emphasizing patient financial responsibility for modern orthodontic care.
- The high cost of dental aligners continues to be a significant factor affecting adoption across Europe. Treatment expenses, influenced by case complexity, technology use, clinician expertise, and regional variations, often place a substantial out-of-pocket burden on patients, particularly for adult and cosmetic orthodontic care. Public health coverage is limited in most countries, further reinforcing the financial responsibility of patients for advanced treatments such as clear aligners, retainers, and customized orthodontic appliances

Europe Dental Aligners Market Scope
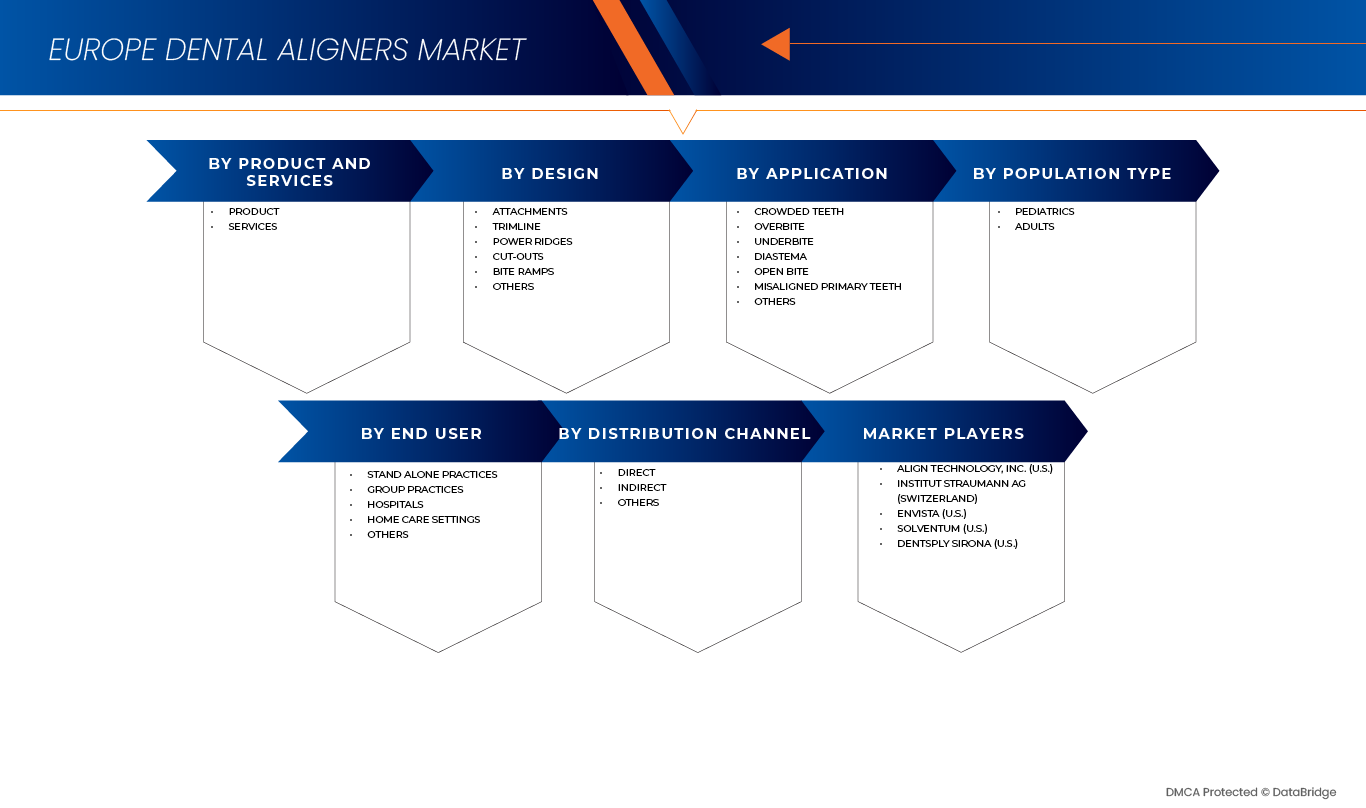
Europe Dental Aligners Market is categorized into six notable segments which are based on Product and Services, Design, Application, Population Type, End User, Distribution Channel.
- By Product and Services
On the basis of Product and Services, Europe Dental Aligners Market is segmented into Product, Services. In 2026, the Product segment is expected to dominate the market with a 79.51% market share, driven by strong demand for clear aligner systems due to their aesthetic appeal, comfort, removability, and effectiveness in treating mild to moderate malocclusions. Continuous advancements in aligner materials, 3D printing, and digital treatment planning, along with growing adoption among adult patients, further support the segment’s leadership across Europe.
The Product segment is the fastest-growing in the Europe Dental Aligners Market, with a CAGR of 15.7%, driven by rising awareness of cosmetic dentistry, increasing availability of direct-to-consumer and clinic-based aligner solutions, and expanding orthodontic service networks. Additionally, improvements in AI-driven treatment simulations, faster production cycles, and wider accessibility of customized aligners across key markets such as Germany, the U.K., France, Italy, and Spain are expected to accelerate segment growth during the forecast period.
- By Design
On the basis of Design, the Europe Dental Aligners Market is segmented into Attachments, Trimline, Power Ridges, Cut-outs, Bite Ramps, Others. In 2026, the Attachments segment is expected to dominate with a 75.66% market share, driven by their critical role in improving aligner retention, force application, and treatment precision. High clinical adoption, especially for complex tooth movements, along with increasing use of customized attachments enabled by digital treatment planning and 3D printing, continues to support the segment’s dominance across Europe.
The Attachments segment is the fastest-growing segment in the Europe Dental Aligners Market, with a CAGR of 16.4%, driven by rising demand for advanced orthodontic treatments, increasing adult patient volumes, and continuous innovation in attachment design and materials. Additionally, growing preference for minimally visible, highly effective orthodontic solutions and the expansion of digitally driven orthodontic workflows across key European markets are expected to further accelerate segment growth during the forecast period.
- By Applications
On the basis of Applications, the Europe Dental Aligners Market is segmented into Crowded Teeth, Overbite, Underbite, Diastema, Open Bite, Misaligned Primary Teeth, Others. In 2026, the Crowded Teeth segment is expected to dominate the market with 64.31% market share, driven by the high prevalence of dental crowding across adolescent and adult populations. Increasing aesthetic awareness, early orthodontic diagnosis, and strong preference for clear aligners as a discreet alternative to traditional braces are significantly supporting demand for aligner-based correction of crowded teeth.
Crowded Teeth is the fastest-growing segment with a CAGR of 16.9% in the Europe Dental Aligners Market driven by advancements in digital orthodontics, AI-based treatment planning, and improved aligner material performance. Rising adult orthodontic adoption, expanding availability of customized aligner solutions, and growing access to orthodontic care across key European markets are further accelerating growth in this application segment.
- By Population Type
On the basis of Population Type, the Europe Dental Aligners Market is segmented into Pediatrics, Adults. In 2026, the Pediatrics segment is expected to dominate the market with 63.89% market share, driven by early orthodontic screening, rising prevalence of malocclusion among children, and increasing parental awareness regarding preventive dental care. Growing acceptance of clear aligners as a comfortable and removable alternative to traditional braces is further supporting adoption within pediatric populations.
Pediatrics is the fastest-growing segment with CAGR of 15.8% in the Europe Dental Aligners Market driven by advancements in aligner materials suitable for growing dentition, improved treatment planning for mixed dentition cases, and expanding access to pediatric orthodontic services across Europe. Additionally, strong emphasis on early intervention and long-term oral health outcomes continues to accelerate demand for dental aligners in this population group.
- By End User
On the basis of end user, the Europe Dental Aligners Market is segmented into Stand Alone Practices, Group Practices, Hospitals, Home Care Settings, Others. In 2026, the Stand Alone Practices segment is expected to dominate the market with 45.35% market share, driven by their high patient volumes, strong clinician–patient relationships, and widespread adoption of clear aligner therapies in private orthodontic and dental clinics. Greater flexibility in treatment planning, faster decision-making, and direct collaboration with aligner manufacturers further support segment leadership.
Stand Alone Practices is the fastest-growing segment with CAGR of 16.2% in the Europe Dental Aligners Market driven by increasing demand for aesthetic orthodontic treatments, rising adult patient footfall, and growing integration of digital scanning, AI-based treatment planning, and in-house aligner workflows. Additionally, expanding availability of customized aligner solutions and competitive pricing strategies is expected to further accelerate adoption across private practices in Europe.
- By Distribution Channel
On the basis of distribution channel, the Europe Dental Aligners Market is segmented into direct, indirect, Others. In 2026, the direct segment is expected to dominate the market with 60.39% market share, driven by direct-to-clinic and direct-to-consumer models that enable better pricing control, faster turnaround times, and closer engagement between aligner manufacturers, dental professionals, and patients. The increasing use of digital platforms, online consultations, and remote treatment monitoring further supports the dominance of direct distribution across Europe.
Direct Tender is the fastest-growing segment with CAGR of 15.9% in the Europe Dental Aligners Market driven by rising adoption of tele-dentistry, expanding DTC aligner offerings, and growing preference for digitally enabled orthodontic care. Additionally, improved logistics, customized treatment delivery, and enhanced patient convenience are accelerating the shift toward direct distribution channels in key European markets.
Europe Dental Aligners Market Regional Analysis
- Germany is expected to dominate the Europe Dental Aligners Market with the largest revenue share of 20.08% in 2026, supported by strong investments in digital dentistry, advanced orthodontic technologies, and healthcare infrastructure modernization. High adoption of intraoral scanners, AI-driven treatment planning, and automated aligner manufacturing—combined with a well-established dental care ecosystem and high patient awareness—continues to strengthen Germany’s leadership in the regional market.
- U.K. is expected to be the fastest-growing region in the Europe Dental Aligners Market during the forecast period with a CAGR of 16.6%, fueled by rising demand for cosmetic dentistry, increasing adult orthodontic adoption, and rapid expansion of direct-to-consumer and clinic-based aligner solutions. Growing use of tele-dentistry, digital consultations, and remote treatment monitoring further supports accelerated market growth.
- Additionally, Germany’s continued focus on clinical efficiency, precision orthodontics, and adoption of sustainable, patient-centric dental solutions is expected to drive sustained expansion of the Europe Dental Aligners Market across the region.
France Europe Dental Aligners Market Insight
The France Europe Dental Aligners Market holds a significant position within the European landscape, driven by rising awareness of aesthetic dentistry, increasing adult orthodontic adoption, and strong penetration of digital dental technologies. Growing availability of clear aligner treatments through private clinics and expanding use of digital scanning and AI-based treatment planning are enhancing patient access and treatment efficiency. Additionally, supportive healthcare infrastructure and increasing preference for minimally invasive orthodontic solutions continue to reinforce France’s role in the regional Europe Dental Aligners Market.
Italy Europe Dental Aligners Market Insight
The Italy Europe Dental Aligners Market is expected to grow steadily, supported by increasing demand for cosmetic dentistry, rising orthodontic treatments among adults, and gradual adoption of digital orthodontic workflows. Investments in modern dental clinics, improved access to customized aligner solutions, and growing awareness of oral aesthetics are driving market expansion. Furthermore, expanding private dental practices and increasing acceptance of clear aligners as an alternative to traditional braces are contributing to sustained growth across the country.
The Major Market Leaders Operating in the Market Are:
- Align Technology, Inc. (U.S.),
- Dentaurum GmbH & Co. KG (Germany)
- Straight Teeth Direct (U.K.)
- ODS Aligners (India)
- DB Orthodontics Limited (U.K.)
- Wondersmile (Australia)
- Clear Moves Aligners (U.S.)
- Dentsply Sirona (U.S.)
- TP Orthodontics, Inc. (U.S.)
- Orthocaps (Germany)
- Angel Aligner (U.S.)
- ALIGNERCO. (U.S.)
- Solventum (U.S.),
- Ormco Corporation (U.S.)
- SMILE2IMPRESS SL (Spain)
- Institut Straumann AG (Switzerland),
- K Line Europe GmbH (Germany)
- Shanghai Smartee Denti-Technology Co., Ltd. (China)
- ALS Dental (Spain)
- BioSAF IN s.r.l. (Italy)
- TrioClear (Netherlands)
Latest Developments in Europe Dental Aligners
- In December 2025, Align Technology announced the commercial availability in Thailand of the Invisalign System with mandibular advancement featuring occlusal blocks. Designed for Class II skeletal and dental correction in children and teenagers, the solution simultaneously advances the mandible while aligning teeth. Integrated occlusal blocks enhance durability, engagement, and vertical opening, enabling earlier mandibular advancement and improved treatment efficiency.
- In October 2025, Straumann Group announced a strategic transformation of its orthodontics business centered on its ClearCorrect clear aligner brand. The initiative includes new partnerships with Smartee and DentalMonitoring to accelerate innovation, improve product development, and enhance clinical workflows. Straumann will transfer ClearCorrect aligner manufacturing for EMEA and APAC regions to Smartee’s facilities to boost operational efficiency, while an AI-powered remote monitoring solution with DentalMonitoring will be piloted in late 2025 and rolled out globally in 2026 to improve treatment supervision and patient experience.
- In November 2022, Ormco has launched Spark Clear Aligners Release 13, introducing significant clinical and software enhancements designed to improve orthodontic diagnosis, treatment planning, and workflow efficiency. Release 13 incorporates three major innovations: Integrated Hooks, which are built directly into the aligners to provide a durable alternative to traditional elastic cutouts for Class II, Class III, and gummy smile corrections; the CBCT TruRoot™ Feature, enabling clinicians to replace generic library root models with a patient’s actual root anatomy from cone beam computed tomography (CBCT) scans for more precise visualization and movement planning; and Real Time Approval in the Spark Approver software, allowing orthodontists to add, modify, or delete aligner features such as attachments, ramps, and hooks without needing change requests, thereby streamlining the approval process and reducing turnaround time. These enhancements collectively provide clinicians with greater control, flexibility, and efficiency throughout the aligner treatment process.
- On March 8, 2024, 3M’s Board of Directors formally approved the planned spin-off of its Health Care business into a newly independent public company, Solventum Corporation, marking a strategic milestone in the company’s ongoing portfolio transformation. Under the approved plan, 3M shareholders of record as of March 18, 2024 will receive one share of Solventum common stock for every four shares of 3M common stock held, with the distribution scheduled to occur prior to the opening of trading on April 1, 2024.
- In October 2023, Dentsply Sirona announced the launch of the SureSmile Simulator, a new application within its DS Core digital platform designed to help dental professionals show patients a 3D visualization of their potential smile outcome with SureSmile® Aligner treatment before therapy begins. This tool uses AI-driven modeling and intraoral scans (e.g., from Primescan) to create visual simulations in just minutes, enabling clearer communication about treatment expectations and helping patients make more confident, informed decisions about starting aligner therapy.
SKU-
Get online access to the report on the World's First Market Intelligence Cloud

- Interactive Data Analysis Dashboard
- Company Analysis Dashboard for high growth potential opportunities
- Research Analyst Access for customization & queries
- Competitor Analysis with Interactive dashboard
- Latest News, Updates & Trend analysis
- Harness the Power of Benchmark Analysis for Comprehensive Competitor Tracking
Table of Content
1 INTRODUCTION
1.1 OBJECTIVES OF THE STUDY
1.2 MARKET DEFINITION
1.3 OVERVIEW OF EUROPE DENTAL ALIGNERS MARKET
1.4 LIMITATIONS
1.5 MARKETS COVERED
2 MARKET SEGMENTATION
2.1 MARKETS COVERED
2.2 GEOGRAPHICAL SCOPE
2.3 YEARS CONSIDERED FOR THE STUDY
2.4 CURRENCY AND PRICING
2.5 DBMR TRIPOD DATA VALIDATION MODEL
2.6 MULTIVARIATE MODELLING
2.7 PRIMARY INTERVIEWS WITH KEY OPINION LEADERS
2.8 DBMR MARKET POSITION GRID
2.9 MARKET APPLICATION COVERAGE GRID
2.1 VENDOR SHARE ANALYSIS
2.11 SECONDARY SOURCES
2.12 ASSUMPTIONS
3 EXECUTIVE SUMMARY
4 PREMIUM INSIGHTS
4.1 PORTER’S FIVE FORCES
4.1.1 THREAT OF NEW ENTRANTS
4.1.2 BARGAINING POWER OF SUPPLIERS
4.1.3 BARGAINING POWER OF BUYERS
4.1.4 THREAT OF SUBSTITUTES
4.1.5 COMPETITIVE RIVALRY
4.2 PATENT ANALYSIS
4.2.1 PATENT QUALITY AND STRENGTH
4.2.2 PATENT FAMILIES
4.2.3 LICENSING AND COLLABORATIONS
4.2.4 REGION PATENT LANDSCAPE
4.2.5 IP STRATEGY AND MANAGEMENT
4.3 CONSUMER BUYING BEHAVIOR
4.3.1 INTRODUCTION
4.3.1.1 SHIFT TOWARD AESTHETICS, COMFORT, AND CONVENIENCE
4.3.1.2 GROWING RELIANCE ON PROFESSIONAL ASSURANCE AND CLINICAL VALIDATION
4.3.1.3 PRICE SENSITIVITY AND FLEXIBLE FINANCING
4.3.1.4 IMPACT OF DIGITAL ENGAGEMENT AND ONLINE PRESENCE
4.3.1.5 IMPORTANCE OF SUPPLY RELIABILITY AND TREATMENT CONTINUITY
4.3.1.6 ROLE OF VALUE-ADDED SERVICES
4.3.1.7 SUSTAINABILITY, ETHICAL PRACTICES, AND PREMIUM PREFERENCES
4.3.1.8 INFLUENCE OF LIFESTYLE AND SOCIAL FACTORS
4.3.2 CONCLUSION
4.4 TECHNOLOGICAL ADVANCEMENTS
4.4.1 OVERVIEW
4.4.1.1 DIGITAL TREATMENT PLANNING AND AI-DRIVEN SIMULATION
4.4.1.2 ADVANCED 3D SCANNING AND IMAGING TECHNOLOGIES
4.4.1.3 INNOVATIONS IN ALIGNER MATERIALS
4.4.1.4 AUTOMATED AND SCALABLE 3D PRINTING MANUFACTURING
4.4.1.5 INTEGRATION OF DIGITAL WORKFLOW ECOSYSTEMS
4.4.1.6 REMOTE MONITORING AND TELEDENTISTRY
4.4.1.7 DATA SECURITY AND REGULATORY-COMPLIANT DIGITAL SYSTEMS
4.4.2 CONCLUSION
4.5 VENDOR SELECTION CRITERIA
4.5.1 PRODUCT QUALITY AND CLINICAL PERFORMANCE
4.5.2 REGULATORY COMPLIANCE AND RISK MANAGEMENT
4.5.3 DIGITAL INFRASTRUCTURE AND INNOVATION CAPABILITY
4.5.4 MANUFACTURING RELIABILITY AND SCALABILITY
4.5.5 SUSTAINABILITY AND ETHICAL MANUFACTURING
4.5.6 CLINICAL TRAINING AND TECHNICAL SUPPORT
4.5.7 PRICING AND TOTAL VALUE PROPOSITION
4.5.8 BRAND REPUTATION AND MARKET CREDIBILITY
4.5.9 CONCLUSION
4.6 PRICING ANALYSIS
4.6.1 PERCEIVED VALUE AND PRICING POSITIONING
4.6.2 PRICING DRIVERS AND MARKET EXPECTATIONS
4.6.3 COMPETITIVE IMPACTS ON PRICING
4.6.4 GEOGRAPHIC PERCEPTION AND CULTURAL CONTEXT
4.6.5 IMPACT OF OUT-OF-POCKET PAYMENT CULTURE
4.6.6 STRATEGIC PRICING APPROACHES BY PROVIDERS
4.6.7 QUALITATIVE IMPACT ON ADOPTION AND MARKET GROWTH
4.7 INNOVATION TRACKER AND STRATEGIC ANALYSIS
4.7.1 MAJOR DEALS AND STRATEGIC ALLIANCES ANALYSIS
4.7.1.1 JOINT VENTURES
4.7.1.2 MERGERS AND ACQUISITIONS
4.7.1.3 LICENSING AND STRATEGIC PARTNERSHIPS
4.7.1.4 TECHNOLOGY COLLABORATIONS
4.7.1.5 STRATEGIC DIVESTMENTS
4.7.2 NUMBER OF PRODUCTS IN DEVELOPMENT
4.7.3 STAGE OF DEVELOPMENT
4.7.4 TIMELINES AND MILESTONES
4.7.5 INNOVATION STRATEGIES AND METHODOLOGIES
4.7.6 RISK ASSESSMENT AND MITIGATION
4.7.7 FUTURE OUTLOOK
4.8 VALUE CHAIN ANALYSIS
4.8.1 RAW MATERIAL & FEEDSTOCK SUPPLY (5%–10%)
4.8.1.1 THERMOPLASTIC RESIN SUPPLIERS (POLYURETHANE, PETG)
4.8.1.2 DENTAL SILICONE & BIOPOLYMER PRODUCERS
4.8.1.3 3D PRINTING FILAMENT PROVIDERS
4.8.2 MANUFACTURING & PROCESSING (15%–25%)
4.8.2.1 DENTAL ALIGNER MANUFACTURERS (CUSTOMIZED PRODUCTION)
4.8.2.2 3D PRINTING & CAD/CAM SERVICE PROVIDERS
4.8.2.3 ORTHODONTIC LABORATORIES
4.8.2.4 MATERIAL PROCESSING TECHNOLOGY PROVIDERS
4.8.3 DISTRIBUTION & LOGISTICS (30%–40%)
4.8.3.1 DENTAL DISTRIBUTOR COMPANIES
4.8.3.2 WHOLESALERS
4.8.3.3 REGIONAL IMPORTERS AND EXPORTERS
4.8.3.4 COLD CHAIN & DELIVERY SERVICE PROVIDERS
4.8.3.5 INTEGRATED SUPPLY CHAIN & LOGISTICS PROVIDERS
4.8.4 END-USE INDUSTRIES & SALES CHANNELS (10%–20%)
4.8.4.1 ORTHODONTISTS & DENTAL CLINICS
4.8.4.2 DENTAL HOSPITALS
4.8.4.3 ONLINE DIRECT-TO-CONSUMER (D2C) PLATFORMS
4.8.4.4 DENTAL RETAIL CHAINS
4.8.4.5 DENTAL MARKETPLACES & B2B PLATFORMS
4.9 SUPPLY CHAIN ANALYSIS
4.9.1 RAW MATERIAL SOURCING AND PROCUREMENT
4.9.2 PROCESSING AND PRODUCT MANUFACTURING (PRODUCTION)
4.9.3 SUPPLY CHAIN AND DISTRIBUTION LOGISTICS (TRANSPORTATION)
4.9.4 RETAIL AND COMMERCIAL BUYER CHANNELS (DISTRIBUTION AND SALES)
5 TARIFFS & IMPACT ON THE MARKET
5.1 CURRENT TARIFF RATE(S)
5.2 OUTLOOK: LOCAL PRODUCTION VS IMPORT RELIANCE
5.3 VENDOR SELECTION CRITERIA DYNAMICS
5.4 IMPACT ON SUPPLY CHAIN
5.4.1 RAW MATERIAL PROCUREMENT
5.4.2 MANUFACTURING AND PRODUCTION
5.4.3 LOGISTICS AND DISTRIBUTION
5.4.4 PRICE PITCHING AND POSITION OF MARKET
5.5 INDUSTRY PARTICIPANTS: PROACTIVE MOVES
5.5.1 SUPPLY CHAIN OPTIMIZATION
5.5.2 JOINT VENTURE ESTABLISHMENTS
5.6 IMPACT ON PRICES
5.7 REGULATORY INCLINATION
5.7.1 GEOPOLITICAL SITUATION
5.7.2 TRADE PARTNERSHIPS BETWEEN COUNTRIES
5.7.2.1 FREE TRADE AGREEMENTS
5.7.2.2 ALLIANCES ESTABLISHMENTS
5.7.3 STATUS ACCREDITATION (INCLUDING MFTN)
5.7.4 DOMESTIC COURSE OF CORRECTION
5.7.4.1 INCENTIVE SCHEMES TO BOOST PRODUCTION OUTPUTS
5.7.4.2 ESTABLISHMENT OF SPECIAL ECONOMIC ZONES/INDUSTRIAL PARKS
6 REGULATION COVERAGE
6.1 PRODUCT CODES
6.2 CERTIFIED STANDARDS
6.3 SAFETY STANDARDS
6.3.1 MATERIAL HANDLING & STORAGE
6.3.2 TRANSPORT & PRECAUTIONS
6.4 HAZARD IDENTIFICATION
7 MARKET OVERVIEW
7.1 DRIVERS
7.1.1 INCREASE IN PREVALENCE OF MALOCCLUSION.
7.1.2 TECHNOLOGICAL ADVANCEMENTS IN DIGITAL TREATMENT PLANNING.
7.1.3 GROWING GPS OFFERING ORTHODONTIC SERVICES.
7.1.4 INCREASED AVAILABILITY THROUGH HYBRID CARE MODELS.
7.2 RESTRAINTS
7.2.1 HIGH COST OF DENTAL ALIGNERS
7.2.2 STRINGENT EU DEVICE REGULATIONS INCREASE COMPLIANCE BURDEN.
7.3 OPPORTUNITY
7.3.1 EXPANSION INTO CENTRAL AND EASTERN EUROPEAN MARKETS
7.3.2 INCREASING HEALTHCARE EXPENDITURE.
7.3.3 CUSTOMIZATION AND SUSTAINABILITY DRIVEN PRODUCT INNOVATIONS
7.4 CHALLENGES
7.4.1 LIMITATIONS ASSOCIATED WITH THE DENTAL ALIGNERS.
7.4.2 VARIATION IN CLINICAL TRAINING AND OUTCOME QUALITY
8 EUROPE DENTAL ALIGNERS MARKET, BY PRODUCT AND SERVICES
8.1 OVERVIEW
8.2 PRODUCT
8.2.1 CLEAR ALIGNERS
8.2.2 CERAMIC BRACES
8.2.3 CLEAR RETAINERS
8.2.4 LINGUAL BRACES
8.2.5 POLYURETHANE (PU)
8.2.6 POLYETHYLENE TEREPHTHALATE GLYCOL-MODIFIED (PET-G)
8.2.7 POLYCARBONATE (PC)
8.2.8 POLYPROPYLENE (PP)
8.2.9 OTHERS
8.2.10 POLYCRYSTALLINE ALUMINA
8.2.11 MONOCRYSTALLINE ALUMINA (SAPPHIRE)
8.2.12 ZIRCONIA-REINFORCED CERAMIC
8.2.13 CERAMIC-METAL COMPOSITE
8.2.14 POLYURETHANE (PU)
8.2.15 POLYETHYLENE TEREPHTHALATE GLYCOL-MODIFIED (PET-G)
8.2.16 POLYPROPYLENE (PP)
8.2.17 POLYCARBONATE (PC)
8.2.18 MULTILAYER THERMOPLASTIC SHEETS
8.2.19 STAINLESS STEEL
8.2.20 TITANIUM ALLOY
8.2.21 COBALT-CHROMIUM ALLOY
8.2.22 GOLD ALLOY
8.3 SERVICES
9 EUROPE DENTAL ALIGNERS MARKET, BY DESIGN
9.1 OVERVIEW
9.2 ATTACHMENTS
9.3 TRIMLINE
9.4 POWER RIDGES
9.5 CUT-OUTS
9.6 BITE RAMPS
9.7 OTHERS
10 EUROPE DENTAL ALIGNERS MARKET, BY APPLICATION
10.1 OVERVIEW
10.2 CROWDED TEETH
10.3 OVERBITE
10.4 UNDERBITE
10.5 DIASTEMA
10.6 OPEN BITE
10.7 MISALIGNED PRIMARY TEETH
10.8 OTHERS
11 EUROPE DENTAL ALIGNERS MARKET, BY POPULATION TYPE
11.1 OVERVIEW
11.2 PEDIATRICS
11.3 ADULTS
11.3.1 AT-HOME ALIGNERS
11.3.2 IN-OFFICE ALIGNERS
12 EUROPE DENTAL ALIGNERS MARKET, BY END USER
12.1 OVERVIEW
12.2 STAND ALONE PRACTICES
12.3 GROUP PRACTICES
12.4 HOSPITALS
12.5 HOME CARE SETTINGS
12.6 OTHERS
13 EUROPE DENTAL ALIGNERS MARKET, BY DISTRIBUTION CHANNEL
13.1 OVERVIEW
13.2 DIRECT TENDER
13.3 ONLINE STORES
13.4 OTHERS
14 EUROPE DENTAL ALIGNERS MARKET, BY COUNTRY
14.1 OVERVIEW
14.2 EUROPE
14.2.1 GERMANY
14.2.2 UK
14.2.3 FRANCE
14.2.4 ITALY
14.2.5 SPAIN
14.2.6 SWITZERLAND
14.2.7 RUSSIA
14.2.8 TURKEY
14.2.9 BELGIUM
14.2.10 NETHERLAND
14.2.11 DENMARK
14.2.12 NORWAY
14.2.13 FINLAND
14.2.14 SWEDEN
14.2.15 REST OF EUROPE
15 EUROPE DENTAL ALIGNERS MARKET: COMPANY LANDSCAPE
15.1 COMPANY SHARE ANALYSIS: EUROPE
16 SWOT ANALYSIS
17 COMAPANY PROFILES MANUFRACTUER
17.1 ALIGN TECHNOLOGY, INC.
17.1.1 COMPANY SNAPSHOT
17.1.2 REVENUE ANALYSIS
17.1.3 PRODUCT PORTFOLIO
17.1.4 RECENT DEVELOPMENT
17.2 INSTITUT STRAUMANN AG
17.2.1 COMPANY SNAPSHOT
17.2.2 REVENUE ANALYSIS
17.2.3 PRODUCT PORTFOLIO
17.2.4 RECENT DEVELOPMENT
17.3 ORMCO CORPORATION (SUBSIDIARY OF ENVISTA)
17.3.1 COMPANY SNAPSHOT
17.3.2 REVENUE ANALYSIS
17.3.3 PRODUCT PORTFOLIO
17.3.4 RECENT DEVELOPMENT
17.4 SOLVENTUM
17.4.1 COMPANY SNAPSHOT
17.4.2 REVENUE ANALYSIS
17.4.3 PRODUCT PORTFOLIO
17.4.4 RECENT DEVELOPMENT
17.5 DENTSPLY SIRONA
17.5.1 COMPANY SNAPSHOT
17.5.2 REVENUE ANALYSIS
17.5.3 PRODUCT PORTFOLIO
17.5.4 RECENT DEVELOPMENT
17.6 ANGEL ALIGNER
17.6.1 COMPANY SNAPSHOT
17.6.2 PRODUCT PORTFOLIO
17.6.3 RECENT DEVELOPMENT
17.7 ALIGNERCO.
17.7.1 COMPANY SNAPSHOT
17.7.2 PRODUCT PORTFOLIO
17.7.3 RECENT DEVELOPMENT
17.8 ALS DENTAL
17.8.1 COMPANY SNAPSHOT
17.8.2 PRODUCT PORTFOLIO
17.8.3 RECENT DEVELOPMENT
17.9 CLEAR MOVES ALIGNERS
17.9.1 COMPANY SNAPSHOT
17.9.2 PRODUCT PORTFOLIO
17.9.3 RECENT DEVELOPMENT
17.1 DB ORTHODONTICS LIMITED
17.10.1 COMPANY SNAPSHOT
17.10.2 PRODUCT PORTFOLIO
17.10.3 RECENT DEVELOPMENT
17.11 DENTAURAM GMBH & CO. KG
17.11.1 COMPANY SNAPSHOT
17.11.2 PRODUCT PORTFOLIO
17.11.3 RECENT DEVELOPMENT
17.12 K LINE EUROPE GMBH
17.12.1 COMPANY SNAPSHOT
17.12.2 PRODUCT PORTFOLIO
17.12.3 RECENT DEVELOPMENT
17.13 ODS ALIGNERS
17.13.1 COMPANY SNAPSHOT
17.13.2 PRODUCT PORTFOLIO
17.13.3 RECENT DEVELOPMENT
17.14 ORTHOCAPS
17.14.1 COMPANY SNAPSHOT
17.14.2 PRODUCT PORTFOLIO
17.14.3 RECENT DEVELOPMENT
17.15 SHANGHAI SMARTEE DENTI-TECHNOLOGY CO., LTD.
17.15.1 COMPANY SNAPSHOT
17.15.2 PRODUCT PORTFOLIO
17.15.3 RECENT DEVELOPMENT
17.16 SMILE2IMPRESS SL
17.16.1 COMPANY SNAPSHOT
17.16.2 PRODUCT PORTFOLIO
17.16.3 RECENT DEVELOPMENT
17.17 STRAIGHT TEETH DIRECT
17.17.1 COMPANY SNAPSHOT
17.17.2 PRODUCT PORTFOLIO
17.17.3 RECENT DEVELOPMENT
17.18 TP ORTHODONTICS, INC.
17.18.1 COMPANY SNAPSHOT
17.18.2 PRODUCT PORTFOLIO
17.18.3 RECENT DEVELOPMENT
17.19 WONDERSMILE
17.19.1 COMPANY SNAPSHOT
17.19.2 PRODUCT PORTFOLIO
17.19.3 RECENT DEVELOPMENT
18 COMAPANY PROFILES DISTRIBUTOR
18.1 BIOSAF IN S.R.L.
18.1.1 COMPANY SNAPSHOT
18.1.2 PRODUCT PORTFOLIO
18.1.3 RECENT DEVELOPMENT
18.2 DB ORTHODONTICS LIMITED
18.2.1 COMPANY SNAPSHOT
18.2.2 PRODUCT PORTFOLIO
18.2.3 RECENT DEVELOPMENT
18.3 DENTSPLY SIRONA
18.3.1 COMPANY SNAPSHOT
18.3.2 REVENUE ANALYSIS
18.3.3 PRODUCT PORTFOLIO
18.3.4 RECENT DEVELOPMENT
18.4 TRIOCLEAR
18.4.1 COMPANY SNAPSHOT
18.4.2 PRODUCT PORTFOLIO
18.4.3 RECENT DEVELOPMENT
19 QUESTIONNAIRE
20 RELATED REPORTS
List of Table
TABLE 1 CONSUMER PREFERENCE MATRIX
TABLE 2 END-TO-END SUPPLY CHAIN STRUCTURE AND VALUE FLOW
TABLE 3 EUROPE DENTAL ALIGNERS MARKET, BY PRODUCT AND SERVICES, 2018-2033 (USD THOUSAND)
TABLE 4 EUROPE PRODUCT IN DENTAL ALIGNERS MARKET, BY TYPE, 2018-2033 (USD THOUSAND)
TABLE 5 EUROPE CLEAR ALIGNERS IN DENTAL ALIGNERS MARKET, BY TYPE, 2018-2033 (USD THOUSAND)
TABLE 6 EUROPE CERAMIC BRACES IN DENTAL ALIGNERS MARKET, BY TYPE, 2018-2033 (USD THOUSAND)
TABLE 7 EUROPE CLEAR RETAINERS IN DENTAL ALIGNERS MARKET, BY TYPE, 2018-2033 (USD THOUSAND)
TABLE 8 EUROPE LINGUAL BRACES IN DENTAL ALIGNERS MARKET, BY TYPE, 2018-2033 (USD THOUSAND)
TABLE 9 EUROPE DENTAL ALIGNERS MARKET, BY DESIGN, 2018-2033 (USD THOUSAND)
TABLE 10 EUROPE DENTAL ALIGNERS MARKET, BY APPLICATIONS, 2018-2033 (USD THOUSAND)
TABLE 11 EUROPE DENTAL ALIGNERS MARKET, BY POPULATION TYPE, 2018-2033 (USD THOUSAND)
TABLE 12 EUROPE ADULTS IN DENTAL ALIGNERS MARKET, BY TYPE, 2018-2033 (USD THOUSAND)
TABLE 13 EUROPE DENTAL ALIGNERS MARKET, BY END USER, 2018-2033 (USD THOUSAND)
TABLE 14 EUROPE DENTAL ALIGNERS MARKET, BY DISTRIBUTION CHANNELS, 2018-2033 (USD THOUSAND)
TABLE 15 EUROPE DENTAL ALIGNERS MARKET, BY COUNTRY, 2018-2033 (USD THOUSAND)
TABLE 16 EUROPE DENTAL ALIGNERS MARKET, BY PRODUCT AND SERVICES, 2018-2033 (USD THOUSAND)
TABLE 17 EUROPE PRODUCT IN DENTAL ALIGNERS MARKET, BY TYPE, 2018-2033 (USD THOUSAND)
TABLE 18 EUROPE CLEAR ALIGNERS IN DENTAL ALIGNERS MARKET, BY TYPE, 2018-2033 (USD THOUSAND)
TABLE 19 EUROPE CERAMIC BRACES IN DENTAL ALIGNERS MARKET, BY TYPE, 2018-2033 (USD THOUSAND)
TABLE 20 EUROPE CLEAR RETAINERS IN DENTAL ALIGNERS MARKET, BY TYPE, 2018-2033 (USD THOUSAND)
TABLE 21 EUROPE LINGUAL BRACES IN DENTAL ALIGNERS MARKET, BY TYPE, 2018-2033 (USD THOUSAND)
TABLE 22 EUROPE DENTAL ALIGNERS MARKET, BY DESIGN, 2018-2033 (USD THOUSAND)
TABLE 23 EUROPE DENTAL ALIGNERS MARKET, BY APPLICATIONS, 2018-2033 (USD THOUSAND)
TABLE 24 EUROPE DENTAL ALIGNERS MARKET, BY POPULATION TYPE, 2018-2033 (USD THOUSAND)
TABLE 25 EUROPE ADULTS IN DENTAL ALIGNERS MARKET, BY TYPE, 2018-2033 (USD THOUSAND)
TABLE 26 EUROPE DENTAL ALIGNERS MARKET, BY END USER, 2018-2033 (USD THOUSAND)
TABLE 27 EUROPE DENTAL ALIGNERS MARKET, BY DISTRIBUTION CHANNELS, 2018-2033 (USD THOUSAND)
TABLE 28 GERMANY DENTAL ALIGNERS MARKET, BY PRODUCT AND SERVICES, 2018-2033 (USD THOUSAND)
TABLE 29 GERMANY PRODUCT IN DENTAL ALIGNERS MARKET, BY TYPE, 2018-2033 (USD THOUSAND)
TABLE 30 GERMANY CLEAR ALIGNERS IN DENTAL ALIGNERS MARKET, BY TYPE, 2018-2033 (USD THOUSAND)
TABLE 31 GERMANY CERAMIC BRACES IN DENTAL ALIGNERS MARKET, BY TYPE, 2018-2033 (USD THOUSAND)
TABLE 32 GERMANY CLEAR RETAINERS IN DENTAL ALIGNERS MARKET, BY TYPE, 2018-2033 (USD THOUSAND)
TABLE 33 GERMANY LINGUAL BRACES IN DENTAL ALIGNERS MARKET, BY TYPE, 2018-2033 (USD THOUSAND)
TABLE 34 GERMANY DENTAL ALIGNERS MARKET, BY DESIGN, 2018-2033 (USD THOUSAND)
TABLE 35 GERMANY DENTAL ALIGNERS MARKET, BY APPLICATIONS, 2018-2033 (USD THOUSAND)
TABLE 36 GERMANY DENTAL ALIGNERS MARKET, BY POPULATION TYPE, 2018-2033 (USD THOUSAND)
TABLE 37 GERMANY ADULTS IN DENTAL ALIGNERS MARKET, BY TYPE, 2018-2033 (USD THOUSAND)
TABLE 38 GERMANY DENTAL ALIGNERS MARKET, BY END USER, 2018-2033 (USD THOUSAND)
TABLE 39 GERMANY DENTAL ALIGNERS MARKET, BY DISTRIBUTION CHANNELS, 2018-2033 (USD THOUSAND)
TABLE 40 UK DENTAL ALIGNERS MARKET, BY PRODUCT AND SERVICES, 2018-2033 (USD THOUSAND)
TABLE 41 UK PRODUCT IN DENTAL ALIGNERS MARKET, BY TYPE, 2018-2033 (USD THOUSAND)
TABLE 42 UK CLEAR ALIGNERS IN DENTAL ALIGNERS MARKET, BY TYPE, 2018-2033 (USD THOUSAND)
TABLE 43 UK CERAMIC BRACES IN DENTAL ALIGNERS MARKET, BY TYPE, 2018-2033 (USD THOUSAND)
TABLE 44 UK CLEAR RETAINERS IN DENTAL ALIGNERS MARKET, BY TYPE, 2018-2033 (USD THOUSAND)
TABLE 45 UK LINGUAL BRACES IN DENTAL ALIGNERS MARKET, BY TYPE, 2018-2033 (USD THOUSAND)
TABLE 46 UK DENTAL ALIGNERS MARKET, BY DESIGN, 2018-2033 (USD THOUSAND)
TABLE 47 UK DENTAL ALIGNERS MARKET, BY APPLICATIONS, 2018-2033 (USD THOUSAND)
TABLE 48 UK DENTAL ALIGNERS MARKET, BY POPULATION TYPE, 2018-2033 (USD THOUSAND)
TABLE 49 UK ADULTS IN DENTAL ALIGNERS MARKET, BY TYPE, 2018-2033 (USD THOUSAND)
TABLE 50 UK DENTAL ALIGNERS MARKET, BY END USER, 2018-2033 (USD THOUSAND)
TABLE 51 UK DENTAL ALIGNERS MARKET, BY DISTRIBUTION CHANNELS, 2018-2033 (USD THOUSAND)
TABLE 52 FRANCE DENTAL ALIGNERS MARKET, BY PRODUCT AND SERVICES, 2018-2033 (USD THOUSAND)
TABLE 53 FRANCE PRODUCT IN DENTAL ALIGNERS MARKET, BY TYPE, 2018-2033 (USD THOUSAND)
TABLE 54 FRANCE CLEAR ALIGNERS IN DENTAL ALIGNERS MARKET, BY TYPE, 2018-2033 (USD THOUSAND)
TABLE 55 FRANCE CERAMIC BRACES IN DENTAL ALIGNERS MARKET, BY TYPE, 2018-2033 (USD THOUSAND)
TABLE 56 FRANCE CLEAR RETAINERS IN DENTAL ALIGNERS MARKET, BY TYPE, 2018-2033 (USD THOUSAND)
TABLE 57 FRANCE LINGUAL BRACES IN DENTAL ALIGNERS MARKET, BY TYPE, 2018-2033 (USD THOUSAND)
TABLE 58 FRANCE DENTAL ALIGNERS MARKET, BY DESIGN, 2018-2033 (USD THOUSAND)
TABLE 59 FRANCE DENTAL ALIGNERS MARKET, BY APPLICATIONS, 2018-2033 (USD THOUSAND)
TABLE 60 FRANCE DENTAL ALIGNERS MARKET, BY POPULATION TYPE, 2018-2033 (USD THOUSAND)
TABLE 61 FRANCE ADULTS IN DENTAL ALIGNERS MARKET, BY TYPE, 2018-2033 (USD THOUSAND)
TABLE 62 FRANCE DENTAL ALIGNERS MARKET, BY END USER, 2018-2033 (USD THOUSAND)
TABLE 63 FRANCE DENTAL ALIGNERS MARKET, BY DISTRIBUTION CHANNELS, 2018-2033 (USD THOUSAND)
TABLE 64 ITALY DENTAL ALIGNERS MARKET, BY PRODUCT AND SERVICES, 2018-2033 (USD THOUSAND)
TABLE 65 ITALY PRODUCT IN DENTAL ALIGNERS MARKET, BY TYPE, 2018-2033 (USD THOUSAND)
TABLE 66 ITALY CLEAR ALIGNERS IN DENTAL ALIGNERS MARKET, BY TYPE, 2018-2033 (USD THOUSAND)
TABLE 67 ITALY CERAMIC BRACES IN DENTAL ALIGNERS MARKET, BY TYPE, 2018-2033 (USD THOUSAND)
TABLE 68 ITALY CLEAR RETAINERS IN DENTAL ALIGNERS MARKET, BY TYPE, 2018-2033 (USD THOUSAND)
TABLE 69 ITALY LINGUAL BRACES IN DENTAL ALIGNERS MARKET, BY TYPE, 2018-2033 (USD THOUSAND)
TABLE 70 ITALY DENTAL ALIGNERS MARKET, BY DESIGN, 2018-2033 (USD THOUSAND)
TABLE 71 ITALY DENTAL ALIGNERS MARKET, BY APPLICATIONS, 2018-2033 (USD THOUSAND)
TABLE 72 ITALY DENTAL ALIGNERS MARKET, BY POPULATION TYPE, 2018-2033 (USD THOUSAND)
TABLE 73 ITALY ADULTS IN DENTAL ALIGNERS MARKET, BY TYPE, 2018-2033 (USD THOUSAND)
TABLE 74 ITALY DENTAL ALIGNERS MARKET, BY END USER, 2018-2033 (USD THOUSAND)
TABLE 75 ITALY DENTAL ALIGNERS MARKET, BY DISTRIBUTION CHANNELS, 2018-2033 (USD THOUSAND)
TABLE 76 SPAIN DENTAL ALIGNERS MARKET, BY PRODUCT AND SERVICES, 2018-2033 (USD THOUSAND)
TABLE 77 SPAIN PRODUCT IN DENTAL ALIGNERS MARKET, BY TYPE, 2018-2033 (USD THOUSAND)
TABLE 78 SPAIN CLEAR ALIGNERS IN DENTAL ALIGNERS MARKET, BY TYPE, 2018-2033 (USD THOUSAND)
TABLE 79 SPAIN CERAMIC BRACES IN DENTAL ALIGNERS MARKET, BY TYPE, 2018-2033 (USD THOUSAND)
TABLE 80 SPAIN CLEAR RETAINERS IN DENTAL ALIGNERS MARKET, BY TYPE, 2018-2033 (USD THOUSAND)
TABLE 81 SPAIN LINGUAL BRACES IN DENTAL ALIGNERS MARKET, BY TYPE, 2018-2033 (USD THOUSAND)
TABLE 82 SPAIN DENTAL ALIGNERS MARKET, BY DESIGN, 2018-2033 (USD THOUSAND)
TABLE 83 SPAIN DENTAL ALIGNERS MARKET, BY APPLICATIONS, 2018-2033 (USD THOUSAND)
TABLE 84 SPAIN DENTAL ALIGNERS MARKET, BY POPULATION TYPE, 2018-2033 (USD THOUSAND)
TABLE 85 SPAIN ADULTS IN DENTAL ALIGNERS MARKET, BY TYPE, 2018-2033 (USD THOUSAND)
TABLE 86 SPAIN DENTAL ALIGNERS MARKET, BY END USER, 2018-2033 (USD THOUSAND)
TABLE 87 SPAIN DENTAL ALIGNERS MARKET, BY DISTRIBUTION CHANNELS, 2018-2033 (USD THOUSAND)
TABLE 88 SWITZERLAND DENTAL ALIGNERS MARKET, BY PRODUCT AND SERVICES, 2018-2033 (USD THOUSAND)
TABLE 89 SWITZERLAND PRODUCT IN DENTAL ALIGNERS MARKET, BY TYPE, 2018-2033 (USD THOUSAND)
TABLE 90 SWITZERLAND CLEAR ALIGNERS IN DENTAL ALIGNERS MARKET, BY TYPE, 2018-2033 (USD THOUSAND)
TABLE 91 SWITZERLAND CERAMIC BRACES IN DENTAL ALIGNERS MARKET, BY TYPE, 2018-2033 (USD THOUSAND)
TABLE 92 SWITZERLAND CLEAR RETAINERS IN DENTAL ALIGNERS MARKET, BY TYPE, 2018-2033 (USD THOUSAND)
TABLE 93 SWITZERLAND LINGUAL BRACES IN DENTAL ALIGNERS MARKET, BY TYPE, 2018-2033 (USD THOUSAND)
TABLE 94 SWITZERLAND DENTAL ALIGNERS MARKET, BY DESIGN, 2018-2033 (USD THOUSAND)
TABLE 95 SWITZERLAND DENTAL ALIGNERS MARKET, BY APPLICATIONS, 2018-2033 (USD THOUSAND)
TABLE 96 SWITZERLAND DENTAL ALIGNERS MARKET, BY POPULATION TYPE, 2018-2033 (USD THOUSAND)
TABLE 97 SWITZERLAND ADULTS IN DENTAL ALIGNERS MARKET, BY TYPE, 2018-2033 (USD THOUSAND)
TABLE 98 SWITZERLAND DENTAL ALIGNERS MARKET, BY END USER, 2018-2033 (USD THOUSAND)
TABLE 99 SWITZERLAND DENTAL ALIGNERS MARKET, BY DISTRIBUTION CHANNELS, 2018-2033 (USD THOUSAND)
TABLE 100 RUSSIA DENTAL ALIGNERS MARKET, BY PRODUCT AND SERVICES, 2018-2033 (USD THOUSAND)
TABLE 101 RUSSIA PRODUCT IN DENTAL ALIGNERS MARKET, BY TYPE, 2018-2033 (USD THOUSAND)
TABLE 102 RUSSIA CLEAR ALIGNERS IN DENTAL ALIGNERS MARKET, BY TYPE, 2018-2033 (USD THOUSAND)
TABLE 103 RUSSIA CERAMIC BRACES IN DENTAL ALIGNERS MARKET, BY TYPE, 2018-2033 (USD THOUSAND)
TABLE 104 RUSSIA CLEAR RETAINERS IN DENTAL ALIGNERS MARKET, BY TYPE, 2018-2033 (USD THOUSAND)
TABLE 105 RUSSIA LINGUAL BRACES IN DENTAL ALIGNERS MARKET, BY TYPE, 2018-2033 (USD THOUSAND)
TABLE 106 RUSSIA DENTAL ALIGNERS MARKET, BY DESIGN, 2018-2033 (USD THOUSAND)
TABLE 107 RUSSIA DENTAL ALIGNERS MARKET, BY APPLICATIONS, 2018-2033 (USD THOUSAND)
TABLE 108 RUSSIA DENTAL ALIGNERS MARKET, BY POPULATION TYPE, 2018-2033 (USD THOUSAND)
TABLE 109 RUSSIA ADULTS IN DENTAL ALIGNERS MARKET, BY TYPE, 2018-2033 (USD THOUSAND)
TABLE 110 RUSSIA DENTAL ALIGNERS MARKET, BY END USER, 2018-2033 (USD THOUSAND)
TABLE 111 RUSSIA DENTAL ALIGNERS MARKET, BY DISTRIBUTION CHANNELS, 2018-2033 (USD THOUSAND)
TABLE 112 TURKEY DENTAL ALIGNERS MARKET, BY PRODUCT AND SERVICES, 2018-2033 (USD THOUSAND)
TABLE 113 TURKEY PRODUCT IN DENTAL ALIGNERS MARKET, BY TYPE, 2018-2033 (USD THOUSAND)
TABLE 114 TURKEY CLEAR ALIGNERS IN DENTAL ALIGNERS MARKET, BY TYPE, 2018-2033 (USD THOUSAND)
TABLE 115 TURKEY CERAMIC BRACES IN DENTAL ALIGNERS MARKET, BY TYPE, 2018-2033 (USD THOUSAND)
TABLE 116 TURKEY CLEAR RETAINERS IN DENTAL ALIGNERS MARKET, BY TYPE, 2018-2033 (USD THOUSAND)
TABLE 117 TURKEY LINGUAL BRACES IN DENTAL ALIGNERS MARKET, BY TYPE, 2018-2033 (USD THOUSAND)
TABLE 118 TURKEY DENTAL ALIGNERS MARKET, BY DESIGN, 2018-2033 (USD THOUSAND)
TABLE 119 TURKEY DENTAL ALIGNERS MARKET, BY APPLICATIONS, 2018-2033 (USD THOUSAND)
TABLE 120 TURKEY DENTAL ALIGNERS MARKET, BY POPULATION TYPE, 2018-2033 (USD THOUSAND)
TABLE 121 TURKEY ADULTS IN DENTAL ALIGNERS MARKET, BY TYPE, 2018-2033 (USD THOUSAND)
TABLE 122 TURKEY DENTAL ALIGNERS MARKET, BY END USER, 2018-2033 (USD THOUSAND)
TABLE 123 TURKEY DENTAL ALIGNERS MARKET, BY DISTRIBUTION CHANNELS, 2018-2033 (USD THOUSAND)
TABLE 124 BELGIUM DENTAL ALIGNERS MARKET, BY PRODUCT AND SERVICES, 2018-2033 (USD THOUSAND)
TABLE 125 BELGIUM PRODUCT IN DENTAL ALIGNERS MARKET, BY TYPE, 2018-2033 (USD THOUSAND)
TABLE 126 BELGIUM CLEAR ALIGNERS IN DENTAL ALIGNERS MARKET, BY TYPE, 2018-2033 (USD THOUSAND)
TABLE 127 BELGIUM CERAMIC BRACES IN DENTAL ALIGNERS MARKET, BY TYPE, 2018-2033 (USD THOUSAND)
TABLE 128 BELGIUM CLEAR RETAINERS IN DENTAL ALIGNERS MARKET, BY TYPE, 2018-2033 (USD THOUSAND)
TABLE 129 BELGIUM LINGUAL BRACES IN DENTAL ALIGNERS MARKET, BY TYPE, 2018-2033 (USD THOUSAND)
TABLE 130 BELGIUM DENTAL ALIGNERS MARKET, BY DESIGN, 2018-2033 (USD THOUSAND)
TABLE 131 BELGIUM DENTAL ALIGNERS MARKET, BY APPLICATIONS, 2018-2033 (USD THOUSAND)
TABLE 132 BELGIUM DENTAL ALIGNERS MARKET, BY POPULATION TYPE, 2018-2033 (USD THOUSAND)
TABLE 133 BELGIUM ADULTS IN DENTAL ALIGNERS MARKET, BY TYPE, 2018-2033 (USD THOUSAND)
TABLE 134 BELGIUM DENTAL ALIGNERS MARKET, BY END USER, 2018-2033 (USD THOUSAND)
TABLE 135 BELGIUM DENTAL ALIGNERS MARKET, BY DISTRIBUTION CHANNELS, 2018-2033 (USD THOUSAND)
TABLE 136 NETHERLAND DENTAL ALIGNERS MARKET, BY PRODUCT AND SERVICES, 2018-2033 (USD THOUSAND)
TABLE 137 NETHERLAND PRODUCT IN DENTAL ALIGNERS MARKET, BY TYPE, 2018-2033 (USD THOUSAND)
TABLE 138 NETHERLAND CLEAR ALIGNERS IN DENTAL ALIGNERS MARKET, BY TYPE, 2018-2033 (USD THOUSAND)
TABLE 139 NETHERLAND CERAMIC BRACES IN DENTAL ALIGNERS MARKET, BY TYPE, 2018-2033 (USD THOUSAND)
TABLE 140 NETHERLAND CLEAR RETAINERS IN DENTAL ALIGNERS MARKET, BY TYPE, 2018-2033 (USD THOUSAND)
TABLE 141 NETHERLAND LINGUAL BRACES IN DENTAL ALIGNERS MARKET, BY TYPE, 2018-2033 (USD THOUSAND)
TABLE 142 NETHERLAND DENTAL ALIGNERS MARKET, BY DESIGN, 2018-2033 (USD THOUSAND)
TABLE 143 NETHERLAND DENTAL ALIGNERS MARKET, BY APPLICATIONS, 2018-2033 (USD THOUSAND)
TABLE 144 NETHERLAND DENTAL ALIGNERS MARKET, BY POPULATION TYPE, 2018-2033 (USD THOUSAND)
TABLE 145 NETHERLAND ADULTS IN DENTAL ALIGNERS MARKET, BY TYPE, 2018-2033 (USD THOUSAND)
TABLE 146 NETHERLAND DENTAL ALIGNERS MARKET, BY END USER, 2018-2033 (USD THOUSAND)
TABLE 147 NETHERLAND DENTAL ALIGNERS MARKET, BY DISTRIBUTION CHANNELS, 2018-2033 (USD THOUSAND)
TABLE 148 DENMARK DENTAL ALIGNERS MARKET, BY PRODUCT AND SERVICES, 2018-2033 (USD THOUSAND)
TABLE 149 DENMARK PRODUCT IN DENTAL ALIGNERS MARKET, BY TYPE, 2018-2033 (USD THOUSAND)
TABLE 150 DENMARK CLEAR ALIGNERS IN DENTAL ALIGNERS MARKET, BY TYPE, 2018-2033 (USD THOUSAND)
TABLE 151 DENMARK CERAMIC BRACES IN DENTAL ALIGNERS MARKET, BY TYPE, 2018-2033 (USD THOUSAND)
TABLE 152 DENMARK CLEAR RETAINERS IN DENTAL ALIGNERS MARKET, BY TYPE, 2018-2033 (USD THOUSAND)
TABLE 153 DENMARK LINGUAL BRACES IN DENTAL ALIGNERS MARKET, BY TYPE, 2018-2033 (USD THOUSAND)
TABLE 154 DENMARK DENTAL ALIGNERS MARKET, BY DESIGN, 2018-2033 (USD THOUSAND)
TABLE 155 DENMARK DENTAL ALIGNERS MARKET, BY APPLICATIONS, 2018-2033 (USD THOUSAND)
TABLE 156 DENMARK DENTAL ALIGNERS MARKET, BY POPULATION TYPE, 2018-2033 (USD THOUSAND)
TABLE 157 DENMARK ADULTS IN DENTAL ALIGNERS MARKET, BY TYPE, 2018-2033 (USD THOUSAND)
TABLE 158 DENMARK DENTAL ALIGNERS MARKET, BY END USER, 2018-2033 (USD THOUSAND)
TABLE 159 DENMARK DENTAL ALIGNERS MARKET, BY DISTRIBUTION CHANNELS, 2018-2033 (USD THOUSAND)
TABLE 160 NORWAY DENTAL ALIGNERS MARKET, BY PRODUCT AND SERVICES, 2018-2033 (USD THOUSAND)
TABLE 161 NORWAY PRODUCT IN DENTAL ALIGNERS MARKET, BY TYPE, 2018-2033 (USD THOUSAND)
TABLE 162 NORWAY CLEAR ALIGNERS IN DENTAL ALIGNERS MARKET, BY TYPE, 2018-2033 (USD THOUSAND)
TABLE 163 NORWAY CERAMIC BRACES IN DENTAL ALIGNERS MARKET, BY TYPE, 2018-2033 (USD THOUSAND)
TABLE 164 NORWAY CLEAR RETAINERS IN DENTAL ALIGNERS MARKET, BY TYPE, 2018-2033 (USD THOUSAND)
TABLE 165 NORWAY LINGUAL BRACES IN DENTAL ALIGNERS MARKET, BY TYPE, 2018-2033 (USD THOUSAND)
TABLE 166 NORWAY DENTAL ALIGNERS MARKET, BY DESIGN, 2018-2033 (USD THOUSAND)
TABLE 167 NORWAY DENTAL ALIGNERS MARKET, BY APPLICATIONS, 2018-2033 (USD THOUSAND)
TABLE 168 NORWAY DENTAL ALIGNERS MARKET, BY POPULATION TYPE, 2018-2033 (USD THOUSAND)
TABLE 169 NORWAY ADULTS IN DENTAL ALIGNERS MARKET, BY TYPE, 2018-2033 (USD THOUSAND)
TABLE 170 NORWAY DENTAL ALIGNERS MARKET, BY END USER, 2018-2033 (USD THOUSAND)
TABLE 171 NORWAY DENTAL ALIGNERS MARKET, BY DISTRIBUTION CHANNELS, 2018-2033 (USD THOUSAND)
TABLE 172 FINLAND DENTAL ALIGNERS MARKET, BY PRODUCT AND SERVICES, 2018-2033 (USD THOUSAND)
TABLE 173 FINLAND PRODUCT IN DENTAL ALIGNERS MARKET, BY TYPE, 2018-2033 (USD THOUSAND)
TABLE 174 FINLAND CLEAR ALIGNERS IN DENTAL ALIGNERS MARKET, BY TYPE, 2018-2033 (USD THOUSAND)
TABLE 175 FINLAND CERAMIC BRACES IN DENTAL ALIGNERS MARKET, BY TYPE, 2018-2033 (USD THOUSAND)
TABLE 176 FINLAND CLEAR RETAINERS IN DENTAL ALIGNERS MARKET, BY TYPE, 2018-2033 (USD THOUSAND)
TABLE 177 FINLAND LINGUAL BRACES IN DENTAL ALIGNERS MARKET, BY TYPE, 2018-2033 (USD THOUSAND)
TABLE 178 FINLAND DENTAL ALIGNERS MARKET, BY DESIGN, 2018-2033 (USD THOUSAND)
TABLE 179 FINLAND DENTAL ALIGNERS MARKET, BY APPLICATIONS, 2018-2033 (USD THOUSAND)
TABLE 180 FINLAND DENTAL ALIGNERS MARKET, BY POPULATION TYPE, 2018-2033 (USD THOUSAND)
TABLE 181 FINLAND ADULTS IN DENTAL ALIGNERS MARKET, BY TYPE, 2018-2033 (USD THOUSAND)
TABLE 182 FINLAND DENTAL ALIGNERS MARKET, BY END USER, 2018-2033 (USD THOUSAND)
TABLE 183 FINLAND DENTAL ALIGNERS MARKET, BY DISTRIBUTION CHANNELS, 2018-2033 (USD THOUSAND)
TABLE 184 SWEDEN DENTAL ALIGNERS MARKET, BY PRODUCT AND SERVICES, 2018-2033 (USD THOUSAND)
TABLE 185 SWEDEN PRODUCT IN DENTAL ALIGNERS MARKET, BY TYPE, 2018-2033 (USD THOUSAND)
TABLE 186 SWEDEN CLEAR ALIGNERS IN DENTAL ALIGNERS MARKET, BY TYPE, 2018-2033 (USD THOUSAND)
TABLE 187 SWEDEN CERAMIC BRACES IN DENTAL ALIGNERS MARKET, BY TYPE, 2018-2033 (USD THOUSAND)
TABLE 188 SWEDEN CLEAR RETAINERS IN DENTAL ALIGNERS MARKET, BY TYPE, 2018-2033 (USD THOUSAND)
TABLE 189 SWEDEN LINGUAL BRACES IN DENTAL ALIGNERS MARKET, BY TYPE, 2018-2033 (USD THOUSAND)
TABLE 190 SWEDEN DENTAL ALIGNERS MARKET, BY DESIGN, 2018-2033 (USD THOUSAND)
TABLE 191 SWEDEN DENTAL ALIGNERS MARKET, BY APPLICATIONS, 2018-2033 (USD THOUSAND)
TABLE 192 SWEDEN DENTAL ALIGNERS MARKET, BY POPULATION TYPE, 2018-2033 (USD THOUSAND)
TABLE 193 SWEDEN ADULTS IN DENTAL ALIGNERS MARKET, BY TYPE, 2018-2033 (USD THOUSAND)
TABLE 194 SWEDEN DENTAL ALIGNERS MARKET, BY END USER, 2018-2033 (USD THOUSAND)
TABLE 195 SWEDEN DENTAL ALIGNERS MARKET, BY DISTRIBUTION CHANNELS, 2018-2033 (USD THOUSAND)
TABLE 196 REST OF EUROPE DENTAL ALIGNERS MARKET, BY PRODUCT AND SERVICES, 2018-2033 (USD THOUSAND)
TABLE 197 REST OF EUROPE PRODUCT IN DENTAL ALIGNERS MARKET, BY TYPE, 2018-2033 (USD THOUSAND)
TABLE 198 REST OF EUROPE CLEAR ALIGNERS IN DENTAL ALIGNERS MARKET, BY TYPE, 2018-2033 (USD THOUSAND)
TABLE 199 REST OF EUROPE CERAMIC BRACES IN DENTAL ALIGNERS MARKET, BY TYPE, 2018-2033 (USD THOUSAND)
TABLE 200 REST OF EUROPE CLEAR RETAINERS IN DENTAL ALIGNERS MARKET, BY TYPE, 2018-2033 (USD THOUSAND)
TABLE 201 REST OF EUROPE LINGUAL BRACES IN DENTAL ALIGNERS MARKET, BY TYPE, 2018-2033 (USD THOUSAND)
TABLE 202 REST OF EUROPE DENTAL ALIGNERS MARKET, BY DESIGN, 2018-2033 (USD THOUSAND)
TABLE 203 REST OF EUROPE DENTAL ALIGNERS MARKET, BY APPLICATIONS, 2018-2033 (USD THOUSAND)
TABLE 204 REST OF EUROPE DENTAL ALIGNERS MARKET, BY POPULATION TYPE, 2018-2033 (USD THOUSAND)
TABLE 205 REST OF EUROPE ADULTS IN DENTAL ALIGNERS MARKET, BY TYPE, 2018-2033 (USD THOUSAND)
TABLE 206 REST OF EUROPE DENTAL ALIGNERS MARKET, BY END USER, 2018-2033 (USD THOUSAND)
TABLE 207 REST OF EUROPE DENTAL ALIGNERS MARKET, BY DISTRIBUTION CHANNELS, 2018-2033 (USD THOUSAND)
List of Figure
FIGURE 1 EUROPE DENTAL ALIGNERS MARKET: SEGMENTATION
FIGURE 2 EUROPE DENTAL ALIGNERS MARKET: DATA TRIANGULATION
FIGURE 3 EUROPE DENTAL ALIGNERS MARKET: DROC ANALYSIS
FIGURE 4 EUROPE DENTAL ALIGNERS MARKET: GLOBAL VS REGIONAL ANALYSIS
FIGURE 5 EUROPE DENTAL ALIGNERS MARKET: COMPANY RESEARCH ANALYSIS
FIGURE 6 EUROPE DENTAL ALIGNERS MARKET: INTERVIEW DEMOGRAPHICS
FIGURE 7 EUROPE DENTAL ALIGNERS MARKET: DBMR MARKET POSITION GRID
FIGURE 8 EUROPE DENTAL ALIGNERS MARKET: MARKET APPLICATION COVERAGE GRID
FIGURE 9 EUROPE DENTAL ALIGNERS MARKET : VENDOR SHARE ANALYSIS
FIGURE 10 EXECUTIVE SUMMARY
FIGURE 11 EUROPE DENTAL ALIGNERS MARKET: SEGMENTATION
FIGURE 12 STRATEGIC DECISIONS
FIGURE 13 TWO SEGMENTS COMPRISE THE EUROPE DENTAL ALIGNERS MARKET, BY PRODUCT AND SERVICE
FIGURE 14 GROWING DEMAND FOR AESTHETIC ORTHODONTIC SOLUTIONS EXPECTED TO DRIVE THE EUROPE DENTAL ALIGNERS MARKET IN THE FORECAST PERIOD OF 2026 TO 2033
FIGURE 15 PRODUCT SEGMENT IS EXPECTED TO ACCOUNT FOR THE LARGEST SHARE OF THE EUROPE DENTAL ALIGNERS MARKET IN 2026 & 2033
FIGURE 16 GERMANY IS EXPECTED TO DOMINATE THE EUROPE DENTAL ALIGNERS MARKET AND U.K. TO GROW WITH THE HIGHEST CAGR IN THE FORECAST PERIOD OF 2026 TO 2033
FIGURE 17 PORTER’S FIVE FORCES
FIGURE 18 TOTAL PATENTS IN THE EUROPE DENTAL ALIGNERS MARKET
FIGURE 19 DRIVERS, RESTRINTS, OPPORTUNITIES AND CHALLENGES OF EUROPE DENTAL ALIGNERS MARKET.
FIGURE 20 EUROPE DENTAL ALIGNERS MARKET: BY PRODUCT AND SERVICES, 2026
FIGURE 21 EUROPE DENTAL ALIGNERS MARKET: BY PRODUCT AND SERVICES, 2026 TO 2033 (USD THOUSAND)
FIGURE 22 EUROPE DENTAL ALIGNERS MARKET: BY PRODUCT AND SERVICES, CAGR (2026- 2033)
FIGURE 23 EUROPE DENTAL ALIGNERS MARKET: BY PRODUCT AND SERVICES, LIFELINE CURVE
FIGURE 24 EUROPE DENTAL ALIGNERS MARKET: BY DESIGN, 2026
FIGURE 25 EUROPE DENTAL ALIGNERS MARKET: BY DESIGN, 2026 TO 2033 (USD THOUSAND)
FIGURE 26 EUROPE DENTAL ALIGNERS MARKET: BY DESIGN, CAGR (2026- 2033)
FIGURE 27 EUROPE DENTAL ALIGNERS MARKET: BY DESIGN, LIFELINE CURVE
FIGURE 28 EUROPE DENTAL ALIGNERS MARKET: BY APPLICATION, 2026
FIGURE 29 EUROPE DENTAL ALIGNERS MARKET: BY APPLICATION, 2026 TO 2033 (USD THOUSAND)
FIGURE 30 EUROPE DENTAL ALIGNERS MARKET: BY APPLICATION, CAGR (2026- 2033)
FIGURE 31 EUROPE DENTAL ALIGNERS MARKET: BY APPLICATION, LIFELINE CURVE
FIGURE 32 EUROPE DENTAL ALIGNERS MARKET: BY POPULATION TYPE, 2026
FIGURE 33 EUROPE DENTAL ALIGNERS MARKET: BY POPULATION TYPE, 2026 TO 2033 (USD THOUSAND)
FIGURE 34 EUROPE DENTAL ALIGNERS MARKET: BY POPULATION TYPE, CAGR (2026- 2033)
FIGURE 35 EUROPE DENTAL ALIGNERS MARKET: BY POPULATION TYPE, LIFELINE CURVE
FIGURE 36 EUROPE DENTAL ALIGNERS MARKET: BY END USER, 2026
FIGURE 37 EUROPE DENTAL ALIGNERS MARKET: BY END USER, 2026 TO 2033 (USD THOUSAND)
FIGURE 38 EUROPE DENTAL ALIGNERS MARKET: BY END USER, CAGR (2026- 2033)
FIGURE 39 EUROPE DENTAL ALIGNERS MARKET: BY END USER, LIFELINE CURVE
FIGURE 40 EUROPE DENTAL ALIGNERS MARKET: BY DISTRIBUTION CHANNEL, 2026
FIGURE 41 EUROPE DENTAL ALIGNERS MARKET: BY DISTRIBUTION CHANNEL, 2026 TO 2033 (USD THOUSAND)
FIGURE 42 EUROPE DENTAL ALIGNERS MARKET: BY DISTRIBUTION CHANNEL, CAGR (2026- 2033)
FIGURE 43 EUROPE DENTAL ALIGNERS MARKET: BY DISTRIBUTION CHANNEL, LIFELINE CURVE
FIGURE 44 EUROPE DENTAL ALIGNERS MARKET: SNAPSHOT (2025)
FIGURE 45 EUROPE DENTAL ALIGNERS MARKET: COMPANY SHARE 2025 (%)
Research Methodology
Data collection and base year analysis are done using data collection modules with large sample sizes. The stage includes obtaining market information or related data through various sources and strategies. It includes examining and planning all the data acquired from the past in advance. It likewise envelops the examination of information inconsistencies seen across different information sources. The market data is analysed and estimated using market statistical and coherent models. Also, market share analysis and key trend analysis are the major success factors in the market report. To know more, please request an analyst call or drop down your inquiry.
The key research methodology used by DBMR research team is data triangulation which involves data mining, analysis of the impact of data variables on the market and primary (industry expert) validation. Data models include Vendor Positioning Grid, Market Time Line Analysis, Market Overview and Guide, Company Positioning Grid, Patent Analysis, Pricing Analysis, Company Market Share Analysis, Standards of Measurement, Global versus Regional and Vendor Share Analysis. To know more about the research methodology, drop in an inquiry to speak to our industry experts.
Customization Available
Data Bridge Market Research is a leader in advanced formative research. We take pride in servicing our existing and new customers with data and analysis that match and suits their goal. The report can be customized to include price trend analysis of target brands understanding the market for additional countries (ask for the list of countries), clinical trial results data, literature review, refurbished market and product base analysis. Market analysis of target competitors can be analyzed from technology-based analysis to market portfolio strategies. We can add as many competitors that you require data about in the format and data style you are looking for. Our team of analysts can also provide you data in crude raw excel files pivot tables (Fact book) or can assist you in creating presentations from the data sets available in the report.

