
Market Analysis and Insights
Hazelnut have higher demand among the consumer for healthy ingredients, hazelnuts are providing better and smarter eating solutions which can deliver various type of health benefits. Hazelnuts are used as an additive in various food & beverages in order to enhance its taste. Hazelnut can also be used in a calorie-controlled diet, balanced diets as these nuts provide health benefits including the supports persons for healthy bowel movements.
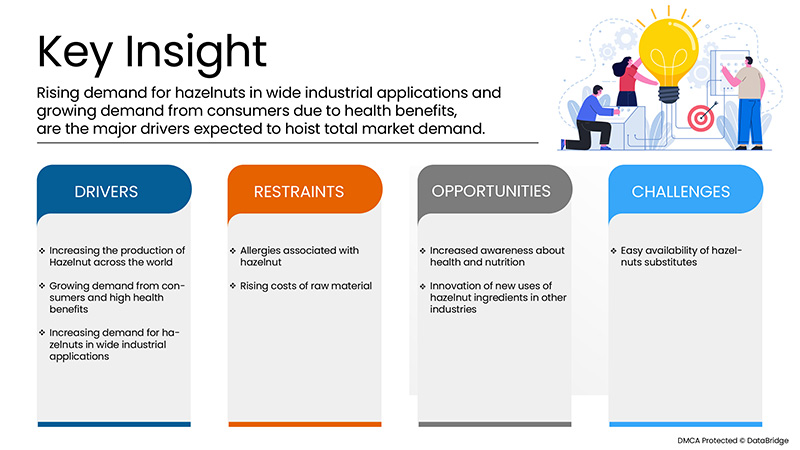
Hazelnut is a rich dietary source of protein, linoleic acid, and unsaturated fatty acids. It also contains a higher concentration of alpha-tocopherol (Vitamin E) compared to other nuts. Hazelnuts are primarily cultivated in Turkey. Rising demand for hazelnuts in wide industrial applications, growing demand from consumers due to health benefits, increasing demand for hazelnut infused confectionaries, and increasing the production of hazelnut across the world are the major drivers which propelled the demand of the market during the forecast period. However, rising costs of raw materials and allergies associated with hazelnut are expected to restrain the market growth during the forecasted period.
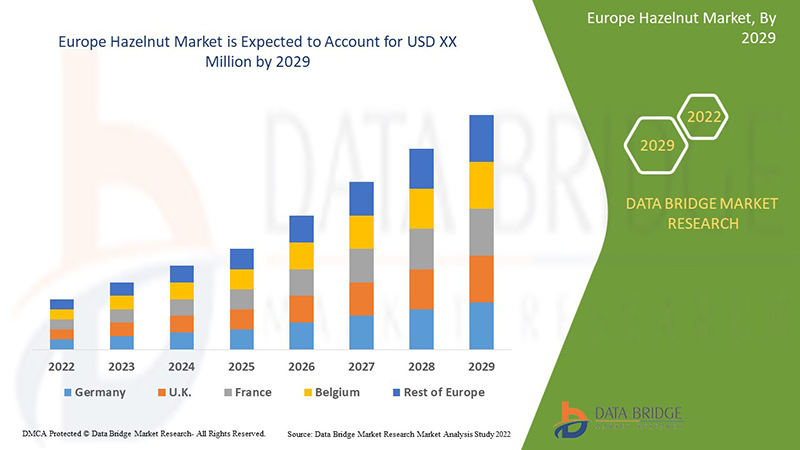
Data Bridge Market Research analyses that the Hazelnut market will grow at a CAGR of 9.1% during the forecast period of 2022 to 2029.
|
Report Metric |
Details |
|
Forecast Period |
2022 to 2029 |
|
Base Year |
2021 |
|
Historic Years |
2020 |
|
Quantitative Units |
Revenue in USD Million, Pricing in USD |
|
Segments Covered |
Form (Whole/In-Shell Hazelnut, Natural Hazelnut, Diced Hazelnut, Paste Hazelnut, Blanched Hazelnut, Roasted Hazelnut, Sliced Hazelnut, Hazelnut Oil, Hazelnut Meal and Others), Category (Conventional, Organic), Shape (Round Kernels, Almond Kernels, Pointed Kernels and Others), Origin (Akcakoca, Levant, Giresun), Packaging (Vacuum & Cartons Box, Bags, Pouches, Plastic Or Metal Drums), Application (Industrial, Food Service Industry, Household/Retail), Distribution Channel (Direct, Indirect) |
|
Countries Covered |
Germany, Italy, France, Switzerland, Russia, Spain, U.K., Belgium, Netherlands, Poland, Turkey, Sweden, Denmark and Rest of Europe |
|
Market Players Covered |
Arslantürk Tarim Ürünleri, Poyraz Poyraz, Findik Entegre San. Tic. A.S., URAK FINDIK Ferrero, ADM, Olam International, BALSU, Kanegrade Ltd., GPR , Nuts L, Gürsoy Tarimsal Ürünler Gida San, Boxon food, Karin Gida, Fruits of Turkey, BATA FOOD, Aydin Kuruyemis Sanayii ve Ticaret A.S., Özgün Gida Sanayi ve Ticaret Limited sirketi, and "AZERSTAR" LLC |
Market Definition
Hazelnut is the nut of the hazel that is derived from the species of the genus corylus, mainly from the nuts of the species Corylusavellana. Hazelnut is a type of nut that can be consumed as a snack and also with numerous health benefits such as it is good for heart, helps in reducing the risk of cancer, and aid in muscle, skin, bone, joint and digestive health. It is comprised of the various types of benefits due to which it can be used in wide industrial applications such as food & beverage, pharmaceuticals and cosmetics which utilizes these products in the making of chocolates and bakery items including cake, pastries & pies, cookies & biscuits, additives in drug, creams, lotions and others. In food & beverage industry it is also used for making alcoholic beverages, juices and ready-to drinks products.
In personal care & cosmetics, hazelnut is used for preparing natural hair care and skin care products. Hazelnut is also beneficial for controlling the level of diabetes and cholesterol in the consumers.
Hazelnut Market Dynamics
Drivers
- Increasing the production of hazelnut across the world
Hazelnut has a high consumption share with 35% in hard-shelled fruits around the world. It is often featured into meal or chocolate truffles and used as flour in cakes, breads and cookies. Turkey is a major hazelnut producer.
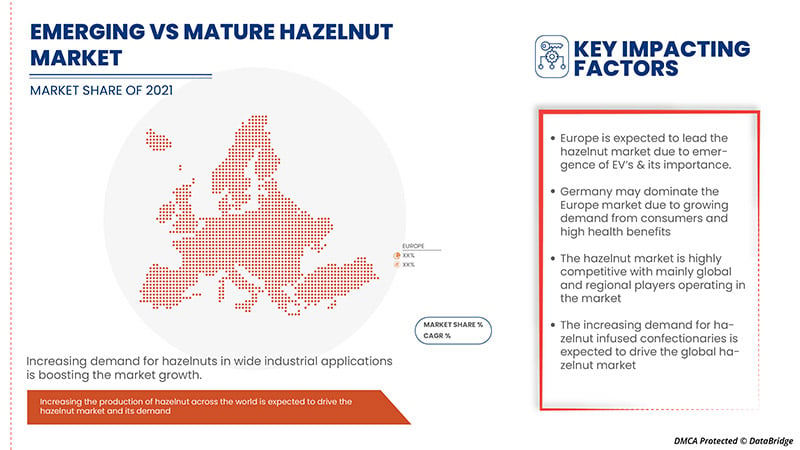
Turkey produces about 75% of total world hazelnuts production. Hazelnuts have been economically grown in temperate maritime climate provided by the Black Sea. Most orchards are on shallow and slopes and soils. The productions of hazelnuts are cultivated in many countries across the world, the many countries are engaged in producing hazelnut in international trade scale, due to which increasing the production of hazelnut across the world propelled the demand of the market in forecast period.
- Growing demand from consumers and high health benefits
Hazelnut has a high consumption among the consumers, it is a widely used in food industry especially for the chocolate making. Hazelnut has higher demand among the consumer because it is a better and smarter eating solution which can fit specific needs and lifestyle of consumers, also consumption of hazelnut help in the various types of health benefits.
Hazelnut is type of tasty snack and is a great addition to various dishes. It also provides several health benefits as it can be used for a calorie-controlled diet, also it supports healthy bowel movements, reducing weight gain, protecting against cell damage, and these are the reasons for increased demand for hazelnut among the consumers.
- Increasing demand for hazelnuts in wide industrial applications
Hazelnuts are used in wide range of industrial applications including food and beverages, pharmaceuticals and personal care & cosmetics industries. Hazelnuts are commonly used in the food industry, particularly in making pastries and chocolate which are inclusive of products such as nutella, Cadbury chocolate bars and Frangelico liqueur.
It is estimated that the worldwide production of hazelnuts each year is 600,000 tons, which is commonly used in the cosmetic and food industry because hazelnuts are rich in nutrients and also it has high content of protein, minerals, fats and vitamins, due to this increasing demand for hazelnuts in wide industrial applications boosting the market growth.
Opportunities
-
Increased awareness about health and nutrition
Hazelnuts is used in wide range of industrial applications also it is very useful in every field of life because it is an organic natural nut which used to maintain good heath, also used in preparing herbal cosmetic care product but the cost of raw material is too expensive which hampering the demand of the market.
The cost of hazelnuts raw material depends on the quality. Good quality of natural blanched hazelnut is too expensive as compared to the low quality of hazelnut. The cost of 5 kg raw hazelnut is around USD 85 which is expected to increase more significantly after processing. The cost of the raw hazelnut is varying from according to their quality.
Restraints/Challenges
- Allergies associated with hazelnut
Hazelnut allergy is a common type of allergy which may cause food allergy symptoms that range from mild to severe. Hazelnut allergy symptoms include abdominal pain, cramps, nausea and vomiting, diarrhoea and difficulty swallowing among other which obstructs the demand of hazelnut in the market.
COVID-19 Impact on Hazelnut Market
COVID-19 created a major impact on the hazelnut market as almost every country has opted for the shutdown for every production facility except the ones dealing in producing the essential goods. The government has taken some strict actions such as the shutdown of production and sale of non-essential goods, blocked international trade, and many more to prevent the spread of COVID-19. The only business which is dealing in this pandemic situation is the essential services that are allowed to open and run the processes.
The growth of the hazelnut market is increase in growth of logistics through airways and water ways and rapid growth in the e-commerce sector across the world. However, factors such as concerns related to inventory management in logistics are restraining the market growth. The shutdown of production facilities during the pandemic situation has had a significant impact on the market.
Manufacturers are making various strategic decisions to bounce back post-COVID-19. The players are conducting multiple research and development activities to improve the technology involved in the hazelnut market. With this, the companies will bring advanced and accurate controllers to the market. In addition, the use of advance technologies by government authorities in sea freight logistics, air freight logistics, overland logistics and contract logistics has led to the growth of import and exports of hazelnuts in the market.
Recent Development
- In February 2022, ADM, announced that it has completed its acquisition of Comhan, a leading South African flavour distributor. ADM believe it is critical to invest in flavour creation assets globally to extend production and supply chains, making it easier to get unique and consumer-preferred flavours to local customers. This acquisition helps to improve the product portfolio of the company.
- In July 2020, additional 5 new Laser Sorters have been installed at the DURAK FINDIK, so that company reached 28 laser sorters in total, which is the highest in the hazelnut sector of Turkey. After this development, the company has enhanced their credibility in the market.
Europe Hazelnut Market Scope
Hazelnut market is segmented based on form, category, shape, origin, packaging, and application and distribution channel. The growth amongst these segments will help you analyze major growth segments in the industries and provide the users with a valuable market overview and market insights to help them make strategic decisions for identifying core market applications.
Form
- Whole/In-Shell Hazelnut
- Natural Hazelnut
- Diced Hazelnut
- Paste Hazelnut
- Blanched Hazelnut
- Roasted Hazelnut
- Sliced Hazelnut
- Hazelnut Oil
- Hazelnut Meal
On the basis of form, the Europe hazelnut market is segmented into whole/in-shell hazelnut, natural hazelnut, diced hazelnut, paste hazelnut, blanched hazelnut, roasted hazelnut, sliced hazelnut, hazelnut oil, hazelnut meal.
Category
- Conventional
- Organic
On the basis of category, the Europe hazelnut market has been segmented into conventional and organic.
Shape
- Round Kernels
- Almond Kernels
- Pointed Kernels
- Others
On the basis of shape, the Europe hazelnut market has been segmented into round kernels, almond kernels, pointed kernels, and others.
Origin
- WDM/WDMA
- TDM/TDMA
On the basis of origin, the Europe hazelnut market has been segmented into akcakoca, levant, giresun.
Packaging
- Vacuum & Cartons Box
- Bags, Pouches
- Plastic Or Metal Drums
On the basis of packaging, the Europe hazelnut market has been segmented into vacuum & cartons box, bags, pouches, plastic or metal drums.
Application
- Industrial
- Food Service Industry
- Household/Retail
On the basis of application, the Europe hazelnut market has been segmented into to industrial, food service industry, household/retail.
Distribution Channel
- Direct
- Indirect
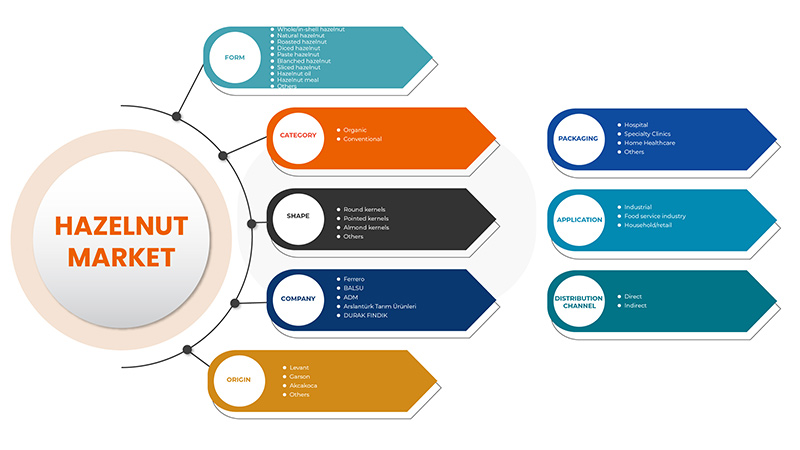
On the basis of end user, the Europe hazelnut market has been segmented into direct, and indirect.
Europe Hazelnut Market
The Hazelnut Market is analysed, and market size insights and trends are provided by the form, category, shape, origin, packaging, application and distribution channel as referenced above.
The country section of the Hazelnut Market report also provides individual market impacting factors and changes in regulations in the market domestically that impact the current and future trends of the market. Data points such as new sales, replacement sales, country demographics, disease epidemiology and import-export tariffs are some of the significant pointers used to forecast the market scenario for individual countries. Also, the presence and availability of global brands and their challenges faced due to large or scarce competition from local and domestic brands and the impact of sales channels are considered while providing forecast analysis of the country data.
Competitive Landscape and Hazelnut Market Share Analysis
The Hazelnut Market competitive landscape provides details of the competitor. Details included are company overview, company financials, revenue generated, market potential, investment in research and development, new market initiatives, global presence, production sites and facilities, production capacities, company strengths and weaknesses, solution launch, product width and breadth, application dominance. The above data points are only related to the companies' focus on the Hazelnut Market.
Some of the major players operating in the Europe Hazelnut Market are Arslantürk Tarim Ürünleri, Poyraz Poyraz, Findik Entegre San. Tic. A.S., URAK FINDIK Ferrero, ADM, Olam International, BALSU, Kanegrade Ltd., GPR , Nuts L, Gürsoy Tarimsal Ürünler Gida San, Boxon food, Karin Gida, Fruits of Turkey, BATA FOOD, Aydin Kuruyemis Sanayii ve Ticaret A.S., Özgün Gida Sanayi ve Ticaret Limited sirketi, and "AZERSTAR" LLC among others.
SKU-

- Interactive Data Analysis Dashboard
- Company Analysis Dashboard for high growth potential opportunities
- Research Analyst Access for customization & queries
- Competitor Analysis with Interactive dashboard
- Latest News, Updates & Trend analysis
- Harness the Power of Benchmark Analysis for Comprehensive Competitor Tracking
Table of Content
1 INTRODUCTION
1.1 OBJECTIVES OF THE STUDY
1.2 MARKET DEFINITION
1.3 OVERVIEW OF EUROPE HAZELNUT MARKET
1.4 LIMITATIONS
1.5 MARKETS COVERED
2 MARKET SEGMENTATION
2.1 MARKETS COVERED
2.2 GEOGRAPHICAL SCOPE
2.3 YEARS CONSIDERED FOR THE STUDY
2.4 CURRENCY AND PRICING
2.5 DBMR TRIPOD DATA VALIDATION MODEL
2.6 MULTIVARIATE MODELLING
2.7 FORM LIFELINE CURVE
2.8 PRIMARY INTERVIEWS WITH KEY OPINION LEADERS
2.9 DBMR MARKET POSITION GRID
2.1 VENDOR SHARE ANALYSIS
2.11 SECONDARY SOURCES
2.12 ASSUMPTIONS
3 EXECUTIVE SUMMARY
4 PREMIUM INSIGHTS
4.1 HAZELNUT PRODUCTION (KERNAL BASIS/METRIC TONS) IN 2021/2022
4.2 COMPARITIVE CONSUMPTION ANALYSIS OF TREE NUTS
4.3 WORLD TREE NUT ESTIMATED CONSUMPTION (METRIC TONS) (2020)
4.4 EXPORT TRADE ANALYSIS
4.5 IMPORT TRADE ANALYSIS
4.5.1 WORLD HAZELNUT IMPORTS*/ SHELLED (METRIC TONS)
4.6 PRICING ANALYSIS
4.7 HAZELNUT PROCESSING TECHNOLOGY
5 EUROPE HAZELNUT MARKET: REGULATORY FRAMEWORK
5.1 SUPPLY CHAIN IMPACT ANALYSIS
5.2 DEMAND IMPACT ANALYSIS
6 MARKET OVERVIEW
6.1 DRIVERS
6.1.1 INCREASING THE PRODUCTION OF HAZELNUT ACROSS THE WORLD
6.1.2 GROWING DEMAND FROM CONSUMERS AND HIGH HEALTH BENEFITS
6.1.3 INCREASING DEMAND FOR HAZELNUTS IN WIDE INDUSTRIAL APPLICATIONS
6.1.4 INCREASING DEMAND FOR HAZELNUT INFUSED CONFECTIONARIES
6.2 RESTRAINTS
6.2.1 ALLERGIES ASSOCIATED WITH HAZELNUT
6.2.2 RISING COSTS OF RAW MATERIAL
6.3 OPPORTUNITIES
6.3.1 INCREASED AWARENESS ABOUT HEALTH AND NUTRITION
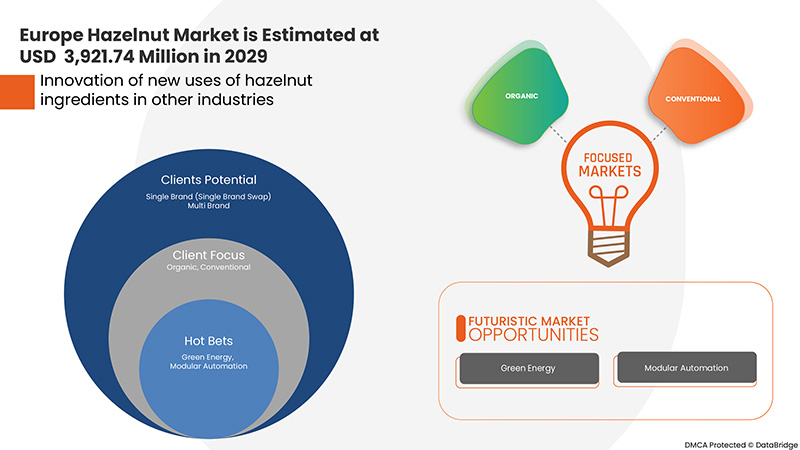
6.3.2 INNOVATION OF NEW USES OF HAZELNUT INGREDIENTS IN OTHER INDUSTRIES
6.3.3 INCREASING CONTROLLED ENVIRONMENT FARMING
6.4 CHALLENGE
6.4.1 EASY AVAILABILITY OF HAZELNUTS’ SUBSTITUTES
7 EUROPE HAZELNUT MARKET, BY FORM
7.1 OVERVIEW
7.2 WHOLE/IN-SHELL HAZELNUT
7.3 NATURAL HAZELNUT
7.4 ROASTED HAZELNUT
7.5 DICED HAZELNUT
7.5.1 MEDIUM
7.5.2 SMALL
7.6 PASTE HAZELNUT
7.6.1 DARK HAZELNUT PASTE
7.6.2 MEDIUM HAZELNUT PASTE
7.6.3 LIGHT HAZELNUT PASTE
7.7 BLANCHED HAZELNUT
7.8 SLICED HAZELNUT
7.9 HAZELNUT OIL
7.1 HAZELNUT MEAL
7.11 OTHERS
8 EUROPE HAZELNUT MARKET, BY CATEGORY
8.1 OVERVIEW
8.2 ORGANIC
8.3 CONVENTIONAL
9 EUROPE HAZELNUT MARKET, BY SHAPE
9.1 OVERVIEW
9.2 ROUND KERNELS
9.3 POINTED KERNELS
9.4 ALMOND KERNELS
9.5 OTHERS
10 EUROPE HAZELNUT MARKET, BY ORIGIN
10.1 OVERVIEW
10.2 LEVANT
10.3 GARSON
10.4 AKCAKOCA
10.5 OTHERS
11 EUROPE HAZELNUT MARKET, BY PACKAGING
11.1 OVERVIEW
11.2 VACUUM & CARTONS BOX
11.3 BAGS
11.3.1 PP BAGS
11.3.2 JUTE BAGS
11.3.3 BIG BAGS
11.3.3.1 1000 KG
11.3.3.2 800 KG
11.3.3.3 500 KG
11.3.3.4 OTHER
11.3.4 PAPER BAGS
11.3.5 OTHERS
11.4 POUCHES
11.5 PLASTIC OR METAL DRUMS
11.6 OTHERS
12 EUROPE HAZELNUT MARKET, BY APPLICATION
12.1 OVERVIEW
12.2 INDUSTRIAL
12.2.1 FOOD AND BEVERAGES
12.2.1.1 CONFECTIONERY
12.2.1.1.1 CHOCOLATES
12.2.1.1.2 CANDY
12.2.1.1.3 FUDGE
12.2.1.1.4 TOFFEES
12.2.1.1.5 GUMMIES
12.2.1.1.6 MARSHMALLOWS
12.2.1.1.7 OTHERS
12.2.1.2 BAKERY
12.2.1.2.1 CAKE
12.2.1.2.2 PASTRIES & PIES
12.2.1.2.3 COOKIES & BISCUITS
12.2.1.2.4 BREADS & BUNS
12.2.1.2.5 CROISSANTS
12.2.1.2.6 PIE CRUST
12.2.1.2.7 DOUGHNUT
12.2.1.2.8 MERINGUE
12.2.1.3 BEVERAGES
12.2.1.3.1 READY TO DRINKS
12.2.1.3.2 DAIRY DRINKS
12.2.1.3.3 ALCOHOLIC BEVERAGES
12.2.1.3.3.1 BEER
12.2.1.3.3.2 WINE
12.2.1.3.3.3 OTHERS
12.2.1.3.4 JUICES
12.2.1.3.5 OTHERS
12.2.1.4 BREAKFAST CEREALS & BARS
12.2.1.5 DAIRY PRODUCTS
12.2.1.5.1 ICE CREAM
12.2.1.5.2 YOGHURT
12.2.1.5.3 OTHERS
12.2.1.6 BUTTER & SPREADS
12.2.1.7 SAUCES & SEASONING
12.2.1.8 NOODLES & PASTA
12.2.1.9 OTHERS
12.2.2 PERSONAL CARE & COSMETICS
12.2.2.1 SKIN CARE
12.2.2.2 HAIR CARE
12.2.2.3 OTHERS
12.2.3 OTHERS
12.3 FOOD SERVICE INDUSTRY
12.3.1 HOTELS/RESTAURANTS/CAFÉ
12.3.2 BAKERY & ARTISAN BAKERS
12.3.3 OTHERS
12.4 HOUSEHOLD/RETAIL
13 EUROPE HAZELNUT MARKET, BY DISTRIBUTION CHANNEL
13.1 OVERVIEW
13.2 DIRECT
13.3 INDIRECT
13.3.1 STORE-BASED RETAILING
13.3.1.1 WHOLESALERS
13.3.1.2 SUPERMARKETS/HYPERMARKETS
13.3.1.3 CONVENIENCE STORES
13.3.1.4 SPECIALTY STORES
13.3.1.5 GROCERY STORES
13.3.1.6 OTHERS
13.3.2 NON-STORE RETAILING
13.3.2.1 ONLINE
13.3.2.2 VENDING
14 EUROPE HAZELNUT MARKET, BY COUNTRY
14.1 EUROPE
14.1.1 GERMANY
14.1.2 ITALY
14.1.3 FRANCE
14.1.4 SWITZERLAND
14.1.5 RUSSIA
14.1.6 SPAIN
14.1.7 U.K.
14.1.8 BELGIUM
14.1.9 NETHERLANDS
14.1.10 POLAND
14.1.11 TURKEY
14.1.12 SWEDEN
14.1.13 DENMARK
14.1.14 REST OF EUROPE
15 EUROPE HAZELNUT MARKET, COMPANY LANDSCAPE
15.1 COMPANY SHARE ANALYSIS: EUROPE
16 SWOT ANALYSIS
17 COMPANY PROFILES
17.1 FERRERO
17.1.1 COMPANY SNAPSHOT
17.1.2 PRODUCT PORTFOLIO
17.1.3 RECENT DEVELOPMENT
17.2 ADM
17.2.1 COMPANY SNAPSHOT
17.2.2 REVENUE ANALYSIS
17.2.3 PRODUCT PORTFOLIO
17.2.4 RECENT DEVELOPMENT
17.3 OLAM INTERNATIONAL
17.3.1 COMPANY SNAPSHOT
17.3.2 REVENUE ANALYSIS
17.3.3 PRODUCT PORTFOLIO
17.3.4 RECENT DEVELOPMENTS
17.4 BALSU
17.4.1 COMPANY SNAPSHOT
17.4.2 PRODUCT PORTFOLIO
17.4.3 RECENT DEVELOPMENT
17.5 ARSLANTÜRK TARIM ÜRÜNLERI
17.5.1 COMPANY SNAPSHOT
17.5.2 PRODUCT PORTFOLIO
17.5.3 RECENT DEVELOPMENT
17.6 AYDIN KURUYEMIŞ SANAYII VE TICARET A.Ş.
17.6.1 COMPANY SNAPSHOT
17.6.2 PRODUCT PORTFOLIO
17.6.3 RECENT DEVELOPMENT
17.7 "AZERSTAR" LLC
17.7.1 COMPANY SNAPSHOT
17.7.2 PRODUCT PORTFOLIO
17.7.3 RECENT DEVELOPMENT
17.8 BATA FOOD
17.8.1 COMPANY SNAPSHOT
17.8.2 PRODUCT PORTFOLIO
17.8.3 RECENT DEVELOPMENT
17.9 BOXON FOOD
17.9.1 COMPANY SNAPSHOT
17.9.2 PRODUCT PORTFOLIO
17.9.3 RECENT DEVELOPMENTS
17.1 DURAK FINDIK
17.10.1 COMPANY SNAPSHOT
17.10.2 PRODUCT PORTFOLIO
17.10.3 RECENT DEVELOPMENT
17.11 FRUITS OF TURKEY
17.11.1 COMPANY SNAPSHOT
17.11.2 PRODUCT PORTFOLIO
17.11.3 RECENT DEVELOPMENT
17.12 GPR
17.12.1 COMPANY SNAPSHOT
17.12.2 PRODUCT PORTFOLIO
17.12.3 RECENT DEVELOPMENT
17.13 GÜRSOY TARIMSAL ÜRÜNLER GIDA SAN.
17.13.1 COMPANY SNAPSHOT
17.13.2 PRODUCT PORTFOLIO
17.13.3 RECENT DEVELOPMENT
17.14 KANEGRADE LTD.
17.14.1 COMPANY SNAPSHOT
17.14.2 PRODUCT PORTFOLIO
17.14.3 RECENT DEVELOPMENT
17.15 KARIN GIDA
17.15.1 COMPANY SNAPSHOT
17.15.2 PRODUCT PORTFOLIO
17.15.3 RECENT DEVELOPMENT
17.16 NUTS L
17.16.1 COMPANY SNAPSHOT
17.16.2 PRODUCT PORTFOLIO
17.16.3 RECENT DEVELOPMENT
17.17 ÖZGÜN GIDA SANAYI VE TICARET LIMITED ŞIRKETI
17.17.1 COMPANY SNAPSHOT
17.17.2 PRODUCT PORTFOLIO
17.17.3 RECENT DEVELOPMENT
17.18 POYRAZ POYRAZ FINDIK ENTEGRE SAN. TIC. A.Ş.
17.18.1 COMPANY SNAPSHOT
17.18.2 PRODUCT PORTFOLIO
17.18.3 RECENT DEVELOPMENT
18 QUESTIONNAIRE
19 RELATED REPORTS
List of Table
TABLE 1 REGULATORY FRAMEWORK
TABLE 2 TOP HAZELNUT PRODUCING COUNTRIES (TONS)
TABLE 3 SUBSTITUTE FOR HAZELNUTS
TABLE 4 EUROPE HAZELNUT MARKET, BY FORM, 2020-2029 (USD MILLION)
TABLE 5 EUROPE DICED HAZELNUT IN HAZELNUT MARKET, BY FORM, 2020-2029 (USD MILLION)
TABLE 6 EUROPE PASTE HAZELNUT IN HAZELNUT MARKET, BY FORM, 2020-2029 (USD MILLION)
TABLE 7 EUROPE HAZELNUT MARKET, BY CATEGORY, 2020-2029 (USD MILLION)
TABLE 8 EUROPE HAZELNUT MARKET, BY SHAPE, 2020-2029 (USD MILLION)
TABLE 9 EUROPE HAZELNUT MARKET, BY ORIGIN, 2020-2029 (USD MILLION)
TABLE 10 EUROPE HAZELNUT MARKET, BY MATERIAL, 2020-2029 (USD MILLION)
TABLE 11 EUROPE BAGS IN HAZELNUT MARKET, BY PACKAGING, 2020-2029 (USD MILLION)
TABLE 12 EUROPE BIG BAGS IN HAZELNUT MARKET, BY SIZE, 2020-2029 (USD MILLION)
TABLE 13 EUROPE HAZELNUT MARKET, BY APPLICATION, 2020-2029 (USD MILLION)
TABLE 14 EUROPE INDUSTRIAL IN HAZELNUT MARKET, BY APPLICATION, 2020-2029 (USD MILLION)
TABLE 15 EUROPE FOOD AND BEVERAGES IN HAZELNUT MARKET, BY APPLICATION, 2020-2029 (USD MILLION)
TABLE 16 EUROPE CONFECTIONERY IN HAZELNUT MARKET, BY APPLICATION, 2020-2029 (USD MILLION)
TABLE 17 EUROPE BAKERY IN HAZELNUT MARKET, BY APPLICATION, 2020-2029 (USD MILLION)
TABLE 18 EUROPE BEVERAGES IN HAZELNUT MARKET, BY APPLICATION, 2020-2029 (USD MILLION)
TABLE 19 EUROPE ALCOHOLIC BEVERAGES IN HAZELNUT MARKET, BY APPLICATION, 2020-2029 (USD MILLION)
TABLE 20 EUROPE DAIRY PRODUCTS IN HAZELNUT MARKET, BY APPLICATION, 2020-2029 (USD MILLION)
TABLE 21 EUROPE PERSONAL CARE & COSMETICS IN HAZELNUT MARKET, BY APPLICATION, 2020-2029 (USD MILLION)
TABLE 22 EUROPE FOOD SERVICE INDUSTRY IN HAZELNUT MARKET, BY APPLICATION, 2020-2029 (USD MILLION)
TABLE 23 EUROPE HAZELNUT MARKET, BY DISTRIBUTION CHANNEL, 2020-2029 (USD MILLION)
TABLE 24 EUROPE INDIRECT IN HAZELNUT MARKET, BY DISTRIBUTION CHANNEL, 2020-2029 (USD MILLION)
TABLE 25 EUROPE STORE-BASED RETAILING IN HAZELNUT MARKET, BY DISTRIBUTION CHANNEL, 2020-2029 (USD MILLION)
TABLE 26 EUROPE NON-STORE RETAILING IN HAZELNUT MARKET, BY DISTRIBUTION CHANNEL, 2020-2029 (USD MILLION)
TABLE 27 EUROPE HAZELNUT MARKET, BY COUNTRY, 2020-2029 (USD MILLION)
TABLE 28 EUROPE HAZELNUT MARKET, BY FORM, 2020-2029 (USD MILLION)
TABLE 29 EUROPE DICED HAZELNUT IN HAZELNUT MARKET, BY FORM, 2020-2029 (USD MILLION)
TABLE 30 EUROPE PASTE HAZELNUT IN HAZELNUT MARKET, BY FORM, 2020-2029 (USD MILLION)
TABLE 31 EUROPE HAZELNUT MARKET, BY CATEGORY, 2020-2029 (USD MILLION)
TABLE 32 EUROPE HAZELNUT MARKET, BY SHAPE, 2020-2029 (USD MILLION)
TABLE 33 EUROPE HAZELNUT MARKET, BY ORIGIN, 2020-2029 (USD MILLION)
TABLE 34 EUROPE HAZELNUT MARKET, BY PACKAGING, 2020-2029 (USD MILLION)
TABLE 35 EUROPE BAGS IN HAZELNUT MARKET, BY PACKAGING, 2020-2029 (USD MILLION)
TABLE 36 EUROPE BIG BAGS IN HAZELNUT MARKET, BY SIZE, 2020-2029 (USD MILLION)
TABLE 37 EUROPE HAZELNUT MARKET, BY APPLICATION, 2020-2029 (USD MILLION)
TABLE 38 EUROPE INDUSTRIAL IN HAZELNUT MARKET, BY APPLICATION, 2020-2029 (USD MILLION)
TABLE 39 EUROPE FOOD AND BEVERAGES IN HAZELNUT MARKET, BY APPLICATION, 2020-2029 (USD MILLION)
TABLE 40 EUROPE CONFECTIONERY IN HAZELNUT MARKET, BY APPLICATION, 2020-2029 (USD MILLION)
TABLE 41 EUROPE BAKERY IN HAZELNUT MARKET, BY APPLICATION, 2020-2029 (USD MILLION)
TABLE 42 EUROPE DAIRY PRODUCTS IN HAZELNUT MARKET, BY APPLICATION, 2020-2029 (USD MILLION)
TABLE 43 EUROPE BEVERAGES IN HAZELNUT MARKET, BY APPLICATION, 2020-2029 (USD MILLION)
TABLE 44 EUROPE ALCOHOLIC BEVERAGES IN HAZELNUT MARKET, BY APPLICATION, 2020-2029 (USD MILLION)
TABLE 45 EUROPE PERSONAL CARE & COSMETICS IN HAZELNUT MARKET, BY APPLICATION, 2020-2029 (USD MILLION)
TABLE 46 EUROPE FOOD SERVICE INDUSTRY IN HAZELNUT MARKET, BY APPLICATION, 2020-2029 (USD MILLION)
TABLE 47 EUROPE HAZELNUT MARKET, BY DISTRIBUTION CHANNEL, 2020-2029 (USD MILLION)
TABLE 48 EUROPE INDIRECT IN HAZELNUT MARKET, BY DISTRIBUTION CHANNEL, 2020-2029 (USD MILLION)
TABLE 49 EUROPE STORE-BASED RETAILING IN HAZELNUT MARKET, BY DISTRIBUTION CHANNEL, 2020-2029 (USD MILLION)
TABLE 50 EUROPE NON-STORE RETAILING IN HAZELNUT MARKET, BY DISTRIBUTION CHANNEL, 2020-2029 (USD MILLION)
TABLE 51 GERMANY HAZELNUT MARKET, BY FORM, 2020-2029 (USD MILLION)
TABLE 52 GERMANY DICED HAZELNUT IN HAZELNUT MARKET, BY FORM, 2020-2029 (USD MILLION)
TABLE 53 GERMANY PASTE HAZELNUT IN HAZELNUT MARKET, BY FORM, 2020-2029 (USD MILLION)
TABLE 54 GERMANY HAZELNUT MARKET, BY CATEGORY, 2020-2029 (USD MILLION)
TABLE 55 GERMANY HAZELNUT MARKET, BY SHAPE, 2020-2029 (USD MILLION)
TABLE 56 GERMANY HAZELNUT MARKET, BY ORIGIN, 2020-2029 (USD MILLION)
TABLE 57 GERMANY HAZELNUT MARKET, BY PACKAGING, 2020-2029 (USD MILLION)
TABLE 58 GERMANY BAGS IN HAZELNUT MARKET, BY PACKAGING, 2020-2029 (USD MILLION)
TABLE 59 GERMANY BIG BAGS IN HAZELNUT MARKET, BY SIZE, 2020-2029 (USD MILLION)
TABLE 60 GERMANY HAZELNUT MARKET, BY APPLICATION, 2020-2029 (USD MILLION)
TABLE 61 GERMANY INDUSTRIAL IN HAZELNUT MARKET, BY APPLICATION, 2020-2029 (USD MILLION)
TABLE 62 GERMANY FOOD AND BEVERAGES IN HAZELNUT MARKET, BY APPLICATION, 2020-2029 (USD MILLION)
TABLE 63 GERMANY CONFECTIONERY IN HAZELNUT MARKET, BY APPLICATION, 2020-2029 (USD MILLION)
TABLE 64 GERMANY BAKERY IN HAZELNUT MARKET, BY APPLICATION, 2020-2029 (USD MILLION)
TABLE 65 GERMANY DAIRY PRODUCTS IN HAZELNUT MARKET, BY APPLICATION, 2020-2029 (USD MILLION)
TABLE 66 GERMANY BEVERAGES IN HAZELNUT MARKET, BY APPLICATION, 2020-2029 (USD MILLION)
TABLE 67 GERMANY ALCOHOLIC BEVERAGES IN HAZELNUT MARKET, BY APPLICATION, 2020-2029 (USD MILLION)
TABLE 68 GERMANY PERSONAL CARE & COSMETICS IN HAZELNUT MARKET, BY APPLICATION, 2020-2029 (USD MILLION)
TABLE 69 GERMANY FOOD SERVICE INDUSTRY IN HAZELNUT MARKET, BY APPLICATION, 2020-2029 (USD MILLION)
TABLE 70 GERMANY HAZELNUT MARKET, BY DISTRIBUTION CHANNEL, 2020-2029 (USD MILLION)
TABLE 71 GERMANY INDIRECT IN HAZELNUT MARKET, BY DISTRIBUTION CHANNEL, 2020-2029 (USD MILLION)
TABLE 72 GERMANY STORE-BASED RETAILING IN HAZELNUT MARKET, BY DISTRIBUTION CHANNEL, 2020-2029 (USD MILLION)
TABLE 73 GERMANY NON-STORE RETAILING IN HAZELNUT MARKET, BY DISTRIBUTION CHANNEL, 2020-2029 (USD MILLION)
TABLE 74 ITALY HAZELNUT MARKET, BY FORM, 2020-2029 (USD MILLION)
TABLE 75 ITALY DICED HAZELNUT IN HAZELNUT MARKET, BY FORM, 2020-2029 (USD MILLION)
TABLE 76 ITALY PASTE HAZELNUT IN HAZELNUT MARKET, BY FORM, 2020-2029 (USD MILLION)
TABLE 77 ITALY HAZELNUT MARKET, BY CATEGORY, 2020-2029 (USD MILLION)
TABLE 78 ITALY HAZELNUT MARKET, BY SHAPE, 2020-2029 (USD MILLION)
TABLE 79 ITALY HAZELNUT MARKET, BY ORIGIN, 2020-2029 (USD MILLION)
TABLE 80 ITALY HAZELNUT MARKET, BY PACKAGING, 2020-2029 (USD MILLION)
TABLE 81 ITALY BAGS IN HAZELNUT MARKET, BY PACKAGING, 2020-2029 (USD MILLION)
TABLE 82 ITALY BIG BAGS IN HAZELNUT MARKET, BY SIZE, 2020-2029 (USD MILLION)
TABLE 83 ITALY HAZELNUT MARKET, BY APPLICATION, 2020-2029 (USD MILLION)
TABLE 84 ITALY INDUSTRIAL IN HAZELNUT MARKET, BY APPLICATION, 2020-2029 (USD MILLION)
TABLE 85 ITALY FOOD AND BEVERAGES IN HAZELNUT MARKET, BY APPLICATION, 2020-2029 (USD MILLION)
TABLE 86 ITALY CONFECTIONERY IN HAZELNUT MARKET, BY APPLICATION, 2020-2029 (USD MILLION)
TABLE 87 ITALY BAKERY IN HAZELNUT MARKET, BY APPLICATION, 2020-2029 (USD MILLION)
TABLE 88 ITALY DAIRY PRODUCTS IN HAZELNUT MARKET, BY APPLICATION, 2020-2029 (USD MILLION)
TABLE 89 ITALY BEVERAGES IN HAZELNUT MARKET, BY APPLICATION, 2020-2029 (USD MILLION)
TABLE 90 ITALY ALCOHOLIC BEVERAGES IN HAZELNUT MARKET, BY APPLICATION, 2020-2029 (USD MILLION)
TABLE 91 ITALY PERSONAL CARE & COSMETICS IN HAZELNUT MARKET, BY APPLICATION, 2020-2029 (USD MILLION)
TABLE 92 ITALY FOOD SERVICE INDUSTRY IN HAZELNUT MARKET, BY APPLICATION, 2020-2029 (USD MILLION)
TABLE 93 ITALY HAZELNUT MARKET, BY DISTRIBUTION CHANNEL, 2020-2029 (USD MILLION)
TABLE 94 ITALY INDIRECT IN HAZELNUT MARKET, BY DISTRIBUTION CHANNEL, 2020-2029 (USD MILLION)
TABLE 95 ITALY STORE-BASED RETAILING IN HAZELNUT MARKET, BY DISTRIBUTION CHANNEL, 2020-2029 (USD MILLION)
TABLE 96 ITALY NON-STORE RETAILING IN HAZELNUT MARKET, BY DISTRIBUTION CHANNEL, 2020-2029 (USD MILLION)
TABLE 97 FRANCE HAZELNUT MARKET, BY FORM, 2020-2029 (USD MILLION)
TABLE 98 FRANCE DICED HAZELNUT IN HAZELNUT MARKET, BY FORM, 2020-2029 (USD MILLION)
TABLE 99 FRANCE PASTE HAZELNUT IN HAZELNUT MARKET, BY FORM, 2020-2029 (USD MILLION)
TABLE 100 FRANCE HAZELNUT MARKET, BY CATEGORY, 2020-2029 (USD MILLION)
TABLE 101 FRANCE HAZELNUT MARKET, BY SHAPE, 2020-2029 (USD MILLION)
TABLE 102 FRANCE HAZELNUT MARKET, BY ORIGIN, 2020-2029 (USD MILLION)
TABLE 103 FRANCE HAZELNUT MARKET, BY PACKAGING, 2020-2029 (USD MILLION)
TABLE 104 FRANCE BAGS IN HAZELNUT MARKET, BY PACKAGING, 2020-2029 (USD MILLION)
TABLE 105 FRANCE BIG BAGS IN HAZELNUT MARKET, BY SIZE, 2020-2029 (USD MILLION)
TABLE 106 FRANCE HAZELNUT MARKET, BY APPLICATION, 2020-2029 (USD MILLION)
TABLE 107 FRANCE INDUSTRIAL IN HAZELNUT MARKET, BY APPLICATION, 2020-2029 (USD MILLION)
TABLE 108 FRANCE FOOD AND BEVERAGES IN HAZELNUT MARKET, BY APPLICATION, 2020-2029 (USD MILLION)
TABLE 109 FRANCE CONFECTIONERY IN HAZELNUT MARKET, BY APPLICATION, 2020-2029 (USD MILLION)
TABLE 110 FRANCE BAKERY IN HAZELNUT MARKET, BY APPLICATION, 2020-2029 (USD MILLION)
TABLE 111 FRANCE DAIRY PRODUCTS IN HAZELNUT MARKET, BY APPLICATION, 2020-2029 (USD MILLION)
TABLE 112 FRANCE BEVERAGES IN HAZELNUT MARKET, BY APPLICATION, 2020-2029 (USD MILLION)
TABLE 113 FRANCE ALCOHOLIC BEVERAGES IN HAZELNUT MARKET, BY APPLICATION, 2020-2029 (USD MILLION)
TABLE 114 FRANCE PERSONAL CARE & COSMETICS IN HAZELNUT MARKET, BY APPLICATION, 2020-2029 (USD MILLION)
TABLE 115 FRANCE FOOD SERVICE INDUSTRY IN HAZELNUT MARKET, BY APPLICATION, 2020-2029 (USD MILLION)
TABLE 116 FRANCE HAZELNUT MARKET, BY DISTRIBUTION CHANNEL, 2020-2029 (USD MILLION)
TABLE 117 FRANCE INDIRECT IN HAZELNUT MARKET, BY DISTRIBUTION CHANNEL, 2020-2029 (USD MILLION)
TABLE 118 FRANCE STORE-BASED RETAILING IN HAZELNUT MARKET, BY DISTRIBUTION CHANNEL, 2020-2029 (USD MILLION)
TABLE 119 FRANCE NON-STORE RETAILING IN HAZELNUT MARKET, BY DISTRIBUTION CHANNEL, 2020-2029 (USD MILLION)
TABLE 120 SWITZERLAND HAZELNUT MARKET, BY FORM, 2020-2029 (USD MILLION)
TABLE 121 SWITZERLAND DICED HAZELNUT IN HAZELNUT MARKET, BY FORM, 2020-2029 (USD MILLION)
TABLE 122 SWITZERLAND PASTE HAZELNUT IN HAZELNUT MARKET, BY FORM, 2020-2029 (USD MILLION)
TABLE 123 SWITZERLAND HAZELNUT MARKET, BY CATEGORY, 2020-2029 (USD MILLION)
TABLE 124 SWITZERLAND HAZELNUT MARKET, BY SHAPE, 2020-2029 (USD MILLION)
TABLE 125 SWITZERLAND HAZELNUT MARKET, BY ORIGIN, 2020-2029 (USD MILLION)
TABLE 126 SWITZERLAND HAZELNUT MARKET, BY PACKAGING, 2020-2029 (USD MILLION)
TABLE 127 SWITZERLAND BAGS IN HAZELNUT MARKET, BY PACKAGING, 2020-2029 (USD MILLION)
TABLE 128 SWITZERLAND BIG BAGS IN HAZELNUT MARKET, BY SIZE, 2020-2029 (USD MILLION)
TABLE 129 SWITZERLAND HAZELNUT MARKET, BY APPLICATION, 2020-2029 (USD MILLION)
TABLE 130 SWITZERLAND INDUSTRIAL IN HAZELNUT MARKET, BY APPLICATION, 2020-2029 (USD MILLION)
TABLE 131 SWITZERLAND FOOD AND BEVERAGES IN HAZELNUT MARKET, BY APPLICATION, 2020-2029 (USD MILLION)
TABLE 132 SWITZERLAND CONFECTIONERY IN HAZELNUT MARKET, BY APPLICATION, 2020-2029 (USD MILLION)
TABLE 133 SWITZERLAND BAKERY IN HAZELNUT MARKET, BY APPLICATION, 2020-2029 (USD MILLION)
TABLE 134 SWITZERLAND DAIRY PRODUCTS IN HAZELNUT MARKET, BY APPLICATION, 2020-2029 (USD MILLION)
TABLE 135 SWITZERLAND BEVERAGES IN HAZELNUT MARKET, BY APPLICATION, 2020-2029 (USD MILLION)
TABLE 136 SWITZERLAND ALCOHOLIC BEVERAGES IN HAZELNUT MARKET, BY APPLICATION, 2020-2029 (USD MILLION)
TABLE 137 SWITZERLAND PERSONAL CARE & COSMETICS IN HAZELNUT MARKET, BY APPLICATION, 2020-2029 (USD MILLION)
TABLE 138 SWITZERLAND FOOD SERVICE INDUSTRY IN HAZELNUT MARKET, BY APPLICATION, 2020-2029 (USD MILLION)
TABLE 139 SWITZERLAND HAZELNUT MARKET, BY DISTRIBUTION CHANNEL, 2020-2029 (USD MILLION)
TABLE 140 SWITZERLAND INDIRECT IN HAZELNUT MARKET, BY DISTRIBUTION CHANNEL, 2020-2029 (USD MILLION)
TABLE 141 SWITZERLAND STORE-BASED RETAILING IN HAZELNUT MARKET, BY DISTRIBUTION CHANNEL, 2020-2029 (USD MILLION)
TABLE 142 SWITZERLAND NON-STORE RETAILING IN HAZELNUT MARKET, BY DISTRIBUTION CHANNEL, 2020-2029 (USD MILLION)
TABLE 143 RUSSIA HAZELNUT MARKET, BY FORM, 2020-2029 (USD MILLION)
TABLE 144 RUSSIA DICED HAZELNUT IN HAZELNUT MARKET, BY FORM, 2020-2029 (USD MILLION)
TABLE 145 RUSSIA PASTE HAZELNUT IN HAZELNUT MARKET, BY FORM, 2020-2029 (USD MILLION)
TABLE 146 RUSSIA HAZELNUT MARKET, BY CATEGORY, 2020-2029 (USD MILLION)
TABLE 147 RUSSIA HAZELNUT MARKET, BY SHAPE, 2020-2029 (USD MILLION)
TABLE 148 RUSSIA HAZELNUT MARKET, BY ORIGIN, 2020-2029 (USD MILLION)
TABLE 149 RUSSIA HAZELNUT MARKET, BY PACKAGING, 2020-2029 (USD MILLION)
TABLE 150 RUSSIA BAGS IN HAZELNUT MARKET, BY PACKAGING, 2020-2029 (USD MILLION)
TABLE 151 RUSSIA BIG BAGS IN HAZELNUT MARKET, BY SIZE, 2020-2029 (USD MILLION)
TABLE 152 RUSSIA HAZELNUT MARKET, BY APPLICATION, 2020-2029 (USD MILLION)
TABLE 153 RUSSIA INDUSTRIAL IN HAZELNUT MARKET, BY APPLICATION, 2020-2029 (USD MILLION)
TABLE 154 RUSSIA FOOD AND BEVERAGES IN HAZELNUT MARKET, BY APPLICATION, 2020-2029 (USD MILLION)
TABLE 155 RUSSIA CONFECTIONERY IN HAZELNUT MARKET, BY APPLICATION, 2020-2029 (USD MILLION)
TABLE 156 RUSSIA BAKERY IN HAZELNUT MARKET, BY APPLICATION, 2020-2029 (USD MILLION)
TABLE 157 RUSSIA DAIRY PRODUCTS IN HAZELNUT MARKET, BY APPLICATION, 2020-2029 (USD MILLION)
TABLE 158 RUSSIA BEVERAGES IN HAZELNUT MARKET, BY APPLICATION, 2020-2029 (USD MILLION)
TABLE 159 RUSSIA ALCOHOLIC BEVERAGES IN HAZELNUT MARKET, BY APPLICATION, 2020-2029 (USD MILLION)
TABLE 160 RUSSIA PERSONAL CARE & COSMETICS IN HAZELNUT MARKET, BY APPLICATION, 2020-2029 (USD MILLION)
TABLE 161 RUSSIA FOOD SERVICE INDUSTRY IN HAZELNUT MARKET, BY APPLICATION, 2020-2029 (USD MILLION)
TABLE 162 RUSSIA HAZELNUT MARKET, BY DISTRIBUTION CHANNEL, 2020-2029 (USD MILLION)
TABLE 163 RUSSIA INDIRECT IN HAZELNUT MARKET, BY DISTRIBUTION CHANNEL, 2020-2029 (USD MILLION)
TABLE 164 RUSSIA STORE-BASED RETAILING IN HAZELNUT MARKET, BY DISTRIBUTION CHANNEL, 2020-2029 (USD MILLION)
TABLE 165 RUSSIA NON-STORE RETAILING IN HAZELNUT MARKET, BY DISTRIBUTION CHANNEL, 2020-2029 (USD MILLION)
TABLE 166 SPAIN HAZELNUT MARKET, BY FORM, 2020-2029 (USD MILLION)
TABLE 167 SPAIN DICED HAZELNUT IN HAZELNUT MARKET, BY FORM, 2020-2029 (USD MILLION)
TABLE 168 SPAIN PASTE HAZELNUT IN HAZELNUT MARKET, BY FORM, 2020-2029 (USD MILLION)
TABLE 169 SPAIN HAZELNUT MARKET, BY CATEGORY, 2020-2029 (USD MILLION)
TABLE 170 SPAIN HAZELNUT MARKET, BY SHAPE, 2020-2029 (USD MILLION)
TABLE 171 SPAIN HAZELNUT MARKET, BY ORIGIN, 2020-2029 (USD MILLION)
TABLE 172 SPAIN HAZELNUT MARKET, BY PACKAGING, 2020-2029 (USD MILLION)
TABLE 173 SPAIN BAGS IN HAZELNUT MARKET, BY PACKAGING, 2020-2029 (USD MILLION)
TABLE 174 SPAIN BIG BAGS IN HAZELNUT MARKET, BY SIZE, 2020-2029 (USD MILLION)
TABLE 175 SPAIN HAZELNUT MARKET, BY APPLICATION, 2020-2029 (USD MILLION)
TABLE 176 SPAIN INDUSTRIAL IN HAZELNUT MARKET, BY APPLICATION, 2020-2029 (USD MILLION)
TABLE 177 SPAIN FOOD AND BEVERAGES IN HAZELNUT MARKET, BY APPLICATION, 2020-2029 (USD MILLION)
TABLE 178 SPAIN CONFECTIONERY IN HAZELNUT MARKET, BY APPLICATION, 2020-2029 (USD MILLION)
TABLE 179 SPAIN BAKERY IN HAZELNUT MARKET, BY APPLICATION, 2020-2029 (USD MILLION)
TABLE 180 SPAIN DAIRY PRODUCTS IN HAZELNUT MARKET, BY APPLICATION, 2020-2029 (USD MILLION)
TABLE 181 SPAIN BEVERAGES IN HAZELNUT MARKET, BY APPLICATION, 2020-2029 (USD MILLION)
TABLE 182 SPAIN ALCOHOLIC BEVERAGES IN HAZELNUT MARKET, BY APPLICATION, 2020-2029 (USD MILLION)
TABLE 183 SPAIN PERSONAL CARE & COSMETICS IN HAZELNUT MARKET, BY APPLICATION, 2020-2029 (USD MILLION)
TABLE 184 SPAIN FOOD SERVICE INDUSTRY IN HAZELNUT MARKET, BY APPLICATION, 2020-2029 (USD MILLION)
TABLE 185 SPAIN HAZELNUT MARKET, BY DISTRIBUTION CHANNEL, 2020-2029 (USD MILLION)
TABLE 186 SPAIN INDIRECT IN HAZELNUT MARKET, BY DISTRIBUTION CHANNEL, 2020-2029 (USD MILLION)
TABLE 187 SPAIN STORE-BASED RETAILING IN HAZELNUT MARKET, BY DISTRIBUTION CHANNEL, 2020-2029 (USD MILLION)
TABLE 188 SPAIN NON-STORE RETAILING IN HAZELNUT MARKET, BY DISTRIBUTION CHANNEL, 2020-2029 (USD MILLION)
TABLE 189 U.K. HAZELNUT MARKET, BY FORM, 2020-2029 (USD MILLION)
TABLE 190 U.K. DICED HAZELNUT IN HAZELNUT MARKET, BY FORM, 2020-2029 (USD MILLION)
TABLE 191 U.K. PASTE HAZELNUT IN HAZELNUT MARKET, BY FORM, 2020-2029 (USD MILLION)
TABLE 192 U.K. HAZELNUT MARKET, BY CATEGORY, 2020-2029 (USD MILLION)
TABLE 193 U.K. HAZELNUT MARKET, BY SHAPE, 2020-2029 (USD MILLION)
TABLE 194 U.K. HAZELNUT MARKET, BY ORIGIN, 2020-2029 (USD MILLION)
TABLE 195 U.K. HAZELNUT MARKET, BY PACKAGING, 2020-2029 (USD MILLION)
TABLE 196 U.K. BAGS IN HAZELNUT MARKET, BY PACKAGING, 2020-2029 (USD MILLION)
TABLE 197 U.K. BIG BAGS IN HAZELNUT MARKET, BY SIZE, 2020-2029 (USD MILLION)
TABLE 198 U.K. HAZELNUT MARKET, BY APPLICATION, 2020-2029 (USD MILLION)
TABLE 199 U.K. INDUSTRIAL IN HAZELNUT MARKET, BY APPLICATION, 2020-2029 (USD MILLION)
TABLE 200 U.K. FOOD AND BEVERAGES IN HAZELNUT MARKET, BY APPLICATION, 2020-2029 (USD MILLION)
TABLE 201 U.K. CONFECTIONERY IN HAZELNUT MARKET, BY APPLICATION, 2020-2029 (USD MILLION)
TABLE 202 U.K. BAKERY IN HAZELNUT MARKET, BY APPLICATION, 2020-2029 (USD MILLION)
TABLE 203 U.K. DAIRY PRODUCTS IN HAZELNUT MARKET, BY APPLICATION, 2020-2029 (USD MILLION)
TABLE 204 U.K. BEVERAGES IN HAZELNUT MARKET, BY APPLICATION, 2020-2029 (USD MILLION)
TABLE 205 U.K. ALCOHOLIC BEVERAGES IN HAZELNUT MARKET, BY APPLICATION, 2020-2029 (USD MILLION)
TABLE 206 U.K. PERSONAL CARE & COSMETICS IN HAZELNUT MARKET, BY APPLICATION, 2020-2029 (USD MILLION)
TABLE 207 U.K. FOOD SERVICE INDUSTRY IN HAZELNUT MARKET, BY APPLICATION, 2020-2029 (USD MILLION)
TABLE 208 U.K. HAZELNUT MARKET, BY DISTRIBUTION CHANNEL, 2020-2029 (USD MILLION)
TABLE 209 U.K. INDIRECT IN HAZELNUT MARKET, BY DISTRIBUTION CHANNEL, 2020-2029 (USD MILLION)
TABLE 210 U.K. STORE-BASED RETAILING IN HAZELNUT MARKET, BY DISTRIBUTION CHANNEL, 2020-2029 (USD MILLION)
TABLE 211 U.K. NON-STORE RETAILING IN HAZELNUT MARKET, BY DISTRIBUTION CHANNEL, 2020-2029 (USD MILLION)
TABLE 212 BELGIUM HAZELNUT MARKET, BY FORM, 2020-2029 (USD MILLION)
TABLE 213 BELGIUM DICED HAZELNUT IN HAZELNUT MARKET, BY FORM, 2020-2029 (USD MILLION)
TABLE 214 BELGIUM PASTE HAZELNUT IN HAZELNUT MARKET, BY FORM, 2020-2029 (USD MILLION)
TABLE 215 BELGIUM HAZELNUT MARKET, BY CATEGORY, 2020-2029 (USD MILLION)
TABLE 216 BELGIUM HAZELNUT MARKET, BY SHAPE, 2020-2029 (USD MILLION)
TABLE 217 BELGIUM HAZELNUT MARKET, BY ORIGIN, 2020-2029 (USD MILLION)
TABLE 218 BELGIUM HAZELNUT MARKET, BY PACKAGING, 2020-2029 (USD MILLION)
TABLE 219 BELGIUM BAGS IN HAZELNUT MARKET, BY PACKAGING, 2020-2029 (USD MILLION)
TABLE 220 BELGIUM BIG BAGS IN HAZELNUT MARKET, BY SIZE, 2020-2029 (USD MILLION)
TABLE 221 BELGIUM HAZELNUT MARKET, BY APPLICATION, 2020-2029 (USD MILLION)
TABLE 222 BELGIUM INDUSTRIAL IN HAZELNUT MARKET, BY APPLICATION, 2020-2029 (USD MILLION)
TABLE 223 BELGIUM FOOD AND BEVERAGES IN HAZELNUT MARKET, BY APPLICATION, 2020-2029 (USD MILLION)
TABLE 224 BELGIUM CONFECTIONERY IN HAZELNUT MARKET, BY APPLICATION, 2020-2029 (USD MILLION)
TABLE 225 BELGIUM BAKERY IN HAZELNUT MARKET, BY APPLICATION, 2020-2029 (USD MILLION)
TABLE 226 BELGIUM DAIRY PRODUCTS IN HAZELNUT MARKET, BY APPLICATION, 2020-2029 (USD MILLION)
TABLE 227 BELGIUM BEVERAGES IN HAZELNUT MARKET, BY APPLICATION, 2020-2029 (USD MILLION)
TABLE 228 BELGIUM ALCOHOLIC BEVERAGES IN HAZELNUT MARKET, BY APPLICATION, 2020-2029 (USD MILLION)
TABLE 229 BELGIUM PERSONAL CARE & COSMETICS IN HAZELNUT MARKET, BY APPLICATION, 2020-2029 (USD MILLION)
TABLE 230 BELGIUM FOOD SERVICE INDUSTRY IN HAZELNUT MARKET, BY APPLICATION, 2020-2029 (USD MILLION)
TABLE 231 BELGIUM HAZELNUT MARKET, BY DISTRIBUTION CHANNEL, 2020-2029 (USD MILLION)
TABLE 232 BELGIUM INDIRECT IN HAZELNUT MARKET, BY DISTRIBUTION CHANNEL, 2020-2029 (USD MILLION)
TABLE 233 BELGIUM STORE-BASED RETAILING IN HAZELNUT MARKET, BY DISTRIBUTION CHANNEL, 2020-2029 (USD MILLION)
TABLE 234 BELGIUM NON-STORE RETAILING IN HAZELNUT MARKET, BY DISTRIBUTION CHANNEL, 2020-2029 (USD MILLION)
TABLE 235 NETHERLANDS HAZELNUT MARKET, BY FORM, 2020-2029 (USD MILLION)
TABLE 236 NETHERLANDS DICED HAZELNUT IN HAZELNUT MARKET, BY FORM, 2020-2029 (USD MILLION)
TABLE 237 NETHERLANDS PASTE HAZELNUT IN HAZELNUT MARKET, BY FORM, 2020-2029 (USD MILLION)
TABLE 238 NETHERLANDS HAZELNUT MARKET, BY CATEGORY, 2020-2029 (USD MILLION)
TABLE 239 NETHERLANDS HAZELNUT MARKET, BY SHAPE, 2020-2029 (USD MILLION)
TABLE 240 NETHERLANDS HAZELNUT MARKET, BY ORIGIN, 2020-2029 (USD MILLION)
TABLE 241 NETHERLANDS HAZELNUT MARKET, BY PACKAGING, 2020-2029 (USD MILLION)
TABLE 242 NETHERLANDS BAGS IN HAZELNUT MARKET, BY PACKAGING, 2020-2029 (USD MILLION)
TABLE 243 NETHERLANDS BIG BAGS IN HAZELNUT MARKET, BY SIZE, 2020-2029 (USD MILLION)
TABLE 244 NETHERLANDS HAZELNUT MARKET, BY APPLICATION, 2020-2029 (USD MILLION)
TABLE 245 NETHERLANDS INDUSTRIAL IN HAZELNUT MARKET, BY APPLICATION, 2020-2029 (USD MILLION)
TABLE 246 NETHERLANDS FOOD AND BEVERAGES IN HAZELNUT MARKET, BY APPLICATION, 2020-2029 (USD MILLION)
TABLE 247 NETHERLANDS CONFECTIONERY IN HAZELNUT MARKET, BY APPLICATION, 2020-2029 (USD MILLION)
TABLE 248 NETHERLANDS BAKERY IN HAZELNUT MARKET, BY APPLICATION, 2020-2029 (USD MILLION)
TABLE 249 NETHERLANDS DAIRY PRODUCTS IN HAZELNUT MARKET, BY APPLICATION, 2020-2029 (USD MILLION)
TABLE 250 NETHERLANDS BEVERAGES IN HAZELNUT MARKET, BY APPLICATION, 2020-2029 (USD MILLION)
TABLE 251 NETHERLANDS ALCOHOLIC BEVERAGES IN HAZELNUT MARKET, BY APPLICATION, 2020-2029 (USD MILLION)
TABLE 252 NETHERLANDS PERSONAL CARE & COSMETICS IN HAZELNUT MARKET, BY APPLICATION, 2020-2029 (USD MILLION)
TABLE 253 NETHERLANDS FOOD SERVICE INDUSTRY IN HAZELNUT MARKET, BY APPLICATION, 2020-2029 (USD MILLION)
TABLE 254 NETHERLANDS HAZELNUT MARKET, BY DISTRIBUTION CHANNEL, 2020-2029 (USD MILLION)
TABLE 255 NETHERLANDS INDIRECT IN HAZELNUT MARKET, BY DISTRIBUTION CHANNEL, 2020-2029 (USD MILLION)
TABLE 256 NETHERLANDS STORE-BASED RETAILING IN HAZELNUT MARKET, BY DISTRIBUTION CHANNEL, 2020-2029 (USD MILLION)
TABLE 257 NETHERLANDS NON-STORE RETAILING IN HAZELNUT MARKET, BY DISTRIBUTION CHANNEL, 2020-2029 (USD MILLION)
TABLE 258 POLAND HAZELNUT MARKET, BY FORM, 2020-2029 (USD MILLION)
TABLE 259 POLAND DICED HAZELNUT IN HAZELNUT MARKET, BY FORM, 2020-2029 (USD MILLION)
TABLE 260 POLAND PASTE HAZELNUT IN HAZELNUT MARKET, BY FORM, 2020-2029 (USD MILLION)
TABLE 261 POLAND HAZELNUT MARKET, BY CATEGORY, 2020-2029 (USD MILLION)
TABLE 262 POLAND HAZELNUT MARKET, BY SHAPE, 2020-2029 (USD MILLION)
TABLE 263 POLAND HAZELNUT MARKET, BY ORIGIN, 2020-2029 (USD MILLION)
TABLE 264 POLAND HAZELNUT MARKET, BY PACKAGING, 2020-2029 (USD MILLION)
TABLE 265 POLAND BAGS IN HAZELNUT MARKET, BY PACKAGING, 2020-2029 (USD MILLION)
TABLE 266 POLAND BIG BAGS IN HAZELNUT MARKET, BY SIZE, 2020-2029 (USD MILLION)
TABLE 267 POLAND HAZELNUT MARKET, BY APPLICATION, 2020-2029 (USD MILLION)
TABLE 268 POLAND INDUSTRIAL IN HAZELNUT MARKET, BY APPLICATION, 2020-2029 (USD MILLION)
TABLE 269 POLAND FOOD AND BEVERAGES IN HAZELNUT MARKET, BY APPLICATION, 2020-2029 (USD MILLION)
TABLE 270 POLAND CONFECTIONERY IN HAZELNUT MARKET, BY APPLICATION, 2020-2029 (USD MILLION)
TABLE 271 POLAND BAKERY IN HAZELNUT MARKET, BY APPLICATION, 2020-2029 (USD MILLION)
TABLE 272 POLAND DAIRY PRODUCTS IN HAZELNUT MARKET, BY APPLICATION, 2020-2029 (USD MILLION)
TABLE 273 POLAND BEVERAGES IN HAZELNUT MARKET, BY APPLICATION, 2020-2029 (USD MILLION)
TABLE 274 POLAND ALCOHOLIC BEVERAGES IN HAZELNUT MARKET, BY APPLICATION, 2020-2029 (USD MILLION)
TABLE 275 POLAND PERSONAL CARE & COSMETICS IN HAZELNUT MARKET, BY APPLICATION, 2020-2029 (USD MILLION)
TABLE 276 POLAND FOOD SERVICE INDUSTRY IN HAZELNUT MARKET, BY APPLICATION, 2020-2029 (USD MILLION)
TABLE 277 POLAND HAZELNUT MARKET, BY DISTRIBUTION CHANNEL, 2020-2029 (USD MILLION)
TABLE 278 POLAND INDIRECT IN HAZELNUT MARKET, BY DISTRIBUTION CHANNEL, 2020-2029 (USD MILLION)
TABLE 279 POLAND STORE-BASED RETAILING IN HAZELNUT MARKET, BY DISTRIBUTION CHANNEL, 2020-2029 (USD MILLION)
TABLE 280 POLAND NON-STORE RETAILING IN HAZELNUT MARKET, BY DISTRIBUTION CHANNEL, 2020-2029 (USD MILLION)
TABLE 281 TURKEY HAZELNUT MARKET, BY FORM, 2020-2029 (USD MILLION)
TABLE 282 TURKEY DICED HAZELNUT IN HAZELNUT MARKET, BY FORM, 2020-2029 (USD MILLION)
TABLE 283 TURKEY PASTE HAZELNUT IN HAZELNUT MARKET, BY FORM, 2020-2029 (USD MILLION)
TABLE 284 TURKEY HAZELNUT MARKET, BY CATEGORY, 2020-2029 (USD MILLION)
TABLE 285 TURKEY HAZELNUT MARKET, BY SHAPE, 2020-2029 (USD MILLION)
TABLE 286 TURKEY HAZELNUT MARKET, BY ORIGIN, 2020-2029 (USD MILLION)
TABLE 287 TURKEY HAZELNUT MARKET, BY PACKAGING, 2020-2029 (USD MILLION)
TABLE 288 TURKEY BAGS IN HAZELNUT MARKET, BY PACKAGING, 2020-2029 (USD MILLION)
TABLE 289 TURKEY BIG BAGS IN HAZELNUT MARKET, BY SIZE, 2020-2029 (USD MILLION)
TABLE 290 TURKEY HAZELNUT MARKET, BY APPLICATION, 2020-2029 (USD MILLION)
TABLE 291 TURKEY INDUSTRIAL IN HAZELNUT MARKET, BY APPLICATION, 2020-2029 (USD MILLION)
TABLE 292 TURKEY FOOD AND BEVERAGES IN HAZELNUT MARKET, BY APPLICATION, 2020-2029 (USD MILLION)
TABLE 293 TURKEY CONFECTIONERY IN HAZELNUT MARKET, BY APPLICATION, 2020-2029 (USD MILLION)
TABLE 294 TURKEY BAKERY IN HAZELNUT MARKET, BY APPLICATION, 2020-2029 (USD MILLION)
TABLE 295 TURKEY DAIRY PRODUCTS IN HAZELNUT MARKET, BY APPLICATION, 2020-2029 (USD MILLION)
TABLE 296 TURKEY BEVERAGES IN HAZELNUT MARKET, BY APPLICATION, 2020-2029 (USD MILLION)
TABLE 297 TURKEY ALCOHOLIC BEVERAGES IN HAZELNUT MARKET, BY APPLICATION, 2020-2029 (USD MILLION)
TABLE 298 TURKEY PERSONAL CARE & COSMETICS IN HAZELNUT MARKET, BY APPLICATION, 2020-2029 (USD MILLION)
TABLE 299 TURKEY FOOD SERVICE INDUSTRY IN HAZELNUT MARKET, BY APPLICATION, 2020-2029 (USD MILLION)
TABLE 300 TURKEY HAZELNUT MARKET, BY DISTRIBUTION CHANNEL, 2020-2029 (USD MILLION)
TABLE 301 TURKEY INDIRECT IN HAZELNUT MARKET, BY DISTRIBUTION CHANNEL, 2020-2029 (USD MILLION)
TABLE 302 TURKEY STORE-BASED RETAILING IN HAZELNUT MARKET, BY DISTRIBUTION CHANNEL, 2020-2029 (USD MILLION)
TABLE 303 TURKEY NON-STORE RETAILING IN HAZELNUT MARKET, BY DISTRIBUTION CHANNEL, 2020-2029 (USD MILLION)
TABLE 304 SWEDEN HAZELNUT MARKET, BY FORM, 2020-2029 (USD MILLION)
TABLE 305 SWEDEN DICED HAZELNUT IN HAZELNUT MARKET, BY FORM, 2020-2029 (USD MILLION)
TABLE 306 SWEDEN PASTE HAZELNUT IN HAZELNUT MARKET, BY FORM, 2020-2029 (USD MILLION)
TABLE 307 SWEDEN HAZELNUT MARKET, BY CATEGORY, 2020-2029 (USD MILLION)
TABLE 308 SWEDEN HAZELNUT MARKET, BY SHAPE, 2020-2029 (USD MILLION)
TABLE 309 SWEDEN HAZELNUT MARKET, BY ORIGIN, 2020-2029 (USD MILLION)
TABLE 310 SWEDEN HAZELNUT MARKET, BY PACKAGING, 2020-2029 (USD MILLION)
TABLE 311 SWEDEN BAGS IN HAZELNUT MARKET, BY PACKAGING, 2020-2029 (USD MILLION)
TABLE 312 SWEDEN BIG BAGS IN HAZELNUT MARKET, BY SIZE, 2020-2029 (USD MILLION)
TABLE 313 SWEDEN HAZELNUT MARKET, BY APPLICATION, 2020-2029 (USD MILLION)
TABLE 314 SWEDEN INDUSTRIAL IN HAZELNUT MARKET, BY APPLICATION, 2020-2029 (USD MILLION)
TABLE 315 SWEDEN FOOD AND BEVERAGES IN HAZELNUT MARKET, BY APPLICATION, 2020-2029 (USD MILLION)
TABLE 316 SWEDEN CONFECTIONERY IN HAZELNUT MARKET, BY APPLICATION, 2020-2029 (USD MILLION)
TABLE 317 SWEDEN BAKERY IN HAZELNUT MARKET, BY APPLICATION, 2020-2029 (USD MILLION)
TABLE 318 SWEDEN DAIRY PRODUCTS IN HAZELNUT MARKET, BY APPLICATION, 2020-2029 (USD MILLION)
TABLE 319 SWEDEN BEVERAGES IN HAZELNUT MARKET, BY APPLICATION, 2020-2029 (USD MILLION)
TABLE 320 SWEDEN ALCOHOLIC BEVERAGES IN HAZELNUT MARKET, BY APPLICATION, 2020-2029 (USD MILLION)
TABLE 321 SWEDEN PERSONAL CARE & COSMETICS IN HAZELNUT MARKET, BY APPLICATION, 2020-2029 (USD MILLION)
TABLE 322 SWEDEN FOOD SERVICE INDUSTRY IN HAZELNUT MARKET, BY APPLICATION, 2020-2029 (USD MILLION)
TABLE 323 SWEDEN HAZELNUT MARKET, BY DISTRIBUTION CHANNEL, 2020-2029 (USD MILLION)
TABLE 324 SWEDEN INDIRECT IN HAZELNUT MARKET, BY DISTRIBUTION CHANNEL, 2020-2029 (USD MILLION)
TABLE 325 SWEDEN STORE-BASED RETAILING IN HAZELNUT MARKET, BY DISTRIBUTION CHANNEL, 2020-2029 (USD MILLION)
TABLE 326 SWEDEN NON-STORE RETAILING IN HAZELNUT MARKET, BY DISTRIBUTION CHANNEL, 2020-2029 (USD MILLION)
TABLE 327 DENMARK HAZELNUT MARKET, BY FORM, 2020-2029 (USD MILLION)
TABLE 328 DENMARK DICED HAZELNUT IN HAZELNUT MARKET, BY FORM, 2020-2029 (USD MILLION)
TABLE 329 DENMARK PASTE HAZELNUT IN HAZELNUT MARKET, BY FORM, 2020-2029 (USD MILLION)
TABLE 330 DENMARK HAZELNUT MARKET, BY CATEGORY, 2020-2029 (USD MILLION)
TABLE 331 DENMARK HAZELNUT MARKET, BY SHAPE, 2020-2029 (USD MILLION)
TABLE 332 DENMARK HAZELNUT MARKET, BY ORIGIN, 2020-2029 (USD MILLION)
TABLE 333 DENMARK HAZELNUT MARKET, BY PACKAGING, 2020-2029 (USD MILLION)
TABLE 334 DENMARK BAGS IN HAZELNUT MARKET, BY PACKAGING, 2020-2029 (USD MILLION)
TABLE 335 DENMARK BIG BAGS IN HAZELNUT MARKET, BY SIZE, 2020-2029 (USD MILLION)
TABLE 336 DENMARK HAZELNUT MARKET, BY APPLICATION, 2020-2029 (USD MILLION)
TABLE 337 DENMARK INDUSTRIAL IN HAZELNUT MARKET, BY APPLICATION, 2020-2029 (USD MILLION)
TABLE 338 DENMARK FOOD AND BEVERAGES IN HAZELNUT MARKET, BY APPLICATION, 2020-2029 (USD MILLION)
TABLE 339 DENMARK CONFECTIONERY IN HAZELNUT MARKET, BY APPLICATION, 2020-2029 (USD MILLION)
TABLE 340 DENMARK BAKERY IN HAZELNUT MARKET, BY APPLICATION, 2020-2029 (USD MILLION)
TABLE 341 DENMARK DAIRY PRODUCTS IN HAZELNUT MARKET, BY APPLICATION, 2020-2029 (USD MILLION)
TABLE 342 DENMARK BEVERAGES IN HAZELNUT MARKET, BY APPLICATION, 2020-2029 (USD MILLION)
TABLE 343 DENMARK ALCOHOLIC BEVERAGES IN HAZELNUT MARKET, BY APPLICATION, 2020-2029 (USD MILLION)
TABLE 344 DENMARK PERSONAL CARE & COSMETICS IN HAZELNUT MARKET, BY APPLICATION, 2020-2029 (USD MILLION)
TABLE 345 DENMARK FOOD SERVICE INDUSTRY IN HAZELNUT MARKET, BY APPLICATION, 2020-2029 (USD MILLION)
TABLE 346 DENMARK HAZELNUT MARKET, BY DISTRIBUTION CHANNEL, 2020-2029 (USD MILLION)
TABLE 347 DENMARK INDIRECT IN HAZELNUT MARKET, BY DISTRIBUTION CHANNEL, 2020-2029 (USD MILLION)
TABLE 348 DENMARK STORE-BASED RETAILING IN HAZELNUT MARKET, BY DISTRIBUTION CHANNEL, 2020-2029 (USD MILLION)
TABLE 349 DENMARK NON-STORE RETAILING IN HAZELNUT MARKET, BY DISTRIBUTION CHANNEL, 2020-2029 (USD MILLION)
TABLE 350 REST OF EUROPE HAZELNUT MARKET, BY FORM, 2020-2029 (USD MILLION)
List of Figure
FIGURE 1 EUROPE HAZELNUT MARKET: SEGMENTATION
FIGURE 2 EUROPE HAZELNUT MARKET: DATA TRIANGULATION
FIGURE 3 EUROPE HAZELNUT MARKET: DROC ANALYSIS
FIGURE 4 EUROPE HAZELNUT MARKET : REGIONAL VS COUNTRY MARKET ANALYSIS
FIGURE 5 EUROPE HAZELNUT MARKET : COMPANY RESEARCH ANALYSIS
FIGURE 6 EUROPE HAZELNUT MARKET: INTERVIEW DEMOGRAPHICS
FIGURE 7 EUROPE HAZELNUT MARKET: DBMR MARKET POSITION GRID
FIGURE 8 EUROPE HAZELNUT MARKET: VENDOR SHARE ANALYSIS
FIGURE 9 EUROPE HAZELNUT MARKET: SEGMENTATION
FIGURE 10 RISING DEMAND FOR HAZELNUTS IN WIDE INDUSTRIAL APPLICATIONS AND GROWING DEMAND FROM CONSUMERS DUE TO THE HEALTH BENEFITS ARE EXPECTED TO THE DRIVE THE EUROPE HAZELNUT MARKET IN THE FORECAST PERIOD OF 2022 TO 2029
FIGURE 11 WHOLE/IN-SHELL HAZELNUT SEGMENT IS EXPECTED TO ACCOUNT FOR THE LARGEST SHARE OF THE EUROPE HAZELNUT MARKET IN 2020 & 2027
FIGURE 12 PRODUCTION KERNAL BASIS/METRIC TONS (2021/2022)
FIGURE 13 10 YEAR AVERAGE WORLD HAZELNUT PRODUCTION (KERNAL BASIS)
FIGURE 14 WORLD HAZELNUT EXPORTS –SHELLED BASIS/(METRIC TONS)
FIGURE 15 10 YEAR AVERAGE WORLD HAZELNUT EXPORT – SHELLED BASIS (METRIC TONS)
FIGURE 16 10 YEAR AVERAGE PRODUCERS PRICES OF HAZELNUTS (IN USD/KG)
FIGURE 17 AVERAGE HAZELNUT PRICING STRUCTURE, BY CHANNEL
FIGURE 18 DRIVERS, RESTRAINTS, OPPORTUNITIES AND CHALLENGE OF EUROPE HAZELNUT MARKET
FIGURE 19 EUROPE HAZELNUT MARKET, BY FORM, 2021
FIGURE 20 EUROPE HAZELNUT MARKET, BY CATEGORY, 2021
FIGURE 21 EUROPE HAZELNUT MARKET, BY SHAPE, 2021
FIGURE 22 EUROPE HAZELNUT MARKET, BY ORIGIN, 2021
FIGURE 23 EUROPE HAZELNUT MARKET, BY MATERIAL, 2021
FIGURE 24 EUROPE HAZELNUT MARKET, BY APPLICATION, 2021
FIGURE 25 EUROPE HAZELNUT MARKET: BY DISTRIBUTION CHANNEL, 2021
FIGURE 26 EUROPE HAZELNUT MARKET: SNAPSHOT (2021)
FIGURE 27 EUROPE HAZELNUT MARKET: BY COUNTRY (2021)
FIGURE 28 EUROPE HAZELNUT MARKET: BY COUNTRY (2022 & 2029)
FIGURE 29 EUROPE HAZELNUT MARKET: BY COUNTRY (2021 & 2029)
FIGURE 30 EUROPE HAZELNUT MARKET: BY FORM (2022-2029)
FIGURE 31 EUROPE HAZELNUT MARKET: COMPANY SHARE 2021 (%)
Europe Hazelnut Market, Supply Chain Analysis and Ecosystem Framework
To support market growth and help clients navigate the impact of geopolitical shifts, DBMR has integrated in-depth supply chain analysis into its Europe Hazelnut Market research reports. This addition empowers clients to respond effectively to global changes affecting their industries. The supply chain analysis section includes detailed insights such as Europe Hazelnut Market consumption and production by country, price trend analysis, the impact of tariffs and geopolitical developments, and import and export trends by country and HSN code. It also highlights major suppliers with data on production capacity and company profiles, as well as key importers and exporters. In addition to research, DBMR offers specialized supply chain consulting services backed by over a decade of experience, providing solutions like supplier discovery, supplier risk assessment, price trend analysis, impact evaluation of inflation and trade route changes, and comprehensive market trend analysis.
Data collection and base year analysis are done using data collection modules with large sample sizes. The stage includes obtaining market information or related data through various sources and strategies. It includes examining and planning all the data acquired from the past in advance. It likewise envelops the examination of information inconsistencies seen across different information sources. The market data is analysed and estimated using market statistical and coherent models. Also, market share analysis and key trend analysis are the major success factors in the market report. To know more, please request an analyst call or drop down your inquiry.
The key research methodology used by DBMR research team is data triangulation which involves data mining, analysis of the impact of data variables on the market and primary (industry expert) validation. Data models include Vendor Positioning Grid, Market Time Line Analysis, Market Overview and Guide, Company Positioning Grid, Patent Analysis, Pricing Analysis, Company Market Share Analysis, Standards of Measurement, Global versus Regional and Vendor Share Analysis. To know more about the research methodology, drop in an inquiry to speak to our industry experts.
Data Bridge Market Research is a leader in advanced formative research. We take pride in servicing our existing and new customers with data and analysis that match and suits their goal. The report can be customized to include price trend analysis of target brands understanding the market for additional countries (ask for the list of countries), clinical trial results data, literature review, refurbished market and product base analysis. Market analysis of target competitors can be analyzed from technology-based analysis to market portfolio strategies. We can add as many competitors that you require data about in the format and data style you are looking for. Our team of analysts can also provide you data in crude raw excel files pivot tables (Fact book) or can assist you in creating presentations from the data sets available in the report.


