Europe Power Over Ethernet Poe Market
Market Size in USD Million
CAGR :
% 
 USD
618.95 Million
USD
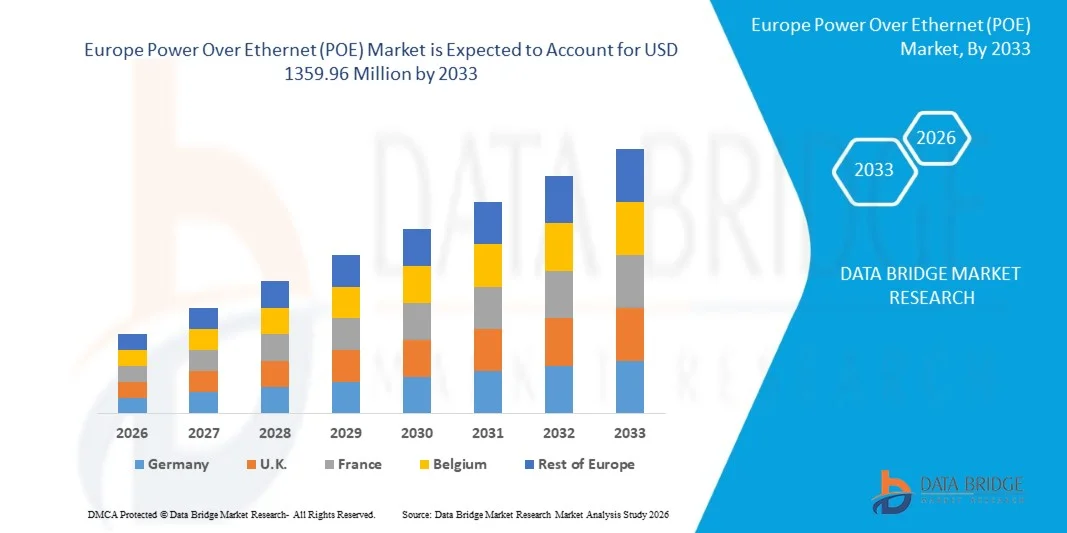
1,359.96 Million
2025
2033
USD
618.95 Million
USD
1,359.96 Million
2025
2033
| 2026 –2033 | |
| USD 618.95 Million | |
| USD 1,359.96 Million | |
| % | |
|
Europe Power Over Ethernet (POE) Market Size
- The Europe Power Over Ethernet (POE) Market is expected to reach USD 1359.96 million by 2033 from USD 95 million in 2025, growing with a CAGR of 11.4% in the forecast period of 2026 to 2033.
- The Europe PoE market is experiencing consistent growth, driven by the increasing adoption of Power Over Ethernet technology across critical sectors such as enterprise networking, smart buildings, data centers, industrial automation, and security systems. PoE solutions are increasingly recognized for their ability to simplify network infrastructure, reduce installation costs, enhance energy efficiency, and deliver reliable power and data transmission over a single cable.
- Continuous technological advancements in PoE standards, high-efficiency power delivery, intelligent network management, and integration with IoT devices are fueling the deployment of next-generation PoE solutions. These innovations are enabling sophisticated applications including smart surveillance systems, networked lighting, VoIP communications, and industrial IoT deployments, thereby supporting improved operational efficiency, scalability, and long-term cost savings.
Europe Power Over Ethernet (POE) Market Analysis
- The Europe PoE market caters to a wide range of end-use sectors, including enterprise IT networks, smart buildings, industrial automation, security and surveillance systems, and data centers. Market demand is largely fueled by PoE technology’s ability to deliver both power and data over a single cable, along with enhanced network management, scalability, and energy efficiency—positioning it as a critical solution for complex connectivity requirements and mission-critical network operations.
- Increasing integration of advanced technologies such as artificial intelligence, machine learning–driven network management, smart power allocation, and real-time monitoring is enhancing the efficiency, reliability, and scalability of PoE systems. These innovations are supporting market growth across commercial, industrial, and government network applications.
- The U.K. is expected to dominate the Europe PoE market with the largest market share of 16.27% in 2025 and is also projected to record strong growth. This dominance is supported by the country’s well-established enterprise IT infrastructure, advanced smart building initiatives, and extensive adoption of connected devices across commercial and industrial networks. Strong demand from data centers, corporate offices, industrial automation, and security systems, along with the presence of leading network solution providers and continuous technological innovation, further strengthens the Germany market leadership and sustained growth potential in the region.
- The U.K. PoE market is projected to register one of the fastest CAGRs with 13.0% in the region from 2026 to 2033, driven by rising investments in smart building infrastructure, expanding enterprise IT networks, and growing adoption of connected IoT devices. Growth is further supported by technological advancements in high-efficiency power delivery, intelligent network management, and PoE standards, as well as supportive government initiatives promoting energy-efficient and digitally connected infrastructure enabling enhanced operational efficiency, scalability, and reliability in mission-critical network deployments.
- In 2025, the powered devices (PD) segment is expected to account for a leading share of 46.79% of the Europe PoE market, driven by widespread adoption across enterprise networking, smart building automation, security systems, and industrial IoT deployments. The segment benefits from proven operational reliability, simplified infrastructure requirements, and cost-effectiveness for powering connected devices over long cable runs, positioning PoE-enabled devices as the preferred solution compared to traditional separate power-and-data setups in complex network environments.
Report Scope and Europe Power Over Ethernet (POE) Market Segmentation
|
Attributes |
Europe Power Over Ethernet (POE) Key Market Insights |
|
Segments Covered |
· By Type: Powered Devices (PD), Power Sourcing Equipment (PSE) and Network Cable · By Class Type: Class 4, Class 3, Class 0, Class 2, Class 1 and Others · By Mode: Mode A and Mode B · By Power Range: Up to 15 W, 15 W to 30 W, 30 W to 60 W, 60 W to 90 W and Above 90 W · By Voltage Range: Up to 30 V, 30 V to 40 V, 40 V to 50 V and Above 50 V · By Device Type: PoE Switch (Endspan), IP Cameras, Wireless Access Points, Voice over Internet Protocol (VoIP) & IP Phones, PoE Injector (Midspan), PTZ Cameras, PoE Lighting, Security Card Readers, IP Intercoms, IP Clocks, ATMs and Others · By Application: Access Control & Security, IoT Connectivity, Lighting Control, Infotainment and Others · By End User: Commercial, Industrial and Residential |
|
Countries Covered |
· Germany · France · U.K. · Netherlands · Switzerland · Belgium · Russia · Italy · Spain · Turkey · Rest of Europe |
|
Key Market Players |
· Versa Technology, Inc. (U.S.) · Texas Instruments Incorporated (U.S.) · Cisco Systems, Inc. (U.S.) · Monolithic Power Systems, Inc. (U.S.) · STMicroelectronics N.V. (Switzerland/France) · Intellinet Network Solutions (U.S.) · Veracity UK Ltd (UK) · Molex, LLC (U.S.) · Microchip Technology Incorporated (U.S.) · NETGEAR, Inc. (U.S.) · Analog Devices, Inc. (U.S.) · Semiconductor Components Industries, LLC (U.S.) · EtherWAN Systems, Inc. (U.S.) · TP-Link Corporation Limited (China) · Black Box Corporation (U.S.) · Edimax Technology Co., Ltd. (Taiwan) · Siemens AG (Germany) · Hewlett Packard Enterprise Development LP (U.S.) · R&M (Reichle & De-Massari AG) (Switzerland) · Eaton Corporation plc (Tripp Lite) (Ireland/U.S.) · Advantech Co., Ltd. (Taiwan) · Broadcom Inc. (U.S.) · TRENDnet, Inc. (U.S.) · CommScope Holding Company, Inc. (U.S.) · ECI Networks Ltd. (UK) · Allied Telesis, Inc. (Japan) |
|
Market Opportunities |
· Growth of industrial IoT, Industry 4.0, and edge computing deployments, where PoE can simplify powering distributed sensors, cameras, and controllers. · Increasing adoption in healthcare, retail, transportation, and education for connected devices such as displays, kiosks, security systems, and access control. · Development of higher-power and more efficient PoE standards and chipsets, broadening the range of supported devices and use cases |
|
Value Added Data Infosets |
In addition to the insights on market scenarios such as market value, growth rate, segmentation, geographical coverage, and major players, the market reports curated by the Data Bridge Market Research also include in-depth expert analysis, geographically represented company-wise production and capacity, network layouts of distributors and partners, detailed and updated price trend analysis and deficit analysis of supply chain and demand. |
Power Over Ethernet (POE) Market Trends
“Accelerating Deployment of IP Cameras, Wireless Access Points, VoIP Phones, Access Control, and IoT Devices”
- The accelerating deployment of IP cameras, wireless access points, VoIP phones, access control systems, and a rapidly expanding base of IoT devices is significantly driving the growth trajectory of the global Power Over Ethernet PoE market.
- As enterprises, governments, transportation authorities, healthcare institutions, and smart city planners modernize infrastructure, there is a strong shift toward unified IP based networks that transmit both data and power over a single Ethernet cable.
- This reduces cabling complexity, lowers installation costs, improves energy efficiency, and enables centralized power management. Increasing security surveillance mandates, public Wi Fi expansion, digital classrooms, smart hospitals, and intelligent building automation are creating dense device environments where PoE switches and injectors are becoming foundational infrastructure. The proliferation of edge devices requiring reliable low voltage power is therefore transforming PoE from a convenience technology into a strategic backbone for connected ecosystems worldwide.
For instance,
- In July 2025, Tech2 Smart City Platforms & Urban Tech Update noted that a French city deployed a private 5G network to reduce costs of backhaul for public CCTV systems and enable encrypted connectivity for future IoT deployments.
- The above developments across globereflect a structural transition toward IP driven physical infrastructure and connected environments. Large scale public investments in smart governance, digital connectivity, transportation intelligence, and security modernization are consistently increasing the density of powered edge devices
Power Over Ethernet (POE) Market Dynamics
Driver
“Growing Adoption of Smart Buildings, Smart Cities, and Intelligent Infrastructure, Where PoE Simplifies Cabling, Reduces Installation Time, and Lowers Total Cost of Ownership”
- The growing adoption of smart buildings, smart cities, and intelligent infrastructure is emerging as a strong structural driver for the global Power Over Ethernet PoE market. Governments and urban planners worldwide are prioritizing digitally integrated infrastructure where lighting systems, surveillance cameras, wireless access points, digital signage, building automation controls, and IoT sensors operate over unified IP networks. In these environments, PoE technology simplifies cabling architecture by transmitting both power and data through a single Ethernet cable, significantly reducing wiring complexity, lowering installation time, and minimizing overall material and labor costs.
- As public infrastructure projects increasingly embed intelligent monitoring, energy management, and security systems into core designs, PoE enabled switches and injectors are becoming foundational to cost efficient and scalable deployment.
- The transition toward low voltage intelligent infrastructure across commercial buildings, transport hubs, healthcare facilities, educational campuses, and municipal projects is therefore accelerating long term demand for PoE solutions globally.
For Instance,
- In August 2025, Sony Semiconductor Solutions reported deployments of advanced edge AI sensing technologies in smart city applications in Lakewood, Colorado and San José, California, demonstrating how connected sensing platforms are being scaled up for safer, more intelligent urban mobility and infrastructure.
- In March 2025, arXiv documented the SmartSantander project in Spain, which involves large‑scale deployment of IoT devices and sensors throughout the city to support smart city experimentation and real‑life connected services across mobility, environment, and safety domains .
- The above developments across major economies demonstrate a sustained global shift toward intelligent and digitally connected infrastructure. As governments embed smart systems into urban planning and building modernization, the need for simplified power and data integration becomes critical. PoE technology directly aligns with these requirements by reducing cabling complexity, lowering installation costs, improving scalability, and enhancing centralized control. The continuous expansion of smart cities and connected buildings across regions therefore reinforces strong medium to long term growth momentum for the global Power Over Ethernet market.
Restraint/Challenge
“Higher Upfront Costs of PoE-Capable Switches, Midspans, and Compliant Cabling Compared with Conventional Networking Equipment in Cost-Sensitive Deployments”
- The higher upfront costs associated with PoE‑capable switches, midspans, and compliant cabling infrastructure remain a notable restraint on expansion of the global Power Over Ethernet (PoE) market, particularly in cost‑sensitive environments. While PoE technology delivers long‑term efficiency and centralized power and network management, initial capital investment requirements including premium priced network switches, specialized patch panels, Category 6/6A cabling, and professional installation can be significantly higher than conventional non‑PoE network deployments.
- These higher upfront costs particularly constrain smaller enterprises, public institutions, and budget‑limited projects where infrastructure budgets are tightly regulated. Furthermore, retrofitting legacy buildings with PoE‑ready structured cabling often necessitates extensive upgrades, adding to project costs.
- As a result, even though PoE offers operational savings over time, large initial expenses can delay adoption decisions and reduce penetration in price‑competitive segments, thereby tempering overall market growth.
For instance,
- In June 2024, EdTech Magazine reported that many educational districts are struggling to secure funding to upgrade network infrastructure such as high‑performance switches and cabling to support advanced connectivity devices, noting that cost constraints delay adoption of modern network systems including PoE‑capable installations.
- In July 2024, E School News reported that schools face expensive upgrade costs for cabling and switches to support PoE networking hardware, with limited eligibility of federal discount funding for these projects reducing adoption.
- Even as Power Over Ethernet technology offers operational efficiencies, simplified cabling, and improved centralized power and network monitoring, its higher upfront costs remain a material restraint in cost‑sensitive segments. Infrastructure projects requiring extensive cabling upgrades, premium PoE‑capable switches, and professional installation services place fiscal pressure on organizations with limited capital budgets, such as school districts, small municipalities, and mid‑sized enterprise.
Power Over Ethernet (POE) Market Scope
The Europe power over ethernet (POE) Market is segmented into eight notable segments based on type, class type, modes, power range, voltage range, device type, application, and end-user
By Type
On the basis of Type, the market is segmented into Powered Devices (PD), Power Sourcing Equipment (PSE), and Network Cable. In 2026, the Powered Devices (PD) segment is anticipated to dominate the market with 46.80% market share due to its critical role in delivering reliable power and data over a single cable, simplifying network infrastructure, and supporting a wide range of connected devices across enterprise, industrial, and commercial applications.
The Network Cable segment in the market is expected to grow the fastest with a CAGR of 12.1% from 2026 to 2033, driven by increasing deployment of high-speed, high-capacity PoE networks, growing adoption of cloud-managed enterprise networks, and expanding applications in smart buildings, security systems, and industrial IoT that require robust cabling solutions for reliable connectivity.
By Class Type
On the basis of Class Type, the market is segmented into Class 4, Class 3, Class 0, Class 2, Class 1, and Others. In 2026, the Class 4 segment is anticipated to dominate the market with 27.30% market share due to its higher power delivery capacity, ability to support demanding enterprise and industrial applications, and increasing adoption in high-performance network devices and smart infrastructure deployments.
The Class 3 segment in the market is expected to grow the fastest with a CAGR of 12.1% from 2026 to 2033, driven by growing deployment of mid-power PoE devices, expanding IoT connectivity, and increasing demand for networked security, lighting, and communication systems that rely on efficient, scalable power delivery.
By Mode
On the basis of Mode, the market is segmented into Mode A and Mode B. In 2026, the Mode A segment is anticipated to dominate the market with 63.49% market share due to its widespread implementation in enterprise and commercial networking equipment, simplified wiring requirements, and compatibility with a wide range of PoE-enabled devices.
The Mode B segment in the market is expected to grow the fastest with a CAGR of 12.2% from 2026 to 2033, driven by increasing adoption of midspan injectors, high-power applications, and expanding use in industrial IoT, smart buildings, and networked security and lighting systems that require flexible power delivery solutions.
By Power Range
On the basis of power range, the market is segmented into Upto 15 W, 15 W to 30 W, 30 W to 60 W, 60 W to 90 W, and Above 90 W. In 2026, the 15 W to 30 W segment is anticipated to dominate the market with 34.07% market share due to its critical role in enabling automation, real-time data capture, and labor efficiency, along with increasing adoption across a wide range of standard and mid-capacity applications.
The 60 W to 90 W segment is expected to grow the fastest with a CAGR of 12.1% from 2026 to 2033, driven by rising demand for higher power capacity solutions, expanding deployment in advanced operational environments, and increasing integration of intelligent monitoring and performance optimization technologies.
By Voltage Range
On the basis of voltage range, the market is segmented into Up to 30 V, 30 V to 40 V, 40 V to 50 V, and Above 50 V. In 2026, the 40 V to 50 V segment is anticipated to dominate the market with 38.57% market share due to its critical role in enabling efficient power delivery, supporting automation, and enhancing system reliability across commercial and industrial applications.
The Above 50 V segment is expected to grow the fastest with a CAGR of 11.6% from 2026 to 2033, driven by increasing adoption of high-voltage equipment in advanced automation systems, integration with AI-driven monitoring tools, and rising demand for scalable, energy-efficient solutions in large-scale operations.
By device type
On the basis of device type, the market is segmented into PoE Switch (Endspan), PoE Injector (Midspan), IP Cameras, PTZ Cameras, Wireless Access Points, Voice over Internet Protocol (VoIP) & IP Phones, PoE Lighting, Security Card Readers, IP Intercoms, IP Clocks, ATMs, and Others.
In 2026, the PoE Switch (Endspan) segment is anticipated to dominate the market with 26.77% market share due to its critical role in enabling efficient power and data transmission over Ethernet networks, supporting automation, real-time monitoring, and connectivity across enterprises, smart buildings, and commercial installations.
The PoE Lighting segment is expected to grow the fastest with a CAGR of 13.0% from 2026 to 2033, driven by increasing adoption of energy-efficient lighting systems, integration with smart building management platforms, IoT-enabled automation, and rising demand for scalable, low-maintenance illumination solutions across commercial, industrial, and public infrastructure projects..
By Application
On the basis of application, the market is segmented into Access Control & Security, IoT Connectivity, Lighting Control, Infotainment, and Others.
In 2026, the Access Control & Security segment is anticipated to dominate the market with 30.83% market share due to its critical role in ensuring safety, enabling automated monitoring, and improving operational efficiency across commercial, industrial, and public infrastructure environments.
The Lighting Control segment is expected to grow the fastest with a CAGR of 11.9% from 2026 to 2033, driven by increasing adoption of smart and energy-efficient lighting systems, integration with IoT-enabled building management platforms, and rising demand for automated, adaptive lighting solutions in commercial and industrial settings.
By End User
On the basis of end user, the market is segmented into Commercial, Industrial, and Residential.
In 2026, the Commercial segment is anticipated to dominate the market with 62.63% market share due to its critical role in supporting large-scale operations, enabling automation, real-time monitoring, and enhanced connectivity across offices, retail spaces, and enterprise infrastructures.
The Industrial segment is expected to grow the fastest with a CAGR of 12.0% from 2026 to 2033, driven by increasing adoption of IoT-enabled industrial automation, smart factory solutions, energy-efficient systems, and AI-driven operational monitoring that optimize productivity, safety, and resource management
Power Over Ethernet (POE) Market Country Analysis
- In 2026, the U.K. is expected to hold the largest share of the Europe Power Over Ethernet (PoE) Market, accounting for 16.51% of regional demand. With a projected CAGR of 13.0%, growth is driven by accelerating deployment of IP-based surveillance systems, expansion of smart building infrastructure, increasing adoption of IoT-enabled devices, and rising demand for energy-efficient networking solutions across commercial, industrial, healthcare, and government sectors.
- The region benefits from advanced digital infrastructure, strong presence of leading networking equipment manufacturers, supportive regulatory frameworks promoting energy efficiency, and continuous investments in data centers and enterprise IT upgrades. Expanding end-use applications across smart offices, connected healthcare facilities, industrial automation, retail digitization, and intelligent transportation systems continue to strengthen market penetration and long-term growth potential.
U.K. Power Over Ethernet (POE) Market Insight
The U.S. Power Over Ethernet (POE) market commands the largest share across Europe, supported by the nation’s robust offshore energy network, advanced maritime expertise, and a mature subsea engineering landscape. Extensive offshore oil & gas activities in the Gulf of Mexico, expanding offshore wind projects along the Atlantic coast, and rising investments in marine research and defense upgrades are substantially driving the adoption of autonomous and remotely operated underwater vehicles.
Industry operators throughout the U.S. are increasingly integrating AUV and ROV systems for subsea inspections, pipeline surveillance, underwater infrastructure development, seabed mapping, and security monitoring. This growing deployment helps improve operational productivity, maintain infrastructure reliability, and reduce human involvement in hazardous deep-water operations, thereby strengthening overall market expansion.
Germany Power Over Ethernet (POE) Market Insight
The Germany Power Over Ethernet (POE) market is anticipated to register the faster growth within Europe, fueled by rising investments in offshore renewable energy developments, expanding naval defense modernization initiatives, and increasing emphasis on deep-water exploration and marine research programs. Mexico’s growing maritime economy, supported by its extensive coastlines along the Gulf of Mexico and Pacific Ocean and its strategic naval operations, is accelerating the deployment of advanced autonomous and remotely operated underwater systems for subsea inspection, offshore platform monitoring, underwater surveillance, and environmental assessment activities.
Heightened focus on maritime security, sustainable ocean resource utilization, and innovation in underwater robotics is further strengthening market momentum. Moreover, the presence of established marine engineering service providers, government-supported research bodies, and collaborative defense-industry partnerships is enhancing technological progress and system integration capabilities. Mexico’s ongoing commitment to offshore energy expansion, digitalization of maritime operations, and strategic defense investments positions it as the fastest-growing and increasingly innovation-oriented market within the Europe Power Over Ethernet (POE) landscape.
Power Over Ethernet (POE) Market Share
The Power Over Ethernet (POE)is primarily led by well-established companies, including
- Kongsberg Maritime (Norway)
- Versa Technology, Inc. (U.S.)
- Texas Instruments Incorporated (U.S.)
- Cisco Systems, Inc. (U.S.)
- Monolithic Power Systems, Inc. (U.S.)
- STMicroelectronics N.V. (Switzerland/France)
- Intellinet Network Solutions (U.S.)
- Veracity UK Ltd (UK)
- Molex, LLC (U.S.)
- Microchip Technology Incorporated (U.S.)
- NETGEAR, Inc. (U.S.)
- Analog Devices, Inc. (U.S.)
- Semiconductor Components Industries, LLC (U.S.)
- EtherWAN Systems, Inc. (U.S.)
- TP-Link Corporation Limited (China)
- Black Box Corporation (U.S.)
- Edimax Technology Co., Ltd. (Taiwan)
- Siemens AG (Germany)
- Hewlett Packard Enterprise Development LP (U.S.)
- R&M (Reichle & De-Massari AG) (Switzerland)
- Eaton Corporation plc (Tripp Lite) (Ireland/U.S.)
- Advantech Co., Ltd. (Taiwan)
- Broadcom Inc. (U.S.)
- TRENDnet, Inc. (U.S.)
- CommScope Holding Company, Inc. (U.S.)
- ECI Networks Ltd. (UK)
- Allied Telesis, Inc. (Japan)
Latest Developments in the Europe Power Over Ethernet (POE) Market
- In January 2026, HPE expanded its Networking and Compute portfolios with new solutions aimed at helping retail customers ensure business continuity and enhanced cybersecurity. The enhancements were positioned to provide resilient edge-to-cloud infrastructure, improved threat protection, and simplified operations for distributed retail environments facing increased digital demand.
- In January 2026, Black Box appointed Sameer Batra as Chief Business Officer (CBO) for its Global Systems Integration (GSI) business, reflecting the company’s strategic focus on expanding its presence in international markets such as India, ANZ (Australia/New Zealand), Asia Pacific, the Middle East, and Africa. Sameer Batra brings over 30 years of experience in global IT services and will lead initiatives to strengthen customer relationships, deepen partner engagement, and drive revenue growth by helping enterprises modernize and scale their digital infrastructure, including network, cloud, and data center solutions.
- In January 2026, Eaton entered a strategic collaboration with U.S. based modular data center developer Flexnode to deliver scalable modular rack and power infrastructure. Under this partnership, Eaton will supply critical power backup racks and cable management technologies for Flexnode’s NX Compute Modules, reducing deployment time by ~35% and supporting AI, HPC, and quantum workloads that require high rack density and robust infrastructure.
- In February 2026, Advantech selected AI EdgeLabs as its primary runtime security and governance platform for edge and industrial systems, strengthening device-level protection, secure execution, and lifecycle governance for deployed edge applications across industrial automation and critical infrastructure environments.
- In February 2026, Siemens opened a new Saudi Arabia office in Riyadh to strengthen its local presence and support digitalisation, automation, and energy transition initiatives within the Kingdom’s industrial, infrastructure, and government sectors.
SKU-
Get online access to the report on the World's First Market Intelligence Cloud

- Interactive Data Analysis Dashboard
- Company Analysis Dashboard for high growth potential opportunities
- Research Analyst Access for customization & queries
- Competitor Analysis with Interactive dashboard
- Latest News, Updates & Trend analysis
- Harness the Power of Benchmark Analysis for Comprehensive Competitor Tracking
Table of Content
1 INTRODUCTION
1.1 OBJECTIVES OF THE STUDY
1.2 MARKET DEFINITION
1.3 OVERVIEW OF EUROPE POWER OVER ETHERNET (POE) MARKET
1.4 CURRENCY AND PRICING
1.5 LIMITATIONS
1.6 MARKETS COVERED
2 MARKET SEGMENTATION
2.1 MARKETS COVERED
2.2 GEOGRAPHICAL SCOPE
2.3 YEARS CONSIDERED FOR THE STUDY
2.4 DBMR TRIPOD DATA VALIDATION MODEL
2.5 PRIMARY INTERVIEWS WITH KEY OPINION LEADERS
2.6 DBMR MARKET POSITION GRID
2.7 VENDOR SHARE ANALYSIS
2.8 MULTIVARIATE MODELING
2.9 TYPE TIMELINE CURVE
2.1 MARKET END-USER COVERAGE GRID
2.11 SECONDARY SOURCES
2.12 ASSUMPTIONS
3 EXECUTIVE SUMMARY
4 PREMIUM INSIGHTS
4.1 PORTERS FIVE FORCES ANALYSIS
4.2 INDUSTRY ANALYSIS & FUTURISTIC SCENARIO
4.2.1 TECHNOLOGICAL ADVANCEMENTS AND STANDARD EVOLUTION
4.2.2 ADOPTION ACROSS INDUSTRY VERTICALS
4.2.3 INFRASTRUCTURE CHALLENGES AND INTEGRATION BARRIERS
4.2.4 REGULATORY LANDSCAPE AND SECURITY CONSIDERATIONS
4.2.5 FUTURE OUTLOOK AND STRATEGIC OPPORTUNITIES
4.3 COMPANY COMPETITIVE ANALYSIS
4.3.1 CISCO SYSTEMS, INC.
4.3.2 NETGEAR, INC.
4.3.3 HEWLETT PACKARD ENTERPRISE / HPE ARUBA NETWORKING
4.3.4 TEXAS INSTRUMENTS INCORPORATED
4.3.5 ANALOG DEVICES, INC.
4.3.6 BROADCOM INC.
4.3.7 MICROCHIP TECHNOLOGY INC.
5 TARIFFS & IMPACT ON THE EUROPE POWER OVER ETHERNET (POE) MARKET
5.1 OVERVIEW
5.2 TARIFF STRUCTURES
5.2.1 EUROPEAN UNION
5.2.1.1 TYPICAL CN / TARIC CLASSIFICATIONS FOR POE‑RELATED PRODUCTS
5.2.1.1.1 NETWORK SWITCHES & ACTIVE POE DEVICES
5.2.1.1.2 INJECTORS, POE MIDSPANS & POWER SUPPLIES
5.2.1.1.3 CABLES & CONNECTORS RELATED TO POE
5.2.1.1.4 HOW DUTIES ARE APPLIED:
5.2.1.2 VALUE ADDED TAX (VAT) & OTHER CHARGES
5.2.2 UNITED STATES
5.2.2.1 UNITED STATES TARIFF SYSTEM
5.2.2.2 TYPICAL HTSUS CODES FOR POE‑RELATED PRODUCTS & DUTY RATES
5.2.2.2.1 POE NETWORK SWITCHES / DATA NETWORKING APPARATUS
5.2.2.2.2 POE INJECTORS / POWER SUPPLIES
5.2.2.2.3 ETHERNET CABLES & CONNECTORS
5.2.2.3 SPECIAL U.S. TRADE MEASURES THAT AFFECT TARIFFS
5.2.2.4 ADDITIONAL CHARGES BEYOND CUSTOMS DUTY
5.2.3 ASIA-PACIFIC
5.2.3.1 PRODUCT CLASSIFICATION FOR POE EQUIPMENT
5.2.3.2 CHINA (IMPORTER) – EXAMPLE TARIFF PROFILE
5.2.3.3 JAPAN – LOW TARIFFS ON ELECTRONICS
5.2.3.4 PHILIPPINES – ASEAN REGION
5.2.3.5 AUSTRALIA & NEW ZEALAND (RCEP MEMBERS)
5.2.3.6 OTHER ASIA‑PACIFIC TARIFF HIGHLIGHTS
5.3 INCREASED COSTS OF PRODUCTION
5.3.1 RAW MATERIALS AND COMPONENTS
5.3.2 FINISHED PRODUCTS
5.4 DISRUPTION OF EUROPE SUPPLY CHAINS
5.4.1 MANUFACTURING SHIFTS
5.4.2 TRADE CONFLICTS
5.5 IMPACT ON R&D AND INNOVATION
5.6 PRICE VOLATILITY
5.6.1 FLUCTUATING PRICES
5.6.2 END-CONSUMER COSTS
5.7 GEOPOLITICAL TENSIONS AND MARKET SHIFTS
5.7.1 SHIFTS IN PRODUCTION LOCATIONS
5.7.2 REGIONAL SUPPLY CHAINS
5.8 IMPACT ON SMALLER AND DEVELOPING MARKETS
5.8.1 DISADVANTAGES FOR SMALLER PLAYERS
6 REGULATORY STANDARDS
6.1 NATIONAL REGULATORY FRAMEWORK
6.1.1 REGULATORY AUTHORITIES & MANDATES
6.1.2 PRODUCT CLASSIFICATION & REGULATED CATEGORIES
6.2 PRODUCT REGISTRATION, CERTIFICATION & MARKET ACCESS
6.2.1 REGISTRATION & CLAIMS GOVERNANCE
6.2.2 CONFORMITY ASSESSMENT & TESTING
6.3 LABELING, PACKAGING & CLAIM REQUIREMENTS
6.3.1 LABELING & INFORMATION REQUIREMENTS
6.4 SAFETY, TESTING & QUALITY STANDARDS
6.4.1 TECHNICAL STANDARDS & RISK MANAGEMENT
6.5 POST-MARKET SURVEILLANCE & ENFORCEMENT
6.6 REGULATORY INTERACTIONS & BORDER CONTROLS
6.6.1 IMPORT OVERSIGHT & CERTIFICATION VERIFICATION
6.7 REGULATORY GAPS & MARKET IMPLICATIONS
7 MARKET OVERVIEW
7.1 DRIVERS
7.1.1 ACCELERATING DEPLOYMENT OF IP CAMERAS, WIRELESS ACCESS POINTS, VOIP PHONES, ACCESS CONTROL, AND IOT DEVICES
7.1.2 GROWING ADOPTION OF SMART BUILDINGS, SMART CITIES, AND INTELLIGENT INFRASTRUCTURE, WHERE POE SIMPLIFIES CABLING, REDUCES INSTALLATION TIME, AND LOWERS TOTAL COST OF OWNERSHIP.
7.1.3 EXPANSION OF ENTERPRISE IT NETWORKS AND EDGE DEVICES, DRIVING DEMAND FOR SCALABLE, CENTRALLY MANAGED POWER DELIVERY THROUGH ETHERNET SWITCHES AND INJECTORS.
7.1.4 RISING FOCUS ON ENERGY EFFICIENCY, CENTRALIZED POWER MANAGEMENT, AND NETWORK-BASED MONITORING, STRENGTHENING THE VALUE PROPOSITION OF POE-ENABLED ARCHITECTURES.
7.2 RESTRAINTS
7.2.1 HIGHER UPFRONT COSTS OF POE-CAPABLE SWITCHES, MIDSPANS, AND COMPLIANT CABLING COMPARED WITH CONVENTIONAL NETWORKING EQUIPMENT IN COST-SENSITIVE DEPLOYMENTS.
7.2.2 DISTANCE AND POWER LIMITATIONS INHERENT TO ETHERNET STANDARDS, WHICH CAN RESTRICT USE IN VERY LARGE OR HIGH-POWER INSTALLATIONS WITHOUT ADDITIONAL INFRASTRUCTURE.
7.3 OPPORTUNITIES
7.3.1 GROWTH OF INDUSTRIAL IOT, INDUSTRY 4.0, AND EDGE COMPUTING DEPLOYMENTS, WHERE POE CAN SIMPLIFY POWERING DISTRIBUTED SENSORS, CAMERAS, AND CONTROLLERS.
7.3.2 INCREASING ADOPTION IN HEALTHCARE, RETAIL, TRANSPORTATION, AND EDUCATION FOR CONNECTED DEVICES SUCH AS DISPLAYS, KIOSKS, SECURITY SYSTEMS, AND ACCESS CONTROL.
7.3.3 DEVELOPMENT OF HIGHER-POWER AND MORE EFFICIENT POE STANDARDS AND CHIPSETS, BROADENING THE RANGE OF SUPPORTED DEVICES AND USE CASES.
7.4 CHALLENGES
7.4.1 MANAGING HEAT DISSIPATION, POWER EFFICIENCY, AND RELIABILITY AS HIGHER-POWER POE APPLICATIONS BECOME MORE COMMON IN DENSE NETWORK ENVIRONMENTS.
7.4.2 MAINTAINING CYBERSECURITY AND NETWORK RESILIENCE, AS MORE CRITICAL DEVICES BECOME DEPENDENT ON IP NETWORKS FOR BOTH POWER AND DATA.
8 EUROPE POWER OVER ETHERNET (POE) MARKET, BY TYPE
8.1 OVERVIEW
8.2 EUROPE POWER OVER ETHERNET (POE) MARKET, 2018-2033, (USD THOUSAND)
8.3 EUROPE POWER OVER ETHERNET (POE) MARKET, BY REGION, 2018-2033, (USD THOUSAND)
8.3.1 ASIA-PACIFIC
8.3.2 NORTH AMERICA
8.3.3 EUROPE
8.3.4 SOUTH AMERICA
8.3.5 MIDDLE EAST AND AFRICA
8.4 EUROPE POWER OVER ETHERNET (POE) MARKET, BY TYPE, 2018-2033 (USD THOUSAND)
8.4.1 POWERED DEVICES (PD)
8.4.2 POWER SOURCING EQUIPMENT (PSE)
8.4.3 NETWORK CABLE
8.5 POWERED DEVICES (PD) IN EUROPE POWER OVER ETHERNET (POE) MARKET, BY VOLTAGE RANGE, 2018-2033 (USD THOUSAND)
8.5.1 40 V TO 50 V
8.5.2 ABOVE 50 V
8.5.3 UP TO 30 V
8.5.4 30 V TO 40 V
8.6 POWERED DEVICES (PD) IN EUROPE POWER OVER ETHERNET (POE) MARKET, BY REGION, 2018-2033 (USD THOUSAND)
8.6.1 ASIA-PACIFIC
8.6.2 NORTH AMERICA
8.6.3 EUROPE
8.6.4 SOUTH AMERICA
8.6.5 MIDDLE EAST AND AFRICA
8.7 POWER SOURCING EQUIPMENT (PSE) IN EUROPE POWER OVER ETHERNET (POE) MARKET, BY VOLTAGE RANGE, 2018-2033 (USD THOUSAND)
8.7.1 ABOVE 50 V
8.7.2 40 V TO 50 V
8.7.3 30 V TO 40 V
8.7.4 UP TO 30 V
8.8 POWER SOURCING EQUIPMENT (PSE) IN EUROPE POWER OVER ETHERNET (POE) MARKET, BY REGION, 2018-2033 (USD THOUSAND)
8.8.1 ASIA-PACIFIC
8.8.2 NORTH AMERICA
8.8.3 EUROPE
8.8.4 SOUTH AMERICA
8.8.5 MIDDLE EAST AND AFRICA
8.9 NETWORK CABLE IN EUROPE POWER OVER ETHERNET (POE) MARKET, BY VOLTAGE RANGE, 2018-2033 (USD THOUSAND)
8.9.1 40 V TO 50 V
8.9.2 ABOVE 50 V
8.9.3 UP TO 30 V
8.9.4 30 V TO 40 V
8.1 NETWORK CABLE IN EUROPE POWER OVER ETHERNET (POE) MARKET, BY REGION, 2018-2033 (USD THOUSAND)
8.10.1 ASIA-PACIFIC
8.10.2 NORTH AMERICA
8.10.3 EUROPE
8.10.4 SOUTH AMERICA
8.10.5 MIDDLE EAST AND AFRICA
9 EUROPE POWER OVER ETHERNET (POE) MARKET, BY CLASS TYPE
9.1 OVERVIEW
9.2 EUROPE POWER OVER ETHERNET (POE) MARKET, BY CLASS TYPE, 2018-2033 (USD THOUSAND)
9.2.1 CLASS 4
9.2.2 CLASS 3
9.2.3 CLASS 0
9.2.4 CLASS 2
9.2.5 CLASS 1
9.2.6 OTHERS
9.3 CLASS 4 IN EUROPE POWER OVER ETHERNET (POE) MARKET, BY REGION, 2018-2033 (USD THOUSAND)
9.3.1 ASIA-PACIFIC
9.3.2 NORTH AMERICA
9.3.3 EUROPE
9.3.4 SOUTH AMERICA
9.3.5 MIDDLE EAST AND AFRICA
9.4 CLASS 3 IN EUROPE POWER OVER ETHERNET (POE) MARKET, BY REGION, 2018-2033 (USD THOUSAND)
9.4.1 ASIA-PACIFIC
9.4.2 NORTH AMERICA
9.4.3 EUROPE
9.4.4 SOUTH AMERICA
9.4.5 MIDDLE EAST AND AFRICA
9.5 CLASS 0 IN EUROPE POWER OVER ETHERNET (POE) MARKET, BY REGION, 2018-2033 (USD THOUSAND)
9.5.1 ASIA-PACIFIC
9.5.2 NORTH AMERICA
9.5.3 EUROPE
9.5.4 SOUTH AMERICA
9.5.5 MIDDLE EAST AND AFRICA
9.6 CLASS 2 IN EUROPE POWER OVER ETHERNET (POE) MARKET, BY REGION, 2018-2033 (USD THOUSAND)
9.6.1 ASIA-PACIFIC
9.6.2 NORTH AMERICA
9.6.3 EUROPE
9.6.4 SOUTH AMERICA
9.6.5 MIDDLE EAST AND AFRICA
9.7 CLASS 1 IN EUROPE POWER OVER ETHERNET (POE) MARKET, BY REGION, 2018-2033 (USD THOUSAND)
9.7.1 ASIA-PACIFIC
9.7.2 NORTH AMERICA
9.7.3 EUROPE
9.7.4 SOUTH AMERICA
9.7.5 MIDDLE EAST AND AFRICA
9.8 OTHERS IN EUROPE POWER OVER ETHERNET (POE) MARKET, BY REGION, 2018-2033 (USD THOUSAND)
9.8.1 ASIA-PACIFIC
9.8.2 NORTH AMERICA
9.8.3 EUROPE
9.8.4 SOUTH AMERICA
9.8.5 MIDDLE EAST AND AFRICA
10 EUROPE POWER OVER ETHERNET (POE) MARKET, BY MODES
10.1 OVERVIEW
10.2 EUROPE POWER OVER ETHERNET (POE) MARKET, BY MODES, 2018-2033 (USD THOUSAND)
10.2.1 MODE A
10.2.2 MODE B
10.3 MODE A IN EUROPE POWER OVER ETHERNET (POE) MARKET, BY REGION, 2018-2033 (USD THOUSAND)
10.3.1 ASIA-PACIFIC
10.3.2 NORTH AMERICA
10.3.3 EUROPE
10.3.4 SOUTH AMERICA
10.3.5 MIDDLE EAST AND AFRICA
10.4 MODE B IN EUROPE POWER OVER ETHERNET (POE) MARKET, BY REGION, 2018-2033 (USD THOUSAND)
10.4.1 ASIA-PACIFIC
10.4.2 NORTH AMERICA
10.4.3 EUROPE
10.4.4 SOUTH AMERICA
10.4.5 MIDDLE EAST AND AFRICA
11 EUROPE POWER OVER ETHERNET (POE) MARKET, BY POWER RANGE
11.1 OVERVIEW
11.2 EUROPE POWER OVER ETHERNET (POE) MARKET, BY POWER RANGE, 2018-2033 (USD THOUSAND)
11.2.1 15 W TO 30 W
11.2.2 UPTO 15 W
11.2.3 30 W TO 60 W
11.2.4 60 W TO 90 W
11.2.5 ABOVE 90 W
11.3 15 W TO 30 W IN EUROPE POWER OVER ETHERNET (POE) MARKET, BY REGION, 2018-2033 (USD THOUSAND)
11.3.1 ASIA-PACIFIC
11.3.2 NORTH AMERICA
11.3.3 EUROPE
11.3.4 SOUTH AMERICA
11.3.5 MIDDLE EAST AND AFRICA
11.4 UPTO 15 W IN EUROPE POWER OVER ETHERNET (POE) MARKET, BY REGION, 2018-2033 (USD THOUSAND)
11.4.1 ASIA-PACIFIC
11.4.2 NORTH AMERICA
11.4.3 EUROPE
11.4.4 SOUTH AMERICA
11.4.5 MIDDLE EAST AND AFRICA
11.5 30 W TO 60 W IN EUROPE POWER OVER ETHERNET (POE) MARKET, BY REGION, 2018-2033 (USD THOUSAND)
11.5.1 ASIA-PACIFIC
11.5.2 NORTH AMERICA
11.5.3 EUROPE
11.5.4 SOUTH AMERICA
11.5.5 MIDDLE EAST AND AFRICA
11.6 60 W TO 90 W IN EUROPE POWER OVER ETHERNET (POE) MARKET, BY REGION, 2018-2033 (USD THOUSAND)
11.6.1 ASIA-PACIFIC
11.6.2 NORTH AMERICA
11.6.3 EUROPE
11.6.4 SOUTH AMERICA
11.6.5 MIDDLE EAST AND AFRICA
11.7 ABOVE 90 W IN EUROPE POWER OVER ETHERNET (POE) MARKET, BY REGION, 2018-2033 (USD THOUSAND)
11.7.1 ASIA-PACIFIC
11.7.2 NORTH AMERICA
11.7.3 EUROPE
11.7.4 SOUTH AMERICA
11.7.5 MIDDLE EAST AND AFRICA
12 EUROPE POWER OVER ETHERNET (POE) MARKET, BY VOLTAGE RANGE
12.1 OVERVIEW
12.2 EUROPE POWER OVER ETHERNET (POE) MARKET, BY VOLTAGE RANGE, 2018-2033 (USD THOUSAND)
12.2.1 40 V TO 50 V
12.2.2 ABOVE 50 V
12.2.3 UP TO 30 V
12.2.4 30 V TO 40 V
12.3 40 V TO 50 V IN EUROPE POWER OVER ETHERNET (POE) MARKET, BY REGION, 2018-2033 (USD THOUSAND)
12.3.1 ASIA-PACIFIC
12.3.2 NORTH AMERICA
12.3.3 EUROPE
12.3.4 SOUTH AMERICA
12.3.5 MIDDLE EAST AND AFRICA
12.4 ABOVE 50 V IN EUROPE POWER OVER ETHERNET (POE) MARKET, BY REGION, 2018-2033 (USD THOUSAND)
12.4.1 ASIA-PACIFIC
12.4.2 NORTH AMERICA
12.4.3 EUROPE
12.4.4 SOUTH AMERICA
12.4.5 MIDDLE EAST AND AFRICA
12.5 UP TO 30 V IN EUROPE POWER OVER ETHERNET (POE) MARKET, BY REGION, 2018-2033 (USD THOUSAND)
12.5.1 ASIA-PACIFIC
12.5.2 NORTH AMERICA
12.5.3 EUROPE
12.5.4 SOUTH AMERICA
12.5.5 MIDDLE EAST AND AFRICA
12.6 30 V TO 40 V IN EUROPE POWER OVER ETHERNET (POE) MARKET, BY REGION, 2018-2033 (USD THOUSAND)
12.6.1 ASIA-PACIFIC
12.6.2 NORTH AMERICA
12.6.3 EUROPE
12.6.4 SOUTH AMERICA
12.6.5 MIDDLE EAST AND AFRICA
13 EUROPE POWER OVER ETHERNET (POE) MARKET, BY DEVICE TYPE
13.1 OVERVIEW
13.2 EUROPE POWER OVER ETHERNET (POE) MARKET, BY DEVICE TYPE, 2018-2033 (USD THOUSAND)
13.2.1 POE SWITCH (ENDSPAN)
13.2.2 IP CAMERAS
13.2.3 WIRELESS ACCESS POINTS
13.2.4 VOICE OVER INTERNET PROTOCOL (VOIP) & INTERNET PROTOCOL (IP) PHONES
13.2.5 POE INJECTOR (MIDSPAN)
13.2.6 PTZ CAMERAS
13.2.7 POE LIGHTING
13.2.8 SECURITY CARD READERS
13.2.9 IP INTERCOMS
13.2.10 IP CLOCKS
13.2.11 ATMS
13.2.12 OTHERS
13.3 POE SWITCH (ENDSPAN) IN EUROPE POWER OVER ETHERNET (POE) MARKET, BY REGION, 2018-2033 (USD THOUSAND)
13.3.1 ASIA-PACIFIC
13.3.2 NORTH AMERICA
13.3.3 EUROPE
13.3.4 SOUTH AMERICA
13.3.5 MIDDLE EAST AND AFRICA
13.4 IP CAMERAS IN EUROPE POWER OVER ETHERNET (POE) MARKET, BY REGION, 2018-2033 (USD THOUSAND)
13.4.1 ASIA-PACIFIC
13.4.2 NORTH AMERICA
13.4.3 EUROPE
13.4.4 SOUTH AMERICA
13.4.5 MIDDLE EAST AND AFRICA
13.5 WIRELESS ACCESS POINTS IN EUROPE POWER OVER ETHERNET (POE) MARKET, BY REGION, 2018-2033 (USD THOUSAND)
13.5.1 ASIA-PACIFIC
13.5.2 NORTH AMERICA
13.5.3 EUROPE
13.5.4 SOUTH AMERICA
13.5.5 MIDDLE EAST AND AFRICA
13.6 VOICE OVER INTERNET PROTOCOL (VOIP) & INTERNET PROTOCOL (IP) PHONES IN EUROPE POWER OVER ETHERNET (POE) MARKET, BY REGION, 2018-2033 (USD THOUSAND)
13.6.1 ASIA-PACIFIC
13.6.2 NORTH AMERICA
13.6.3 EUROPE
13.6.4 SOUTH AMERICA
13.6.5 MIDDLE EAST AND AFRICA
13.7 POE INJECTOR (MIDSPAN) IN EUROPE POWER OVER ETHERNET (POE) MARKET, BY REGION, 2018-2033 (USD THOUSAND)
13.7.1 ASIA-PACIFIC
13.7.2 NORTH AMERICA
13.7.3 EUROPE
13.7.4 SOUTH AMERICA
13.7.5 MIDDLE EAST AND AFRICA
13.8 PTZ CAMERAS IN EUROPE POWER OVER ETHERNET (POE) MARKET, BY REGION, 2018-2033 (USD THOUSAND)
13.8.1 ASIA-PACIFIC
13.8.2 NORTH AMERICA
13.8.3 EUROPE
13.8.4 SOUTH AMERICA
13.8.5 MIDDLE EAST AND AFRICA
13.9 POE LIGHTING IN EUROPE POWER OVER ETHERNET (POE) MARKET, BY REGION, 2018-2033 (USD THOUSAND)
13.9.1 ASIA-PACIFIC
13.9.2 NORTH AMERICA
13.9.3 EUROPE
13.9.4 SOUTH AMERICA
13.9.5 MIDDLE EAST AND AFRICA
13.1 SECURITY CARD READERS IN EUROPE POWER OVER ETHERNET (POE) MARKET, BY REGION, 2018-2033 (USD THOUSAND)
13.10.1 ASIA-PACIFIC
13.10.2 NORTH AMERICA
13.10.3 EUROPE
13.10.4 SOUTH AMERICA
13.10.5 MIDDLE EAST AND AFRICA
13.11 IP INTERCOMS IN EUROPE POWER OVER ETHERNET (POE) MARKET, BY REGION, 2018-2033 (USD THOUSAND)
13.11.1 ASIA-PACIFIC
13.11.2 NORTH AMERICA
13.11.3 EUROPE
13.11.4 SOUTH AMERICA
13.11.5 MIDDLE EAST AND AFRICA
13.12 IP CLOCKS IN EUROPE POWER OVER ETHERNET (POE) MARKET, BY REGION, 2018-2033 (USD THOUSAND)
13.12.1 ASIA-PACIFIC
13.12.2 NORTH AMERICA
13.12.3 EUROPE
13.12.4 SOUTH AMERICA
13.12.5 MIDDLE EAST AND AFRICA
13.13 ATMS IN EUROPE POWER OVER ETHERNET (POE) MARKET, BY REGION, 2018-2033 (USD THOUSAND)
13.13.1 ASIA-PACIFIC
13.13.2 NORTH AMERICA
13.13.3 EUROPE
13.13.4 SOUTH AMERICA
13.13.5 MIDDLE EAST AND AFRICA
13.14 OTHERS IN EUROPE POWER OVER ETHERNET (POE) MARKET, BY REGION, 2018-2033 (USD THOUSAND)
13.14.1 ASIA-PACIFIC
13.14.2 NORTH AMERICA
13.14.3 EUROPE
13.14.4 SOUTH AMERICA
13.14.5 MIDDLE EAST AND AFRICA
14 EUROPE POWER OVER ETHERNET (POE) MARKET, BY APPLICATION
14.1 OVERVIEW
14.2 EUROPE POWER OVER ETHERNET (POE) MARKET, BY APPLICATION, 2018-2033 (USD THOUSAND)
14.2.1 ACCESS CONTROL & SECURITY
14.2.2 IOT CONNECTIVITY
14.2.3 LIGHTING CONTROL
14.2.4 INFOTAINMENT
14.2.5 OTHERS
14.3 ACCESS CONTROL & SECURITY IN EUROPE POWER OVER ETHERNET (POE) MARKET, BY REGION, 2018-2033 (USD THOUSAND)
14.3.1 ASIA-PACIFIC
14.3.2 NORTH AMERICA
14.3.3 EUROPE
14.3.4 SOUTH AMERICA
14.3.5 MIDDLE EAST AND AFRICA
14.4 IOT CONNECTIVITY IN EUROPE POWER OVER ETHERNET (POE) MARKET, BY REGION, 2018-2033 (USD THOUSAND)
14.4.1 ASIA-PACIFIC
14.4.2 NORTH AMERICA
14.4.3 EUROPE
14.4.4 SOUTH AMERICA
14.4.5 MIDDLE EAST AND AFRICA
14.5 LIGHTING CONTROL IN EUROPE POWER OVER ETHERNET (POE) MARKET, BY REGION, 2018-2033 (USD THOUSAND)
14.5.1 ASIA-PACIFIC
14.5.2 NORTH AMERICA
14.5.3 EUROPE
14.5.4 SOUTH AMERICA
14.5.5 MIDDLE EAST AND AFRICA
14.6 INFOTAINMENT IN EUROPE POWER OVER ETHERNET (POE) MARKET, BY REGION, 2018-2033 (USD THOUSAND)
14.6.1 ASIA-PACIFIC
14.6.2 NORTH AMERICA
14.6.3 EUROPE
14.6.4 SOUTH AMERICA
14.6.5 MIDDLE EAST AND AFRICA
14.7 OTHERS IN EUROPE POWER OVER ETHERNET (POE) MARKET, BY REGION, 2018-2033 (USD THOUSAND)
14.7.1 ASIA-PACIFIC
14.7.2 NORTH AMERICA
14.7.3 EUROPE
14.7.4 SOUTH AMERICA
14.7.5 MIDDLE EAST AND AFRICA
15 EUROPE POWER OVER ETHERNET (POE) MARKET, BY END USER
15.1 OVERVIEW
15.2 EUROPE POWER OVER ETHERNET (POE) MARKET, BY END USER, 2018-2033 (USD THOUSAND)
15.2.1 COMMERCIAL
15.2.2 INDUSTRIAL
15.2.3 RESIDENTIAL
15.3 COMMERCIAL IN EUROPE POWER OVER ETHERNET (POE) MARKET, BY INDUSTRY VERTICAL, 2018-2033 (USD THOUSAND)
15.3.1 OFFICES
15.3.2 DATA CENTERS
15.3.3 RETAIL
15.3.4 HEALTHCARE
15.3.5 CAMPUSES
15.3.6 HOSPITALITY
15.3.7 OTHERS
15.4 COMMERCIAL IN EUROPE POWER OVER ETHERNET (POE) MARKET, BY TYPE, 2018-2033 (USD THOUSAND)
15.4.1 POWERED DEVICES (PD)
15.4.2 POWER SOURCING EQUIPMENT (PSE)
15.4.3 NETWORK CABLE
15.5 COMMERCIAL IN EUROPE POWER OVER ETHERNET (POE) MARKET, BY REGION, 2018-2033 (USD THOUSAND)
15.5.1 ASIA-PACIFIC
15.5.2 NORTH AMERICA
15.5.3 EUROPE
15.5.4 SOUTH AMERICA
15.5.5 MIDDLE EAST AND AFRICA
15.6 INDUSTRIAL IN EUROPE POWER OVER ETHERNET (POE) MARKET, BY INDUSTRY VERTICAL, 2018-2033 (USD THOUSAND)
15.6.1 TELECOMMUNICATION
15.6.2 TRANSPORTATION
15.6.3 OIL & GAS
15.6.4 AUTOMOTIVE
15.6.5 CHEMICALS
15.6.6 OTHERS
15.7 INDUSTRIAL IN EUROPE POWER OVER ETHERNET (POE) MARKET, BY TYPE, 2018-2033 (USD THOUSAND)
15.7.1 POWERED DEVICES (PD)
15.7.2 POWER SOURCING EQUIPMENT (PSE)
15.7.3 NETWORK CABLE
15.8 INDUSTRIAL IN EUROPE POWER OVER ETHERNET (POE) MARKET, BY REGION, 2018-2033 (USD THOUSAND)
15.8.1 ASIA-PACIFIC
15.8.2 NORTH AMERICA
15.8.3 EUROPE
15.8.4 SOUTH AMERICA
15.8.5 MIDDLE EAST AND AFRICA
15.9 RESIDENTIAL IN EUROPE POWER OVER ETHERNET (POE) MARKET, BY HOUSING TYPE, 2018-2033 (USD THOUSAND)
15.9.1 SINGLE FAMILY HOME
15.9.2 APARTMENT
15.9.3 OTHERS
15.1 RESIDENTIAL IN EUROPE POWER OVER ETHERNET (POE) MARKET, BY TYPE, 2018-2033 (USD THOUSAND)
15.10.1 POWERED DEVICES (PD)
15.10.2 POWER SOURCING EQUIPMENT (PSE)
15.10.3 NETWORK CABLE
15.11 RESIDENTIAL IN EUROPE POWER OVER ETHERNET (POE) MARKET, BY REGION, 2018-2033 (USD THOUSAND)
15.11.1 ASIA-PACIFIC
15.11.2 NORTH AMERICA
15.11.3 EUROPE
15.11.4 SOUTH AMERICA
15.11.5 MIDDLE EAST AND AFRICA
16 EUROPE POWER OVER ETHERNET (POE) MARKET, BY REGION
16.1 EUROPE
16.1.1 GERMANY
16.1.2 U.K.
16.1.3 FRANCE
16.1.4 RUSSIA
16.1.5 ITALY
16.1.6 SPAIN
16.1.7 NETHERLANDS
16.1.8 SWEDEN
16.1.9 SWITZERLAND
16.1.10 BELGIUM
16.1.11 NORWAY
16.1.12 POLAND
16.1.13 DENMARK
16.1.14 FINLAND
16.1.15 TURKEY
16.1.16 REST OF EUROPE
17 EUROPE POWER OVER ETHERNET (POE) MARKET: COMPANY LANDSCAPE
17.1 COMPANY SHARE ANALYSIS: GLOBAL
18 SWOT ANALYSIS
19 COMPANY PROFILES
19.1 CISCO SYSTEMS, INC.
19.1.1 COMPANY SNAPSHOT
19.1.2 REVENUE ANALYSIS
19.1.3 COMPANY SHARE ANALYSIS
19.1.4 PRODUCT PORTFOLIO
19.1.5 RECENT DEVELOPMENT
19.2 BROADCOM.
19.2.1 COMPANY SNAPSHOT
19.2.2 REVENUE ANALYSIS
19.2.3 COMPANY SHARE ANALYSIS
19.2.4 PRODUCT PORTFOLIO
19.2.5 RECENT DEVELOPMENT
19.3 TEXAS INSTRUMENTS INCORPORATED
19.3.1 COMPANY SNAPSHOT
19.3.2 REVENUE ANALYSIS
19.3.3 COMPANY SHARE ANALYSIS
19.3.4 PRODUCT PORTFOLIO
19.3.5 RECENT DEVELOPMENT
19.4 ANALOG DEVICES, INC.
19.4.1 COMPANY SNAPSHOT
19.4.2 REVENUE ANALYSIS
19.4.3 COMPANY SHARE ANALYSIS
19.4.4 PRODUCT PORTFOLIO
19.4.5 RECENT DEVELOPMENT
19.5 MICROCHIP TECHNOLOGY INC.
19.5.1 COMPANY SNAPSHOT
19.5.2 REVENUE ANALYSIS
19.5.3 COMPANY SHARE ANALYSIS
19.5.4 PRODUCT PORTFOLIO
19.5.5 RECENT DEVELOPMENT
19.6 ADVANTECH CO., LTD.
19.6.1 COMPANY SNAPSHOT
19.6.2 REVENUE ANALYSIS
19.6.3 PRODUCT PORTFOLIO
19.6.4 RECENT DEVELOPMENT
19.7 ALLIED TELESIS, INC
19.7.1 COMPANY SNAPSHOT
19.7.2 REVENUE ANALYSIS
19.7.3 PRODUCT PORTFOLIO
19.7.4 RECENT DEVELOPMENT
19.8 BLACK BOX
19.8.1 COMPANY SNAPSHOT
19.8.2 PRODUCT PORTFOLIO
19.8.3 RECENT DEVELOPMENT/NEWS
19.9 COMMSCOPE TECHNOLOGIES LLC
19.9.1 COMPANY SNAPSHOT
19.9.2 REVENUE ANALYSIS
19.1 EATON
19.10.1 COMPANY SNAPSHOT
19.10.2 REVENUE ANALYSIS
19.10.3 PRODUCT PORTFOLIO
19.10.4 RECENT DEVELOPMENT
19.11 E.C.I. NETWORKS INC.
19.11.1 COMPANY SNAPSHOT
19.11.2 PRODUCT PORTFOLIO
19.11.3 RECENT DEVELOPMENT
19.12 EDIMAX TECHNOLOGY CO., LTD.
19.12.1 COMPANY SNAPSHOT
19.12.2 REVENUE ANALYSIS
19.12.3 PRODUCT PORTFOLIO
19.12.4 RECENT DEVELOPMENT
19.13 ETHERWAN SYSTEMS, INC.
19.13.1 COMPANY SNAPSHOT
19.13.2 PRODUCT PORTFOLIO
19.13.3 RECENT DEVELOPMENT
19.14 HEWLETT PACKARD ENTERPRISE DEVELOPMENT LP
19.14.1 COMPANY SNAPSHOT
19.14.2 REVENUE ANALYSIS
19.14.3 PRODUCT PORTFOLIO
19.14.4 RECENT DEVELOPMENT
19.15 INTELLINET NETWORK SOLUTIONS
19.15.1 COMPANY SNAPSHOT
19.15.2 PRODUCT PORTFOLIO
19.15.3 RECENT DEVELOPMENT
19.16 MOLEX, LLC
19.16.1 COMPANY SNAPSHOT
19.16.2 PRODUCT PORTFOLIO
19.16.3 RECENT DEVELOPMENT
19.17 MONOLITHIC POWER SYSTEMS, INC.
19.17.1 COMPANY SNAPSHOT
19.17.2 REVENUE ANALYSIS
19.17.3 PRODUCT PORTFOLIO
19.17.4 RECENT DEVELOPMENT
19.18 NETGEAR
19.18.1 COMPANY SNAPSHOT
19.18.2 REVENUE ANALYSIS
19.18.3 PRODUCT PORTFOLIO
19.18.4 RECENT DEVELOPMENT
19.19 R&M
19.19.1 COMPANY SNAPSHOT
19.19.2 PRODUCT PORTFOLIO
19.19.3 RECENT DEVELOPMENT
19.2 SEMICONDUCTOR COMPONENTS INDUSTRIES, LLC
19.20.1 COMPANY SNAPSHOT
19.20.2 REVENUE ANALYSIS
19.20.3 PRODUCT PORTFOLIO
19.20.4 RECENT DEVELOPMENT
19.21 SIEMENS
19.21.1 COMPANY SNAPSHOT
19.21.2 REVENUE ANALYSIS
19.21.3 PRODUCT PORTFOLIO
19.21.4 RECENT DEVELOPMENT
19.22 STMICROELECTRONICS
19.22.1 COMPANY SNAPSHOT
19.22.2 REVENUE ANALYSIS
19.22.3 PRODUCT PORTFOLIO
19.22.4 ECENT DEVELOPMENT
19.23 TP-LINK SYSTEMS INC.
19.23.1 COMPANY SNAPSHOT
19.23.2 PRODUCT PORTFOLIO
19.23.3 RECENT DEVELOPMENT
19.24 TRENDNET, INC.
19.24.1 COMPANY SNAPSHOT
19.24.2 PRODUCT PORTFOLIO
19.24.3 RECENT DEVELOPMENT
19.25 VERACITY UK LIMITED
19.25.1 COMPANY SNAPSHOT
19.25.2 PRODUCT PORTFOLIO
19.25.3 RECENT DEVELOPMENT
19.26 VERSA TECHNOLOGY, INC.
19.26.1 COMPANY SNAPSHOT
19.26.2 PRODUCT PORTFOLIO
19.26.3 RECENT DEVELOPMENT
20 QUESTIONNAIRE
21 RELATED REPORTS
List of Table
TABLE 1 EUROPE POWER OVER ETHERNET (POE) MARKET, 2018-2033, (USD THOUSAND)
TABLE 2 EUROPE POWER OVER ETHERNET (POE) MARKET, BY REGION, 2018-2033, (USD THOUSAND)
TABLE 3 EUROPE POWER OVER ETHERNET (POE) MARKET, BY TYPE, 2018-2033 (USD THOUSAND)
TABLE 4 POWERED DEVICES (PD) IN EUROPE POWER OVER ETHERNET (POE) MARKET, BY VOLTAGE RANGE, 2018-2033 (USD THOUSAND)
TABLE 5 POWERED DEVICES (PD) IN EUROPE POWER OVER ETHERNET (POE) MARKET, BY REGION, 2018-2033 (USD THOUSAND)
TABLE 6 POWER SOURCING EQUIPMENT (PSE) IN EUROPE POWER OVER ETHERNET (POE) MARKET, BY VOLTAGE RANGE, 2018-2033 (USD THOUSAND)
TABLE 7 POWER SOURCING EQUIPMENT (PSE) IN EUROPE POWER OVER ETHERNET (POE) MARKET, BY REGION, 2018-2033 (USD THOUSAND)
TABLE 8 NETWORK CABLE IN EUROPE POWER OVER ETHERNET (POE) MARKET, BY VOLTAGE RANGE, 2018-2033 (USD THOUSAND)
TABLE 9 NETWORK CABLE IN EUROPE POWER OVER ETHERNET (POE) MARKET, BY REGION, 2018-2033 (USD THOUSAND)
TABLE 10 EUROPE POWER OVER ETHERNET (POE) MARKET, BY CLASS TYPE, 2018-2033 (USD THOUSAND)
TABLE 11 CLASS 4 IN EUROPE POWER OVER ETHERNET (POE) MARKET, BY REGION, 2018-2033 (USD THOUSAND)
TABLE 12 CLASS 3 IN EUROPE POWER OVER ETHERNET (POE) MARKET, BY REGION, 2018-2033 (USD THOUSAND)
TABLE 13 CLASS 0 IN EUROPE POWER OVER ETHERNET (POE) MARKET, BY REGION, 2018-2033 (USD THOUSAND)
TABLE 14 CLASS 2 IN EUROPE POWER OVER ETHERNET (POE) MARKET, BY REGION, 2018-2033 (USD THOUSAND)
TABLE 15 CLASS 1 IN EUROPE POWER OVER ETHERNET (POE) MARKET, BY REGION, 2018-2033 (USD THOUSAND)
TABLE 16 OTHERS IN EUROPE POWER OVER ETHERNET (POE) MARKET, BY REGION, 2018-2033 (USD THOUSAND)
TABLE 17 EUROPE POWER OVER ETHERNET (POE) MARKET, BY MODES, 2018-2033 (USD THOUSAND)
TABLE 18 MODE A IN EUROPE POWER OVER ETHERNET (POE) MARKET, BY REGION, 2018-2033 (USD THOUSAND)
TABLE 19 MODE B IN EUROPE POWER OVER ETHERNET (POE) MARKET, BY REGION, 2018-2033 (USD THOUSAND)
TABLE 20 EUROPE POWER OVER ETHERNET (POE) MARKET, BY POWER RANGE, 2018-2033 (USD THOUSAND)
TABLE 21 15 W TO 30 W IN EUROPE POWER OVER ETHERNET (POE) MARKET, BY REGION, 2018-2033 (USD THOUSAND)
TABLE 22 UPTO 15 W IN EUROPE POWER OVER ETHERNET (POE) MARKET, BY REGION, 2018-2033 (USD THOUSAND)
TABLE 23 30 W TO 60 W IN EUROPE POWER OVER ETHERNET (POE) MARKET, BY REGION, 2018-2033 (USD THOUSAND)
TABLE 24 60 W TO 90 W IN EUROPE POWER OVER ETHERNET (POE) MARKET, BY REGION, 2018-2033 (USD THOUSAND)
TABLE 25 ABOVE 90 W IN EUROPE POWER OVER ETHERNET (POE) MARKET, BY REGION, 2018-2033 (USD THOUSAND)
TABLE 26 EUROPE POWER OVER ETHERNET (POE) MARKET, BY VOLTAGE RANGE, 2018-2033 (USD THOUSAND)
TABLE 27 40 V TO 50 V IN EUROPE POWER OVER ETHERNET (POE) MARKET, BY REGION, 2018-2033 (USD THOUSAND)
TABLE 28 ABOVE 50 V IN EUROPE POWER OVER ETHERNET (POE) MARKET, BY REGION, 2018-2033 (USD THOUSAND)
TABLE 29 UP TO 30 V IN EUROPE POWER OVER ETHERNET (POE) MARKET, BY REGION, 2018-2033 (USD THOUSAND)
TABLE 30 30 V TO 40 V IN EUROPE POWER OVER ETHERNET (POE) MARKET, BY REGION, 2018-2033 (USD THOUSAND)
TABLE 31 EUROPE POWER OVER ETHERNET (POE) MARKET, BY DEVICE TYPE, 2018-2033 (USD THOUSAND)
TABLE 32 POE SWITCH (ENDSPAN) IN EUROPE POWER OVER ETHERNET (POE) MARKET, BY REGION, 2018-2033 (USD THOUSAND)
TABLE 33 IP CAMERAS IN EUROPE POWER OVER ETHERNET (POE) MARKET, BY REGION, 2018-2033 (USD THOUSAND)
TABLE 34 WIRELESS ACCESS POINTS IN EUROPE POWER OVER ETHERNET (POE) MARKET, BY REGION, 2018-2033 (USD THOUSAND)
TABLE 35 VOICE OVER INTERNET PROTOCOL (VOIP) & INTERNET PROTOCOL (IP) PHONES IN EUROPE POWER OVER ETHERNET (POE) MARKET, BY REGION, 2018-2033 (USD THOUSAND)
TABLE 36 POE INJECTOR (MIDSPAN) IN EUROPE POWER OVER ETHERNET (POE) MARKET, BY REGION, 2018-2033 (USD THOUSAND)
TABLE 37 PTZ CAMERAS IN EUROPE POWER OVER ETHERNET (POE) MARKET, BY REGION, 2018-2033 (USD THOUSAND)
TABLE 38 POE LIGHTING IN EUROPE POWER OVER ETHERNET (POE) MARKET, BY REGION, 2018-2033 (USD THOUSAND)
TABLE 39 SECURITY CARD READERS IN EUROPE POWER OVER ETHERNET (POE) MARKET, BY REGION, 2018-2033 (USD THOUSAND)
TABLE 40 IP INTERCOMS IN EUROPE POWER OVER ETHERNET (POE) MARKET, BY REGION, 2018-2033 (USD THOUSAND)
TABLE 41 IP CLOCKS IN EUROPE POWER OVER ETHERNET (POE) MARKET, BY REGION, 2018-2033 (USD THOUSAND)
TABLE 42 ATMS IN EUROPE POWER OVER ETHERNET (POE) MARKET, BY REGION, 2018-2033 (USD THOUSAND)
TABLE 43 OTHERS IN EUROPE POWER OVER ETHERNET (POE) MARKET, BY REGION, 2018-2033 (USD THOUSAND)
TABLE 44 EUROPE POWER OVER ETHERNET (POE) MARKET, BY APPLICATION, 2018-2033 (USD THOUSAND)
TABLE 45 ACCESS CONTROL & SECURITY IN EUROPE POWER OVER ETHERNET (POE) MARKET, BY REGION, 2018-2033 (USD THOUSAND)
TABLE 46 IOT CONNECTIVITY IN EUROPE POWER OVER ETHERNET (POE) MARKET, BY REGION, 2018-2033 (USD THOUSAND)
TABLE 47 LIGHTING CONTROL IN EUROPE POWER OVER ETHERNET (POE) MARKET, BY REGION, 2018-2033 (USD THOUSAND)
TABLE 48 INFOTAINMENT IN EUROPE POWER OVER ETHERNET (POE) MARKET, BY REGION, 2018-2033 (USD THOUSAND)
TABLE 49 OTHERS IN EUROPE POWER OVER ETHERNET (POE) MARKET, BY REGION, 2018-2033 (USD THOUSAND)
TABLE 50 EUROPE POWER OVER ETHERNET (POE) MARKET, BY END USER, 2018-2033 (USD THOUSAND)
TABLE 51 COMMERCIAL IN EUROPE POWER OVER ETHERNET (POE) MARKET, BY INDUSTRY VERTICAL, 2018-2033 (USD THOUSAND)
TABLE 52 COMMERCIAL IN EUROPE POWER OVER ETHERNET (POE) MARKET, BY TYPE, 2018-2033 (USD THOUSAND)
TABLE 53 COMMERCIAL IN EUROPE POWER OVER ETHERNET (POE) MARKET, BY REGION, 2018-2033 (USD THOUSAND)
TABLE 54 INDUSTRIAL IN EUROPE POWER OVER ETHERNET (POE) MARKET, BY INDUSTRY VERTICAL, 2018-2033 (USD THOUSAND)
TABLE 55 INDUSTRIAL IN EUROPE POWER OVER ETHERNET (POE) MARKET, BY TYPE, 2018-2033 (USD THOUSAND)
TABLE 56 INDUSTRIAL IN EUROPE POWER OVER ETHERNET (POE) MARKET, BY REGION, 2018-2033 (USD THOUSAND)
TABLE 57 RESIDENTIAL IN EUROPE POWER OVER ETHERNET (POE) MARKET, BY HOUSING TYPE, 2018-2033 (USD THOUSAND)
TABLE 58 RESIDENTIAL IN EUROPE POWER OVER ETHERNET (POE) MARKET, BY TYPE, 2018-2033 (USD THOUSAND)
TABLE 59 RESIDENTIAL IN EUROPE POWER OVER ETHERNET (POE) MARKET, BY REGION, 2018-2033 (USD THOUSAND)
TABLE 60 EUROPE POWER OVER ETHERNET (POE) MARKET, 2018-2033 (USD THOUSAND)
TABLE 61 EUROPE POWER OVER ETHERNET (POE) MARKET, BY COUNTRY, 2018-2033 (USD THOUSAND)
TABLE 62 USD THOUSAND
TABLE 63 EUROPE POWER OVER ETHERNET (POE) MARKET, BY TYPE, 2018-2033 (USD THOUSAND)
TABLE 64 POWERED DEVICES (PD) IN EUROPE POWER OVER ETHERNET (POE) MARKET, BY VOLTAGE RANGE, 2018-2033 (USD THOUSAND)
TABLE 65 POWER SOURCING EQUIPMENT (PSE) IN EUROPE POWER OVER ETHERNET (POE) MARKET, BY VOLTAGE RANGE, 2018-2033 (USD THOUSAND)
TABLE 66 NETWORK CABLE IN EUROPE POWER OVER ETHERNET (POE) MARKET, BY VOLTAGE RANGE, 2018-2033 (USD THOUSAND)
TABLE 67 EUROPE POWER OVER ETHERNET (POE) MARKET, BY CLASS TYPE, 2018-2033 (USD THOUSAND)
TABLE 68 EUROPE POWER OVER ETHERNET (POE) MARKET, BY MODES, 2018-2033 (USD THOUSAND)
TABLE 69 EUROPE POWER OVER ETHERNET (POE) MARKET, BY POWER RANGE, 2018-2033 (USD THOUSAND)
TABLE 70 EUROPE POWER OVER ETHERNET (POE) MARKET, BY VOLTAGE RANGE, 2018-2033 (USD THOUSAND)
TABLE 71 EUROPE POWER OVER ETHERNET (POE) MARKET, BY DEVICE TYPE, 2018-2033 (USD THOUSAND)
TABLE 72 EUROPE POWER OVER ETHERNET (POE) MARKET, BY APPLICATION, 2018-2033 (USD THOUSAND)
TABLE 73 EUROPE POWER OVER ETHERNET (POE) MARKET, BY END USER, 2018-2033 (USD THOUSAND)
TABLE 74 COMMERCIAL IN EUROPE POWER OVER ETHERNET (POE) MARKET, BY INDUSTRY VERTICAL, 2018-2033 (USD THOUSAND)
TABLE 75 COMMERCIAL IN EUROPE POWER OVER ETHERNET (POE) MARKET, BY TYPE, 2018-2033 (USD THOUSAND)
TABLE 76 INDUSTRIAL IN EUROPE POWER OVER ETHERNET (POE) MARKET, BY INDUSTRY VERTICAL, 2018-2033 (USD THOUSAND)
TABLE 77 INDUSTRIAL IN EUROPE POWER OVER ETHERNET (POE) MARKET, BY TYPE, 2018-2033 (USD THOUSAND)
TABLE 78 RESIDENTIAL IN EUROPE POWER OVER ETHERNET (POE) MARKET, BY HOUSING TYPE, 2018-2033 (USD THOUSAND)
TABLE 79 RESIDENTIAL IN EUROPE POWER OVER ETHERNET (POE) MARKET, BY TYPE, 2018-2033 (USD THOUSAND)
TABLE 80 USD THOUSAND
TABLE 81 GERMANY POWER OVER ETHERNET (POE) MARKET, BY TYPE, 2018-2033 (USD THOUSAND)
TABLE 82 POWERED DEVICES (PD) IN GERMANY POWER OVER ETHERNET (POE) MARKET, BY VOLTAGE RANGE, 2018-2033 (USD THOUSAND)
TABLE 83 POWER SOURCING EQUIPMENT (PSE) IN GERMANY POWER OVER ETHERNET (POE) MARKET, BY VOLTAGE RANGE, 2018-2033 (USD THOUSAND)
TABLE 84 NETWORK CABLE IN GERMANY POWER OVER ETHERNET (POE) MARKET, BY VOLTAGE RANGE, 2018-2033 (USD THOUSAND)
TABLE 85 GERMANY POWER OVER ETHERNET (POE) MARKET, BY CLASS TYPE, 2018-2033 (USD THOUSAND)
TABLE 86 GERMANY POWER OVER ETHERNET (POE) MARKET, BY MODES, 2018-2033 (USD THOUSAND)
TABLE 87 GERMANY POWER OVER ETHERNET (POE) MARKET, BY POWER RANGE, 2018-2033 (USD THOUSAND)
TABLE 88 GERMANY POWER OVER ETHERNET (POE) MARKET, BY VOLTAGE RANGE, 2018-2033 (USD THOUSAND)
TABLE 89 GERMANY POWER OVER ETHERNET (POE) MARKET, BY DEVICE TYPE, 2018-2033 (USD THOUSAND)
TABLE 90 GERMANY POWER OVER ETHERNET (POE) MARKET, BY APPLICATION, 2018-2033 (USD THOUSAND)
TABLE 91 GERMANY POWER OVER ETHERNET (POE) MARKET, BY END USER, 2018-2033 (USD THOUSAND)
TABLE 92 COMMERCIAL IN GERMANY POWER OVER ETHERNET (POE) MARKET, BY INDUSTRY VERTICAL, 2018-2033 (USD THOUSAND)
TABLE 93 COMMERCIAL IN GERMANY POWER OVER ETHERNET (POE) MARKET, BY TYPE, 2018-2033 (USD THOUSAND)
TABLE 94 INDUSTRIAL IN GERMANY POWER OVER ETHERNET (POE) MARKET, BY INDUSTRY VERTICAL, 2018-2033 (USD THOUSAND)
TABLE 95 INDUSTRIAL IN GERMANY POWER OVER ETHERNET (POE) MARKET, BY TYPE, 2018-2033 (USD THOUSAND)
TABLE 96 RESIDENTIAL IN GERMANY POWER OVER ETHERNET (POE) MARKET, BY HOUSING TYPE, 2018-2033 (USD THOUSAND)
TABLE 97 RESIDENTIAL IN GERMANY POWER OVER ETHERNET (POE) MARKET, BY TYPE, 2018-2033 (USD THOUSAND)
TABLE 98 USD THOUSAND
TABLE 99 U.K. POWER OVER ETHERNET (POE) MARKET, BY TYPE, 2018-2033 (USD THOUSAND)
TABLE 100 POWERED DEVICES (PD) IN U.K. POWER OVER ETHERNET (POE) MARKET, BY VOLTAGE RANGE, 2018-2033 (USD THOUSAND)
TABLE 101 POWER SOURCING EQUIPMENT (PSE) IN U.K. POWER OVER ETHERNET (POE) MARKET, BY VOLTAGE RANGE, 2018-2033 (USD THOUSAND)
TABLE 102 NETWORK CABLE IN U.K. POWER OVER ETHERNET (POE) MARKET, BY VOLTAGE RANGE, 2018-2033 (USD THOUSAND)
TABLE 103 U.K. POWER OVER ETHERNET (POE) MARKET, BY CLASS TYPE, 2018-2033 (USD THOUSAND)
TABLE 104 U.K. POWER OVER ETHERNET (POE) MARKET, BY MODES, 2018-2033 (USD THOUSAND)
TABLE 105 U.K. POWER OVER ETHERNET (POE) MARKET, BY POWER RANGE, 2018-2033 (USD THOUSAND)
TABLE 106 U.K. POWER OVER ETHERNET (POE) MARKET, BY VOLTAGE RANGE, 2018-2033 (USD THOUSAND)
TABLE 107 U.K. POWER OVER ETHERNET (POE) MARKET, BY DEVICE TYPE, 2018-2033 (USD THOUSAND)
TABLE 108 U.K. POWER OVER ETHERNET (POE) MARKET, BY APPLICATION, 2018-2033 (USD THOUSAND)
TABLE 109 U.K. POWER OVER ETHERNET (POE) MARKET, BY END USER, 2018-2033 (USD THOUSAND)
TABLE 110 COMMERCIAL IN U.K. POWER OVER ETHERNET (POE) MARKET, BY INDUSTRY VERTICAL, 2018-2033 (USD THOUSAND)
TABLE 111 COMMERCIAL IN U.K. POWER OVER ETHERNET (POE) MARKET, BY TYPE, 2018-2033 (USD THOUSAND)
TABLE 112 INDUSTRIAL IN U.K. POWER OVER ETHERNET (POE) MARKET, BY INDUSTRY VERTICAL, 2018-2033 (USD THOUSAND)
TABLE 113 INDUSTRIAL IN U.K. POWER OVER ETHERNET (POE) MARKET, BY TYPE, 2018-2033 (USD THOUSAND)
TABLE 114 RESIDENTIAL IN U.K. POWER OVER ETHERNET (POE) MARKET, BY HOUSING TYPE, 2018-2033 (USD THOUSAND)
TABLE 115 RESIDENTIAL IN U.K. POWER OVER ETHERNET (POE) MARKET, BY TYPE, 2018-2033 (USD THOUSAND)
TABLE 116 USD THOUSAND
TABLE 117 FRANCE POWER OVER ETHERNET (POE) MARKET, BY TYPE, 2018-2033 (USD THOUSAND)
TABLE 118 POWERED DEVICES (PD) IN FRANCE POWER OVER ETHERNET (POE) MARKET, BY VOLTAGE RANGE, 2018-2033 (USD THOUSAND)
TABLE 119 POWER SOURCING EQUIPMENT (PSE) IN FRANCE POWER OVER ETHERNET (POE) MARKET, BY VOLTAGE RANGE, 2018-2033 (USD THOUSAND)
TABLE 120 NETWORK CABLE IN FRANCE POWER OVER ETHERNET (POE) MARKET, BY VOLTAGE RANGE, 2018-2033 (USD THOUSAND)
TABLE 121 FRANCE POWER OVER ETHERNET (POE) MARKET, BY CLASS TYPE, 2018-2033 (USD THOUSAND)
TABLE 122 FRANCE POWER OVER ETHERNET (POE) MARKET, BY MODES, 2018-2033 (USD THOUSAND)
TABLE 123 FRANCE POWER OVER ETHERNET (POE) MARKET, BY POWER RANGE, 2018-2033 (USD THOUSAND)
TABLE 124 FRANCE POWER OVER ETHERNET (POE) MARKET, BY VOLTAGE RANGE, 2018-2033 (USD THOUSAND)
TABLE 125 FRANCE POWER OVER ETHERNET (POE) MARKET, BY DEVICE TYPE, 2018-2033 (USD THOUSAND)
TABLE 126 FRANCE POWER OVER ETHERNET (POE) MARKET, BY APPLICATION, 2018-2033 (USD THOUSAND)
TABLE 127 FRANCE POWER OVER ETHERNET (POE) MARKET, BY END USER, 2018-2033 (USD THOUSAND)
TABLE 128 COMMERCIAL IN FRANCE POWER OVER ETHERNET (POE) MARKET, BY INDUSTRY VERTICAL, 2018-2033 (USD THOUSAND)
TABLE 129 COMMERCIAL IN FRANCE POWER OVER ETHERNET (POE) MARKET, BY TYPE, 2018-2033 (USD THOUSAND)
TABLE 130 INDUSTRIAL IN FRANCE POWER OVER ETHERNET (POE) MARKET, BY INDUSTRY VERTICAL, 2018-2033 (USD THOUSAND)
TABLE 131 INDUSTRIAL IN FRANCE POWER OVER ETHERNET (POE) MARKET, BY TYPE, 2018-2033 (USD THOUSAND)
TABLE 132 RESIDENTIAL IN FRANCE POWER OVER ETHERNET (POE) MARKET, BY HOUSING TYPE, 2018-2033 (USD THOUSAND)
TABLE 133 RESIDENTIAL IN FRANCE POWER OVER ETHERNET (POE) MARKET, BY TYPE, 2018-2033 (USD THOUSAND)
TABLE 134 USD THOUSAND
TABLE 135 RUSSIA POWER OVER ETHERNET (POE) MARKET, BY TYPE, 2018-2033 (USD THOUSAND)
TABLE 136 POWERED DEVICES (PD) IN RUSSIA POWER OVER ETHERNET (POE) MARKET, BY VOLTAGE RANGE, 2018-2033 (USD THOUSAND)
TABLE 137 POWER SOURCING EQUIPMENT (PSE) IN RUSSIA POWER OVER ETHERNET (POE) MARKET, BY VOLTAGE RANGE, 2018-2033 (USD THOUSAND)
TABLE 138 NETWORK CABLE IN RUSSIA POWER OVER ETHERNET (POE) MARKET, BY VOLTAGE RANGE, 2018-2033 (USD THOUSAND)
TABLE 139 RUSSIA POWER OVER ETHERNET (POE) MARKET, BY CLASS TYPE, 2018-2033 (USD THOUSAND)
TABLE 140 RUSSIA POWER OVER ETHERNET (POE) MARKET, BY MODES, 2018-2033 (USD THOUSAND)
TABLE 141 RUSSIA POWER OVER ETHERNET (POE) MARKET, BY POWER RANGE, 2018-2033 (USD THOUSAND)
TABLE 142 RUSSIA POWER OVER ETHERNET (POE) MARKET, BY VOLTAGE RANGE, 2018-2033 (USD THOUSAND)
TABLE 143 RUSSIA POWER OVER ETHERNET (POE) MARKET, BY DEVICE TYPE, 2018-2033 (USD THOUSAND)
TABLE 144 RUSSIA POWER OVER ETHERNET (POE) MARKET, BY APPLICATION, 2018-2033 (USD THOUSAND)
TABLE 145 RUSSIA POWER OVER ETHERNET (POE) MARKET, BY END USER, 2018-2033 (USD THOUSAND)
TABLE 146 COMMERCIAL IN RUSSIA POWER OVER ETHERNET (POE) MARKET, BY INDUSTRY VERTICAL, 2018-2033 (USD THOUSAND)
TABLE 147 COMMERCIAL IN RUSSIA POWER OVER ETHERNET (POE) MARKET, BY TYPE, 2018-2033 (USD THOUSAND)
TABLE 148 INDUSTRIAL IN RUSSIA POWER OVER ETHERNET (POE) MARKET, BY INDUSTRY VERTICAL, 2018-2033 (USD THOUSAND)
TABLE 149 INDUSTRIAL IN RUSSIA POWER OVER ETHERNET (POE) MARKET, BY TYPE, 2018-2033 (USD THOUSAND)
TABLE 150 RESIDENTIAL IN RUSSIA POWER OVER ETHERNET (POE) MARKET, BY HOUSING TYPE, 2018-2033 (USD THOUSAND)
TABLE 151 RESIDENTIAL IN RUSSIA POWER OVER ETHERNET (POE) MARKET, BY TYPE, 2018-2033 (USD THOUSAND)
TABLE 152 USD THOUSAND
TABLE 153 ITALY POWER OVER ETHERNET (POE) MARKET, BY TYPE, 2018-2033 (USD THOUSAND)
TABLE 154 POWERED DEVICES (PD) IN ITALY POWER OVER ETHERNET (POE) MARKET, BY VOLTAGE RANGE, 2018-2033 (USD THOUSAND)
TABLE 155 POWER SOURCING EQUIPMENT (PSE) IN ITALY POWER OVER ETHERNET (POE) MARKET, BY VOLTAGE RANGE, 2018-2033 (USD THOUSAND)
TABLE 156 NETWORK CABLE IN ITALY POWER OVER ETHERNET (POE) MARKET, BY VOLTAGE RANGE, 2018-2033 (USD THOUSAND)
TABLE 157 ITALY POWER OVER ETHERNET (POE) MARKET, BY CLASS TYPE, 2018-2033 (USD THOUSAND)
TABLE 158 ITALY POWER OVER ETHERNET (POE) MARKET, BY MODES, 2018-2033 (USD THOUSAND)
TABLE 159 ITALY POWER OVER ETHERNET (POE) MARKET, BY POWER RANGE, 2018-2033 (USD THOUSAND)
TABLE 160 ITALY POWER OVER ETHERNET (POE) MARKET, BY VOLTAGE RANGE, 2018-2033 (USD THOUSAND)
TABLE 161 ITALY POWER OVER ETHERNET (POE) MARKET, BY DEVICE TYPE, 2018-2033 (USD THOUSAND)
TABLE 162 ITALY POWER OVER ETHERNET (POE) MARKET, BY APPLICATION, 2018-2033 (USD THOUSAND)
TABLE 163 ITALY POWER OVER ETHERNET (POE) MARKET, BY END USER, 2018-2033 (USD THOUSAND)
TABLE 164 COMMERCIAL IN ITALY POWER OVER ETHERNET (POE) MARKET, BY INDUSTRY VERTICAL, 2018-2033 (USD THOUSAND)
TABLE 165 COMMERCIAL IN ITALY POWER OVER ETHERNET (POE) MARKET, BY TYPE, 2018-2033 (USD THOUSAND)
TABLE 166 INDUSTRIAL IN ITALY POWER OVER ETHERNET (POE) MARKET, BY INDUSTRY VERTICAL, 2018-2033 (USD THOUSAND)
TABLE 167 INDUSTRIAL IN ITALY POWER OVER ETHERNET (POE) MARKET, BY TYPE, 2018-2033 (USD THOUSAND)
TABLE 168 RESIDENTIAL IN ITALY POWER OVER ETHERNET (POE) MARKET, BY HOUSING TYPE, 2018-2033 (USD THOUSAND)
TABLE 169 RESIDENTIAL IN ITALY POWER OVER ETHERNET (POE) MARKET, BY TYPE, 2018-2033 (USD THOUSAND)
TABLE 170 USD THOUSAND
TABLE 171 SPAIN POWER OVER ETHERNET (POE) MARKET, BY TYPE, 2018-2033 (USD THOUSAND)
TABLE 172 POWERED DEVICES (PD) IN SPAIN POWER OVER ETHERNET (POE) MARKET, BY VOLTAGE RANGE, 2018-2033 (USD THOUSAND)
TABLE 173 POWER SOURCING EQUIPMENT (PSE) IN SPAIN POWER OVER ETHERNET (POE) MARKET, BY VOLTAGE RANGE, 2018-2033 (USD THOUSAND)
TABLE 174 NETWORK CABLE IN SPAIN POWER OVER ETHERNET (POE) MARKET, BY VOLTAGE RANGE, 2018-2033 (USD THOUSAND)
TABLE 175 SPAIN POWER OVER ETHERNET (POE) MARKET, BY CLASS TYPE, 2018-2033 (USD THOUSAND)
TABLE 176 SPAIN POWER OVER ETHERNET (POE) MARKET, BY MODES, 2018-2033 (USD THOUSAND)
TABLE 177 SPAIN POWER OVER ETHERNET (POE) MARKET, BY POWER RANGE, 2018-2033 (USD THOUSAND)
TABLE 178 SPAIN POWER OVER ETHERNET (POE) MARKET, BY VOLTAGE RANGE, 2018-2033 (USD THOUSAND)
TABLE 179 SPAIN POWER OVER ETHERNET (POE) MARKET, BY DEVICE TYPE, 2018-2033 (USD THOUSAND)
TABLE 180 SPAIN POWER OVER ETHERNET (POE) MARKET, BY APPLICATION, 2018-2033 (USD THOUSAND)
TABLE 181 SPAIN POWER OVER ETHERNET (POE) MARKET, BY END USER, 2018-2033 (USD THOUSAND)
TABLE 182 COMMERCIAL IN SPAIN POWER OVER ETHERNET (POE) MARKET, BY INDUSTRY VERTICAL, 2018-2033 (USD THOUSAND)
TABLE 183 COMMERCIAL IN SPAIN POWER OVER ETHERNET (POE) MARKET, BY TYPE, 2018-2033 (USD THOUSAND)
TABLE 184 INDUSTRIAL IN SPAIN POWER OVER ETHERNET (POE) MARKET, BY INDUSTRY VERTICAL, 2018-2033 (USD THOUSAND)
TABLE 185 INDUSTRIAL IN SPAIN POWER OVER ETHERNET (POE) MARKET, BY TYPE, 2018-2033 (USD THOUSAND)
TABLE 186 RESIDENTIAL IN SPAIN POWER OVER ETHERNET (POE) MARKET, BY HOUSING TYPE, 2018-2033 (USD THOUSAND)
TABLE 187 RESIDENTIAL IN SPAIN POWER OVER ETHERNET (POE) MARKET, BY TYPE, 2018-2033 (USD THOUSAND)
TABLE 188 USD THOUSAND
TABLE 189 NETHERLANDS POWER OVER ETHERNET (POE) MARKET, BY TYPE, 2018-2033 (USD THOUSAND)
TABLE 190 POWERED DEVICES (PD) IN NETHERLANDS POWER OVER ETHERNET (POE) MARKET, BY VOLTAGE RANGE, 2018-2033 (USD THOUSAND)
TABLE 191 POWER SOURCING EQUIPMENT (PSE) IN NETHERLANDS POWER OVER ETHERNET (POE) MARKET, BY VOLTAGE RANGE, 2018-2033 (USD THOUSAND)
TABLE 192 NETWORK CABLE IN NETHERLANDS POWER OVER ETHERNET (POE) MARKET, BY VOLTAGE RANGE, 2018-2033 (USD THOUSAND)
TABLE 193 NETHERLANDS POWER OVER ETHERNET (POE) MARKET, BY CLASS TYPE, 2018-2033 (USD THOUSAND)
TABLE 194 NETHERLANDS POWER OVER ETHERNET (POE) MARKET, BY MODES, 2018-2033 (USD THOUSAND)
TABLE 195 NETHERLANDS POWER OVER ETHERNET (POE) MARKET, BY POWER RANGE, 2018-2033 (USD THOUSAND)
TABLE 196 NETHERLANDS POWER OVER ETHERNET (POE) MARKET, BY VOLTAGE RANGE, 2018-2033 (USD THOUSAND)
TABLE 197 NETHERLANDS POWER OVER ETHERNET (POE) MARKET, BY DEVICE TYPE, 2018-2033 (USD THOUSAND)
TABLE 198 NETHERLANDS POWER OVER ETHERNET (POE) MARKET, BY APPLICATION, 2018-2033 (USD THOUSAND)
TABLE 199 NETHERLANDS POWER OVER ETHERNET (POE) MARKET, BY END USER, 2018-2033 (USD THOUSAND)
TABLE 200 COMMERCIAL IN NETHERLANDS POWER OVER ETHERNET (POE) MARKET, BY INDUSTRY VERTICAL, 2018-2033 (USD THOUSAND)
TABLE 201 COMMERCIAL IN NETHERLANDS POWER OVER ETHERNET (POE) MARKET, BY TYPE, 2018-2033 (USD THOUSAND)
TABLE 202 INDUSTRIAL IN NETHERLANDS POWER OVER ETHERNET (POE) MARKET, BY INDUSTRY VERTICAL, 2018-2033 (USD THOUSAND)
TABLE 203 INDUSTRIAL IN NETHERLANDS POWER OVER ETHERNET (POE) MARKET, BY TYPE, 2018-2033 (USD THOUSAND)
TABLE 204 RESIDENTIAL IN NETHERLANDS POWER OVER ETHERNET (POE) MARKET, BY HOUSING TYPE, 2018-2033 (USD THOUSAND)
TABLE 205 RESIDENTIAL IN NETHERLANDS POWER OVER ETHERNET (POE) MARKET, BY TYPE, 2018-2033 (USD THOUSAND)
TABLE 206 USD THOUSAND
TABLE 207 SWEDEN POWER OVER ETHERNET (POE) MARKET, BY TYPE, 2018-2033 (USD THOUSAND)
TABLE 208 POWERED DEVICES (PD) IN SWEDEN POWER OVER ETHERNET (POE) MARKET, BY VOLTAGE RANGE, 2018-2033 (USD THOUSAND)
TABLE 209 POWER SOURCING EQUIPMENT (PSE) IN SWEDEN POWER OVER ETHERNET (POE) MARKET, BY VOLTAGE RANGE, 2018-2033 (USD THOUSAND)
TABLE 210 NETWORK CABLE IN SWEDEN POWER OVER ETHERNET (POE) MARKET, BY VOLTAGE RANGE, 2018-2033 (USD THOUSAND)
TABLE 211 SWEDEN POWER OVER ETHERNET (POE) MARKET, BY CLASS TYPE, 2018-2033 (USD THOUSAND)
TABLE 212 SWEDEN POWER OVER ETHERNET (POE) MARKET, BY MODES, 2018-2033 (USD THOUSAND)
TABLE 213 SWEDEN POWER OVER ETHERNET (POE) MARKET, BY POWER RANGE, 2018-2033 (USD THOUSAND)
TABLE 214 SWEDEN POWER OVER ETHERNET (POE) MARKET, BY VOLTAGE RANGE, 2018-2033 (USD THOUSAND)
TABLE 215 SWEDEN POWER OVER ETHERNET (POE) MARKET, BY DEVICE TYPE, 2018-2033 (USD THOUSAND)
TABLE 216 SWEDEN POWER OVER ETHERNET (POE) MARKET, BY APPLICATION, 2018-2033 (USD THOUSAND)
TABLE 217 SWEDEN POWER OVER ETHERNET (POE) MARKET, BY END USER, 2018-2033 (USD THOUSAND)
TABLE 218 COMMERCIAL IN SWEDEN POWER OVER ETHERNET (POE) MARKET, BY INDUSTRY VERTICAL, 2018-2033 (USD THOUSAND)
TABLE 219 COMMERCIAL IN SWEDEN POWER OVER ETHERNET (POE) MARKET, BY TYPE, 2018-2033 (USD THOUSAND)
TABLE 220 INDUSTRIAL IN SWEDEN POWER OVER ETHERNET (POE) MARKET, BY INDUSTRY VERTICAL, 2018-2033 (USD THOUSAND)
TABLE 221 INDUSTRIAL IN SWEDEN POWER OVER ETHERNET (POE) MARKET, BY TYPE, 2018-2033 (USD THOUSAND)
TABLE 222 RESIDENTIAL IN SWEDEN POWER OVER ETHERNET (POE) MARKET, BY HOUSING TYPE, 2018-2033 (USD THOUSAND)
TABLE 223 RESIDENTIAL IN SWEDEN POWER OVER ETHERNET (POE) MARKET, BY TYPE, 2018-2033 (USD THOUSAND)
TABLE 224 USD THOUSAND
TABLE 225 SWITZERLAND POWER OVER ETHERNET (POE) MARKET, BY TYPE, 2018-2033 (USD THOUSAND)
TABLE 226 POWERED DEVICES (PD) IN SWITZERLAND POWER OVER ETHERNET (POE) MARKET, BY VOLTAGE RANGE, 2018-2033 (USD THOUSAND)
TABLE 227 POWER SOURCING EQUIPMENT (PSE) IN SWITZERLAND POWER OVER ETHERNET (POE) MARKET, BY VOLTAGE RANGE, 2018-2033 (USD THOUSAND)
TABLE 228 NETWORK CABLE IN SWITZERLAND POWER OVER ETHERNET (POE) MARKET, BY VOLTAGE RANGE, 2018-2033 (USD THOUSAND)
TABLE 229 SWITZERLAND POWER OVER ETHERNET (POE) MARKET, BY CLASS TYPE, 2018-2033 (USD THOUSAND)
TABLE 230 SWITZERLAND POWER OVER ETHERNET (POE) MARKET, BY MODES, 2018-2033 (USD THOUSAND)
TABLE 231 SWITZERLAND POWER OVER ETHERNET (POE) MARKET, BY POWER RANGE, 2018-2033 (USD THOUSAND)
TABLE 232 SWITZERLAND POWER OVER ETHERNET (POE) MARKET, BY VOLTAGE RANGE, 2018-2033 (USD THOUSAND)
TABLE 233 SWITZERLAND POWER OVER ETHERNET (POE) MARKET, BY DEVICE TYPE, 2018-2033 (USD THOUSAND)
TABLE 234 SWITZERLAND POWER OVER ETHERNET (POE) MARKET, BY APPLICATION, 2018-2033 (USD THOUSAND)
TABLE 235 SWITZERLAND POWER OVER ETHERNET (POE) MARKET, BY END USER, 2018-2033 (USD THOUSAND)
TABLE 236 COMMERCIAL IN SWITZERLAND POWER OVER ETHERNET (POE) MARKET, BY INDUSTRY VERTICAL, 2018-2033 (USD THOUSAND)
TABLE 237 COMMERCIAL IN SWITZERLAND POWER OVER ETHERNET (POE) MARKET, BY TYPE, 2018-2033 (USD THOUSAND)
TABLE 238 INDUSTRIAL IN SWITZERLAND POWER OVER ETHERNET (POE) MARKET, BY INDUSTRY VERTICAL, 2018-2033 (USD THOUSAND)
TABLE 239 INDUSTRIAL IN SWITZERLAND POWER OVER ETHERNET (POE) MARKET, BY TYPE, 2018-2033 (USD THOUSAND)
TABLE 240 RESIDENTIAL IN SWITZERLAND POWER OVER ETHERNET (POE) MARKET, BY HOUSING TYPE, 2018-2033 (USD THOUSAND)
TABLE 241 RESIDENTIAL IN SWITZERLAND POWER OVER ETHERNET (POE) MARKET, BY TYPE, 2018-2033 (USD THOUSAND)
TABLE 242 USD THOUSAND
TABLE 243 BELGIUM POWER OVER ETHERNET (POE) MARKET, BY TYPE, 2018-2033 (USD THOUSAND)
TABLE 244 POWERED DEVICES (PD) IN BELGIUM POWER OVER ETHERNET (POE) MARKET, BY VOLTAGE RANGE, 2018-2033 (USD THOUSAND)
TABLE 245 POWER SOURCING EQUIPMENT (PSE) IN BELGIUM POWER OVER ETHERNET (POE) MARKET, BY VOLTAGE RANGE, 2018-2033 (USD THOUSAND)
TABLE 246 NETWORK CABLE IN BELGIUM POWER OVER ETHERNET (POE) MARKET, BY VOLTAGE RANGE, 2018-2033 (USD THOUSAND)
TABLE 247 BELGIUM POWER OVER ETHERNET (POE) MARKET, BY CLASS TYPE, 2018-2033 (USD THOUSAND)
TABLE 248 BELGIUM POWER OVER ETHERNET (POE) MARKET, BY MODES, 2018-2033 (USD THOUSAND)
TABLE 249 BELGIUM POWER OVER ETHERNET (POE) MARKET, BY POWER RANGE, 2018-2033 (USD THOUSAND)
TABLE 250 BELGIUM POWER OVER ETHERNET (POE) MARKET, BY VOLTAGE RANGE, 2018-2033 (USD THOUSAND)
TABLE 251 BELGIUM POWER OVER ETHERNET (POE) MARKET, BY DEVICE TYPE, 2018-2033 (USD THOUSAND)
TABLE 252 BELGIUM POWER OVER ETHERNET (POE) MARKET, BY APPLICATION, 2018-2033 (USD THOUSAND)
TABLE 253 BELGIUM POWER OVER ETHERNET (POE) MARKET, BY END USER, 2018-2033 (USD THOUSAND)
TABLE 254 COMMERCIAL IN BELGIUM POWER OVER ETHERNET (POE) MARKET, BY INDUSTRY VERTICAL, 2018-2033 (USD THOUSAND)
TABLE 255 COMMERCIAL IN BELGIUM POWER OVER ETHERNET (POE) MARKET, BY TYPE, 2018-2033 (USD THOUSAND)
TABLE 256 INDUSTRIAL IN BELGIUM POWER OVER ETHERNET (POE) MARKET, BY INDUSTRY VERTICAL, 2018-2033 (USD THOUSAND)
TABLE 257 INDUSTRIAL IN BELGIUM POWER OVER ETHERNET (POE) MARKET, BY TYPE, 2018-2033 (USD THOUSAND)
TABLE 258 RESIDENTIAL IN BELGIUM POWER OVER ETHERNET (POE) MARKET, BY HOUSING TYPE, 2018-2033 (USD THOUSAND)
TABLE 259 RESIDENTIAL IN BELGIUM POWER OVER ETHERNET (POE) MARKET, BY TYPE, 2018-2033 (USD THOUSAND)
TABLE 260 USD THOUSAND
TABLE 261 NORWAY POWER OVER ETHERNET (POE) MARKET, BY TYPE, 2018-2033 (USD THOUSAND)
TABLE 262 POWERED DEVICES (PD) IN NORWAY POWER OVER ETHERNET (POE) MARKET, BY VOLTAGE RANGE, 2018-2033 (USD THOUSAND)
TABLE 263 POWER SOURCING EQUIPMENT (PSE) IN NORWAY POWER OVER ETHERNET (POE) MARKET, BY VOLTAGE RANGE, 2018-2033 (USD THOUSAND)
TABLE 264 NETWORK CABLE IN NORWAY POWER OVER ETHERNET (POE) MARKET, BY VOLTAGE RANGE, 2018-2033 (USD THOUSAND)
TABLE 265 NORWAY POWER OVER ETHERNET (POE) MARKET, BY CLASS TYPE, 2018-2033 (USD THOUSAND)
TABLE 266 NORWAY POWER OVER ETHERNET (POE) MARKET, BY MODES, 2018-2033 (USD THOUSAND)
TABLE 267 NORWAY POWER OVER ETHERNET (POE) MARKET, BY POWER RANGE, 2018-2033 (USD THOUSAND)
TABLE 268 NORWAY POWER OVER ETHERNET (POE) MARKET, BY VOLTAGE RANGE, 2018-2033 (USD THOUSAND)
TABLE 269 NORWAY POWER OVER ETHERNET (POE) MARKET, BY DEVICE TYPE, 2018-2033 (USD THOUSAND)
TABLE 270 NORWAY POWER OVER ETHERNET (POE) MARKET, BY APPLICATION, 2018-2033 (USD THOUSAND)
TABLE 271 NORWAY POWER OVER ETHERNET (POE) MARKET, BY END USER, 2018-2033 (USD THOUSAND)
TABLE 272 COMMERCIAL IN NORWAY POWER OVER ETHERNET (POE) MARKET, BY INDUSTRY VERTICAL, 2018-2033 (USD THOUSAND)
TABLE 273 COMMERCIAL IN NORWAY POWER OVER ETHERNET (POE) MARKET, BY TYPE, 2018-2033 (USD THOUSAND)
TABLE 274 INDUSTRIAL IN NORWAY POWER OVER ETHERNET (POE) MARKET, BY INDUSTRY VERTICAL, 2018-2033 (USD THOUSAND)
TABLE 275 INDUSTRIAL IN NORWAY POWER OVER ETHERNET (POE) MARKET, BY TYPE, 2018-2033 (USD THOUSAND)
TABLE 276 RESIDENTIAL IN NORWAY POWER OVER ETHERNET (POE) MARKET, BY HOUSING TYPE, 2018-2033 (USD THOUSAND)
TABLE 277 RESIDENTIAL IN NORWAY POWER OVER ETHERNET (POE) MARKET, BY TYPE, 2018-2033 (USD THOUSAND)
TABLE 278 USD THOUSAND
TABLE 279 POLAND POWER OVER ETHERNET (POE) MARKET, BY TYPE, 2018-2033 (USD THOUSAND)
TABLE 280 POWERED DEVICES (PD) IN POLAND POWER OVER ETHERNET (POE) MARKET, BY VOLTAGE RANGE, 2018-2033 (USD THOUSAND)
TABLE 281 POWER SOURCING EQUIPMENT (PSE) IN POLAND POWER OVER ETHERNET (POE) MARKET, BY VOLTAGE RANGE, 2018-2033 (USD THOUSAND)
TABLE 282 NETWORK CABLE IN POLAND POWER OVER ETHERNET (POE) MARKET, BY VOLTAGE RANGE, 2018-2033 (USD THOUSAND)
TABLE 283 POLAND POWER OVER ETHERNET (POE) MARKET, BY CLASS TYPE, 2018-2033 (USD THOUSAND)
TABLE 284 POLAND POWER OVER ETHERNET (POE) MARKET, BY MODES, 2018-2033 (USD THOUSAND)
TABLE 285 POLAND POWER OVER ETHERNET (POE) MARKET, BY POWER RANGE, 2018-2033 (USD THOUSAND)
TABLE 286 POLAND POWER OVER ETHERNET (POE) MARKET, BY VOLTAGE RANGE, 2018-2033 (USD THOUSAND)
TABLE 287 POLAND POWER OVER ETHERNET (POE) MARKET, BY DEVICE TYPE, 2018-2033 (USD THOUSAND)
TABLE 288 POLAND POWER OVER ETHERNET (POE) MARKET, BY APPLICATION, 2018-2033 (USD THOUSAND)
TABLE 289 POLAND POWER OVER ETHERNET (POE) MARKET, BY END USER, 2018-2033 (USD THOUSAND)
TABLE 290 COMMERCIAL IN POLAND POWER OVER ETHERNET (POE) MARKET, BY INDUSTRY VERTICAL, 2018-2033 (USD THOUSAND)
TABLE 291 COMMERCIAL IN POLAND POWER OVER ETHERNET (POE) MARKET, BY TYPE, 2018-2033 (USD THOUSAND)
TABLE 292 INDUSTRIAL IN POLAND POWER OVER ETHERNET (POE) MARKET, BY INDUSTRY VERTICAL, 2018-2033 (USD THOUSAND)
TABLE 293 INDUSTRIAL IN POLAND POWER OVER ETHERNET (POE) MARKET, BY TYPE, 2018-2033 (USD THOUSAND)
TABLE 294 RESIDENTIAL IN POLAND POWER OVER ETHERNET (POE) MARKET, BY HOUSING TYPE, 2018-2033 (USD THOUSAND)
TABLE 295 RESIDENTIAL IN POLAND POWER OVER ETHERNET (POE) MARKET, BY TYPE, 2018-2033 (USD THOUSAND)
TABLE 296 USD THOUSAND
TABLE 297 DENMARK POWER OVER ETHERNET (POE) MARKET, BY TYPE, 2018-2033 (USD THOUSAND)
TABLE 298 POWERED DEVICES (PD) IN DENMARK POWER OVER ETHERNET (POE) MARKET, BY VOLTAGE RANGE, 2018-2033 (USD THOUSAND)
TABLE 299 POWER SOURCING EQUIPMENT (PSE) IN DENMARK POWER OVER ETHERNET (POE) MARKET, BY VOLTAGE RANGE, 2018-2033 (USD THOUSAND)
TABLE 300 NETWORK CABLE IN DENMARK POWER OVER ETHERNET (POE) MARKET, BY VOLTAGE RANGE, 2018-2033 (USD THOUSAND)
TABLE 301 DENMARK POWER OVER ETHERNET (POE) MARKET, BY CLASS TYPE, 2018-2033 (USD THOUSAND)
TABLE 302 DENMARK POWER OVER ETHERNET (POE) MARKET, BY MODES, 2018-2033 (USD THOUSAND)
TABLE 303 DENMARK POWER OVER ETHERNET (POE) MARKET, BY POWER RANGE, 2018-2033 (USD THOUSAND)
TABLE 304 DENMARK POWER OVER ETHERNET (POE) MARKET, BY VOLTAGE RANGE, 2018-2033 (USD THOUSAND)
TABLE 305 DENMARK POWER OVER ETHERNET (POE) MARKET, BY DEVICE TYPE, 2018-2033 (USD THOUSAND)
TABLE 306 DENMARK POWER OVER ETHERNET (POE) MARKET, BY APPLICATION, 2018-2033 (USD THOUSAND)
TABLE 307 DENMARK POWER OVER ETHERNET (POE) MARKET, BY END USER, 2018-2033 (USD THOUSAND)
TABLE 308 COMMERCIAL IN DENMARK POWER OVER ETHERNET (POE) MARKET, BY INDUSTRY VERTICAL, 2018-2033 (USD THOUSAND)
TABLE 309 COMMERCIAL IN DENMARK POWER OVER ETHERNET (POE) MARKET, BY TYPE, 2018-2033 (USD THOUSAND)
TABLE 310 INDUSTRIAL IN DENMARK POWER OVER ETHERNET (POE) MARKET, BY INDUSTRY VERTICAL, 2018-2033 (USD THOUSAND)
TABLE 311 INDUSTRIAL IN DENMARK POWER OVER ETHERNET (POE) MARKET, BY TYPE, 2018-2033 (USD THOUSAND)
TABLE 312 RESIDENTIAL IN DENMARK POWER OVER ETHERNET (POE) MARKET, BY HOUSING TYPE, 2018-2033 (USD THOUSAND)
TABLE 313 RESIDENTIAL IN DENMARK POWER OVER ETHERNET (POE) MARKET, BY TYPE, 2018-2033 (USD THOUSAND)
TABLE 314 USD THOUSAND
TABLE 315 FINLAND POWER OVER ETHERNET (POE) MARKET, BY TYPE, 2018-2033 (USD THOUSAND)
TABLE 316 POWERED DEVICES (PD) IN FINLAND POWER OVER ETHERNET (POE) MARKET, BY VOLTAGE RANGE, 2018-2033 (USD THOUSAND)
TABLE 317 POWER SOURCING EQUIPMENT (PSE) IN FINLAND POWER OVER ETHERNET (POE) MARKET, BY VOLTAGE RANGE, 2018-2033 (USD THOUSAND)
TABLE 318 NETWORK CABLE IN FINLAND POWER OVER ETHERNET (POE) MARKET, BY VOLTAGE RANGE, 2018-2033 (USD THOUSAND)
TABLE 319 FINLAND POWER OVER ETHERNET (POE) MARKET, BY CLASS TYPE, 2018-2033 (USD THOUSAND)
TABLE 320 FINLAND POWER OVER ETHERNET (POE) MARKET, BY MODES, 2018-2033 (USD THOUSAND)
TABLE 321 FINLAND POWER OVER ETHERNET (POE) MARKET, BY POWER RANGE, 2018-2033 (USD THOUSAND)
TABLE 322 FINLAND POWER OVER ETHERNET (POE) MARKET, BY VOLTAGE RANGE, 2018-2033 (USD THOUSAND)
TABLE 323 FINLAND POWER OVER ETHERNET (POE) MARKET, BY DEVICE TYPE, 2018-2033 (USD THOUSAND)
TABLE 324 FINLAND POWER OVER ETHERNET (POE) MARKET, BY APPLICATION, 2018-2033 (USD THOUSAND)
TABLE 325 FINLAND POWER OVER ETHERNET (POE) MARKET, BY END USER, 2018-2033 (USD THOUSAND)
TABLE 326 COMMERCIAL IN FINLAND POWER OVER ETHERNET (POE) MARKET, BY INDUSTRY VERTICAL, 2018-2033 (USD THOUSAND)
TABLE 327 COMMERCIAL IN FINLAND POWER OVER ETHERNET (POE) MARKET, BY TYPE, 2018-2033 (USD THOUSAND)
TABLE 328 INDUSTRIAL IN FINLAND POWER OVER ETHERNET (POE) MARKET, BY INDUSTRY VERTICAL, 2018-2033 (USD THOUSAND)
TABLE 329 INDUSTRIAL IN FINLAND POWER OVER ETHERNET (POE) MARKET, BY TYPE, 2018-2033 (USD THOUSAND)
TABLE 330 RESIDENTIAL IN FINLAND POWER OVER ETHERNET (POE) MARKET, BY HOUSING TYPE, 2018-2033 (USD THOUSAND)
TABLE 331 RESIDENTIAL IN FINLAND POWER OVER ETHERNET (POE) MARKET, BY TYPE, 2018-2033 (USD THOUSAND)
TABLE 332 USD THOUSAND
TABLE 333 TURKEY POWER OVER ETHERNET (POE) MARKET, BY TYPE, 2018-2033 (USD THOUSAND)
TABLE 334 POWERED DEVICES (PD) IN TURKEY POWER OVER ETHERNET (POE) MARKET, BY VOLTAGE RANGE, 2018-2033 (USD THOUSAND)
TABLE 335 POWER SOURCING EQUIPMENT (PSE) IN TURKEY POWER OVER ETHERNET (POE) MARKET, BY VOLTAGE RANGE, 2018-2033 (USD THOUSAND)
TABLE 336 NETWORK CABLE IN TURKEY POWER OVER ETHERNET (POE) MARKET, BY VOLTAGE RANGE, 2018-2033 (USD THOUSAND)
TABLE 337 TURKEY POWER OVER ETHERNET (POE) MARKET, BY CLASS TYPE, 2018-2033 (USD THOUSAND)
TABLE 338 TURKEY POWER OVER ETHERNET (POE) MARKET, BY MODES, 2018-2033 (USD THOUSAND)
TABLE 339 TURKEY POWER OVER ETHERNET (POE) MARKET, BY POWER RANGE, 2018-2033 (USD THOUSAND)
TABLE 340 TURKEY POWER OVER ETHERNET (POE) MARKET, BY VOLTAGE RANGE, 2018-2033 (USD THOUSAND)
TABLE 341 TURKEY POWER OVER ETHERNET (POE) MARKET, BY DEVICE TYPE, 2018-2033 (USD THOUSAND)
TABLE 342 TURKEY POWER OVER ETHERNET (POE) MARKET, BY APPLICATION, 2018-2033 (USD THOUSAND)
TABLE 343 TURKEY POWER OVER ETHERNET (POE) MARKET, BY END USER, 2018-2033 (USD THOUSAND)
TABLE 344 COMMERCIAL IN TURKEY POWER OVER ETHERNET (POE) MARKET, BY INDUSTRY VERTICAL, 2018-2033 (USD THOUSAND)
TABLE 345 COMMERCIAL IN TURKEY POWER OVER ETHERNET (POE) MARKET, BY TYPE, 2018-2033 (USD THOUSAND)
TABLE 346 INDUSTRIAL IN TURKEY POWER OVER ETHERNET (POE) MARKET, BY INDUSTRY VERTICAL, 2018-2033 (USD THOUSAND)
TABLE 347 INDUSTRIAL IN TURKEY POWER OVER ETHERNET (POE) MARKET, BY TYPE, 2018-2033 (USD THOUSAND)
TABLE 348 RESIDENTIAL IN TURKEY POWER OVER ETHERNET (POE) MARKET, BY HOUSING TYPE, 2018-2033 (USD THOUSAND)
TABLE 349 RESIDENTIAL IN TURKEY POWER OVER ETHERNET (POE) MARKET, BY TYPE, 2018-2033 (USD THOUSAND)
TABLE 350 USD THOUSAND
TABLE 351 REST OF EUROPE POWER OVER ETHERNET (POE) MARKET, BY TYPE, 2018-2033 (USD THOUSAND)
TABLE 352 POWERED DEVICES (PD) IN REST OF EUROPE POWER OVER ETHERNET (POE) MARKET, BY VOLTAGE RANGE, 2018-2033 (USD THOUSAND)
TABLE 353 POWER SOURCING EQUIPMENT (PSE) IN REST OF EUROPE POWER OVER ETHERNET (POE) MARKET, BY VOLTAGE RANGE, 2018-2033 (USD THOUSAND)
TABLE 354 NETWORK CABLE IN REST OF EUROPE POWER OVER ETHERNET (POE) MARKET, BY VOLTAGE RANGE, 2018-2033 (USD THOUSAND)
TABLE 355 REST OF EUROPE POWER OVER ETHERNET (POE) MARKET, BY CLASS TYPE, 2018-2033 (USD THOUSAND)
TABLE 356 REST OF EUROPE POWER OVER ETHERNET (POE) MARKET, BY MODES, 2018-2033 (USD THOUSAND)
TABLE 357 REST OF EUROPE POWER OVER ETHERNET (POE) MARKET, BY POWER RANGE, 2018-2033 (USD THOUSAND)
TABLE 358 REST OF EUROPE POWER OVER ETHERNET (POE) MARKET, BY VOLTAGE RANGE, 2018-2033 (USD THOUSAND)
TABLE 359 REST OF EUROPE POWER OVER ETHERNET (POE) MARKET, BY DEVICE TYPE, 2018-2033 (USD THOUSAND)
TABLE 360 REST OF EUROPE POWER OVER ETHERNET (POE) MARKET, BY APPLICATION, 2018-2033 (USD THOUSAND)
TABLE 361 REST OF EUROPE POWER OVER ETHERNET (POE) MARKET, BY END USER, 2018-2033 (USD THOUSAND)
TABLE 362 COMMERCIAL IN REST OF EUROPE POWER OVER ETHERNET (POE) MARKET, BY INDUSTRY VERTICAL, 2018-2033 (USD THOUSAND)
TABLE 363 COMMERCIAL IN REST OF EUROPE POWER OVER ETHERNET (POE) MARKET, BY TYPE, 2018-2033 (USD THOUSAND)
TABLE 364 INDUSTRIAL IN REST OF EUROPE POWER OVER ETHERNET (POE) MARKET, BY INDUSTRY VERTICAL, 2018-2033 (USD THOUSAND)
TABLE 365 INDUSTRIAL IN REST OF EUROPE POWER OVER ETHERNET (POE) MARKET, BY TYPE, 2018-2033 (USD THOUSAND)
TABLE 366 RESIDENTIAL IN REST OF EUROPE POWER OVER ETHERNET (POE) MARKET, BY HOUSING TYPE, 2018-2033 (USD THOUSAND)
TABLE 367 RESIDENTIAL IN REST OF EUROPE POWER OVER ETHERNET (POE) MARKET, BY TYPE, 2018-2033 (USD THOUSAND)
List of Figure
FIGURE 1 EUROPE POWER OVER ETHERNET (POE) MARKET: SEGMENTATION
FIGURE 2 EUROPE POWER OVER ETHERNET (POE) MARKET: DATA TRIANGULATION
FIGURE 3 EUROPE POWER OVER ETHERNET (POE) MARKET: DROC ANALYSIS
FIGURE 4 EUROPE POWER OVER ETHERNET (POE) MARKET: EUROPE VS REGIONAL MARKET ANALYSIS
FIGURE 5 EUROPE POWER OVER ETHERNET (POE) MARKET: COMPANY RESEARCH ANALYSIS
FIGURE 6 EUROPE POWER OVER ETHERNET (POE) MARKET: INTERVIEW DEMOGRAPHICS
FIGURE 7 EUROPE POWER OVER ETHERNET (POE) MARKET: DBMR MARKET POSITION GRID
FIGURE 8 EUROPE POWER OVER ETHERNET (POE) MARKET: VENDOR SHARE ANALYSIS
FIGURE 9 EUROPE POWER OVER ETHERNET (POE) MARKET: MULTIVARIVATE MODELING
FIGURE 10 EUROPE POWER OVER ETHERNET (POE) MARKET: TYPE TIMELINE CURVE
FIGURE 11 EUROPE POWER OVER ETHERNET (POE) MARKET: END-USER COVERAGE GRID
FIGURE 12 EUROPE POWER OVER ETHERNET (POE) MARKET: SEGMENTATION
FIGURE 13 THREE SEGMENTS COMPRISE THE EUROPE POWER OVER ETHERNET (POE) MARKET, BY TYPE (2025)
FIGURE 14 EUROPE POWER OVER ETHERNET (POE) MARKET: EXECUTIVE SUMMARY
FIGURE 15 STRATEGIC DECISIONS
FIGURE 16 ACCELERATING DEPLOYMENT OF IP CAMERAS, WIRELESS ACCESS POINTS, VOIP PHONES, ACCESS CONTROL, AND IOT DEVICES IS EXPECTED TO DRIVE THE EUROPE POWER OVER ETHERNET (POE) MARKET DURING THE FORECAST PERIOD OF 2026 TO 2033
FIGURE 17 TYPE SEGMENT IS EXPECTED TO ACCOUNT FOR THE LARGEST SHARE OF THE EUROPE POWER OVER ETHERNET (POE) MARKET IN 2025 & 2033
FIGURE 18 DROC ANALYSIS
FIGURE 19 EUROPE POWER OVER ETHERNET (POE) MARKET, BY TYPE, 2025
FIGURE 20 EUROPE POWER OVER ETHERNET (POE) MARKET, BY CLASS TYPE, 2025
FIGURE 21 EUROPE POWER OVER ETHERNET (POE) MARKET, BY MODES, 2025
FIGURE 22 EUROPE POWER OVER ETHERNET (POE) MARKET, BY POWER RANGE, 2025
FIGURE 23 EUROPE POWER OVER ETHERNET (POE) MARKET, BY VOLTAGE RANGE, 2025
FIGURE 24 EUROPE POWER OVER ETHERNET (POE) MARKET, BY DEVICE TYPE, 2025
FIGURE 25 EUROPE POWER OVER ETHERNET (POE) MARKET, BY APPLICATION, 2025
FIGURE 26 EUROPE POWER OVER ETHERNET (POE) MARKET, BY END USER, 2025
FIGURE 27 EUROPE POWER OVER ETHERNET (POE) MARKET: COMPANY SHARE 2025 (%)
Europe Power Over Ethernet Poe Market, Supply Chain Analysis and Ecosystem Framework
To support market growth and help clients navigate the impact of geopolitical shifts, DBMR has integrated in-depth supply chain analysis into its Europe Power Over Ethernet Poe Market research reports. This addition empowers clients to respond effectively to global changes affecting their industries. The supply chain analysis section includes detailed insights such as Europe Power Over Ethernet Poe Market consumption and production by country, price trend analysis, the impact of tariffs and geopolitical developments, and import and export trends by country and HSN code. It also highlights major suppliers with data on production capacity and company profiles, as well as key importers and exporters. In addition to research, DBMR offers specialized supply chain consulting services backed by over a decade of experience, providing solutions like supplier discovery, supplier risk assessment, price trend analysis, impact evaluation of inflation and trade route changes, and comprehensive market trend analysis.
Research Methodology
Data collection and base year analysis are done using data collection modules with large sample sizes. The stage includes obtaining market information or related data through various sources and strategies. It includes examining and planning all the data acquired from the past in advance. It likewise envelops the examination of information inconsistencies seen across different information sources. The market data is analysed and estimated using market statistical and coherent models. Also, market share analysis and key trend analysis are the major success factors in the market report. To know more, please request an analyst call or drop down your inquiry.
The key research methodology used by DBMR research team is data triangulation which involves data mining, analysis of the impact of data variables on the market and primary (industry expert) validation. Data models include Vendor Positioning Grid, Market Time Line Analysis, Market Overview and Guide, Company Positioning Grid, Patent Analysis, Pricing Analysis, Company Market Share Analysis, Standards of Measurement, Global versus Regional and Vendor Share Analysis. To know more about the research methodology, drop in an inquiry to speak to our industry experts.
Customization Available
Data Bridge Market Research is a leader in advanced formative research. We take pride in servicing our existing and new customers with data and analysis that match and suits their goal. The report can be customized to include price trend analysis of target brands understanding the market for additional countries (ask for the list of countries), clinical trial results data, literature review, refurbished market and product base analysis. Market analysis of target competitors can be analyzed from technology-based analysis to market portfolio strategies. We can add as many competitors that you require data about in the format and data style you are looking for. Our team of analysts can also provide you data in crude raw excel files pivot tables (Fact book) or can assist you in creating presentations from the data sets available in the report.


