
Europe Virtual Reality Market Analysis and Size
Virtual reality has brought a new change to digitalization. It has become easier to experience the real world by setting different environmental conditions. Augmented reality & mixed reality has a wide range of applications. The market's growth increased as the use of augmented reality, and mixed reality became popular in driving simulators. The augmented reality and mixed reality provide the driver with a real sense of the road, driving conditions, car manuals, and road traffic that helps avoid accidents at an initial stage of learning and prepares the drivers for various situations. These attributes have also led to an increased usage of virtual reality in defense and aerospace. The army personnel used it for training in various conditions such as parachute jumping, submarine, combat situations, and driving in various environmental conditions.
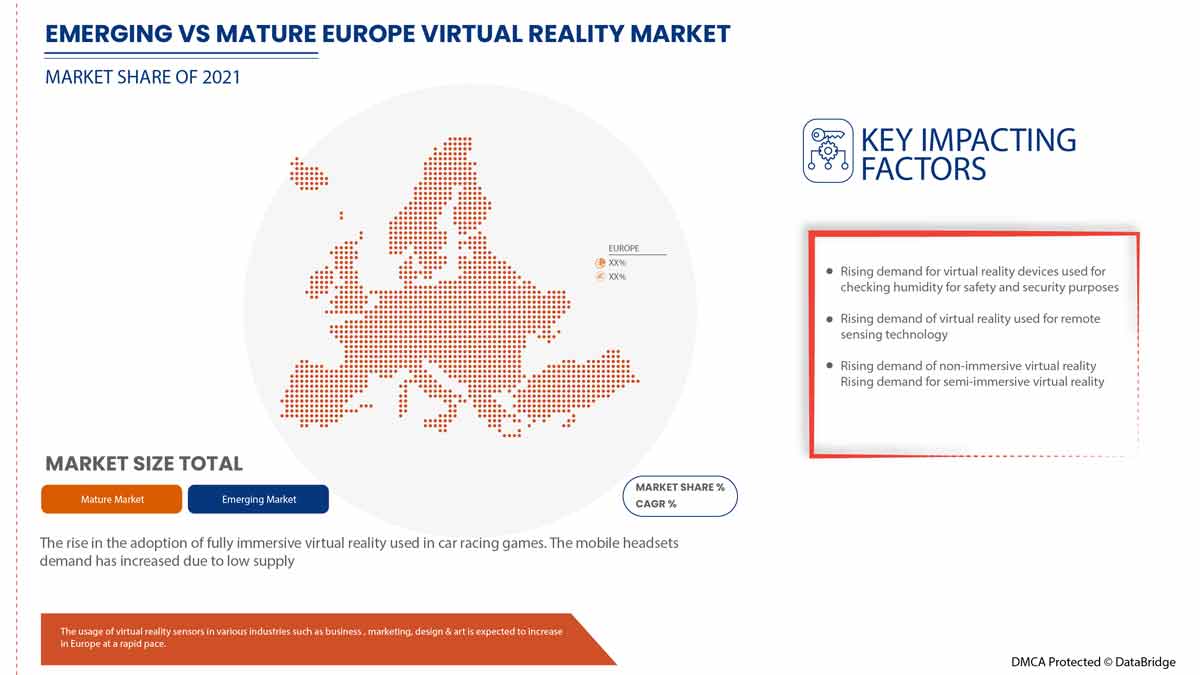
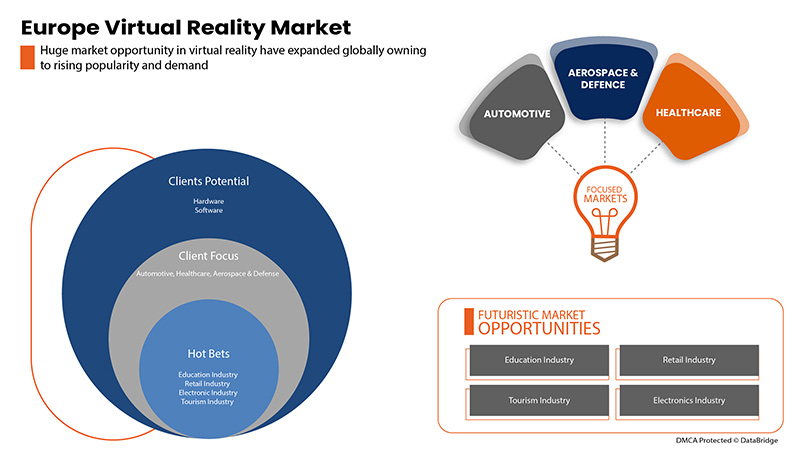
The growing demand for HMD in the gaming and entertainment industry is expected to be a major driver for the Europe virtual reality market. The lack of effective user experience design may restrain the market. Also, the increased deployment of VR technology in the aerospace & defense and architecture & planning sector may act as a major opportunity that helps in the market's growth. However, emerging risks and threats to data integrity may challenge the Europe virtual reality market.
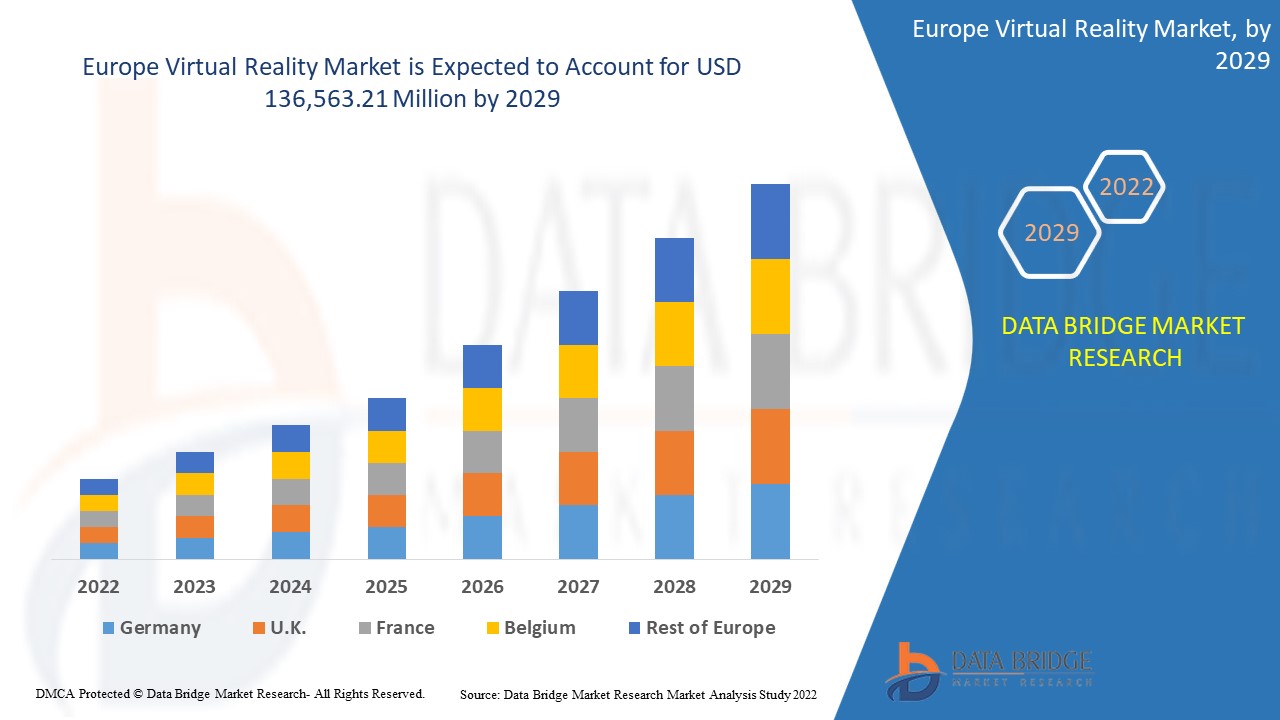
Data Bridge Market Research analyses that the Europe virtual reality market is expected to reach the value of USD 136,563.21 million by 2029, at a CAGR of 47.5% during the forecast period. The hardware segment accounts for the largest offering segment in the Europe virtual reality market. The Europe virtual reality market report also comprehensively covers pricing, patent, and technological advancements.
|
Report Metric |
Details |
|
Forecast Period |
2022 to 2029 |
|
Base Year |
2021 |
|
Historic Years |
2020 (Customizable to 2019-2014) |
|
Quantitative Units |
Revenue in USD Million, Pricing in USD |
|
Segments Covered |
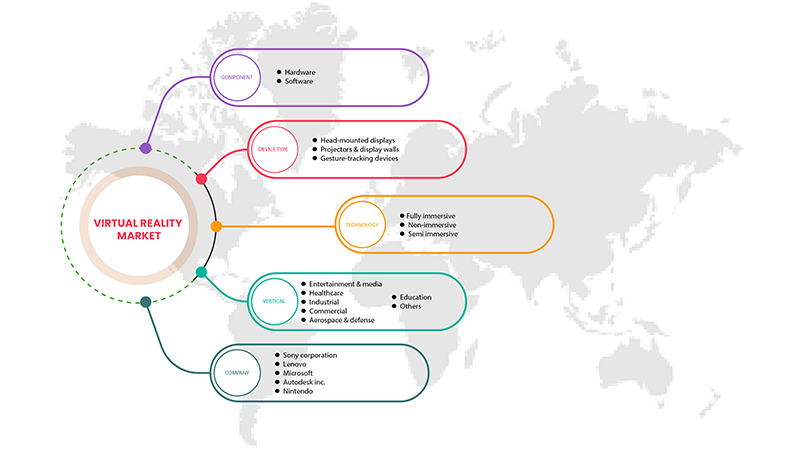
By Component (Hardware and Software), Device Type (Head-Mounted Displays, Projectors & Display Walls and Gesture-Tracking Devices), Technology (Fully Immersive, Non-Immersive and Semi Immersive), Vertical (Entertainment & Media, Healthcare, Industrial, Commercial, Aerospace & Defense, Automotive, Education and Others) |
|
Countries Covered |
Germany, U.K., France, Switzerland, Italy, Spain, Netherlands, Russia, Belgium, Turkey, Rest of Europe |
|
Market Players Covered |
Sony Corporation, Lenovo, Autodesk Inc., Nintendo, LG Electronics, HTC Corporation, Ultraleap, Google (A Subsidiary of Alphabet Inc.), Qualcomm Technologies, Inc., Barco, PSICO SMART APPS, S.L., HP Development Company, L.P., Microsoft, SAMSUNG ELECTRONICS CO., LTD., among others |
Market Definition
Virtual reality can be defined as a technology that creates a simulated environment through computer technology. Virtual reality provides an immersed 3D environment to the user by simulating various senses such as vision, touch, hearing, and even smell. Virtual reality uses devices such as head-mounted displays, projectors, and display walls to generate realistic visuals and sounds to provide a real-world experience in the virtual environment. The person using virtual reality can view the artificial world 360 degrees and even sense the virtual environment with highly advanced gears. This technology is being widely used in various industrial applications, especially for training and research purposes. The defense and aerospace industry uses it for training the army personnel by providing various environmental conditions, this aids in reducing the overall cost of the training. The gaming sector provides virtual reality directly to the users by enhancing their gaming experience; people are getting more accustomed to virtual reality through their experience in the gaming and entertainment industry. Virtual reality has also aided in driving simulators by providing a real-life experience in an artificial environment helping the users to adapt to the driving conditions and know how to react in various situations without actually taking the driving lessons directly on the road.
Europe Virtual Reality Market Dynamics
This section deals with understanding the market drivers, advantages, opportunities, restraints, and challenges. All of this is discussed in detail below:
Drivers
- Growing demand for HMD in the gaming and entertainment industry
Head-mounted displays (HMDs) have been high in the gaming and entertainment sector. The gaming industry has had a technological evolution with the emergence of VR and 3D technology. The use of HMDs has helped achieve a fully immersive experience for users and has taken the gaming experience to the next level. The flawless transition conducted with VR HMDs has helped bring a unique and enhanced user experience. HMDs have a high penetration rate in the video gaming sector, and video game users prefer them for enriching experiences and entertainment. HMDs project digital images, enabling a 3D view, which enhances the user experience. Therefore, the growing gaming sector would drive the market for HMDs and, in turn, virtual reality.
- Increasing demand for VR technology due to the COVID-19 pandemic
The world is going through different phases of physical lockdown, and social get-togethers are still not allowed in most countries. Hence, AR and VR Technology during COVID-19 are emerging as superheroes by enabling people to feel connected to each other. Augmented reality adds digital elements to the physical world, and Virtual Reality gives an immersive experience to the viewers. VR devices such as Google Cardboard, HTC Vive, or Oculus Rift transport users to experience several real-world and imaginary environments with the help of devices.
Opportunity
- Increased deployment of VR technology in aerospace & defense and architecture & planning sector
The 3D design has enabled significant gains in the aerospace and defense equipment manufacturing processes. This has also positively impacted both performances of the aircraft as well as the manufacturing processes. The advancements in new 3D technologies bring new market opportunities to optimize production time and cost in the aerospace and defense industry. 3D technology has been a continuous trend, specifically in the aerospace industry. Recent developments in virtual reality technology have promised new applications in the aerospace and defense domain, impacting the growth of virtual reality in the aerospace and defense market. 3D visualization abilities incorporated with digital mock-ups of physical objects, virtual assembly lines, tighter integration, and a seamless design process would drive the market shortly.
Restraint/Challenge
- Emerging risks and threats to data integrity
Virtual reality is being highly used for training and education purposes in defense and aerospace and is also used in telemedicine in the healthcare industry. Virtual reality uses computing technologies, cloud usage, and internet services to work, making it highly prone to cyber-attacks, threatening data integrity, and increasing the risk of data being leaked. Proper security and privacy are not being given much importance, posing a significant challenge for the Europe virtual reality market.
COVID-19 Impact on Europe Virtual Reality Market
COVID-19 significantly impacted various industries as almost every country has opted for the shutdown of every facility except those in the essential goods segment. The government has taken strict actions such as shutting facilities and selling non-essential goods, blocking international trade, and many more to prevent the spread of COVID-19. The only business dealing in this pandemic situation is the essential services allowed to open and run the processes.
The increased usage of virtual reality-based devices has provided significant opportunities amid the COVID-19 pandemic. Although consumer purchasing power has been greatly diminished due to the coronavirus-induced economic slump, resulting in the decline of profit margins in organizations. While many key marketers and leaders saw signs of improvement from past years, it remains difficult to ascertain the actual market situation as the pent-up demand may be covering up a lower intrinsic level of demand for VR-based devices. The increase in VR smartphone applications, the rise in demand for remote collaboration, and technological advancements in medical applications are some factors driving the Europe virtual reality market growth.
Manufacturers are making various strategic decisions to meet the growing demand in the COVID-19 period. The players were involved in strategic activities such as partnerships, collaborations, acquisitions, and others to improve the technology involved in the virtual reality market. The companies will bring advanced and accurate solutions to the market. In addition, the government initiatives to boost digitization across industries have led to the market's growth.
Recent Developments
- In April 2021, Microsoft announced a Pentagon contract with the U.S. military for augmented reality headgear for soldiers worth USD 21.88 billion. This HoloLens will deliver soldiers more efficient visibility, next-generation night vision, and situational awareness for any war. This has also helped the company to transcend the traditional boundaries of space and time in the field of AR, thereby expanding their products in the market
- In October 2019, Ultraleap Limited joined with Khronos Group, an industry consortium comprising 150 hardware-software provider companies. The new partnership integrated Ultraleap's hand tracking technology with the OpenXR for better specifications. The new partnership will increase the customer base of the company
Europe Virtual Reality Market Scope
Europe virtual reality market is segmented based on component, device type, technology, and vertical. The growth amongst these segments will help you analyse meagre growth segments in the industries and provide the users with a valuable market overview and market insights to help them make strategic decisions for identifying core market applications.
Component
- Hardware
- Software
On the basis of component, the Europe virtual reality market is segmented into hardware and software.
Device Type
- Head-Mounted Displays,
- Projectors & Display Walls
- Gesture-Tracking Devices
On the basis of device type, the Europe virtual reality market is segmented into head-mounted displays, projectors & display walls, and gesture-tracking devices.
Technology
- Fully Immersive,
- Semi Immersive
- Non-Immersive
On the basis of technology, the Europe virtual reality market is segmented into fully immersive, semi immersive, and non-immersive.
Vertical
- Automotive
- Aerospace & Defense
- Entertainment & Media
- Healthcare
- Education
- Industrial
- Commercial
- Others
On the basis of vertical, the Europe virtual reality market is segmented into automotive, aerospace & defense, entertainment & media, healthcare, education, industrial, commercial, and others.
Europe Virtual Reality Market Regional Analysis/Insights
The Europe virtual reality market is analysed, and market size insights and trends are provided by the country, component, device type, technology, and vertical, as referenced above.
Some countries covered in the Europe virtual reality market report are Germany, U.K., France, Switzerland, Italy, Spain, Netherlands, Russia, Belgium, Turkey, Rest of Europe.
Germany is expected to dominate the Europe virtual reality market owing to the continuously rising digital workplace and mobile workforce. Moreover, the U.K. has been extremely responsive towards adopting the latest technological advancements, including mobile devices, cloud computing, and IoT, within enterprises propelling the market growth.
The country section of the report also provides individual market impacting factors and changes in market regulation that impact the current and future trends of the market. Data points like downstream and upstream value chain analysis, technical trends, porter's five forces analysis, and case studies are some of the pointers used to forecast the market scenario for individual countries. Also, the presence and availability of European brands and their challenges faced due to large or scarce competition from local and domestic brands, the impact of domestic tariffs, and trade routes are considered while providing a forecast analysis of the country data.
Competitive Landscape and Europe Virtual Reality Market Share Analysis
Europe virtual reality market competitive landscape provides details about the competitor. Details included are company overview, company financials, revenue generated, market potential, investment in research and development, new market initiatives, Europe presence, production sites and facilities, production capacities, company strengths and weaknesses, product launch, product width and breadth, application dominance. The above data points provided are only related to the companies' focus related to Europe virtual reality market.
Some of the major players operating in the Europe virtual reality market are Sony Corporation, Lenovo, Autodesk Inc., Nintendo, LG Electronics, HTC Corporation, Ultraleap, Google (A Subsidiary of Alphabet Inc.), Qualcomm Technologies, Inc., Barco, PSICO SMART APPS, S.L., HP Development Company, L.P., Microsoft, SAMSUNG ELECTRONICS CO., LTD., among others.
SKU-

- Interactive Data Analysis Dashboard
- Company Analysis Dashboard for high growth potential opportunities
- Research Analyst Access for customization & queries
- Competitor Analysis with Interactive dashboard
- Latest News, Updates & Trend analysis
- Harness the Power of Benchmark Analysis for Comprehensive Competitor Tracking
Table of Content
1 INTRODUCTION
1.1 OBJECTIVES OF THE STUDY
1.2 MARKET DEFINITION
1.3 OVERVIEW OF THE EUROPE VIRTUAL REALITY MARKET
1.4 CURRENCY AND PRICING
1.5 LIMITATIONS
1.6 MARKETS COVERED
2 MARKET SEGMENTATION
2.1 MARKETS COVERED
2.2 GEOGRAPHICAL SCOPE
2.3 YEARS CONSIDERED FOR THE STUDY
2.4 DBMR TRIPOD DATA VALIDATION MODEL
2.5 PRIMARY INTERVIEWS WITH KEY OPINION LEADERS
2.6 DBMR MARKET POSITION GRID
2.7 VENDOR SHARE ANALYSIS
2.8 MULTIVARIATE MODELING
2.9 COMPONENT TIMELINE CURVE
2.1 MARKET VERTICAL COVERAGE GRID
2.11 SECONDARY SOURCES
2.12 ASSUMPTIONS
3 EXECUTIVE SUMMARY
4 PREMIUM INSIGHTS
5 MARKET TRENDS
6 LIST OF TOP COMPETITORS ACROSS THE GLOBE
7 REGULATION AND POLICY
8 REGIONAL SUMMARY
9 MARKET OVERVIEW
9.1 DRIVERS
9.1.1 GROWING DEMAND FOR HMD IN THE GAMING AND ENTERTAINMENT INDUSTRY
9.1.2 HIGH INVESTMENT IN VR MARKET
9.1.3 INCREASING DEMAND FOR VR TECHNOLOGY DUE TO COVID-19 PANDEMIC
9.1.4 AVAILABILITY OF AFFORDABLE VR DEVICES
9.1.5 INCREASING INTEREST OF LARGE TECHNOLOGY CORPORATIONS
9.1.6 INCREASE IN PENETRATION OF SMARTPHONES AND INTERNET SERVICES
9.2 RESTRAINTS
9.2.1 LACK OF EFFECTIVE IN-USER EXPERIENCE DESIGN
9.2.2 HEALTH CONCERNS AMONG THE USERS
9.2.3 EUROPE ECONOMIC SLOWDOWN
9.3 OPPORTUNITIES
9.3.1 INCREASED DEPLOYMENT OF VR TECHNOLOGY IN AEROSPACE & DEFENSE AND ARCHITECTURE & PLANNING SECTOR
9.3.2 INCREASED PENETRATION OF VR IN THE HEALTHCARE INDUSTRY
9.3.3 INCREASE IN VARIOUS STRATEGIC DECISIONS SUCH AS PARTNERSHIP AND ACQUISITION
9.3.4 DEVELOPMENT OF HARDWARE WITH FASTER PROCESSING SPEEDS
9.4 CHALLENGES
9.4.1 EMERGING RISKS AND THREATS TO DATA INTEGRITY
9.4.2 DEVELOPING USER-FRIENDLY VR SYSTEM
10 EUROPE VIRTUAL REALITY MARKET, BY COMPONENT
10.1 OVERVIEW
10.2 HARDWARE
10.2.1 DISPLAYS AND PROJECTORS
10.2.2 CONTROLLER AND PROCESSOR
10.2.3 POSITION TRACKERS
10.2.4 CAMERAS
10.2.5 OTHERS
10.3 SOFTWARE
10.3.1 VR CONTENT CREATION
10.3.2 SOFTWARE DEVELOPMENT KITS
10.3.3 CLOUD BASED SERVICES
11 EUROPE VIRTUAL REALITY MARKET, BY DEVICE TYPE
11.1 OVERVIEW
11.2 HEAD-MOUNTED DISPLAYS
11.3 PROJECTORS & DISPLAY WALLS
11.4 GESTURE-TRACKING DEVICES
12 EUROPE VIRTUAL REALITY MARKET, BY TECHNOLOGY
12.1 OVERVIEW
12.2 FULLY IMMERSIVE
12.3 NON-IMMERSIVE
12.4 SEMI IMMERSIVE
13 EUROPE VIRTUAL REALITY MARKET, BY VERTICAL
13.1 OVERVIEW
13.2 ENTERTAINMENT & MEDIA
13.2.1 ENTERTAINMENT & MEDIA, BY TECHNOLOGY
13.2.1.1 FULLY IMMERSIVE
13.2.1.2 NON-IMMERSIVE
13.2.1.3 SEMI IMMERSIVE
13.2.2 ENTERTAINMENT & MEDIA, BY APPLICATION
13.2.2.1 GAME
13.2.2.2 BROADCAST
13.2.2.3 ANIMATION
13.2.2.4 CHARACTER
13.2.2.5 CARTOON
13.2.2.6 MUSIC
13.2.2.7 FASHION
13.3 HEALTHCARE
13.3.1 HEALTHCARE, BY TYPE
13.3.1.1 SURGERY
13.3.1.2 PATIENT CARE MANAGEMENT
13.3.1.3 FITNESS MANAGEMENT
13.3.1.4 PHARMACY MANAGEMENT
13.3.2 HEALTHCARE, BY TECHNOLOGY
13.3.2.1 FULLY IMMERSIVE
13.3.2.2 NON-IMMERSIVE
13.3.2.3 SEMI IMMERSIVE
13.4 INDUSTRIAL
13.4.1 FULLY IMMERSIVE
13.4.2 NON-IMMERSIVE
13.4.3 SEMI IMMERSIVE
13.5 COMMERCIAL
13.5.1 COMMERCIAL, BY TYPE
13.5.1.1 RETAIL AND E-COMMERCE
13.5.1.2 TRAVEL AND TOURISM
13.5.1.3 ADVERTISING
13.5.2 COMMERCIAL, BY TECHNOLOGY
13.5.2.1 FULLY IMMERSIVE
13.5.2.2 NON-IMMERSIVE
13.5.2.3 SEMI IMMERSIVE
13.6 AEROSPACE & DEFENSE
13.6.1 SEMI IMMERSIVE
13.6.2 FULLY IMMERSIVE
13.6.3 NON-IMMERSIVE
13.7 AUTOMOTIVE
13.7.1 SEMI IMMERSIVE
13.7.2 FULLY IMMERSIVE
13.7.3 NON-IMMERSIVE
13.8 EDUCATION
13.8.1 FULLY IMMERSIVE
13.8.2 NON-IMMERSIVE
13.8.3 SEMI IMMERSIVE
13.9 OTHERS
14 EUROPE VIRTUAL REALITY MARKET, BY REGION
14.1 EUROPE
14.1.1 GERMANY
14.1.2 FRANCE
14.1.3 U.K.
14.1.4 ITALY
14.1.5 RUSSIA
14.1.6 SPAIN
14.1.7 NETHERLANDS
14.1.8 BELGIUM
14.1.9 SWITZERLAND
14.1.10 TURKEY
14.1.11 REST OF EUROPE
15 EUROPE VIRTUAL REALITY MARKET, COMPANY LANDSCAPE
15.1 COMPANY SHARE ANALYSIS: EUROPE
16 SWOT ANALYSIS
17 COMPANY PROFILE
17.1 SONY CORPORATION
17.1.1 COMPANY PROFILE
17.1.2 REVENUE ANALYSIS
17.1.3 COMPANY SHARE ANALYSIS
17.1.4 PRODUCT PORTFOLIO
17.1.5 RECENT DEVELOPMENTS
17.2 SAMSUNG ELECTRONICS CO., LTD.
17.2.1 COMPANY PROFILE
17.2.2 REVENUE ANALYSIS
17.2.3 COMPANY SHARE ANALYSIS
17.2.4 PRODUCT PORTFOLIO
17.2.5 RECENT DEVELOPMENTS
17.3 NINTENDO
17.3.1 COMPANY PROFILE
17.3.2 REVENUE ANALYSIS
17.3.3 COMPANY SHARE ANALYSIS
17.3.4 PRODUCT PORTFOLIO
17.3.5 RECENT DEVELOPMENTS
17.4 QUALCOMM TECHNOLOGIES, INC.
17.4.1 COMPANY PROFILE
17.4.2 REVENUE ANALYSIS
17.4.3 COMPANY SHARE ANALYSIS
17.4.4 PRODUCT PORTFOLIO
17.4.5 RECENT DEVELOPMENT
17.5 MICROSOFT
17.5.1 COMPANY PROFILE
17.5.2 REVENUE ANALYSIS
17.5.3 COMPANY SHARE ANALYSIS
17.5.4 PRODUCT PORTFOLIO
17.5.5 RECENT DEVELOPMENTS
17.6 AUTODESK INC.
17.6.1 COMPANY PROFILE
17.6.2 REVENUE ANALYSIS
17.6.3 PRODUCT PORTFOLIO
17.6.4 RECENT DEVELOPMENTS
17.7 BARCO
17.7.1 COMPANY PROFILE
17.7.2 REVENUE ANALYSIS
17.7.3 PRODUCT PORTFOLIO
17.7.4 RECENT DEVELOPMENTS
17.8 BHAPTICS INC.
17.8.1 COMPANY PROFILE
17.8.2 PRODUCT PORTFOLIO
17.8.3 RECENT DEVELOPMENT
17.9 FIRSTHAND TECHNOLOGY INC.
17.9.1 COMPANY PROFILE
17.9.2 PRODUCT PORTFOLIO
17.9.3 RECENT DEVELOPMENTS
17.1 FOVE, INC.
17.10.1 COMPANY PROFILE
17.10.2 PRODUCT PORTFOLIO
17.10.3 RECENT DEVELOPMENTS
17.11 FXGEAR INC.
17.11.1 COMPANY PROFILE
17.11.2 PRODUCT PORTFOLIO
17.11.3 RECENT DEVELOPMENT
17.12 GOOGLE (A SUBSIDIARY OF ALPHABET INC.)
17.12.1 COMPANY PROFILE
17.12.2 REVENUE ANALYSIS
17.12.3 PRODUCT PORTFOLIO
17.12.4 RECENT DEVELOPMENT
17.13 HP DEVELOPMENT COMPANY, L.P.
17.13.1 COMPANY PROFILE
17.13.2 REVENUE ANALYSIS
17.13.3 PRODUCT PORTFOLIO
17.13.4 RECENT DEVELOPMENTS
17.14 HTC CORPORATION
17.14.1 COMPANY PROFILE
17.14.2 REVENUE ANALYSIS
17.14.3 PRODUCT PORTFOLIO
17.14.4 RECENT DEVELOPMENTS
17.15 INNOSIMULATION
17.15.1 COMPANY PROFILE
17.15.2 PRODUCT PORTFOLIO
17.15.3 RECENT DEVELOPMENT
17.16 LENOVO
17.16.1 COMPANY PROFILE
17.16.2 REVENUE ANALYSIS
17.16.3 PRODUCT PORTFOLIO
17.16.4 RECENT DEVELOPMENT
17.17 LG ELECTRONICS
17.17.1 COMPANY PROFILE
17.17.2 REVENUE ANALYSIS
17.17.3 PRODUCT PORTFOLIO
17.17.4 RECENT DEVELOPMENTS
17.18 NOVINT
17.18.1 COMPANY PROFILE
17.18.2 PRODUCT PORTFOLIO
17.18.3 RECENT DEVELOPMENT
17.19 PSICO SMART APPS, S.L.
17.19.1 COMPANY PROFILE
17.19.2 PRODUCT PORTFOLIO
17.19.3 RECENT DEVELOPMENTS
17.2 SIXENSE ENTERPRISES INC.
17.20.1 COMPANY PROFILE
17.20.2 PRODUCT PORTFOLIO
17.20.3 RECENT DEVELOPMENTS
17.21 SKONEC ENTERTAINMENT CO., LTD.
17.21.1 COMPANY PROFILE
17.21.2 PRODUCT PORTFOLIO
17.21.3 RECENT DEVELOPMENTS
17.22 STARVR CORP
17.22.1 COMPANY PROFILE
17.22.2 PRODUCT PORTFOLIO
17.22.3 RECENT DEVELOPMENTS
17.23 ULTRALEAP LIMITED
17.23.1 COMPANY PROFILE
17.23.2 PRODUCT PORTFOLIO
17.23.3 RECENT DEVELOPMENTS
17.24 VIRTUIX
17.24.1 COMPANY PROFILE
17.24.2 PRODUCT PORTFOLIO
17.24.3 RECENT DEVELOPMENT
17.25 WORLDVIZ, INC.
17.25.1 COMPANY PROFILE
17.25.2 PRODUCT PORTFOLIO
17.25.3 RECENT DEVELOPMENTS
18 QUESTIONNAIRE
19 RELATED REPORTS
List of Table
TABLE 1 EUROPE VIRTUAL REALITY MARKET, BY COMPONENT, 2020-2029 (USD MILLION)
TABLE 2 EUROPE HARDWARE IN VIRTUAL REALITY MARKET, BY REGION, 2020-2029 (USD MILLION)
TABLE 3 EUROPE HARDWARE IN VIRTUAL REALITY MARKET, BY COMPONENT, 2020-2029 (USD MILLION)
TABLE 4 EUROPE SOFTWARE IN VIRTUAL REALITY MARKET, BY REGION, 2020-2029 (USD MILLION)
TABLE 5 EUROPE SOFTWARE IN VIRTUAL REALITY MARKET, BY COMPONENT, 2020-2029 (USD MILLION)
TABLE 6 EUROPE VIRTUAL REALITY MARKET, BY DEVICE TYPE, 2020-2029 (USD MILLION)
TABLE 7 EUROPE HEAD-MOUNTED DISPLAYS IN VIRTUAL REALITY MARKET, BY REGION, 2020-2029 (USD MILLION)
TABLE 8 EUROPE PROJECTORS & DISPLAY WALLS IN VIRTUAL REALITY MARKET, BY REGION, 2020-2029 (USD MILLION)
TABLE 9 EUROPE GESTURE-TRACKING DEVICES IN VIRTUAL REALITY MARKET, BY REGION, 2020-2029 (USD MILLION)
TABLE 10 EUROPE VIRTUAL REALITY MARKET, BY TECHNOLOGY, 2020-2029 (USD MILLION)
TABLE 11 EUROPE FULLY IMMERSIVE IN VIRTUAL REALITY MARKET, BY REGION, 2020-2029 (USD MILLION)
TABLE 12 EUROPE NON-IMMERSIVE IN VIRTUAL REALITY MARKET, BY REGION, 2020-2029 (USD MILLION)
TABLE 13 EUROPE SEMI IMMERSIVE IN VIRTUAL REALITY MARKET, BY REGION, 2020-2029 (USD MILLION)
TABLE 14 EUROPE VIRTUAL REALITY MARKET, BY VERTICAL, 2020-2029 (USD MILLION)
TABLE 15 EUROPE ENTERTAINMENT & MEDIA IN VIRTUAL REALITY MARKET, BY REGION, 2020-2029 (USD MILLION)
TABLE 16 EUROPE ENTERTAINMENT & MEDIA IN VIRTUAL REALITY MARKET, BY TECHNOLOGY, 2020-2029 (USD MILLION)
TABLE 17 EUROPE ENTERTAINMENT & MEDIA IN VIRTUAL REALITY MARKET, BY APPLICATION, 2020-2029 (USD MILLION)
TABLE 18 EUROPE HEALTHCARE IN VIRTUAL REALITY MARKET, BY REGION, 2020-2029 (USD MILLION)
TABLE 19 EUROPE HEALTHCARE IN VIRTUAL REALITY MARKET, BY TYPE, 2020-2029 (USD MILLION)
TABLE 20 EUROPE HEALTHCARE IN VIRTUAL REALITY MARKET, BY TECHNOLOGY, 2020-2029 (USD MILLION)
TABLE 21 EUROPE INDUSTRIAL IN VIRTUAL REALITY MARKET, BY REGION, 2020-2029 (USD MILLION)
TABLE 22 EUROPE INDUSTRIAL IN VIRTUAL REALITY MARKET, BY TECHNOLOGY, 2020-2029 (USD MILLION)
TABLE 23 EUROPE COMMERCIAL IN VIRTUAL REALITY MARKET, BY REGION, 2020-2029 (USD MILLION)
TABLE 24 EUROPE COMMERCIAL IN VIRTUAL REALITY MARKET, BY TYPE, 2020-2029 (USD MILLION)
TABLE 25 EUROPE COMMERCIAL IN VIRTUAL REALITY MARKET, BY TECHNOLOGY, 2020-2029 (USD MILLION)
TABLE 26 EUROPE AEROSPACE & DEFENSE IN VIRTUAL REALITY MARKET, BY REGION, 2020-2029 (USD MILLION)
TABLE 27 EUROPE AEROSPACE AND DEFENSE IN VIRTUAL REALITY MARKET, BY TECHNOLOGY, 2020-2029 (USD MILLION)
TABLE 28 EUROPE AUTOMOTIVE IN VIRTUAL REALITY MARKET, BY REGION, 2020-2029 (USD MILLION)
TABLE 29 EUROPE AUTOMOTIVE IN VIRTUAL REALITY MARKET, BY TECHNOLOGY, 2020-2029 (USD MILLION)
TABLE 30 EUROPE EDUCATION IN VIRTUAL REALITY MARKET, BY REGION, 2020-2029 (USD MILLION)
TABLE 31 EUROPE EDUCATION IN VIRTUAL REALITY MARKET, BY TECHNOLOGY, 2020-2029 (USD MILLION)
TABLE 32 EUROPE OTHERS IN VIRTUAL REALITY MARKET, BY REGION, 2020-2029 (USD MILLION)
TABLE 33 EUROPE VIRTUAL REALITY MARKET, BY COUNTRY, 2020-2029 (USD MILLION)
TABLE 34 EUROPE VIRTUAL REALITY MARKET, BY COMPONENT, 2020-2029 (USD MILLION)
TABLE 35 EUROPE HARDWARE IN VIRTUAL REALITY MARKET, BY COMPONENT, 2020-2029 (USD MILLION)
TABLE 36 EUROPE SOFTWARE IN VIRTUAL REALITY MARKET, BY COMPONENT, 2020-2029 (USD MILLION)
TABLE 37 EUROPE VIRTUAL REALITY MARKET, BY DEVICE TYPE, 2020-2029 (USD MILLION)
TABLE 38 EUROPE VIRTUAL REALITY MARKET, BY TECHNOLOGY, 2020-2029 (USD MILLION)
TABLE 39 EUROPE VIRTUAL REALITY MARKET, BY VERTICAL, 2020-2029 (USD MILLION)
TABLE 40 EUROPE ENTERTAINMENT & MEDIA IN VIRTUAL REALITY MARKET, BY TECHNOLOGY, 2020-2029 (USD MILLION)
TABLE 41 EUROPE ENTERTAINMENT & MEDIA IN VIRTUAL REALITY MARKET, BY APPLICATION, 2020-2029 (USD MILLION)
TABLE 42 EUROPE HEALTHCARE IN VIRTUAL REALITY MARKET, BY TYPE, 2020-2029 (USD MILLION)
TABLE 43 EUROPE HEALTHCARE IN VIRTUAL REALITY MARKET, BY TECHNOLOGY, 2020-2029 (USD MILLION)
TABLE 44 EUROPE INDUSTRIAL IN VIRTUAL REALITY MARKET, BY TECHNOLOGY, 2020-2029 (USD MILLION)
TABLE 45 EUROPE COMMERCIAL IN VIRTUAL REALITY MARKET, BY TYPE, 2020-2029 (USD MILLION)
TABLE 46 EUROPE COMMERCIAL IN VIRTUAL REALITY MARKET, BY TECHNOLOGY, 2022-2029 (USD MILLION)
TABLE 47 EUROPE AEROSPACE & DEFENSE IN VIRTUAL REALITY MARKET, BY TECHNOLOGY, 2020-2029 (USD MILLION)
TABLE 48 EUROPE AUTOMOTIVE IN VIRTUAL REALITY MARKET, BY TECHNOLOGY, 2020-2029 (USD MILLION)
TABLE 49 EUROPE EDUCATION IN VIRTUAL REALITY MARKET, BY TECHNOLOGY, 2020-2029 (USD MILLION)
TABLE 50 GERMANY VIRTUAL REALITY MARKET, BY COMPONENT, 2020-2029 (USD MILLION)
TABLE 51 GERMANY HARDWARE IN VIRTUAL REALITY MARKET, BY COMPONENT, 2020-2029 (USD MILLION)
TABLE 52 GERMANY SOFTWARE IN VIRTUAL REALITY MARKET, BY COMPONENT, 2020-2029 (USD MILLION)
TABLE 53 GERMANY VIRTUAL REALITY MARKET, BY DEVICE TYPE, 2020-2029 (USD MILLION)
TABLE 54 GERMANY VIRTUAL REALITY MARKET, BY TECHNOLOGY, 2020-2029 (USD MILLION)
TABLE 55 GERMANY VIRTUAL REALITY MARKET, BY VERTICAL, 2020-2029 (USD MILLION)
TABLE 56 GERMANY ENTERTAINMENT & MEDIA IN VIRTUAL REALITY MARKET, BY APPLICATION, 2020-2029 (USD MILLION)
TABLE 57 GERMANY ENTERTAINMENT & MEDIA IN VIRTUAL REALITY MARKET, BY TECHNOLOGY, 2020-2029 (USD MILLION)
TABLE 58 GERMANY HEALTHCARE IN VIRTUAL REALITY MARKET, BY TYPE, 2020-2029 (USD MILLION)
TABLE 59 GERMANY HEALTHCARE IN VIRTUAL REALITY MARKET, BY TECHNOLOGY, 2020-2029 (USD MILLION)
TABLE 60 GERMANY INDUSTRIAL IN VIRTUAL REALITY MARKET, BY TECHNOLOGY, 2020-2029 (USD MILLION)
TABLE 61 GERMANY COMMERCIAL IN VIRTUAL REALITY MARKET, BY TYPE, 2020-2029 (USD MILLION)
TABLE 62 GERMANY COMMERCIAL IN VIRTUAL REALITY MARKET, BY TECHNOLOGY, 2022-2029 (USD MILLION)
TABLE 63 GERMANY AEROSPACE & DEFENSE IN VIRTUAL REALITY MARKET, BY TECHNOLOGY, 2020-2029 (USD MILLION)
TABLE 64 GERMANY AUTOMOTIVE IN VIRTUAL REALITY MARKET, BY TECHNOLOGY, 2020-2029 (USD MILLION)
TABLE 65 GERMANY EDUCATION IN VIRTUAL REALITY MARKET, BY TECHNOLOGY, 2020-2029 (USD MILLION)
TABLE 66 FRANCE VIRTUAL REALITY MARKET, BY COMPONENT, 2020-2029 (USD MILLION)
TABLE 67 FRANCE HARDWARE IN VIRTUAL REALITY MARKET, BY COMPONENT, 2020-2029 (USD MILLION)
TABLE 68 FRANCE SOFTWARE IN VIRTUAL REALITY MARKET, BY COMPONENT, 2020-2029 (USD MILLION)
TABLE 69 FRANCE VIRTUAL REALITY MARKET, BY DEVICE TYPE, 2020-2029 (USD MILLION)
TABLE 70 FRANCE VIRTUAL REALITY MARKET, BY TECHNOLOGY, 2020-2029 (USD MILLION)
TABLE 71 FRANCE VIRTUAL REALITY MARKET, BY VERTICAL, 2020-2029 (USD MILLION)
TABLE 72 FRANCE ENTERTAINMENT & MEDIA IN VIRTUAL REALITY MARKET, BY APPLICATION, 2020-2029 (USD MILLION)
TABLE 73 FRANCE ENTERTAINMENT & MEDIA IN VIRTUAL REALITY MARKET, BY TECHNOLOGY, 2020-2029 (USD MILLION)
TABLE 74 FRANCE HEALTHCARE IN VIRTUAL REALITY MARKET, BY TYPE, 2020-2029 (USD MILLION)
TABLE 75 FRANCE HEALTHCARE IN VIRTUAL REALITY MARKET, BY TECHNOLOGY, 2020-2029 (USD MILLION)
TABLE 76 FRANCE INDUSTRIAL IN VIRTUAL REALITY MARKET, BY TECHNOLOGY, 2020-2029 (USD MILLION)
TABLE 77 FRANCE COMMERCIAL IN VIRTUAL REALITY MARKET, BY TYPE, 2020-2029 (USD MILLION)
TABLE 78 FRANCE COMMERCIAL IN VIRTUAL REALITY MARKET, BY TECHNOLOGY, 2022-2029 (USD MILLION)
TABLE 79 FRANCE AEROSPACE & DEFENSE IN VIRTUAL REALITY MARKET, BY TECHNOLOGY, 2020-2029 (USD MILLION)
TABLE 80 FRANCE AUTOMOTIVE IN VIRTUAL REALITY MARKET, BY TECHNOLOGY, 2020-2029 (USD MILLION)
TABLE 81 FRANCE EDUCATION IN VIRTUAL REALITY MARKET, BY TECHNOLOGY, 2020-2029 (USD MILLION)
TABLE 82 U.K. VIRTUAL REALITY MARKET, BY COMPONENT, 2020-2029 (USD MILLION)
TABLE 83 U.K. HARDWARE IN VIRTUAL REALITY MARKET, BY COMPONENT, 2020-2029 (USD MILLION)
TABLE 84 U.K. SOFTWARE IN VIRTUAL REALITY MARKET, BY COMPONENT, 2020-2029 (USD MILLION)
TABLE 85 U.K. VIRTUAL REALITY MARKET, BY DEVICE TYPE, 2020-2029 (USD MILLION)
TABLE 86 U.K. VIRTUAL REALITY MARKET, BY TECHNOLOGY, 2020-2029 (USD MILLION)
TABLE 87 U.K. VIRTUAL REALITY MARKET, BY VERTICAL, 2020-2029 (USD MILLION)
TABLE 88 U.K. ENTERTAINMENT & MEDIA IN VIRTUAL REALITY MARKET, BY APPLICATION, 2020-2029 (USD MILLION)
TABLE 89 U.K. ENTERTAINMENT & MEDIA IN VIRTUAL REALITY MARKET, BY TECHNOLOGY, 2020-2029 (USD MILLION)
TABLE 90 U.K. HEALTHCARE IN VIRTUAL REALITY MARKET, BY TYPE, 2020-2029 (USD MILLION)
TABLE 91 U.K. HEALTHCARE IN VIRTUAL REALITY MARKET, BY TECHNOLOGY, 2020-2029 (USD MILLION)
TABLE 92 U.K. INDUSTRIAL IN VIRTUAL REALITY MARKET, BY TECHNOLOGY, 2020-2029 (USD MILLION)
TABLE 93 U.K. COMMERCIAL IN VIRTUAL REALITY MARKET, BY TYPE, 2020-2029 (USD MILLION)
TABLE 94 U.K. COMMERCIAL IN VIRTUAL REALITY MARKET, BY TECHNOLOGY, 2022-2029 (USD MILLION)
TABLE 95 U.K. AEROSPACE & DEFENSE IN VIRTUAL REALITY MARKET, BY TECHNOLOGY, 2020-2029 (USD MILLION)
TABLE 96 U.K. AUTOMOTIVE IN VIRTUAL REALITY MARKET, BY TECHNOLOGY, 2020-2029 (USD MILLION)
TABLE 97 U.K. EDUCATION IN VIRTUAL REALITY MARKET, BY TECHNOLOGY, 2020-2029 (USD MILLION)
TABLE 98 ITALY VIRTUAL REALITY MARKET, BY COMPONENT, 2020-2029 (USD MILLION)
TABLE 99 ITALY HARDWARE IN VIRTUAL REALITY MARKET, BY COMPONENT, 2020-2029 (USD MILLION)
TABLE 100 ITALY SOFTWARE IN VIRTUAL REALITY MARKET, BY COMPONENT, 2020-2029 (USD MILLION)
TABLE 101 ITALY VIRTUAL REALITY MARKET, BY DEVICE TYPE, 2020-2029 (USD MILLION)
TABLE 102 ITALY VIRTUAL REALITY MARKET, BY TECHNOLOGY, 2020-2029 (USD MILLION)
TABLE 103 ITALY VIRTUAL REALITY MARKET, BY VERTICAL, 2020-2029 (USD MILLION)
TABLE 104 ITALY ENTERTAINMENT & MEDIA IN VIRTUAL REALITY MARKET, BY APPLICATION, 2020-2029 (USD MILLION)
TABLE 105 ITALY ENTERTAINMENT & MEDIA IN VIRTUAL REALITY MARKET, BY TECHNOLOGY, 2020-2029 (USD MILLION)
TABLE 106 ITALY HEALTHCARE IN VIRTUAL REALITY MARKET, BY TYPE, 2020-2029 (USD MILLION)
TABLE 107 ITALY HEALTHCARE IN VIRTUAL REALITY MARKET, BY TECHNOLOGY, 2020-2029 (USD MILLION)
TABLE 108 ITALY INDUSTRIAL IN VIRTUAL REALITY MARKET, BY TECHNOLOGY, 2020-2029 (USD MILLION)
TABLE 109 ITALY COMMERCIAL IN VIRTUAL REALITY MARKET, BY TYPE, 2020-2029 (USD MILLION)
TABLE 110 ITALY COMMERCIAL IN VIRTUAL REALITY MARKET, BY TECHNOLOGY, 2022-2029 (USD MILLION)
TABLE 111 ITALY AEROSPACE & DEFENSE IN VIRTUAL REALITY MARKET, BY TECHNOLOGY, 2020-2029 (USD MILLION)
TABLE 112 ITALY AUTOMOTIVE IN VIRTUAL REALITY MARKET, BY TECHNOLOGY, 2020-2029 (USD MILLION)
TABLE 113 ITALY EDUCATION IN VIRTUAL REALITY MARKET, BY TECHNOLOGY, 2020-2029 (USD MILLION)
TABLE 114 RUSSIA VIRTUAL REALITY MARKET, BY COMPONENT, 2020-2029 (USD MILLION)
TABLE 115 RUSSIA HARDWARE IN VIRTUAL REALITY MARKET, BY COMPONENT, 2020-2029 (USD MILLION)
TABLE 116 RUSSIA SOFTWARE IN VIRTUAL REALITY MARKET, BY COMPONENT, 2020-2029 (USD MILLION)
TABLE 117 RUSSIA VIRTUAL REALITY MARKET, BY DEVICE TYPE, 2020-2029 (USD MILLION)
TABLE 118 RUSSIA VIRTUAL REALITY MARKET, BY TECHNOLOGY, 2020-2029 (USD MILLION)
TABLE 119 RUSSIA VIRTUAL REALITY MARKET, BY VERTICAL, 2020-2029 (USD MILLION)
TABLE 120 RUSSIA ENTERTAINMENT & MEDIA IN VIRTUAL REALITY MARKET, BY APPLICATION, 2020-2029 (USD MILLION)
TABLE 121 RUSSIA ENTERTAINMENT & MEDIA IN VIRTUAL REALITY MARKET, BY TECHNOLOGY, 2020-2029 (USD MILLION)
TABLE 122 RUSSIA HEALTHCARE IN VIRTUAL REALITY MARKET, BY TYPE, 2020-2029 (USD MILLION)
TABLE 123 RUSSIA HEALTHCARE IN VIRTUAL REALITY MARKET, BY TECHNOLOGY, 2020-2029 (USD MILLION)
TABLE 124 RUSSIA INDUSTRIAL IN VIRTUAL REALITY MARKET, BY TECHNOLOGY, 2020-2029 (USD MILLION)
TABLE 125 RUSSIA COMMERCIAL IN VIRTUAL REALITY MARKET, BY TYPE, 2020-2029 (USD MILLION)
TABLE 126 RUSSIA COMMERCIAL IN VIRTUAL REALITY MARKET, BY TECHNOLOGY, 2022-2029 (USD MILLION)
TABLE 127 RUSSIA AEROSPACE & DEFENSE IN VIRTUAL REALITY MARKET, BY TECHNOLOGY, 2020-2029 (USD MILLION)
TABLE 128 RUSSIA AUTOMOTIVE IN VIRTUAL REALITY MARKET, BY TECHNOLOGY, 2020-2029 (USD MILLION)
TABLE 129 RUSSIA EDUCATION IN VIRTUAL REALITY MARKET, BY TECHNOLOGY, 2020-2029 (USD MILLION)
TABLE 130 SPAIN VIRTUAL REALITY MARKET, BY COMPONENT, 2020-2029 (USD MILLION)
TABLE 131 SPAIN HARDWARE IN VIRTUAL REALITY MARKET, BY COMPONENT, 2020-2029 (USD MILLION)
TABLE 132 SPAIN SOFTWARE IN VIRTUAL REALITY MARKET, BY COMPONENT, 2020-2029 (USD MILLION)
TABLE 133 SPAIN VIRTUAL REALITY MARKET, BY DEVICE TYPE, 2020-2029 (USD MILLION)
TABLE 134 SPAIN VIRTUAL REALITY MARKET, BY TECHNOLOGY, 2020-2029 (USD MILLION)
TABLE 135 SPAIN VIRTUAL REALITY MARKET, BY VERTICAL, 2020-2029 (USD MILLION)
TABLE 136 SPAIN ENTERTAINMENT & MEDIA IN VIRTUAL REALITY MARKET, BY APPLICATION, 2020-2029 (USD MILLION)
TABLE 137 SPAIN ENTERTAINMENT & MEDIA IN VIRTUAL REALITY MARKET, BY TECHNOLOGY, 2020-2029 (USD MILLION)
TABLE 138 SPAIN HEALTHCARE IN VIRTUAL REALITY MARKET, BY TYPE, 2020-2029 (USD MILLION)
TABLE 139 SPAIN HEALTHCARE IN VIRTUAL REALITY MARKET, BY TECHNOLOGY, 2020-2029 (USD MILLION)
TABLE 140 SPAIN INDUSTRIAL IN VIRTUAL REALITY MARKET, BY TECHNOLOGY, 2020-2029 (USD MILLION)
TABLE 141 SPAIN COMMERCIAL IN VIRTUAL REALITY MARKET, BY TYPE, 2020-2029 (USD MILLION)
TABLE 142 SPAIN COMMERCIAL IN VIRTUAL REALITY MARKET, BY TECHNOLOGY, 2022-2029 (USD MILLION)
TABLE 143 SPAIN AEROSPACE & DEFENSE IN VIRTUAL REALITY MARKET, BY TECHNOLOGY, 2020-2029 (USD MILLION)
TABLE 144 SPAIN AUTOMOTIVE IN VIRTUAL REALITY MARKET, BY TECHNOLOGY, 2020-2029 (USD MILLION)
TABLE 145 SPAIN EDUCATION IN VIRTUAL REALITY MARKET, BY TECHNOLOGY, 2020-2029 (USD MILLION)
TABLE 146 NETHERLANDS VIRTUAL REALITY MARKET, BY COMPONENT, 2020-2029 (USD MILLION)
TABLE 147 NETHERLANDS HARDWARE IN VIRTUAL REALITY MARKET, BY COMPONENT, 2020-2029 (USD MILLION)
TABLE 148 NETHERLANDS SOFTWARE IN VIRTUAL REALITY MARKET, BY COMPONENT, 2020-2029 (USD MILLION)
TABLE 149 NETHERLANDS VIRTUAL REALITY MARKET, BY DEVICE TYPE, 2020-2029 (USD MILLION)
TABLE 150 NETHERLANDS VIRTUAL REALITY MARKET, BY TECHNOLOGY, 2020-2029 (USD MILLION)
TABLE 151 NETHERLANDS VIRTUAL REALITY MARKET, BY VERTICAL, 2020-2029 (USD MILLION)
TABLE 152 NETHERLANDS ENTERTAINMENT & MEDIA IN VIRTUAL REALITY MARKET, BY APPLICATION, 2020-2029 (USD MILLION)
TABLE 153 NETHERLANDS ENTERTAINMENT & MEDIA IN VIRTUAL REALITY MARKET, BY TECHNOLOGY, 2020-2029 (USD MILLION)
TABLE 154 NETHERLANDS HEALTHCARE IN VIRTUAL REALITY MARKET, BY TYPE, 2020-2029 (USD MILLION)
TABLE 155 NETHERLANDS HEALTHCARE IN VIRTUAL REALITY MARKET, BY TECHNOLOGY, 2020-2029 (USD MILLION)
TABLE 156 NETHERLANDS INDUSTRIAL IN VIRTUAL REALITY MARKET, BY TECHNOLOGY, 2020-2029 (USD MILLION)
TABLE 157 NETHERLANDS COMMERCIAL IN VIRTUAL REALITY MARKET, BY TYPE, 2020-2029 (USD MILLION)
TABLE 158 NETHERLANDS COMMERCIAL IN VIRTUAL REALITY MARKET, BY TECHNOLOGY, 2022-2029 (USD MILLION)
TABLE 159 NETHERLANDS AEROSPACE & DEFENSE IN VIRTUAL REALITY MARKET, BY TECHNOLOGY, 2020-2029 (USD MILLION)
TABLE 160 NETHERLANDS AUTOMOTIVE IN VIRTUAL REALITY MARKET, BY TECHNOLOGY, 2020-2029 (USD MILLION)
TABLE 161 NETHERLANDS EDUCATION IN VIRTUAL REALITY MARKET, BY TECHNOLOGY, 2020-2029 (USD MILLION)
TABLE 162 BELGIUM VIRTUAL REALITY MARKET, BY COMPONENT, 2020-2029 (USD MILLION)
TABLE 163 BELGIUM HARDWARE IN VIRTUAL REALITY MARKET, BY COMPONENT, 2020-2029 (USD MILLION)
TABLE 164 BELGIUM SOFTWARE IN VIRTUAL REALITY MARKET, BY COMPONENT, 2020-2029 (USD MILLION)
TABLE 165 BELGIUM VIRTUAL REALITY MARKET, BY DEVICE TYPE, 2020-2029 (USD MILLION)
TABLE 166 BELGIUM VIRTUAL REALITY MARKET, BY TECHNOLOGY, 2020-2029 (USD MILLION)
TABLE 167 BELGIUM VIRTUAL REALITY MARKET, BY VERTICAL, 2020-2029 (USD MILLION)
TABLE 168 BELGIUM ENTERTAINMENT & MEDIA IN VIRTUAL REALITY MARKET, BY APPLICATION, 2020-2029 (USD MILLION)
TABLE 169 BELGIUM ENTERTAINMENT & MEDIA IN VIRTUAL REALITY MARKET, BY TECHNOLOGY, 2020-2029 (USD MILLION)
TABLE 170 BELGIUM HEALTHCARE IN VIRTUAL REALITY MARKET, BY TYPE, 2020-2029 (USD MILLION)
TABLE 171 BELGIUM HEALTHCARE IN VIRTUAL REALITY MARKET, BY TECHNOLOGY, 2020-2029 (USD MILLION)
TABLE 172 BELGIUM INDUSTRIAL IN VIRTUAL REALITY MARKET, BY TECHNOLOGY, 2020-2029 (USD MILLION)
TABLE 173 BELGIUM COMMERCIAL IN VIRTUAL REALITY MARKET, BY TYPE, 2020-2029 (USD MILLION)
TABLE 174 BELGIUM COMMERCIAL IN VIRTUAL REALITY MARKET, BY TECHNOLOGY, 2022-2029 (USD MILLION)
TABLE 175 BELGIUM AEROSPACE & DEFENSE IN VIRTUAL REALITY MARKET, BY TECHNOLOGY, 2020-2029 (USD MILLION)
TABLE 176 BELGIUM AUTOMOTIVE IN VIRTUAL REALITY MARKET, BY TECHNOLOGY, 2020-2029 (USD MILLION)
TABLE 177 BELGIUM EDUCATION IN VIRTUAL REALITY MARKET, BY TECHNOLOGY, 2020-2029 (USD MILLION)
TABLE 178 SWITZERLAND VIRTUAL REALITY MARKET, BY COMPONENT, 2020-2029 (USD MILLION)
TABLE 179 SWITZERLAND HARDWARE IN VIRTUAL REALITY MARKET, BY COMPONENT, 2020-2029 (USD MILLION)
TABLE 180 SWITZERLAND SOFTWARE IN VIRTUAL REALITY MARKET, BY COMPONENT, 2020-2029 (USD MILLION)
TABLE 181 SWITZERLAND VIRTUAL REALITY MARKET, BY DEVICE TYPE, 2020-2029 (USD MILLION)
TABLE 182 SWITZERLAND VIRTUAL REALITY MARKET, BY TECHNOLOGY, 2020-2029 (USD MILLION)
TABLE 183 SWITZERLAND VIRTUAL REALITY MARKET, BY VERTICAL, 2020-2029 (USD MILLION)
TABLE 184 SWITZERLAND ENTERTAINMENT & MEDIA IN VIRTUAL REALITY MARKET, BY APPLICATION, 2020-2029 (USD MILLION)
TABLE 185 SWITZERLAND ENTERTAINMENT & MEDIA IN VIRTUAL REALITY MARKET, BY TECHNOLOGY, 2020-2029 (USD MILLION)
TABLE 186 SWITZERLAND HEALTHCARE IN VIRTUAL REALITY MARKET, BY TYPE, 2020-2029 (USD MILLION)
TABLE 187 SWITZERLAND HEALTHCARE IN VIRTUAL REALITY MARKET, BY TECHNOLOGY, 2020-2029 (USD MILLION)
TABLE 188 SWITZERLAND INDUSTRIAL IN VIRTUAL REALITY MARKET, BY TECHNOLOGY, 2020-2029 (USD MILLION)
TABLE 189 SWITZERLAND COMMERCIAL IN VIRTUAL REALITY MARKET, BY TYPE, 2020-2029 (USD MILLION)
TABLE 190 SWITZERLAND COMMERCIAL IN VIRTUAL REALITY MARKET, BY TECHNOLOGY, 2022-2029 (USD MILLION)
TABLE 191 SWITZERLAND AEROSPACE & DEFENSE IN VIRTUAL REALITY MARKET, BY TECHNOLOGY, 2020-2029 (USD MILLION)
TABLE 192 SWITZERLAND AUTOMOTIVE IN VIRTUAL REALITY MARKET, BY TECHNOLOGY, 2020-2029 (USD MILLION)
TABLE 193 SWITZERLAND EDUCATION IN VIRTUAL REALITY MARKET, BY TECHNOLOGY, 2020-2029 (USD MILLION)
TABLE 194 TURKEY VIRTUAL REALITY MARKET, BY COMPONENT, 2020-2029 (USD MILLION)
TABLE 195 TURKEY HARDWARE IN VIRTUAL REALITY MARKET, BY COMPONENT, 2020-2029 (USD MILLION)
TABLE 196 TURKEY SOFTWARE IN VIRTUAL REALITY MARKET, BY COMPONENT, 2020-2029 (USD MILLION)
TABLE 197 TURKEY VIRTUAL REALITY MARKET, BY DEVICE TYPE, 2020-2029 (USD MILLION)
TABLE 198 TURKEY VIRTUAL REALITY MARKET, BY TECHNOLOGY, 2020-2029 (USD MILLION)
TABLE 199 TURKEY VIRTUAL REALITY MARKET, BY VERTICAL, 2020-2029 (USD MILLION)
TABLE 200 TURKEY ENTERTAINMENT & MEDIA IN VIRTUAL REALITY MARKET, BY APPLICATION, 2020-2029 (USD MILLION)
TABLE 201 TURKEY ENTERTAINMENT & MEDIA IN VIRTUAL REALITY MARKET, BY TECHNOLOGY, 2020-2029 (USD MILLION)
TABLE 202 TURKEY HEALTHCARE IN VIRTUAL REALITY MARKET, BY TYPE, 2020-2029 (USD MILLION)
TABLE 203 TURKEY HEALTHCARE IN VIRTUAL REALITY MARKET, BY TECHNOLOGY, 2020-2029 (USD MILLION)
TABLE 204 TURKEY INDUSTRIAL IN VIRTUAL REALITY MARKET, BY TECHNOLOGY, 2020-2029 (USD MILLION)
TABLE 205 TURKEY COMMERCIAL IN VIRTUAL REALITY MARKET, BY TYPE, 2020-2029 (USD MILLION)
TABLE 206 TURKEY COMMERCIAL IN VIRTUAL REALITY MARKET, BY TECHNOLOGY, 2022-2029 (USD MILLION)
TABLE 207 TURKEY AEROSPACE & DEFENSE IN VIRTUAL REALITY MARKET, BY TECHNOLOGY, 2020-2029 (USD MILLION)
TABLE 208 TURKEY AUTOMOTIVE IN VIRTUAL REALITY MARKET, BY TECHNOLOGY, 2020-2029 (USD MILLION)
TABLE 209 TURKEY EDUCATION IN VIRTUAL REALITY MARKET, BY TECHNOLOGY, 2020-2029 (USD MILLION)
TABLE 210 REST OF EUROPE VIRTUAL REALITY MARKET, BY COMPONENT, 2020-2029 (USD MILLION)
List of Figure
FIGURE 1 EUROPE VIRTUAL REALITY MARKET: SEGMENTATION
FIGURE 2 EUROPE VIRTUAL REALITY MARKET: DATA TRIANGULATION
FIGURE 3 EUROPE VIRTUAL REALITY MARKET: DROC ANALYSIS
FIGURE 4 EUROPE VIRTUAL REALITY MARKET: EUROPE VS REGIONAL MARKET ANALYSIS
FIGURE 5 EUROPE VIRTUAL REALITY MARKET: COMPANY RESEARCH ANALYSIS
FIGURE 6 EUROPE VIRTUAL REALITY MARKET: INTERVIEW DEMOGRAPHICS
FIGURE 7 EUROPE VIRTUAL REALITY MARKET: DBMR MARKET POSITION GRID
FIGURE 8 EUROPE VIRTUAL REALITY MARKET: VENDOR SHARE ANALYSIS
FIGURE 9 EUROPE VIRTUAL REALITY MARKET: MARKET VERTICAL COVERAGE GRID
FIGURE 10 EUROPE VIRTUAL REALITY MARKET: SEGMENTATION
FIGURE 11 GROWING DEMAND FOR HMD IN THE GAMING AND ENTERTAINMENT INDUSTRY IS EXPECTED TO DRIVE THE EUROPE VIRTUAL REALITY MARKET GROWTH IN THE FORECAST PERIOD OF 2022 TO 2029
FIGURE 12 HARDWARE SEGMENT IS EXPECTED TO ACCOUNT FOR THE LARGEST SHARE OF EUROPE VIRTUAL REALITY MARKET IN 2022 & 2029
FIGURE 13 ASIA-PACIFIC IS EXPECTED TO DOMINATE THE VIRTUAL REALITY MARKET AND GROW WITH THE FASTEST GROWTH RATE IN THE FORECAST PERIOD OF 2022 TO 2029
FIGURE 14 THE ABOVE FIGURE SHOWS THE POTENTIAL OF VIRTUAL REALITY APPLICATIONS BY CATEGORY.
FIGURE 15 DRIVERS, RESTRAINTS, OPPORTUNITIES, AND CHALLENGES OF THE EUROPE VIRTUAL REALITY MARKET
FIGURE 16 EUROPE VIRTUAL REALITY MARKET ESTIMATION (2016-2021)
FIGURE 17 EUROPE VIRTUAL REALITY MARKET: BY COMPONENT, 2021
FIGURE 18 EUROPE VIRTUAL REALITY MARKET: BY DEVICE TYPE, 2021
FIGURE 19 EUROPE VIRTUAL REALITY MARKET: BY TECHNOLOGY, 2021
FIGURE 20 EUROPE VIRTUAL REALITY MARKET: BY VERTICAL, 2021
FIGURE 21 EUROPE VIRTUAL REALITY MARKET: SNAPSHOT (2021)
FIGURE 22 EUROPE VIRTUAL REALITY MARKET: BY COUNTRY (2021)
FIGURE 23 EUROPE VIRTUAL REALITY MARKET: BY COUNTRY (2022 & 2029)
FIGURE 24 EUROPE VIRTUAL REALITY MARKET: BY COUNTRY (2021 & 2029)
FIGURE 25 EUROPE VIRTUAL REALITY MARKET: BY COMPONENT (2022-2029)
FIGURE 26 EUROPE VIRTUAL REALITY MARKET: COMPANY SHARE 2021 (%)
Data collection and base year analysis are done using data collection modules with large sample sizes. The stage includes obtaining market information or related data through various sources and strategies. It includes examining and planning all the data acquired from the past in advance. It likewise envelops the examination of information inconsistencies seen across different information sources. The market data is analysed and estimated using market statistical and coherent models. Also, market share analysis and key trend analysis are the major success factors in the market report. To know more, please request an analyst call or drop down your inquiry.
The key research methodology used by DBMR research team is data triangulation which involves data mining, analysis of the impact of data variables on the market and primary (industry expert) validation. Data models include Vendor Positioning Grid, Market Time Line Analysis, Market Overview and Guide, Company Positioning Grid, Patent Analysis, Pricing Analysis, Company Market Share Analysis, Standards of Measurement, Global versus Regional and Vendor Share Analysis. To know more about the research methodology, drop in an inquiry to speak to our industry experts.
Data Bridge Market Research is a leader in advanced formative research. We take pride in servicing our existing and new customers with data and analysis that match and suits their goal. The report can be customized to include price trend analysis of target brands understanding the market for additional countries (ask for the list of countries), clinical trial results data, literature review, refurbished market and product base analysis. Market analysis of target competitors can be analyzed from technology-based analysis to market portfolio strategies. We can add as many competitors that you require data about in the format and data style you are looking for. Our team of analysts can also provide you data in crude raw excel files pivot tables (Fact book) or can assist you in creating presentations from the data sets available in the report.


