
Europe Wearable Devices In Sports Market
Market Size in USD Billion
 USD
7.89 Billion
USD
25.51 Billion
2025
2033
USD
7.89 Billion
USD
25.51 Billion
2025
2033
| 2026 - 2033 | |
| USD 7.89 Billion | |
| USD 25.51 Billion | |
| % | |
|
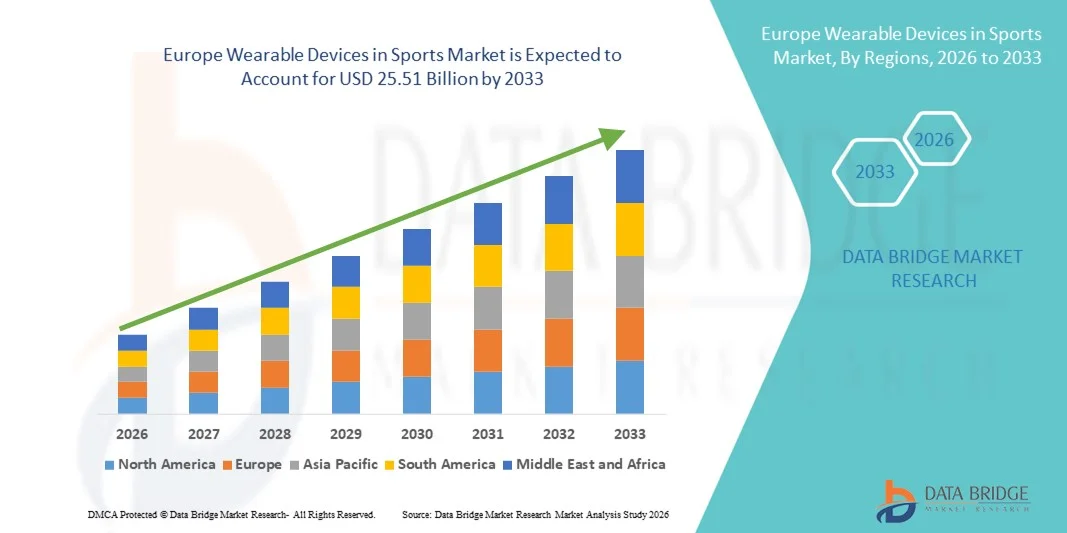
Europe Wearable Devices in Sports Market Size
- The Europe wearable devices in sports market size was valued at USD 7.89 billion in 2025 and is expected to reach USD 25.51 billion by 2033, at a CAGR of 15.8% during the forecast period
- The market growth is primarily driven by the rising adoption of advanced sports technologies, increasing focus on athlete performance optimization, and the growing integration of AI-enabled sensors, real-time analytics, and connected fitness ecosystems across professional and recreational sports
- Moreover, increasing awareness around health monitoring, injury prevention, and data-driven training, along with strong demand from sports teams, fitness enthusiasts, and institutions, is positioning wearable sports devices as essential performance management tools. These combined factors are accelerating market penetration across Europe, thereby significantly strengthening overall market growth
Europe Wearable Devices in Sports Market Analysis
- Wearable devices in sports, comprising sensor-enabled hardware and software platforms, are increasingly embedded in Europe’s professional and recreational sports ecosystem as they enable real-time performance tracking, physiological monitoring, and data-driven training optimization
- The market demand is primarily driven by rising focus on athlete performance enhancement, growing awareness of fitness and health tracking, and increasing adoption of connected sports technologies across sports clubs, academies, and individual users
- Germany dominated the Europe wearable devices in sports market with a revenue share of 27.8% in 2025, supported by strong adoption across professional sports organizations and fitness consumers, driven by advanced sports infrastructure, high penetration of wearable hardware, and robust investment in sports analytics software
- The U.K. is expected to be the fastest growing country in the Europe wearable devices in sports market during the forecast period, driven by increasing participation in organized sports, rising consumer spending on fitness technologies, and expanding use of wearable devices across amateur and professional sports
- Fitness & heart rate monitors segment dominated the Europe wearable devices in sports market with a market share of 41.6% in 2025, owing to their widespread usage across arm & wrist and handheld sites for applications such as heart rate monitoring, step counts, and calorie burnt tracking
Report Scope and Europe Wearable Devices in Sports Market Segmentation
|
Attributes |
Europe Wearable Devices in Sports Key Market Insights |
|
Segments Covered |
|
|
Countries Covered |
Europe
|
|
Key Market Players |
|
|
Market Opportunities |
|
|
Value Added Data Infosets |
In addition to the insights on market scenarios such as market value, growth rate, segmentation, geographical coverage, and major players, the market reports curated by the Data Bridge Market Research also include in-depth expert analysis, patient epidemiology, pipeline analysis, pricing analysis, and regulatory framework |
Europe Wearable Devices in Sports Market Trends
AI-Driven Performance Analytics and Connected Sports Ecosystems
- A significant and accelerating trend in the Europe wearable devices in sports market is the growing integration of artificial intelligence (AI), advanced sensors, and connected software platforms to deliver real-time performance insights, predictive analytics, and personalized training recommendations for athletes
- For instance, Catapult Sports’ wearable performance solutions are widely used by European football clubs to track player workload, movement patterns, and fatigue levels, while Playermaker foot-worn sensors are increasingly adopted to analyze biomechanics and on-ball performance
- AI integration in sports wearables enables features such as automated performance benchmarking, early injury risk detection through movement asymmetry analysis, and adaptive training feedback based on historical and real-time data. For instance, fitness & heart rate monitors increasingly leverage AI to detect abnormal heart rate patterns and provide actionable recovery insights to athletes and coaches
- The seamless integration of wearable hardware with cloud-based software platforms and mobile applications allows centralized access to performance metrics across multiple devices. Through unified dashboards, users can monitor heart rate, step counts, calorie burnt, and sleep tracking alongside training loads, creating a cohesive digital sports ecosystem
- This trend toward intelligent, data-centric, and interconnected sports wearables is reshaping expectations around athletic training and fitness management. Consequently, companies such as Polar and Garmin are continuously enhancing AI-enabled analytics, sensor accuracy, and software interoperability across their European product portfolios
- The demand for AI-powered and software-integrated sports wearables is growing rapidly across professional sports organizations, fitness centers, and individual athletes, as users increasingly prioritize performance optimization, injury prevention, and data-driven decision-making
- The convergence of wearable sports devices with subscription-based software platforms and data analytics services is gaining traction, allowing vendors to generate recurring revenues while delivering continuous performance insights to users
Europe Wearable Devices in Sports Market Dynamics
Driver
Rising Focus on Performance Optimization and Health Monitoring
- The increasing emphasis on athletic performance optimization, injury prevention, and continuous health monitoring among professional athletes and fitness-conscious consumers is a key driver of demand for wearable devices in sports across Europe
- For instance, in March 2025, several European football clubs expanded their use of wearable fitness & heart rate monitors during training sessions to better manage player workloads and reduce injury risks through data-backed decisions
- As awareness around sports science and personalized training grows, wearable devices offer critical capabilities such as heart rate monitoring, step counts, calorie burnt analysis, and sleep tracking, making them essential tools for both elite and amateur athletes
- Furthermore, the growing participation in organized sports, fitness programs, and wellness initiatives across Europe is accelerating adoption of wearable hardware supported by intuitive software platforms and mobile applications
- The ability to track performance metrics across multiple sites such as arm & wrist, shoe sensors, and handheld devices, combined with user-friendly interfaces, is driving adoption among sports clubs, academies, and individual users. The increasing availability of affordable and multifunctional wearable products further supports market expansion
- Rising investments by professional sports leagues, training academies, and national sports bodies in performance monitoring technologies are further strengthening demand for advanced wearable devices
- Growing penetration of smartphones and connected devices across Europe is supporting seamless integration of wearable hardware with mobile applications, enhancing accessibility and user engagement
Restraint/Challenge
Data Privacy Concerns and Device Accuracy Limitations
- Concerns related to data privacy, cybersecurity, and compliance with stringent European regulations such as GDPR present a major challenge to the widespread adoption of wearable devices in sports, as these devices continuously collect sensitive health and performance data
- For instance, reports highlighting vulnerabilities in connected wearable ecosystems have raised concerns among users regarding unauthorized data access and misuse of personal health information
- Addressing these concerns through secure data encryption, transparent data usage policies, and regulatory compliance is critical for maintaining user trust. Companies such as Garmin and Polar emphasize secure data storage, user consent controls, and compliance with European data protection standards to mitigate these risks. In addition, limitations related to sensor accuracy and data consistency across different product types and usage conditions can impact user confidence, particularly in professional sports settings where precision is essential
- While technological improvements are ongoing, variations in data accuracy across smart fabrics, shot trackers, and fitness & heart rate monitors can still hinder adoption among high-performance users who require reliable metrics
- Overcoming these challenges through enhanced data security frameworks, continuous sensor calibration improvements, and user education on proper device usage will be essential for sustaining long-term growth in the Europe wearable devices in sports market
- High initial costs associated with advanced wearable hardware and analytics software can restrict adoption among amateur athletes and smaller sports organizations
- Interoperability challenges between devices from different manufacturers and software platforms can limit seamless data integration, reducing overall user experience
Europe Wearable Devices in Sports Market Scope
The market is segmented on the basis of component, product type, site, application, end user, and distribution channel.
- By Component
On the basis of component, the Europe wearable devices in sports market is segmented into hardware and software. The hardware segment dominated the market with the largest revenue share in 2025, driven by high demand for physical devices such as fitness & heart rate monitors, pedometers, smart fabrics, and shoe sensors across professional and recreational sports. Hardware components form the foundation of wearable sports technology, enabling real-time data collection related to movement, biometrics, and physiological performance. Strong adoption by sports centers, fitness clubs, and individual athletes, coupled with continuous advancements in sensor accuracy, durability, and battery efficiency, has reinforced hardware dominance. In addition, increasing participation in organized sports and fitness activities across Europe has sustained strong sales volumes of wearable hardware devices.
The software segment is expected to witness the fastest growth rate during the forecast period, driven by rising adoption of data analytics platforms, AI-enabled performance insights, and cloud-based sports monitoring solutions. Software plays a critical role in interpreting raw data collected by wearable hardware, transforming it into actionable insights for performance optimization, injury prevention, and recovery management. Growing demand from professional sports teams for centralized dashboards, predictive analytics, and subscription-based analytics models is accelerating software adoption. Furthermore, increased smartphone penetration and integration with mobile applications are supporting rapid software market expansion across Europe.
- By Product Type
On the basis of product type, the market is segmented into pedometers, fitness & heart rate monitors, smart fabrics, smart camera, shot trackers, and others. The fitness & heart rate monitors segment dominated the market in 2025 with a market share of 41.6%, owing to their widespread adoption across both professional athletes and fitness-conscious consumers. These devices offer multifunctional capabilities such as heart rate monitoring, step counts, calorie burnt tracking, and sleep analysis, making them highly versatile for various sports and training regimens. Their availability across multiple sites such as arm & wrist and handheld positions further enhances usability. Continuous improvements in biometric accuracy, comfort, and connectivity with mobile applications have reinforced their leading market position.
The smart fabrics segment is projected to register the fastest growth during the forecast period, driven by increasing interest in advanced biomechanical monitoring and injury prevention. Smart fabrics embedded with sensors allow continuous and unobtrusive tracking of muscle activity, posture, and movement efficiency, making them particularly attractive for elite athletes and professional sports teams. Growing adoption in football, athletics, and endurance sports, along with advancements in textile-based sensor technologies, is accelerating market growth. In addition, rising R&D investments by European sports technology companies are supporting commercialization of smart fabric solutions.
- By Site
On the basis of site, the market is segmented into headband, handheld, arm & wrist, clip, shoe sensor, and others. The arm & wrist segment held the largest market share in 2025, driven by the dominance of wrist-worn fitness & heart rate monitors and pedometers. Arm & wrist placement offers ease of use, continuous monitoring, and high user comfort, making it suitable for both casual fitness tracking and professional sports applications. These devices are widely accepted due to their ergonomic design, user-friendly interfaces, and seamless integration with smartphones. High adoption across fitness centers, homecare settings, and sports clubs has reinforced segment dominance.
The shoe sensor segment is expected to witness the fastest growth rate during the forecast period, supported by rising demand for detailed gait analysis, biomechanics assessment, and performance tracking. Shoe-mounted sensors provide precise data on foot movement, balance, speed, and impact forces, which are critical for sports such as football, running, and basketball. Increasing adoption by professional athletes and sports academies seeking advanced performance insights is fueling growth. Technological advancements improving sensor miniaturization and accuracy are further accelerating adoption.
- By Application
On the basis of application, the market is segmented into step counts, calorie burnt, heart rate monitoring, sleep tracking, and others. The heart rate monitoring segment dominated the market in 2025, driven by its critical role in performance optimization, endurance training, and health monitoring. Continuous heart rate tracking helps athletes and fitness users manage training intensity, prevent overexertion, and monitor recovery. High reliability and clinical relevance of heart rate data have made this application essential across professional sports and recreational fitness. Integration with software analytics platforms further enhances its importance in data-driven training programs.
The sleep tracking segment is anticipated to grow at the fastest rate during the forecast period, owing to rising awareness of recovery, rest, and overall athletic well-being. Sleep quality has become a key performance metric, particularly among elite athletes and fitness enthusiasts. Wearable devices offering advanced sleep stage analysis and recovery insights are gaining traction across Europe. Growing emphasis on holistic performance management and mental health is further supporting rapid adoption of sleep tracking applications.
- By End User
On the basis of end user, the market is segmented into sports centers, fitness centers, homecare settings, and others. The fitness centers segment dominated the market in 2025, supported by widespread deployment of wearable devices for member engagement, performance tracking, and personalized training programs. Fitness centers increasingly leverage wearable technologies to enhance customer experience and retention. High participation rates in gym-based fitness activities across Europe have sustained strong demand. Integration of wearables with fitness management software further supports segment leadership.
The homecare settings segment is expected to witness the fastest growth during the forecast period, driven by increasing adoption of wearable devices by individual consumers for personal fitness and health monitoring. Rising preference for home-based workouts and digital fitness solutions is accelerating wearable usage in homecare environments. Easy availability of wearable devices through online channels and mobile app integration supports this growth. In addition, growing health consciousness among aging populations is contributing to segment expansion.
- By Distribution Channel
On the basis of distribution channel, the market is segmented into independent retail store, hypermarket/supermarket, brand store, and online sale channel. The online sale channel dominated the market in 2025, driven by convenience, wider product availability, competitive pricing, and access to detailed product information. Consumers increasingly prefer online platforms for purchasing wearable devices due to easy comparison, customer reviews, and home delivery options. Strong presence of brand-owned websites and e-commerce platforms has reinforced dominance. Promotional offers and subscription bundling further enhance online sales performance.
The brand store segment is projected to grow at the fastest rate during the forecast period, supported by increasing emphasis on brand experience, product demonstrations, and personalized customer support. Brand stores allow consumers to interact directly with devices, improving purchase confidence. Expansion of flagship stores by major wearable device manufacturers across European cities is driving growth. In addition, after-sales services and software onboarding offered through brand stores are enhancing customer loyalty.
Europe Wearable Devices in Sports Market Regional Analysis
- Germany dominated the Europe wearable devices in sports market with a revenue share of 27.8% in 2025, supported by strong adoption across professional sports organizations and fitness consumers, driven by advanced sports infrastructure, high penetration of wearable hardware, and robust investment in sports analytics software
- Consumers and sports organizations in Germany place high value on performance optimization, health monitoring, and data-driven training insights enabled by wearable devices, including fitness & heart rate monitors, smart fabrics, and shoe sensors
- This widespread adoption is further supported by advanced sports infrastructure, high penetration of connected devices and smartphones, and sustained investments by sports clubs, fitness centers, and sports institutions, establishing Germany as the leading market for wearable devices in sports across Europe
The Germany Wearable Devices in Sports Market Insight
The Germany wearable devices in sports market dominated Europe with the largest revenue share in 2025, driven by strong sports participation, high fitness awareness, and early adoption of advanced performance monitoring technologies. German sports organizations and fitness consumers increasingly prioritize data accuracy, performance optimization, and health monitoring through wearable devices. The country’s well-developed sports infrastructure and strong penetration of connected devices further support adoption. Integration of wearable hardware with analytics software platforms is particularly strong across professional sports teams and fitness centers.
U.K. Wearable Devices in Sports Market Insight
The U.K. wearable devices in sports market is anticipated to grow at a noteworthy CAGR during the forecast period, fueled by increasing participation in organized sports and rising health and fitness awareness. Consumers and sports clubs in the U.K. are rapidly adopting fitness & heart rate monitors to support performance tracking and injury prevention. The country’s advanced digital infrastructure and high smartphone penetration enable seamless integration of wearable devices with mobile applications. Strong demand from fitness centers and home fitness users continues to stimulate market growth.
France Wearable Devices in Sports Market Insight
The France wearable devices in sports market is expanding steadily, supported by growing interest in sports analytics, fitness tracking, and athlete performance management. Rising participation in recreational sports and government initiatives promoting physical activity are driving wearable adoption. French consumers increasingly value wearable devices for monitoring heart rate, calorie burnt, and sleep patterns. Adoption across sports centers and fitness facilities, combined with increasing availability of connected wearables, is contributing to sustained market growth.
Poland Wearable Devices in Sports Market Insight
The Poland wearable devices in sports market is expected to register the fastest CAGR in Europe during the forecast period, driven by rapid growth in fitness culture, increasing disposable incomes, and rising adoption of affordable wearable technologies. Expanding participation in organized sports and gym memberships is accelerating demand for fitness & heart rate monitors. Strong growth of e-commerce and mobile-based fitness applications is enhancing accessibility. In addition, increasing health awareness among younger consumers is positioning Poland as a high-growth market for wearable sports devices.
Europe Wearable Devices in Sports Market Share
The Europe Wearable Devices in Sports industry is primarily led by well-established companies, including:
- Sports Impact Technologies (Ireland)
- Suunto (Finland)
- Polar Electro (Finland)
- OnTracx, BV (Netherlands)
- Wearable Technologies AG (Germany)
- Garmin Ltd (Switzerland)
- Amazfit (Netherlands)
- Withings (France)
- TAG Heuer (Switzerland)
- Montblanc (Germany)
- Zepp Health (Netherlands)
- Fitbit (U.K.)
- Apple Inc. (Ireland)
- Samsung Electronics (Netherlands)
- Acer (Italy)
- Polar Flow (Finland)
- Coros (France)
- Sigma Sport GmbH (Germany)
- Bryton Europe (Italy)
What are the Recent Developments in Europe Wearable Devices in Sports Market?
- In September 2025, Polar re-launched its Loop activity-tracking wristband in a redesigned, subscription-free wearable that emphasizes 24/7 tracking of heart rate, activity, sleep, and recovery positioned to compete directly with devices such as Whoop in European fitness markets
- In August 2025, Dublin-based Sports Impact Technologies secured €650K in pre-seed funding to advance development of a behind-the-ear wearable sensor that detects head impacts in real time, aiming to improve player safety and concussion detection across multiple sports
- In July 2025, hDrop entered the European market through a partnership with Spanish club RCD Espanyol, bringing its advanced wearable sweat and hydration biosensor technology to professional and amateur athletes across Europe to optimize hydration and performance in real time
- In June 2025, Meta partnered with Oakley to launch AI-powered smart glasses that include high-resolution hands-free cameras and wearable AI functionality, with preorders opening in several European countries, marking expanding wearable tech offerings for sports, outdoor, and fitness use cases
- In September 2023, Playermaker’s wearable performance tracking device was awarded FIFA Quality Programme certification, allowing its foot-mounted tracking sensors to be used in official match play and providing teams with approved, lower-limb performance data for tactical and physical analysis
SKU-

- Interactive Data Analysis Dashboard
- Company Analysis Dashboard for high growth potential opportunities
- Research Analyst Access for customization & queries
- Competitor Analysis with Interactive dashboard
- Latest News, Updates & Trend analysis
- Harness the Power of Benchmark Analysis for Comprehensive Competitor Tracking
Data collection and base year analysis are done using data collection modules with large sample sizes. The stage includes obtaining market information or related data through various sources and strategies. It includes examining and planning all the data acquired from the past in advance. It likewise envelops the examination of information inconsistencies seen across different information sources. The market data is analysed and estimated using market statistical and coherent models. Also, market share analysis and key trend analysis are the major success factors in the market report. To know more, please request an analyst call or drop down your inquiry.
The key research methodology used by DBMR research team is data triangulation which involves data mining, analysis of the impact of data variables on the market and primary (industry expert) validation. Data models include Vendor Positioning Grid, Market Time Line Analysis, Market Overview and Guide, Company Positioning Grid, Patent Analysis, Pricing Analysis, Company Market Share Analysis, Standards of Measurement, Global versus Regional and Vendor Share Analysis. To know more about the research methodology, drop in an inquiry to speak to our industry experts.
Data Bridge Market Research is a leader in advanced formative research. We take pride in servicing our existing and new customers with data and analysis that match and suits their goal. The report can be customized to include price trend analysis of target brands understanding the market for additional countries (ask for the list of countries), clinical trial results data, literature review, refurbished market and product base analysis. Market analysis of target competitors can be analyzed from technology-based analysis to market portfolio strategies. We can add as many competitors that you require data about in the format and data style you are looking for. Our team of analysts can also provide you data in crude raw excel files pivot tables (Fact book) or can assist you in creating presentations from the data sets available in the report.


