
Market Analysis and Size
Companies in the agricultural tractor market are conducting data-driven research before investing in new manufacturing technologies, as many people's financial situations have been strained as a result of the coronavirus crisis. Although India offers lucrative incremental opportunities for agricultural tractors companies, farmers are slow to adopt new technologies such as driverless tractors. Nonetheless, this trend is changing as an increasing number of non-governmental organisations (NGOs) empower the agricultural sector, increasing farmers' acceptance of smart agricultural tractors, machinery, and other equipment.
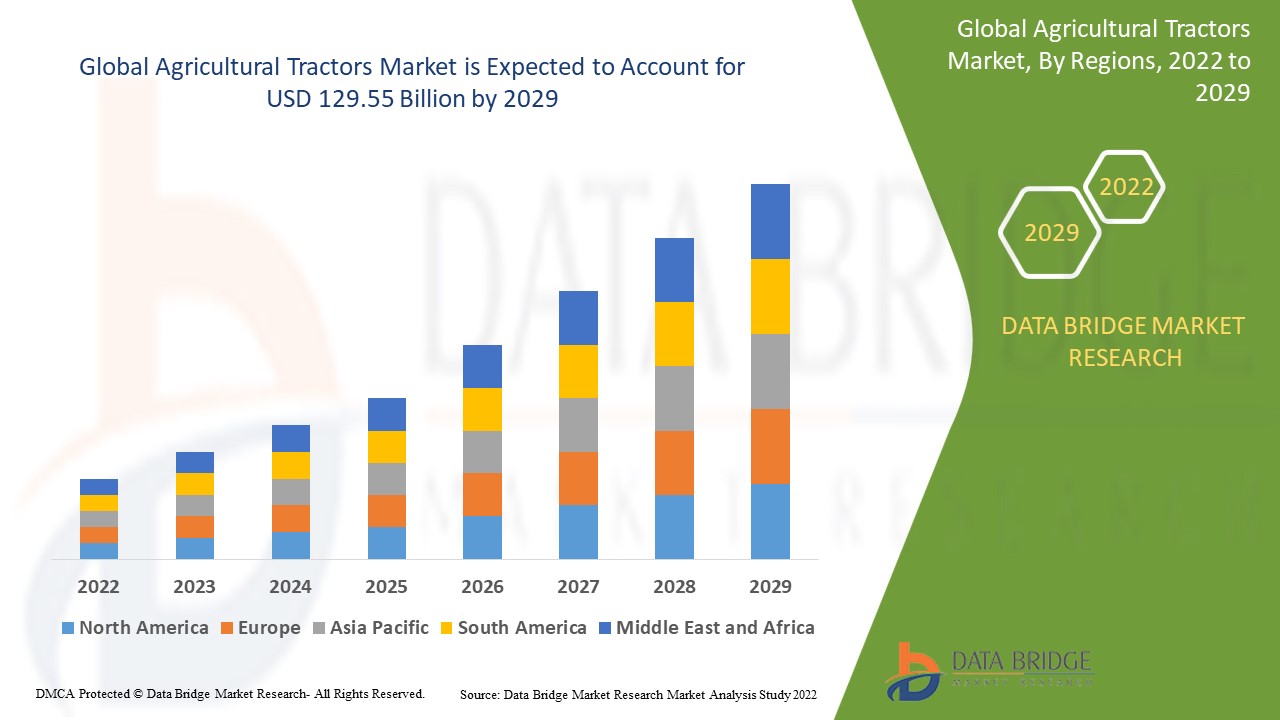
Data Bridge Market Research analyses that the agricultural tractors market which was growing at a value of 60.00 billion in 2021 and is expected to reach the value of USD 129.55 billion by 2029, at a CAGR of 10.10% during the forecast period of 2022-2029.
Market Definition
A tractor is a vehicle with one or two small wheels in front and two large wheels in back. It is used to move attached implements such as rotators, ploughing, tilling, sowing, cultivation, and harvesting in agriculture, construction, and logistics applications. Tractors come in two sizes: two wheels and four wheels. It is also available in a range of power outputs ranging from 20 HP to more than 20 HP.
Report Scope and Market Segmentation
|
Report Metric |
Details |
|
Forecast Period |
2022 to 2029 |
|
Base Year |
2021 |
|
Historic Years |
2020 (Customizable to 2014 - 2019) |
|
Quantitative Units |
Revenue in USD Billion, Volumes in Units, Pricing in USD |
|
Segments Covered |
Engine Power (Below 40 HP, 40 HP–120 HP, 121 HP–180 HP, 181 HP–250 HP and More Than 250 HP), By Application (Harvesting, Seed Sowing, Irrigation and others), By Type (ICE and Electric), By Operation (Manual Tractor Vehicle and Autonomous Tractor Vehicle), By Driver Type (2-Wheel Drive and 4-Wheel Drive) |
|
Countries Covered |
U.S., Canada and Mexico in North America, Germany, France, U.K., Netherlands, Switzerland, Belgium, Russia, Italy, Spain, Turkey, Rest of Europe in Europe, China, Japan, India, South Korea, Singapore, Malaysia, Australia, Thailand, Indonesia, Philippines, Rest of Asia-Pacific (APAC) in the Asia-Pacific (APAC), Saudi Arabia, U.A.E, South Africa, Egypt, Israel, Rest of Middle East and Africa (MEA) as a part of Middle East and Africa (MEA), Brazil, Argentina and Rest of South America as part of South America |
|
Market Players Covered |
Deere & Company (U.S), Tractors and Farm Equipment Limited (India), Kubota Corporation (Japan), CLAAS KGaA GmbH (Germany), AGCO Corporation (U.S), CNH Industrial N.V (UK), Enerpac Tool Group (U.S), JCB (UK), Mahindra & Mahindra Ltd. (India), SDF Group (Italy), Bucher Industries (Switzerland), Alamo Group, Inc. (U.S |
|
Opportunities |
|
Agricultural Tractors Market Dynamics
Drivers
- Government support to the growing trend of farm mechanisation
Government policies, such as loan waivers, schemes, and policies, are driving the growing trend of farm mechanisation, which is expected to drive the growth of the agricultural tractors market in developing countries around the world. Farm mechanisation is a rapidly growing phenomenon in the agricultural tractor market, as emerging economies benefit from government efforts to revolutionise the agriculture industry.
- Growing prevalence of smart farming and growing farm training programmes
Precision farming and the increasing adoption of farm mechanisation to increase productivity are driving up demand for tractors. The growing number of farm training programmes promoting the use of agricultural machinery on a large scale is also driving the tractor market. Aside from that, the growing number of building and construction projects is increasing demand for tractors in the construction industry. Furthermore, various technological advancements have introduced advanced tractors equipped with GPS and telematics devices. The growing popularity of automated commercial vehicles and the widespread use of wireless connectivity for remote monitoring are expected to drive the global agricultural tractor market.
Opportunity
There is a growing demand for low-cost innovations in the agricultural tractor market. This demand has resulted in advancements in driverless tractors. Companies are expected to form talent pools in their R&D centres by collaborating with researchers who conduct science experiments outside of the academic setting. First-year engineering students are developing driverless tractors, which are gaining attention from popular news outlets. Companies in the agricultural tractor market are becoming aware of driverless tractors and benefiting from innovations in these tractors, as they have the potential to eliminate the costs associated with hiring a driver. As a result, companies in the agricultural tractor market should work with engineering talent to further innovate in driverless tractors.
Restraints
The implementation of emission standards may have an impact on the sales of construction and agricultural machinery. Significant R&D investments are required to comply with amendments to emission regulations. Each market has its own emission standards, which adds to the complexity of designing components, particularly engines.
This agricultural tractors market report provides details of new recent developments, trade regulations, import-export analysis, production analysis, value chain optimization, market share, impact of domestic and localized market players, analyses opportunities in terms of emerging revenue pockets, changes in market regulations, strategic market growth analysis, market size, category market growths, application niches and dominance, product approvals, product launches, geographic expansions, technological innovations in the market. To gain more info on the agricultural tractors market contact Data Bridge Market Research for an Analyst Brief, our team will help you take an informed market decision to achieve market growth.
COVID-19 Impact on Agricultural Tractors Market
COVID-19 disrupted the entire supply chain; however, the agricultural industry appeared to be the least affected of all industries. This was primarily due to government efforts to classify agricultural activities as essential services. During COVID-19, the agricultural industry faced four major challenges: a lack of farm equipment parts, a drop in new tractor sales in the first half of 2020, the closure of production facilities, and a drop in working capital. Despite the impact of COVID-19 on the agricultural tractor market, it is expected to rebound by the end of 2021.
Recent developments
- New Holland North America added the T7 Heavy-duty Tractor with PLM Intelligence to its agricultural tractor lineup in July 2021. The new tractor is designed to help farmers be more productive by allowing them to multitask in a variety of field and transport applications.
- TAFE (Tractors and Farm Equipment), the manufacturer of Massey Ferguson tractors, introduced its new DYNATRACK Series in February 2021, which is an advanced range of tractors that offer dynamic performance, sophisticated technology, unrivalled utility, and versatility, all engineered into a single powerful tractor.
Global Agricultural Tractors Market Scope
The agricultural tractors market is segmented on the basis of engine power, application, type, operation, and driver type. The growth amongst these segments will help you analyze meagre growth segments in the industries and provide the users with a valuable market overview and market insights to help them make strategic decisions for identifying core market applications.
Engine power
- Below 40 HP
- 40 HP–120 HP
- 121 HP–180 HP
- 181 HP–250 HP
- More than 250 HP
Type
- ICE
- Electric
Application
- Harvesting
- Seed Sowing
- Irrigation
- others
Operations
- Manual Tractor Vehicle
- Autonomous Tractor Vehicle
Driver type
- 2-Wheel Drive
- 4-Wheel Drive
Agricultural Tractors Market Regional Analysis/Insights
The agricultural tractors market is analysed and market size insights and trends are provided by country, of engine power, application, type, operation, and driver type as referenced above.
The countries covered in the agricultural tractors market report are U.S., Canada and Mexico in North America, Germany, France, U.K., Netherlands, Switzerland, Belgium, Russia, Italy, Spain, Turkey, Rest of Europe in Europe, China, Japan, India, South Korea, Singapore, Malaysia, Australia, Thailand, Indonesia, Philippines, Rest of Asia-Pacific (APAC) in the Asia-Pacific (APAC), Saudi Arabia, U.A.E, South Africa, Egypt, Israel, Rest of Middle East and Africa (MEA) as a part of Middle East and Africa (MEA), Brazil, Argentina and Rest of South America as part of South America.
China and India are the leading country-level markets for agricultural products such as crops and vegetables. Because of the availability of agricultural fields, Asia-Pacific countries are among the most appealing markets for agricultural tractors. According to the India Brand Equity Foundation, the agricultural sector is the primary source of income for nearly 58 percent of the country's population. The rising demand for agricultural machinery in the agricultural industry is expected to propel the agricultural tractors market in North America forward. Furthermore, the rising demand for agricultural implement modernization is expected to provide lucrative opportunities to the agricultural tractors market during the forecast period.
The country section of the report also provides individual market impacting factors and changes in market regulation that impact the current and future trends of the market. Data points like down-stream and upstream value chain analysis, technical trends and porter's five forces analysis, case studies are some of the pointers used to forecast the market scenario for individual countries. Also, the presence and availability of global brands and their challenges faced due to large or scarce competition from local and domestic brands, impact of domestic tariffs and trade routes are considered while providing forecast analysis of the country data.
Competitive Landscape and Agricultural Tractors Market Share Analysis
The agricultural tractors market competitive landscape provides details by competitor. Details included are company overview, company financials, revenue generated, market potential, investment in research and development, new market initiatives, global presence, production sites and facilities, production capacities, company strengths and weaknesses, product launch, product width and breadth, application dominance. The above data points provided are only related to the companies' focus related to agricultural tractors market.
Some of the major players operating in the agricultural tractors market are:
- Deere & Company (U.S)
- Tractors and Farm Equipment Limited (India)
- Kubota Corporation (Japan)
- CLAAS KGaA GmbH (Germany)
- AGCO Corporation (U.S)
- CNH Industrial N.V (UK)
- Enerpac Tool Group (U.S)
- JCB (UK)
- Mahindra & Mahindra Ltd. (India)
- SDF Group (Italy)
- Bucher Industries (Switzerland)
- Alamo Group, Inc. (U.S
SKU-

- Interactive Data Analysis Dashboard
- Company Analysis Dashboard for high growth potential opportunities
- Research Analyst Access for customization & queries
- Competitor Analysis with Interactive dashboard
- Latest News, Updates & Trend analysis
- Harness the Power of Benchmark Analysis for Comprehensive Competitor Tracking
Table of Content
1. INTRODUCTION
1.1 OBJECTIVES OF THE STUDY
1.2 MARKET DEFINITION
1.3 OVERVIEW OF GLOBAL AGRICULTURAL TRACTORS MARKET
1.4 CURRENCY AND PRICING
1.5 LIMITATION
1.6 MARKETS COVERED
2. MARKET SEGMENTATION
2.1 KEY TAKEAWAYS
2.2 ARRIVING AT THE GLOBAL AGRICULTURAL TRACTORS MARKET SIZE
2.2.1 VENDOR POSITIONING GRID
2.2.2 TECHNOLOGY LIFE LINE CURVE
2.2.3 MARKET GUIDE
2.2.4 COMPANY POSITIONING GRID
2.2.5 COMAPANY MARKET SHARE ANALYSIS
2.2.6 MULTIVARIATE MODELLING
2.2.7 DEMAND AND SUPPLY-SIDE VARIABLES
2.2.8 CONSUMPTION TREND OF END PRODUCTS
2.2.9 TOP TO BOTTOM ANALYSIS
2.2.10 STANDARDS OF MEASUREMENT
2.2.11 VENDOR SHARE ANALYSIS
2.2.12 DATA POINTS FROM KEY PRIMARY INTERVIEWS
2.2.13 DATA POINTS FROM KEY SECONDARY DATABASES
2.3 GLOBAL AGRICULTURAL TRACTORS MARKET: RESEARCH SNAPSHOT
2.4 ASSUMPTIONS
3. MARKET OVERVIEW
3.1 DRIVERS
3.2 RESTRAINTS
3.3 OPPORTUNITIES
3.4 CHALLENGES
4. EXECUTIVE SUMMARY
5. PREMIUM INSIGHTS
5.1 PRODUCTION ANALYSIS
5.2 IMPORT-EXPORT ANALYSIS
5.3 UPCOMING TRACTOR TECHNOLOGIES
5.3.1 HIGH PRECISION POSITIONING SYSTEM
5.3.2 GPS & GNSS
5.3.3 AUTOMATED STEERING SYSTEMS
5.3.4 GEO MAPPING
5.3.5 SENSORS & REMOTE SENSING
5.3.6 VARIABLE RATE TECHNOLOGY (VRT)
5.3.7 INTEGRATED ELECTRONIC COMMUNICATION
5.4 SUPPLY CHAIN ANALYSIS
5.5 VALUE CHAIN ANALYSIS
5.6 PRODUCTION COST ANALYSIS
5.7 GOVERNMENT SUPPORT FOR DEVELOPMENT OF AGRICULTURAL ACTIVITIES
5.8 INCREASE IN ADOPTION OF PRECISION FARMING
5.9 INCREASE IN DEMAND FOR FUEL EFFICIENT TRACTORS
5.10 ENGINE POWER INSIGHTS
6. REGULATORY FRAMEWORK
7. GLOBAL AGRICULTURAL TRACTORS MARKET, BY TYPE, 2020-2029, (USD MILLION), (UNITS)
8. (ASP, VALUE & VOLUME WILL BE PROVIDED FOR ALL THE SEGMENTS)
8.1 OVERVIEW
8.2 ORCHARD TRACTORS
8.2.1 ASP (USD)
8.2.2 VALUE (USD MILLION)
8.2.3 VOLUME (UNITS)
8.2.4 BY STEERING TYPE
8.2.4.1. MECHANICAL STEERING
8.2.4.2. HYDRAULIC STEERING
8.2.5 BY ENGINE HORSE POWER
8.2.5.1. LESSER THAN 50 HP
8.2.5.2. 51 HP TO 100 HP
8.2.5.3. 101 HP TO 200 HP
8.2.5.4. 201 HP TO 300 HP
8.2.5.5. 301 HP TO 400 HP
8.2.5.6. 401 HP TO 500 HP
8.2.5.7. GREATER THAN 500 HP
8.3 ROW-CROP TRACTORS
8.3.1 BY STEERING TYPE
8.3.1.1. MECHANICAL STEERING
8.3.1.2. HYDRAULIC STEERING
8.3.2 BY ENGINE HORSE POWER
8.3.2.1. LESSER THAN 50 HP
8.3.2.2. 51 HP TO 100 HP
8.3.2.3. 101 HP TO 200 HP
8.3.2.4. 201 HP TO 300 HP
8.3.2.5. 301 HP TO 400 HP
8.3.2.6. 401 HP TO 500 HP
8.3.2.7. GREATER THAN 500 HP
8.4 UTILITY TRACTORS
8.4.1 BY STEERING TYPE
8.4.1.1. MECHANICAL STEERING
8.4.1.2. HYDRAULIC STEERING
8.4.2 BY ENGINE HORSE POWER
8.4.2.1. LESSER THAN 50 HP
8.4.2.2. 51 HP TO 100 HP
8.4.2.3. 101 HP TO 200 HP
8.4.2.4. 201 HP TO 300 HP
8.4.2.5. 301 HP TO 400 HP
8.4.2.6. 401 HP TO 500 HP
8.4.2.7. GREATER THAN 500 HP
8.5 COMPACT TRACTORS
8.5.1 BY STEERING TYPE
8.5.1.1. MECHANICAL STEERING
8.5.1.2. HYDRAULIC STEERING
8.5.2 BY ENGINE HORSE POWER
8.5.2.1. LESSER THAN 50 HP
8.5.2.2. 51 HP TO 100 HP
8.5.2.3. 101 HP TO 200 HP
8.5.2.4. 201 HP TO 300 HP
8.5.2.5. 301 HP TO 400 HP
8.5.2.6. 401 HP TO 500 HP
8.5.2.7. GREATER THAN 500 HP
8.6 GARDEN TRACTORS
8.6.1 BY STEERING TYPE
8.6.1.1. MECHANICAL STEERING
8.6.1.2. HYDRAULIC STEERING
8.6.2 BY ENGINE HORSE POWER
8.6.2.1. LESSER THAN 50 HP
8.6.2.2. 51 HP TO 100 HP
8.6.2.3. 101 HP TO 200 HP
8.6.2.4. 201 HP TO 300 HP
8.6.2.5. 301 HP TO 400 HP
8.6.2.6. 401 HP TO 500 HP
8.6.2.7. GREATER THAN 500 HP
8.7 IMPLEMENT CARRIER TRACTORS
8.7.1 BY STEERING TYPE
8.7.1.1. MECHANICAL STEERING
8.7.1.2. HYDRAULIC STEERING
8.7.2 BY ENGINE HORSE POWER
8.7.2.1. LESSER THAN 50 HP
8.7.2.2. 51 HP TO 100 HP
8.7.2.3. 101 HP TO 200 HP
8.7.2.4. 201 HP TO 300 HP
8.7.2.5. 301 HP TO 400 HP
8.7.2.6. 401 HP TO 500 HP
8.7.2.7. GREATER THAN 500 HP
8.8 TWO WHEEL TRACTORS
8.8.1 BY STEERING TYPE
8.8.1.1. MECHANICAL STEERING
8.8.1.2. HYDRAULIC STEERING
8.8.2 BY ENGINE HORSE POWER
8.8.2.1. LESSER THAN 50 HP
8.8.2.2. 51 HP TO 100 HP
8.8.2.3. 101 HP TO 200 HP
8.8.2.4. 201 HP TO 300 HP
8.8.2.5. 301 HP TO 400 HP
8.8.2.6. 401 HP TO 500 HP
8.8.2.7. GREATER THAN 500 HP
8.9 SPECIALTY TRACTORS
8.9.1 BY STEERING TYPE
8.9.1.1. MECHANICAL STEERING
8.9.1.2. HYDRAULIC STEERING
8.9.2 BY ENGINE HORSE POWER
8.9.2.1. LESSER THAN 50 HP
8.9.2.2. 51 HP TO 100 HP
8.9.2.3. 101 HP TO 200 HP
8.9.2.4. 201 HP TO 300 HP
8.9.2.5. 301 HP TO 400 HP
8.9.2.6. 401 HP TO 500 HP
8.9.2.7. GREATER THAN 500 HP
8.10 TRACK TRACTORS
8.10.1 BY STEERING TYPE
8.10.1.1. MECHANICAL STEERING
8.10.1.2. HYDRAULIC STEERING
8.10.2 BY ENGINE HORSE POWER
8.10.2.1. LESSER THAN 50 HP
8.10.2.2. 51 HP TO 100 HP
8.10.2.3. 101 HP TO 200 HP
8.10.2.4. 201 HP TO 300 HP
8.10.2.5. 301 HP TO 400 HP
8.10.2.6. 401 HP TO 500 HP
8.10.2.7. GREATER THAN 500 HP
8.11 OTHER TYPES
8.11.1 BY STEERING TYPE
8.11.1.1. MECHANICAL STEERING
8.11.1.2. HYDRAULIC STEERING
8.11.2 BY ENGINE HORSE POWER
8.11.2.1. LESSER THAN 50 HP
8.11.2.2. 51 HP TO 100 HP
8.11.2.3. 101 HP TO 200 HP
8.11.2.4. 201 HP TO 300 HP
8.11.2.5. 301 HP TO 400 HP
8.11.2.6. 401 HP TO 500 HP
8.11.2.7. GREATER THAN 500 HP
9. GLOBAL AGRICULTURAL TRACTORS MARKET, BY ENGINE HORSE POWER, 2020-2029, (USD MILLION), (UNITS)
(ASP, VALUE & VOLUME WILL BE PROVIDED FOR ALL THE SEGMENTS)
9.1 OVERVIEW
9.2 LESSER THAN 50 HP
9.2.1 BY TRANSMISSION TYPE
9.2.1.1. MECHANICAL TRANSMISSION
9.2.1.2. HST (HYDRO STATIC TRANSMISSION)
9.2.1.3. GST (GLIDE SHIFT TRANSMISSION)
9.2.1.4. POWERSHIFT TRANSMISSION
9.2.1.5. CVT (CONTINUOUSLY VARIABLE TRANSMISSION)
9.2.2 BY AUTONOMOUS SYSTEM
9.2.2.1. AUTOMATIC
9.2.2.1.1. SEMI-AUTOMATIC
9.2.2.1.2. FULLY AUTOMATIC
9.2.2.2. MANUAL
9.2.3 BY DRIVE TYPE
9.2.3.1. 2 WD
9.2.3.2. 4 WD
9.3 51 HP TO 100 HP
9.3.1 BY TRANSMISSION TYPE
9.3.1.1. MECHANICAL TRANSMISSION
9.3.1.2. HST (HYDRO STATIC TRANSMISSION)
9.3.1.3. GST (GLIDE SHIFT TRANSMISSION)
9.3.1.4. POWERSHIFT TRANSMISSION
9.3.1.5. CVT (CONTINUOUSLY VARIABLE TRANSMISSION)
9.3.2 BY AUTONOMOUS SYSTEM
9.3.2.1. AUTOMATIC
9.3.2.1.1. SEMI-AUTOMATIC
9.3.2.1.2. FULLY AUTOMATIC
9.3.2.2. MANUAL
9.3.3 BY DRIVE TYPE
9.3.3.1. 2 WD
9.3.3.2. 4 WD
9.4 101 HP TO 200 HP
9.4.1 BY TRANSMISSION TYPE
9.4.1.1. MECHANICAL TRANSMISSION
9.4.1.2. HST (HYDRO STATIC TRANSMISSION)
9.4.1.3. GST (GLIDE SHIFT TRANSMISSION)
9.4.1.4. POWERSHIFT TRANSMISSION
9.4.1.5. CVT (CONTINUOUSLY VARIABLE TRANSMISSION)
9.4.2 BY AUTONOMOUS SYSTEM
9.4.2.1. AUTOMATIC
9.4.2.1.1. SEMI-AUTOMATIC
9.4.2.1.2. FULLY AUTOMATIC
9.4.2.2. MANUAL
9.4.3 BY DRIVE TYPE
9.4.3.1. 2 WD
9.4.3.2. 4 WD
9.5 201 HP TO 300 HP
9.5.1 BY TRANSMISSION TYPE
9.5.1.1. MECHANICAL TRANSMISSION
9.5.1.2. HST (HYDRO STATIC TRANSMISSION)
9.5.1.3. GST (GLIDE SHIFT TRANSMISSION)
9.5.1.4. POWERSHIFT TRANSMISSION
9.5.1.5. CVT (CONTINUOUSLY VARIABLE TRANSMISSION)
9.5.2 BY AUTONOMOUS SYSTEM
9.5.2.1. AUTOMATIC
9.5.2.1.1. SEMI-AUTOMATIC
9.5.2.1.2. FULLY AUTOMATIC
9.5.2.2. MANUAL
9.5.3 BY DRIVE TYPE
9.5.3.1. 2 WD
9.5.3.2. 4 WD
9.6 301 HP TO 400 HP
9.6.1 BY TRANSMISSION TYPE
9.6.1.1. MECHANICAL TRANSMISSION
9.6.1.2. HST (HYDRO STATIC TRANSMISSION)
9.6.1.3. GST (GLIDE SHIFT TRANSMISSION)
9.6.1.4. POWERSHIFT TRANSMISSION
9.6.1.5. CVT (CONTINUOUSLY VARIABLE TRANSMISSION)
9.6.2 BY AUTONOMOUS SYSTEM
9.6.2.1. AUTOMATIC
9.6.2.1.1. SEMI-AUTOMATIC
9.6.2.1.2. FULLY AUTOMATIC
9.6.2.2. MANUAL
9.6.3 BY DRIVE TYPE
9.6.3.1. 2 WD
9.6.3.2. 4 WD
9.7 401 HP TO 500 HP
9.7.1 BY TRANSMISSION TYPE
9.7.1.1. MECHANICAL TRANSMISSION
9.7.1.2. HST (HYDRO STATIC TRANSMISSION)
9.7.1.3. GST (GLIDE SHIFT TRANSMISSION)
9.7.1.4. POWERSHIFT TRANSMISSION
9.7.1.5. CVT (CONTINUOUSLY VARIABLE TRANSMISSION)
9.7.2 BY AUTONOMOUS SYSTEM
9.7.2.1. AUTOMATIC
9.7.2.1.1. SEMI-AUTOMATIC
9.7.2.1.2. FULLY AUTOMATIC
9.7.2.2. MANUAL
9.7.3 BY DRIVE TYPE
9.7.3.1. 2 WD
9.7.3.2. 4 WD
9.8 GREATER THAN 500 HP
9.8.1 BY TRANSMISSION TYPE
9.8.1.1. MECHANICAL TRANSMISSION
9.8.1.2. HST (HYDRO STATIC TRANSMISSION)
9.8.1.3. GST (GLIDE SHIFT TRANSMISSION)
9.8.1.4. POWERSHIFT TRANSMISSION
9.8.1.5. CVT (CONTINUOUSLY VARIABLE TRANSMISSION)
9.8.2 BY AUTONOMOUS SYSTEM
9.8.2.1. AUTOMATIC
9.8.2.1.1. SEMI-AUTOMATIC
9.8.2.1.2. FULLY AUTOMATIC
9.8.2.2. MANUAL
9.8.3 BY DRIVE TYPE
9.8.3.1. 2 WD
9.8.3.2. 4 WD
10. GLOBAL AGRICULTURAL TRACTORS MARKET, BY ENGINE CAPACITY, 2020-2029, (USD MILLION)
10.1 OVERVIEW
10.2 LOW POWER
10.3 MID POWER
10.4 HIGH POWER
11. GLOBAL AGRICULTURAL TRACTORS MARKET, BY DRIVE TYPE, 2020-2029, (USD MILLION)
11.1 OVERVIEW
11.2 2 WD
11.3 4 WD
12. GLOBAL AGRICULTURAL TRACTORS MARKET, BY PROPULSION, 2020-2029, (USD MILLION)
12.1 OVERVIEW
12.2 ICE
12.3 ELECTRIC & HYBRID
13. GLOBAL AGRICULTURAL TRACTORS MARKET, BY AUTONOMOUS SYSTEM, 2020-2029, (USD MILLION)
13.1 OVERVIEW
13.2 AUTOMATIC
13.2.1 SEMI-AUTOMATIC
13.2.2 FULLY AUTOMATIC
13.3 MANUAL
14. GLOBAL AGRICULTURAL TRACTORS MARKET, BY WEIGHT, 2020-2029, (USD MILLION)
14.1 OVERVIEW
14.2 LESS THAN 1000 KG
14.3 1001-1200 KG
14.4 1201-1400 KG
14.5 1401-1600 KG
14.6 1601-1800 KG
14.7 1801-2000 KG
14.8 MORE THAN 2000 KG
15. GLOBAL AGRICULTURAL TRACTORS MARKET, BY TRANSMISSION TYPE, 2020-2029, (USD MILLION)
15.1 OVERVIEW
15.2 MECHANICAL TRANSMISSION
15.3 HST (HYDRO STATIC TRANSMISSION)
15.4 GST (GLIDE SHIFT TRANSMISSION)
15.5 POWERSHIFT TRANSMISSION
15.6 CVT (CONTINUOUSLY VARIABLE TRANSMISSION)
16. GLOBAL AGRICULTURAL TRACTORS MARKET, BY STEERING TYPE, 2020-2029, (USD MILLION)
16.1 OVERVIEW
16.2 MECHANICAL STEERING
16.3 HYDRAULIC STEERING
17. GLOBAL AGRICULTURAL TRACTORS MARKET, BY RIDE COMFORT, 2020-2029, (USD MILLION)
17.1 OVERVIEW
17.2 HYDRA CUSHION
17.3 AIR CUSHION
17.4 CAP SUSPENSION
18. GLOBAL AGRICULTURAL TRACTORS MARKET, BY AGRICULTURAL APPLICATION, 2020-2029, (USD MILLION)
18.1 OVERVIEW
18.2 HARVESTING
18.2.1 BY TYPE
18.2.1.1. ORCHARD TRACTORS
18.2.1.2. ROW-CROP TRACTORS
18.2.1.3. UTILITY TRACTORS
18.2.1.4. COMPACT TRACTORS
18.2.1.5. GARDEN TRACTORS
18.2.1.6. IMPLEMENT CARRIER TRACTORS
18.2.1.7. TWO WHEEL TRACTORS
18.2.1.8. SPECIALTY TRACTORS
18.2.1.9. TRACK TRACTORS
18.2.1.10. OTHER TYPES
18.3 SEED SOWING
18.3.1 BY TYPE
18.3.1.1. ORCHARD TRACTORS
18.3.1.2. ROW-CROP TRACTORS
18.3.1.3. UTILITY TRACTORS
18.3.1.4. COMPACT TRACTORS
18.3.1.5. GARDEN TRACTORS
18.3.1.6. IMPLEMENT CARRIER TRACTORS
18.3.1.7. TWO WHEEL TRACTORS
18.3.1.8. SPECIALTY TRACTORS
18.3.1.9. TRACK TRACTORS
18.3.1.10. OTHER TYPES
18.4 IRRIGATION
18.4.1 BY TYPE
18.4.1.1. ORCHARD TRACTORS
18.4.1.2. ROW-CROP TRACTORS
18.4.1.3. UTILITY TRACTORS
18.4.1.4. COMPACT TRACTORS
18.4.1.5. GARDEN TRACTORS
18.4.1.6. IMPLEMENT CARRIER TRACTORS
18.4.1.7. TWO WHEEL TRACTORS
18.4.1.8. SPECIALTY TRACTORS
18.4.1.9. TRACK TRACTORS
18.4.1.10. OTHER TYPES
18.5 SPRAYING
18.5.1 BY TYPE
18.5.1.1. ORCHARD TRACTORS
18.5.1.2. ROW-CROP TRACTORS
18.5.1.3. UTILITY TRACTORS
18.5.1.4. COMPACT TRACTORS
18.5.1.5. GARDEN TRACTORS
18.5.1.6. IMPLEMENT CARRIER TRACTORS
18.5.1.7. TWO WHEEL TRACTORS
18.5.1.8. SPECIALTY TRACTORS
18.5.1.9. TRACK TRACTORS
18.5.1.10. OTHER TYPES
18.6 DRILLING
18.6.1 BY TYPE
18.6.1.1. ORCHARD TRACTORS
18.6.1.2. ROW-CROP TRACTORS
18.6.1.3. UTILITY TRACTORS
18.6.1.4. COMPACT TRACTORS
18.6.1.5. GARDEN TRACTORS
18.6.1.6. IMPLEMENT CARRIER TRACTORS
18.6.1.7. TWO WHEEL TRACTORS
18.6.1.8. SPECIALTY TRACTORS
18.6.1.9. TRACK TRACTORS
18.6.1.10. OTHER TYPES
18.7 LOADING
18.7.1 BY TYPE
18.7.1.1. ORCHARD TRACTORS
18.7.1.2. ROW-CROP TRACTORS
18.7.1.3. UTILITY TRACTORS
18.7.1.4. COMPACT TRACTORS
18.7.1.5. GARDEN TRACTORS
18.7.1.6. IMPLEMENT CARRIER TRACTORS
18.7.1.7. TWO WHEEL TRACTORS
18.7.1.8. SPECIALTY TRACTORS
18.7.1.9. TRACK TRACTORS
18.7.1.10. OTHER TYPES
18.8 ROTARY SWEEPING
18.8.1 BY TYPE
18.8.1.1. ORCHARD TRACTORS
18.8.1.2. ROW-CROP TRACTORS
18.8.1.3. UTILITY TRACTORS
18.8.1.4. COMPACT TRACTORS
18.8.1.5. GARDEN TRACTORS
18.8.1.6. IMPLEMENT CARRIER TRACTORS
18.8.1.7. TWO WHEEL TRACTORS
18.8.1.8. SPECIALTY TRACTORS
18.8.1.9. TRACK TRACTORS
18.8.1.10. OTHER TYPES
18.9 DRILLING SEEDS
18.9.1 BY TYPE
18.9.1.1. ORCHARD TRACTORS
18.9.1.2. ROW-CROP TRACTORS
18.9.1.3. UTILITY TRACTORS
18.9.1.4. COMPACT TRACTORS
18.9.1.5. GARDEN TRACTORS
18.9.1.6. IMPLEMENT CARRIER TRACTORS
18.9.1.7. TWO WHEEL TRACTORS
18.9.1.8. SPECIALTY TRACTORS
18.9.1.9. TRACK TRACTORS
18.9.1.10. OTHER TYPES
18.10 WEED CONTROLLING
18.10.1 BY TYPE
18.10.1.1. ORCHARD TRACTORS
18.10.1.2. ROW-CROP TRACTORS
18.10.1.3. UTILITY TRACTORS
18.10.1.4. COMPACT TRACTORS
18.10.1.5. GARDEN TRACTORS
18.10.1.6. IMPLEMENT CARRIER TRACTORS
18.10.1.7. TWO WHEEL TRACTORS
18.10.1.8. SPECIALTY TRACTORS
18.10.1.9. TRACK TRACTORS
18.10.1.10. OTHER TYPES
18.11 PULLING HEAVY IMPLEMENTS.
18.11.1 BY TYPE
18.11.1.1. ORCHARD TRACTORS
18.11.1.2. ROW-CROP TRACTORS
18.11.1.3. UTILITY TRACTORS
18.11.1.4. COMPACT TRACTORS
18.11.1.5. GARDEN TRACTORS
18.11.1.6. IMPLEMENT CARRIER TRACTORS
18.11.1.7. TWO WHEEL TRACTORS
18.11.1.8. SPECIALTY TRACTORS
18.11.1.9. TRACK TRACTORS
18.11.1.10. OTHER TYPES
18.12 PLOUGHING
18.12.1 BY TYPE
18.12.1.1. ORCHARD TRACTORS
18.12.1.2. ROW-CROP TRACTORS
18.12.1.3. UTILITY TRACTORS
18.12.1.4. COMPACT TRACTORS
18.12.1.5. GARDEN TRACTORS
18.12.1.6. IMPLEMENT CARRIER TRACTORS
18.12.1.7. TWO WHEEL TRACTORS
18.12.1.8. SPECIALTY TRACTORS
18.12.1.9. TRACK TRACTORS
18.12.1.10. OTHER TYPES
18.13 HARROWING
18.13.1 BY TYPE
18.13.1.1. ORCHARD TRACTORS
18.13.1.2. ROW-CROP TRACTORS
18.13.1.3. UTILITY TRACTORS
18.13.1.4. COMPACT TRACTORS
18.13.1.5. GARDEN TRACTORS
18.13.1.6. IMPLEMENT CARRIER TRACTORS
18.13.1.7. TWO WHEEL TRACTORS
18.13.1.8. SPECIALTY TRACTORS
18.13.1.9. TRACK TRACTORS
18.13.1.10. OTHER TYPES
18.14 TRANSPORTING
18.14.1 BY TYPE
18.14.1.1. ORCHARD TRACTORS
18.14.1.2. ROW-CROP TRACTORS
18.14.1.3. UTILITY TRACTORS
18.14.1.4. COMPACT TRACTORS
18.14.1.5. GARDEN TRACTORS
18.14.1.6. IMPLEMENT CARRIER TRACTORS
18.14.1.7. TWO WHEEL TRACTORS
18.14.1.8. SPECIALTY TRACTORS
18.14.1.9. TRACK TRACTORS
18.14.1.10. OTHER TYPES
18.15 OTHERS
18.15.1 BY TYPE
18.15.1.1. ORCHARD TRACTORS
18.15.1.2. ROW-CROP TRACTORS
18.15.1.3. UTILITY TRACTORS
18.15.1.4. COMPACT TRACTORS
18.15.1.5. GARDEN TRACTORS
18.15.1.6. IMPLEMENT CARRIER TRACTORS
18.15.1.7. TWO WHEEL TRACTORS
18.15.1.8. SPECIALTY TRACTORS
18.15.1.9. TRACK TRACTORS
18.15.1.10. OTHER TYPES
19. GLOBAL AGRICULTURAL TRACTORS MARKET, BY COUNTRY, 2020-2029, (USD MILLION)
GLOBAL AGRICULTURAL TRACTORS MARKET, (ALL SEGMENTATION PROVIDED ABOVE IS REPRESENTED IN THIS CHAPTER BY COUNTRY)
19.1 NORTH AMERICA
19.1.1 U.S.
19.1.2 CANADA
19.1.3 MEXICO
19.2 EUROPE
19.2.1 GERMANY
19.2.2 U.K.
19.2.3 ITALY
19.2.4 FRANCE
19.2.5 SPAIN
19.2.6 RUSSIA
19.2.7 SWITZERLAND
19.2.8 TURKEY
19.2.9 BELGIUM
19.2.10 NETHERLANDS
19.2.11 DENMARK
19.2.12 SWEDEN
19.2.13 POLAND
19.2.14 NORWAY
19.2.15 FINLAND
19.2.16 REST OF EUROPE
19.3 ASIA-PACIFIC
19.3.1 JAPAN
19.3.2 CHINA
19.3.3 SOUTH KOREA
19.3.4 INDIA
19.3.5 SINGAPORE
19.3.6 THAILAND
19.3.7 INDONESIA
19.3.8 MALAYSIA
19.3.9 PHILIPPINES
19.3.10 AUSTRALIA
19.3.11 NEW ZEALAND
19.3.12 VIETNAM
19.3.13 TAIWAN
19.3.14 REST OF ASIA-PACIFIC
19.4 SOUTH AMERICA
19.4.1 BRAZIL
19.4.2 ARGENTINA
19.4.3 REST OF SOUTH AMERICA
19.5 MIDDLE EAST AND AFRICA
19.5.1 SOUTH AFRICA
19.5.2 EGYPT
19.5.3 BAHRAIN
19.5.4 UNITED ARAB EMIRATES
19.5.5 KUWAIT
19.5.6 OMAN
19.5.7 QATAR
19.5.8 SAUDI ARABIA
19.5.9 REST OF MEA
20. GLOBAL AGRICULTURAL TRACTORS MARKET, COMPANY LANDSCAPE
20.1 COMPANY SHARE ANALYSIS: GLOBAL
20.2 COMPANY SHARE ANALYSIS: NORTH AMERICA
20.3 COMPANY SHARE ANALYSIS: EUROPE
20.4 COMPANY SHARE ANALYSIS: ASIA-PACIFIC
20.5 MERGERS & ACQUISITIONS
20.6 NEW PRODUCT DEVELOPMENT & APPROVALS
20.7 EXPANSIONS & PARTNERSHIP
20.8 REGULATORY CHANGES
21. GLOBAL AGRICULTURAL TRACTORS MARKET, SWOT & DBMR ANALYSIS
22. GLOBAL AGRICULTURAL TRACTORS MARKET, COMPANY PROFILE
22.1 DEERE & COMPANY
22.1.1 COMPANY OVERVIEW
22.1.2 REVENUE ANALYSIS
22.1.3 GEOGRAPHIC PRESENCE
22.1.4 PRODUCT PORTFOLIO
22.1.5 RECENT DEVELOPMENTS
22.2 MAHINDRA TRACTORS
22.2.1 COMPANY OVERVIEW
22.2.2 REVENUE ANALYSIS
22.2.3 GEOGRAPHIC PRESENCE
22.2.4 PRODUCT PORTFOLIO
22.2.5 RECENT DEVELOPMENTS
22.3 KUBOTA CORPORATION
22.3.1 COMPANY OVERVIEW
22.3.2 REVENUE ANALYSIS
22.3.3 GEOGRAPHIC PRESENCE
22.3.4 PRODUCT PORTFOLIO
22.3.5 RECENT DEVELOPMENTS
22.4 YANMAR HOLDINGS CO., LTD
22.4.1 COMPANY OVERVIEW
22.4.2 REVENUE ANALYSIS
22.4.3 GEOGRAPHIC PRESENCE
22.4.4 PRODUCT PORTFOLIO
22.4.5 RECENT DEVELOPMENTS
22.5 MASSEY FERGUSON
22.5.1 COMPANY OVERVIEW
22.5.2 REVENUE ANALYSIS
22.5.3 GEOGRAPHIC PRESENCE
22.5.4 PRODUCT PORTFOLIO
22.5.5 RECENT DEVELOPMENTS
22.6 FARMTRAC
22.6.1 COMPANY OVERVIEW
22.6.2 REVENUE ANALYSIS
22.6.3 GEOGRAPHIC PRESENCE
22.6.4 PRODUCT PORTFOLIO
22.6.5 RECENT DEVELOPMENTS
22.7 DONGFENG
22.7.1 COMPANY OVERVIEW
22.7.2 REVENUE ANALYSIS
22.7.3 GEOGRAPHIC PRESENCE
22.7.4 PRODUCT PORTFOLIO
22.7.5 RECENT DEVELOPMENTS
22.8 DAEDONG CORPORATION
22.8.1 COMPANY OVERVIEW
22.8.2 REVENUE ANALYSIS
22.8.3 GEOGRAPHIC PRESENCE
22.8.4 PRODUCT PORTFOLIO
22.8.5 RECENT DEVELOPMENTS
22.9 CNH INDUSTRIAL N.V.
22.9.1 COMPANY OVERVIEW
22.9.2 REVENUE ANALYSIS
22.9.3 GEOGRAPHIC PRESENCE
22.9.4 PRODUCT PORTFOLIO
22.9.5 RECENT DEVELOPMENTS
22.10 SDF GROUP
22.10.1 COMPANY OVERVIEW
22.10.2 REVENUE ANALYSIS
22.10.3 GEOGRAPHIC PRESENCE
22.10.4 PRODUCT PORTFOLIO
22.10.5 RECENT DEVELOPMENTS
22.11 VALTRA INC.
22.11.1 COMPANY OVERVIEW
22.11.2 REVENUE ANALYSIS
22.11.3 GEOGRAPHIC PRESENCE
22.11.4 PRODUCT PORTFOLIO
22.11.5 RECENT DEVELOPMENTS
22.12 ARGO TRACTORS S.P.A
22.12.1 COMPANY OVERVIEW
22.12.2 REVENUE ANALYSIS
22.12.3 GEOGRAPHIC PRESENCE
22.12.4 PRODUCT PORTFOLIO
22.12.5 RECENT DEVELOPMENTS
22.13 AGCO CORPORATION
22.13.1 COMPANY OVERVIEW
22.13.2 REVENUE ANALYSIS
22.13.3 GEOGRAPHIC PRESENCE
22.13.4 PRODUCT PORTFOLIO
22.13.5 RECENT DEVELOPMENTS
22.14 ESCORTS LIMITED
22.14.1 COMPANY OVERVIEW
22.14.2 REVENUE ANALYSIS
22.14.3 GEOGRAPHIC PRESENCE
22.14.4 PRODUCT PORTFOLIO
22.14.5 RECENT DEVELOPMENTS
22.15 JORDAN TRACTOR & EQUIPMENT CO.
22.15.1 COMPANY OVERVIEW
22.15.2 REVENUE ANALYSIS
22.15.3 GEOGRAPHIC PRESENCE
22.15.4 PRODUCT PORTFOLIO
22.15.5 RECENT DEVELOPMENTS
22.16 CAPTAIN TRACTORS PVT. LTD.
22.16.1 COMPANY OVERVIEW
22.16.2 REVENUE ANALYSIS
22.16.3 GEOGRAPHIC PRESENCE
22.16.4 PRODUCT PORTFOLIO
22.16.5 RECENT DEVELOPMENTS
22.17 EICHER TRACTORS
22.17.1 COMPANY OVERVIEW
22.17.2 REVENUE ANALYSIS
22.17.3 GEOGRAPHIC PRESENCE
22.17.4 PRODUCT PORTFOLIO
22.17.5 RECENT DEVELOPMENTS
22.18 FORCE MOTORS LTD
22.18.1 COMPANY OVERVIEW
22.18.2 REVENUE ANALYSIS
22.18.3 GEOGRAPHIC PRESENCE
22.18.4 PRODUCT PORTFOLIO
22.18.5 RECENT DEVELOPMENTS
22.19 GROMAX AGRI EQUIPMENT LIMITED
22.19.1 COMPANY OVERVIEW
22.19.2 REVENUE ANALYSIS
22.19.3 GEOGRAPHIC PRESENCE
22.19.4 PRODUCT PORTFOLIO
22.19.5 RECENT DEVELOPMENTS
22.20 ZIMENO INC DBA MONARCH TRACTOR
22.20.1 COMPANY OVERVIEW
22.20.2 REVENUE ANALYSIS
22.20.3 GEOGRAPHIC PRESENCE
22.20.4 PRODUCT PORTFOLIO
22.20.5 RECENT DEVELOPMENTS
22.21 SOLECTRAC
22.21.1 COMPANY OVERVIEW
22.21.2 REVENUE ANALYSIS
22.21.3 GEOGRAPHIC PRESENCE
22.21.4 PRODUCT PORTFOLIO
22.21.5 RECENT DEVELOPMENTS
22.22 SONALIKA
22.22.1 COMPANY OVERVIEW
22.22.2 REVENUE ANALYSIS
22.22.3 GEOGRAPHIC PRESENCE
22.22.4 PRODUCT PORTFOLIO
22.22.5 RECENT DEVELOPMENTS
22.23 STANDARD CORPORATION INDIA LIMITED
22.23.1 COMPANY OVERVIEW
22.23.2 REVENUE ANALYSIS
22.23.3 GEOGRAPHIC PRESENCE
22.23.4 PRODUCT PORTFOLIO
22.23.5 RECENT DEVELOPMENTS
22.24 JCB
22.24.1 COMPANY OVERVIEW
22.24.2 REVENUE ANALYSIS
22.24.3 GEOGRAPHIC PRESENCE
22.24.4 PRODUCT PORTFOLIO
22.24.5 RECENT DEVELOPMENTS
22.25 CLAAS KGAA MBH
22.25.1 COMPANY OVERVIEW
22.25.2 REVENUE ANALYSIS
22.25.3 GEOGRAPHIC PRESENCE
22.25.4 PRODUCT PORTFOLIO
22.25.5 RECENT DEVELOPMENTS
22.26 ISEKI & CO.,LTD.
22.26.1 COMPANY OVERVIEW
22.26.2 REVENUE ANALYSIS
22.26.3 GEOGRAPHIC PRESENCE
22.26.4 PRODUCT PORTFOLIO
22.26.5 RECENT DEVELOPMENTS
22.27 SHIBAURA EUROPE BV
22.27.1 COMPANY OVERVIEW
22.27.2 REVENUE ANALYSIS
22.27.3 GEOGRAPHIC PRESENCE
22.27.4 PRODUCT PORTFOLIO
22.27.5 RECENT DEVELOPMENTS
22.28 HINOMOTO
22.28.1 COMPANY OVERVIEW
22.28.2 REVENUE ANALYSIS
22.28.3 GEOGRAPHIC PRESENCE
22.28.4 PRODUCT PORTFOLIO
22.28.5 RECENT DEVELOPMENTS
22.29 PREET GROUP
22.29.1 COMPANY OVERVIEW
22.29.2 REVENUE ANALYSIS
22.29.3 GEOGRAPHIC PRESENCE
22.29.4 PRODUCT PORTFOLIO
22.29.5 RECENT DEVELOPMENTS
22.30 MITSUBISHI
22.30.1 COMPANY OVERVIEW
22.30.2 REVENUE ANALYSIS
22.30.3 GEOGRAPHIC PRESENCE
22.30.4 PRODUCT PORTFOLIO
22.30.5 RECENT DEVELOPMENTS
22.31 TILMOR LLC
22.31.1 COMPANY OVERVIEW
22.31.2 REVENUE ANALYSIS
22.31.3 GEOGRAPHIC PRESENCE
22.31.4 PRODUCT PORTFOLIO
22.31.5 RECENT DEVELOPMENTS
*NOTE: THE COMPANIES PROFILED IS NOT EXHAUSTIVE LIST AND IS AS PER OUR PREVIOUS CLIENT REQUIREMENT. WE PROFILE MORE THAN 100 COMPANIES IN OUR STUDY AND HENCE THE LIST OF COMPANIES CAN BE MODIFIED OR REPLACED ON REQUEST
23. RELATED REPORTS
24. QUESTIONNAIRE
25. ABOUT DATA BRIDGE MARKET RESEARCH
Data collection and base year analysis are done using data collection modules with large sample sizes. The stage includes obtaining market information or related data through various sources and strategies. It includes examining and planning all the data acquired from the past in advance. It likewise envelops the examination of information inconsistencies seen across different information sources. The market data is analysed and estimated using market statistical and coherent models. Also, market share analysis and key trend analysis are the major success factors in the market report. To know more, please request an analyst call or drop down your inquiry.
The key research methodology used by DBMR research team is data triangulation which involves data mining, analysis of the impact of data variables on the market and primary (industry expert) validation. Data models include Vendor Positioning Grid, Market Time Line Analysis, Market Overview and Guide, Company Positioning Grid, Patent Analysis, Pricing Analysis, Company Market Share Analysis, Standards of Measurement, Global versus Regional and Vendor Share Analysis. To know more about the research methodology, drop in an inquiry to speak to our industry experts.
Data Bridge Market Research is a leader in advanced formative research. We take pride in servicing our existing and new customers with data and analysis that match and suits their goal. The report can be customized to include price trend analysis of target brands understanding the market for additional countries (ask for the list of countries), clinical trial results data, literature review, refurbished market and product base analysis. Market analysis of target competitors can be analyzed from technology-based analysis to market portfolio strategies. We can add as many competitors that you require data about in the format and data style you are looking for. Our team of analysts can also provide you data in crude raw excel files pivot tables (Fact book) or can assist you in creating presentations from the data sets available in the report.


