Global Automated Fare Collection Market
Market Size in USD Billion
CAGR :
% 
 USD
17.36 Billion
USD
46.82 Billion
2025
2033
USD
17.36 Billion
USD
46.82 Billion
2025
2033
| 2026 –2033 | |
| USD 17.36 Billion | |
| USD 46.82 Billion | |
| % | |
|
Automated Fare Collection Market Size
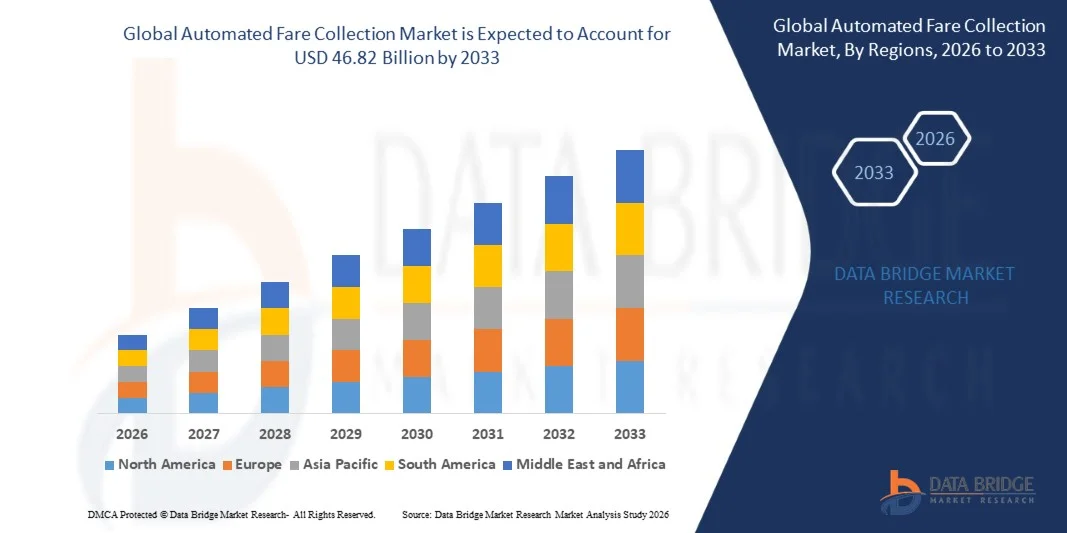
- The global automated fare collection market size was valued at USD 17.36 billion in 2025 and is expected to reach USD 46.82 billion by 2033, at a CAGR of 13.20% during the forecast period
- The market growth is largely fuelled by increasing urbanization, rising demand for contactless payment systems, and the expansion of public transportation networks across developed and developing regions
- Growing adoption of smart cards, mobile ticketing, and integrated fare collection solutions is further driving market expansion
Automated Fare Collection Market Analysis
- The automated fare collection market is witnessing significant adoption across metro, bus, and rail networks, driven by the need for efficient, secure, and seamless payment solutions
- Technological advancements such as contactless payments, NFC-enabled devices, and real-time ticketing analytics are enhancing system capabilities and user experience
- North America dominated the automated fare collection market with the largest revenue share of 38.75% in 2025, driven by the rapid expansion of public transportation networks, adoption of contactless payment systems, and growing urban commuter population
- Asia-Pacific region is expected to witness the highest growth rate in the global automated fare collection market, driven by rapid urbanization, increasing investment in public transport infrastructure, and rising adoption of contactless and mobile fare collection solutions in countries such as China, Japan, and India
- The Hardware segment held the largest market revenue share in 2025, driven by the widespread deployment of fare gates, ticket vending machines, and card readers across metro, bus, and rail networks. Hardware systems ensure secure, reliable, and efficient fare collection, making them a critical choice for transit operators. The segment continues to grow as new infrastructure projects and public transport expansions require advanced hardware for high-volume commuter management
Report Scope and Automated Fare Collection Market Segmentation
|
Attributes |
Automated Fare Collection Key Market Insights |
|
Segments Covered |
|
|
Countries Covered |
North America
Europe
Asia-Pacific
Middle East and Africa
South America
|
|
Key Market Players |
|
|
Market Opportunities |
|
|
Value Added Data Infosets |
In addition to the market insights such as market value, growth rate, market segments, geographical coverage, market players, and market scenario, the market report curated by the Data Bridge Market Research team includes in-depth expert analysis, import/export analysis, pricing analysis, production consumption analysis, and pestle analysis. |
Automated Fare Collection Market Trends
“Rising Demand for Contactless and Integrated Payment Solutions”
• The growing focus on seamless, cashless, and automated payment systems is significantly shaping the automated fare collection (AFC) market, as transit authorities and commuters increasingly prefer contactless, fast, and reliable fare solutions. AFC systems are gaining traction due to their ability to improve efficiency, reduce fare evasion, and simplify passenger experience without compromising security or convenience. This trend strengthens adoption across metro, bus, and rail networks, encouraging operators to implement integrated solutions that cater to evolving commuter expectations
• Increasing awareness around digital payments, commuter convenience, and urban mobility optimization has accelerated the adoption of AFC systems in public transport networks. Passengers and operators are actively seeking solutions that support mobile ticketing, smart cards, and NFC-enabled devices, prompting transit authorities to invest in modern fare collection infrastructure
• Technology and efficiency trends are influencing purchasing decisions, with operators emphasizing reliable system performance, scalability, and integration with other smart transport technologies. These factors are helping transit agencies differentiate services, reduce operational costs, and improve passenger satisfaction, while also driving adoption of cloud-based fare management and real-time analytics
• For instance, in 2024, Cubic Transportation Systems in the U.S. and Thales Group in France expanded their AFC product portfolios by incorporating mobile ticketing, contactless payments, and integrated transport management solutions. These implementations were in response to rising commuter demand for faster, safer, and more convenient payment options, with deployment across metro, bus, and rail networks. The systems were also promoted as enhancing operational efficiency and passenger experience, strengthening agency adoption and ridership satisfaction
• While demand for automated fare collection systems is growing, sustained market expansion depends on continuous innovation, cost-effective deployment, and maintaining system reliability and security. Vendors are also focusing on improving integration capabilities, scalability, and developing innovative solutions that balance cost, performance, and convenience for broader adoption
Automated Fare Collection Market Dynamics
Driver
“Growing Preference for Contactless and Integrated Payment Solutions”
• Rising demand for cashless, contactless, and convenient payment systems is a major driver for the AFC market. Transit authorities are increasingly adopting smart cards, mobile ticketing, and NFC-enabled solutions to improve operational efficiency, reduce fare evasion, and enhance passenger convenience
• Expanding public transport networks, growing urbanization, and rising commuter expectations are influencing market growth. AFC systems help streamline boarding processes, enable multi-modal integration, and support real-time passenger data management, facilitating smooth urban mobility
• Transit operators and technology providers are actively promoting AFC-based solutions through innovation, marketing campaigns, and smart city initiatives. These efforts are supported by growing commuter preference for digital payments and efficient transport services, encouraging partnerships between system integrators and transit authorities
• For instance, in 2023, Keolis in France and Transport for London (TfL) in the U.K. reported increased deployment of AFC systems across bus, metro, and rail networks. This expansion followed higher commuter adoption of contactless payments and integrated fare solutions, driving efficiency, reducing fare evasion, and improving passenger satisfaction. Both organizations also emphasized system reliability and interoperability in campaigns to strengthen trust and adoption
• Although rising digital payment and integration trends support growth, wider adoption depends on cost optimization, system standardization, and scalable deployment processes. Investment in advanced software, cloud infrastructure, and reliable hardware will be critical for meeting global demand and maintaining competitive advantage
Restraint/Challenge
“High Deployment Costs And Integration Complexity”
• The relatively higher cost of deploying AFC systems compared to conventional ticketing remains a key challenge, limiting adoption among smaller transit agencies. High infrastructure investment, system integration, and maintenance costs contribute to elevated pricing
• Awareness and technical expertise remain uneven, particularly in developing regions where digital payment adoption is still emerging. Limited understanding of system benefits restricts uptake across certain networks, leading to slower expansion in these markets
• Integration and operational challenges also impact market growth, as AFC systems require compatibility with legacy transport infrastructure, secure handling of passenger data, and adherence to regulatory standards. Logistical complexities and technical support requirements increase operational costs. Agencies must invest in training, system maintenance, and customer support to ensure smooth operations
• For instance, in 2024, transport authorities in Southeast Asia and Latin America reported slower AFC adoption due to high implementation costs and technical integration challenges. Ensuring interoperability with existing ticketing systems and training staff were additional barriers, affecting deployment timelines and commuter awareness
• Overcoming these challenges will require cost-efficient solutions, expanded technical support networks, and focused educational initiatives for transit operators and passengers. Collaboration with technology providers, financial institutions, and city planners can help unlock the long-term growth potential of the global AFC market. Furthermore, developing scalable, secure, and user-friendly systems will be essential for widespread adoption
Automated Fare Collection Market Scope
The market is segmented on the basis of component, service type, system, technology, application, and end user
• By Component
On the basis of component, the automated fare collection market is segmented into Hardware and Software. The Hardware segment held the largest market revenue share in 2025, driven by the widespread deployment of fare gates, ticket vending machines, and card readers across metro, bus, and rail networks. Hardware systems ensure secure, reliable, and efficient fare collection, making them a critical choice for transit operators. The segment continues to grow as new infrastructure projects and public transport expansions require advanced hardware for high-volume commuter management.
The Software segment is expected to witness the fastest growth rate from 2026 to 2033, fueled by increasing adoption of cloud-based fare management platforms, mobile ticketing apps, and real-time analytics solutions. Software enhances operational efficiency, enables remote monitoring, and supports integration with multimodal transport systems. Its growth is further accelerated by the rising demand for automated reporting, data-driven decision-making, and integration with smart city initiatives.
• By Service Type
On the basis of service type, the market is segmented into Consulting, System Implementation, Training, Support and Maintenance, and Managed Services. The System Implementation segment held the largest revenue share in 2025, due to the growing number of transit projects and modernization initiatives in public transport networks. Implementation services are essential for the seamless deployment of hardware and software, ensuring operational continuity and regulatory compliance.
The Managed Services segment is expected to witness the fastest growth from 2026 to 2033, driven by transit authorities outsourcing fare system operations and maintenance to improve efficiency, reduce operational costs, and ensure seamless service continuity. Increasing complexity of integrated fare collection systems and the need for 24/7 monitoring are fueling adoption of managed services.
• By System
On the basis of system, the market is segmented into Ticket Vending Machine (TVM), Ticket Office Machine (TOM), Fare Gates, and IC Cards. The Fare Gates segment held the largest market share in 2025, owing to their critical role in controlling passenger flow, reducing fare evasion, and supporting high-volume transit operations. Fare gates also enable better data collection for ridership analysis and improve overall commuter safety.
The IC Cards segment is expected to witness the fastest growth rate from 2026 to 2033, fueled by rising adoption of contactless smart card solutions, commuter convenience, and integration with mobile ticketing applications. IC cards allow faster boarding, multi-modal travel, and enhanced user experience, making them highly preferred in modern transit networks.
• By Technology
On the basis of technology, the market is segmented into Near-Field Communication (NFC), Magnetic Stripes, Smart Card, Optical Character Recognition (OCR), and Others. The Smart Card segment held the largest market revenue share in 2025, driven by its secure, durable, and widely accepted payment solution across global transit networks. Smart cards are also scalable for large transit systems and provide reliable transaction data for operators.
The NFC segment is expected to witness the fastest growth rate from 2026 to 2033, driven by rising adoption of mobile wallets, smartphone-based ticketing, and contactless fare payment systems. NFC enables touchless boarding, faster transactions, and integration with digital platforms, enhancing commuter convenience and operational efficiency.
• By Application
On the basis of application, the market is segmented into Rail and Transport, Parking, Theme Park, and Others. The Rail and Transport segment held the largest revenue share in 2025, due to increasing urbanization, expansion of metro and bus networks, and rising commuter demand for efficient fare solutions. Adoption is further supported by government initiatives to modernize public transport infrastructure.
The Parking segment is expected to witness the fastest growth from 2026 to 2033, fueled by smart parking initiatives, automated payment systems, and integration with city-wide mobility solutions. Rising urban traffic congestion and the need for convenient payment solutions are encouraging widespread deployment of automated parking fare systems.
• By End User
On the basis of end user, the market is segmented into Transportation and Logistics, Government, Media and Entertainment, Retail, and Others. The Transportation and Logistics segment held the largest market revenue share in 2025, driven by widespread adoption in public transit systems, operational efficiency, and the need to reduce fare evasion. Transit operators benefit from real-time tracking, data analytics, and smoother passenger flow.
The Government segment is expected to witness the fastest growth rate from 2026 to 2033, due to increasing investments in smart city initiatives, modernization of public transport infrastructure, and adoption of contactless fare collection systems. Government involvement ensures regulatory compliance, improved urban mobility, and promotion of sustainable, technology-driven transportation solutions.
Automated Fare Collection Market Regional Analysis
• North America dominated the automated fare collection market with the largest revenue share of 38.75% in 2025, driven by the rapid expansion of public transportation networks, adoption of contactless payment systems, and growing urban commuter population
• Transit authorities and commuters in the region highly value the convenience, speed, and security offered by automated fare collection systems, including smart cards, fare gates, and mobile ticketing solutions
• This widespread adoption is further supported by government initiatives to modernize transit infrastructure, integration with multimodal transport networks, and the growing preference for cashless and efficient payment systems
U.S. Automated Fare Collection Market Insight
The U.S. automated fare collection market captured the largest revenue share in 2025 within North America, fueled by the expansion of metro, bus, and rail networks and increasing commuter adoption of contactless payments. Transit operators are prioritizing system integration, real-time analytics, and mobile ticketing to enhance operational efficiency and passenger experience. Furthermore, the integration of AFC solutions with smart city initiatives and IoT-based mobility platforms is significantly contributing to market expansion.
Europe Automated Fare Collection Market Insight
The Europe automated fare collection market is expected to witness the fastest growth rate from 2026 to 2033, primarily driven by investments in modernizing public transport infrastructure, government regulations supporting cashless payments, and growing commuter demand for seamless ticketing solutions. Urbanization and adoption of smart mobility platforms are further encouraging AFC implementation across rail, metro, and bus networks.
U.K. Automated Fare Collection Market Insight
The U.K. automated fare collection market is expected to witness the fastest growth rate from 2026 to 2033, driven by the increasing trend of digital payments, enhanced passenger convenience, and government initiatives for integrated transit solutions. Concerns regarding fare evasion and operational efficiency are prompting transport authorities to implement automated, contactless systems across major cities.
Germany Automated Fare Collection Market Insight
The Germany automated fare collection market is expected to witness the fastest growth rate from 2026 to 2033, fueled by government-led modernization programs, technological advancements in fare management software, and rising adoption of mobile ticketing. Germany’s emphasis on smart city initiatives and sustainable urban transport solutions promotes widespread AFC deployment, particularly across metro and rail networks.
Asia-Pacific Automated Fare Collection Market Insight
The Asia-Pacific automated fare collection market is expected to witness the fastest growth rate from 2026 to 2033, driven by rapid urbanization, expanding public transport systems, and increasing adoption of contactless and mobile ticketing solutions in countries such as China, Japan, and India. Government initiatives supporting smart city projects and digital payments are further accelerating AFC adoption in the region.
Japan Automated Fare Collection Market Insight
The Japan automated fare collection market is expected to witness the fastest growth rate from 2026 to 2033, due to the country’s high urban density, advanced technological infrastructure, and growing commuter preference for convenient, contactless payment systems. Integration with mobile applications, smart cards, and IC card-based fare solutions is driving the adoption of AFC systems across metro, rail, and bus networks.
China Automated Fare Collection Market Insight
The China automated fare collection market accounted for the largest market revenue share in Asia-Pacific in 2025, attributed to the country’s expanding metro and bus networks, rapid urbanization, and rising adoption of smart card and mobile-based fare solutions. The push towards smart cities, government initiatives to modernize public transport infrastructure, and strong domestic system integrators are key factors propelling the market in China.
Automated Fare Collection Market Share
The Automated Fare Collection industry is primarily led by well-established companies, including:
- Cubic Corporation (U.S.)
- Indra (Spain)
- Thales Group (France)
- GMV (Spain)
- ST Engineering (Singapore)
- Atos SE (France)
- Longbow Technologies Sdn Bhd (Malaysia)
- Samsung (South Korea)
- Genfare (U.S.)
- Advanced Card Systems Ltd. (Hong Kong)
- NIPPON SIGNAL CO., LTD. (Japan)
- OMRON Corporation (Japan)
- Vix Technology (Australia)
- Scheidt & Bachmann GmbH (Germany)
- Siemens (Germany)
- NXP Semiconductors (Netherlands)
- LG CNS (South Korea)
- Sony Corporation (Japan)
- LECIP HOLDINGS CORPORATION (Japan)
- Masabi Ltd (U.K.)
SKU-
Get online access to the report on the World's First Market Intelligence Cloud

- Interactive Data Analysis Dashboard
- Company Analysis Dashboard for high growth potential opportunities
- Research Analyst Access for customization & queries
- Competitor Analysis with Interactive dashboard
- Latest News, Updates & Trend analysis
- Harness the Power of Benchmark Analysis for Comprehensive Competitor Tracking
Research Methodology
Data collection and base year analysis are done using data collection modules with large sample sizes. The stage includes obtaining market information or related data through various sources and strategies. It includes examining and planning all the data acquired from the past in advance. It likewise envelops the examination of information inconsistencies seen across different information sources. The market data is analysed and estimated using market statistical and coherent models. Also, market share analysis and key trend analysis are the major success factors in the market report. To know more, please request an analyst call or drop down your inquiry.
The key research methodology used by DBMR research team is data triangulation which involves data mining, analysis of the impact of data variables on the market and primary (industry expert) validation. Data models include Vendor Positioning Grid, Market Time Line Analysis, Market Overview and Guide, Company Positioning Grid, Patent Analysis, Pricing Analysis, Company Market Share Analysis, Standards of Measurement, Global versus Regional and Vendor Share Analysis. To know more about the research methodology, drop in an inquiry to speak to our industry experts.
Customization Available
Data Bridge Market Research is a leader in advanced formative research. We take pride in servicing our existing and new customers with data and analysis that match and suits their goal. The report can be customized to include price trend analysis of target brands understanding the market for additional countries (ask for the list of countries), clinical trial results data, literature review, refurbished market and product base analysis. Market analysis of target competitors can be analyzed from technology-based analysis to market portfolio strategies. We can add as many competitors that you require data about in the format and data style you are looking for. Our team of analysts can also provide you data in crude raw excel files pivot tables (Fact book) or can assist you in creating presentations from the data sets available in the report.

