Global Bioenergy Market
Market Size in USD Million
 USD
112,400.00 Million
USD
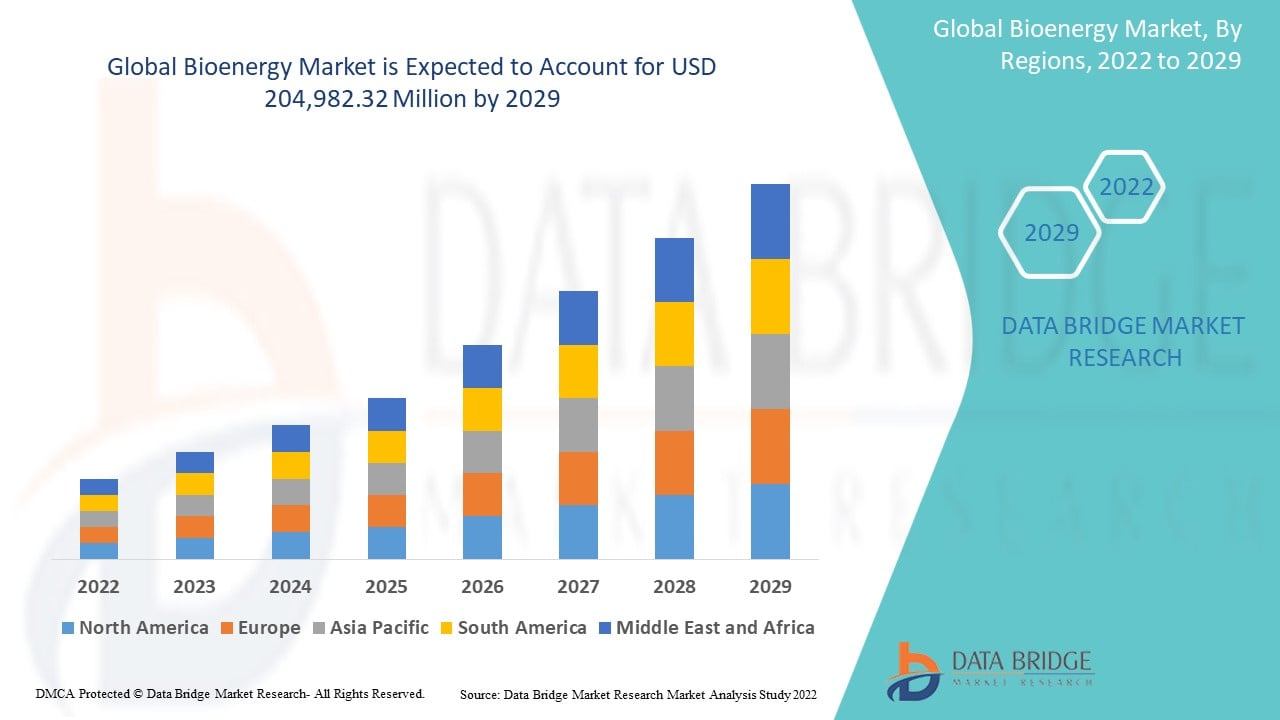
204,982.32 Million
2021
2029
USD
112,400.00 Million
USD
204,982.32 Million
2021
2029
| 2022 - 2029 | |
| USD 112,400.00 Million | |
| USD 204,982.32 Million | |
| % | |
|
Bioenergy Market Analysis and Size
Bioenergy is a renewable source of energy in achieving the global climate change targets and wider environmental, sustainable targets and socioeconomic. Bioenergy possesses several key advantages such as energy reliability and security, cost saving, biodegradability, better air quality, reduced landfills, and others. Furthermore, Solid waste is the highest product type segment due to the increase in solid waste generation from commercial, residential and industrial sectors, which can be increasingly used in bioenergy generation during the forecast period of 2022-2029. Moreover, the rapid growth of the renewable energy industry due to an increase in awareness and investments toward benefits of renewable energy in developing countries considerably contribute to the growth of the global bioenergy market.
Global bioenergy market was valued at USD 112,400.0 million in 2021 and is expected to reach USD 204,982.32 million by 2029, registering a CAGR of 7.80% during the forecast period of 2022-2029. The market report curated by the Data Bridge Market Research team includes technological advancements, regulatory framework, PESTEL, porter's five forces analysis, industry standards-at a glance, raw material costs/ operational expenditure-overview, supply chain analysis, vendor selection criteria, pricing analysis, production analysis, and climate chain scenario.
Report Scope and Market Segmentation
|
Report Metric |
Details |
|
Forecast Period |
2022 to 2029 |
|
Base Year |
2021 |
|
Historic Years |
2020 (Customizable to 2014 - 2019) |
|
Quantitative Units |
Revenue in USD Million, Volumes in Units, Pricing in USD |
|
Segments Covered |
Product Type (Solid Biomass, Liquid Biofuel, Biogas, Others), Feedstock (Agricultural Waste, Wood Waste, Solid Waste, and Others), Technology (Gasification, Fast Pyrolysis, Fermentation, Other Technologies), Application (Power Generation, Heat Generation, Transportation, Others) |
|
Countries Covered |
U.S., Canada and Mexico in North America, Germany, France, U.K., Netherlands, Switzerland, Belgium, Russia, Italy, Spain, Turkey, Poland, Norway, Finland, Rest of Europe in Europe, China, Japan, India, South Korea, Singapore, Malaysia, Australia, Thailand, Indonesia, Philippines, Rest of Asia-Pacific (APAC) in the Asia-Pacific (APAC), Saudi Arabia, U.A.E, Israel, Egypt, South Africa, Nigeria, Algeria, Angola, Ghana, Rest of Middle East and Africa (MEA) as a part of Middle East and Africa (MEA), Brazil, Argentina and Rest of South America as part of South America |
|
Market Players Covered |
Renewable Energy Group, Inc. (U.S.), Mitsubishi Heavy Industries Ltd (Japan), MVV Energie AG (Germany), A2A SpA (Italy), Hitachi Zosen Corporation (Japan), BTG Biomass Technology Group (Netherland), Babcock & Wilcox Enterprises, Inc. (Sweden), Biomass Engineering Ltd (Indiana), Orsted (Denmark), Enerkem (Canada), Fortum (Finland), EnviTec Biogas AG (Germany), Pacific Bioenergy Corporation (Canada), Shell Plc (U.K.), BP Plc (U.K.) |
|
Market Opportunities |
|
Market Definition
Bioenergy is one of several diverse resources available to help consumer meet their energy requirement. Energy generated using bio-based renewable sources such as biomass, biofuel, biogas and other bio-organic waste is known as bioenergy. It is a form of renewable energy which is derived from recently living organic materials that is also known as biomass, it can be used to produce heat, electricity, transportation fuels and products.
Bioenergy Market Dynamics
Drivers
- High demand of bioenergy
Bioenergy is high in demand as compared to conventional energy because the resources of bioenergy provide improved biodegradability, minimized carbon footprint, better energy reliability, reduced landfills and enhanced air quality. It can also reducing the energy bills and reliance on fossil fuels. These are the major factors which are expected to drive the growth rate of bioenergy market.
- Rising demand of solid waste
Solid wastes are widely used for several purposes such as transportation fuels, heat generation, sustainable electricity, and other purposes, which is anticipated to fuel the demand of the solid waste and drive the growth rate of the bioenergy market during the analyzed time frame.
Moreover, the utilization of renewable energy sources will encourage the manufacturer to expand their industry. Additionally, factors such as increasing industrialization, rapid urbanization, and growing awareness regarding the benefits of using bioenergy will further foster the market's growth rate.
Opportunities
- Growing expenditure for bioenergy industry
The surging initiatives and expenditure by market players further offer numerous growth opportunities within the market. For instance, the US Department of Energy and NREL (National Renewable Energy Laboratory) have launched several initiatives in the bioenergy industry. Moreover, the Department of Energy (DOE) has announced that the financing for 33 projects, which will be more than USD 97 million, will help in research and development activities.
- Surging favorable government initiatives and policies
Eco-friendly initiatives by the government are projected to increase the expansion rate of the bioenergy market over the forecast period. Governments offer various incentives that are lowering the expenses of component used in the production of bioenergy and predicted to improve the bioenergy market. As a result, the favorable government rules and policies associated with greener energy initiatives and the carbon footprint reduction create immense and various opportunities for the bioenergy market.
Restraints/Challenges
- High Overall Costs
The growth rate of the bioenergy market is slowed due to its high capital cost. Furthermore, there are many other logistical challenges associated with the bioenergy. The high initial cost associated with installation of bioenergy plant and rapid growth of the electric vehicle industry is hampering the growth of the bioenergy market.
This bioenergy market report provides details of new recent developments, trade regulations, import-export analysis, production analysis, value chain optimization, market share, impact of domestic and localized market players, analyses opportunities in terms of emerging revenue pockets, changes in market regulations, strategic market growth analysis, market size, category market growths, application niches and dominance, product approvals, product launches, geographic expansions, technological innovations in the market. To gain more info on the bioenergy market contact Data Bridge Market Research for an Analyst Brief, our team will help you take an informed market decision to achieve market growth.
COVID-19 Impact on Bioenergy Market
The outbreak of COVID-19 pandemic has affected several industries and nations due the imposed of lockdowns, temporary ban by government on import, export, manufacturing and processing activities across the globe. Furthermore, funding for R&D activities and installation of bioenergy plants on development of bioenergy were on hold. This resulted in a decrease in the bioenergy market's growth in the second, third, and fourth quarters of 2020. However, the bioenergy market is anticipated to recover by the second quarter of 2021 as COVID-19 vaccination began in many economies of overall globe, which is anticipated to recover global economy, manufacturing operations and restarts R&D facilities in the bioenergy market.
Recent Developments
- In June 2021, EnviTec Biogas AG has signed a contract with Liquind 24/7 GmbH. This contract aims to distribute bio-LNG produced by EnviTec Biogas AG at Gustrow in Germany to heavy-duty customers at its truck fueling stations.
- After a brief 12-month building phase, In 2021 EnviTec Biogas AG started operating its biogas production in China. Turkey litter, Maize stover silage, and dairy cattle dung would be the inputs for the 1,570 Nm3 biogas facility in Shanxi province.
Global Bioenergy Market Scope
The bioenergy market is segmented on the basis of product type, technology, feedstock and application. The growth amongst these segments will help you analyze meagre growth segments in the industries and provide the users with a valuable market overview and market insights to help them make strategic decisions for identifying core market applications.
Product Type
- Solid Biomass
- Liquid Biofuel
- Biogas
- Others
Feedstock
- Agricultural Waste
- Wood Waste
- Solid Waste
- Others
Technology
- Gasification
- Fast Pyrolysis
- Fermentation
- Other Technologies
Application
- Power Generation
- Heat Generation
- Transportation
- Others
Bioenergy Market Regional Analysis/Insights
The bioenergy market is analyzed, and market size insights and trends are provided by country, product type, technology, feedstock and application as referenced above.
The countries covered in the bioenergy market report are U.S., Canada and Mexico in North America, Germany, France, U.K., Netherlands, Switzerland, Belgium, Russia, Italy, Spain, Turkey, Poland, Norway, Finland, Rest of Europe in Europe, China, Japan, India, South Korea, Singapore, Malaysia, Australia, Thailand, Indonesia, Philippines, Rest of Asia-Pacific (APAC) in the Asia-Pacific (APAC), Saudi Arabia, U.A.E, Israel, Egypt, South Africa, Nigeria, Algeria, Angola, Ghana, Rest of Middle East and Africa (MEA) as a part of Middle East and Africa (MEA), Brazil, Argentina and Rest of South America as part of South America.
North America dominates the bioenergy market in terms of market revenue and market share and due to the favorable government regulations and increasing biofuel consumption in this region.
Asia-Pacific, on the other hand, is the fastest growing region and shows lucrative growth over the forecast period of 2022 to 2029 due to enormous population and rising energy consumption in this region.
The country section of the report also provides individual market impacting factors and changes in market regulation that impact the current and future trends of the market. Data points like down-stream and upstream value chain analysis, technical trends and porter's five forces analysis, case studies are some of the pointers used to forecast the market scenario for individual countries. Also, the presence and availability of global brands and their challenges faced due to large or scarce competition from local and domestic brands, impact of domestic tariffs and trade routes are considered while providing forecast analysis of the country data.
Competitive Landscape and Bioenergy Market Share Analysis
The bioenergy market competitive landscape provides details by competitor. Details included are company overview, company financials, revenue generated, market potential, investment in research and development, new market initiatives, global presence, production sites and facilities, production capacities, company strengths and weaknesses, product launch, product width and breadth, application dominance. The above data points provided are only related to the companies' focus related to bioenergy market.
Some of the major players operating in the bioenergy market are
- Renewable Energy Group, Inc. (U.S.)
- Mitsubishi Heavy Industries Ltd (Japan)
- MVV Energie AG (Germany)
- A2A SpA (Italy)
- Hitachi Zosen Corporation (Japan)
- BTG Biomass Technology Group (Netherland)
- Babcock & Wilcox Enterprises, Inc. (Sweden)
- Biomass Engineering Ltd (Indiana)
- Orsted (Denmark)
- Enerkem (Canada)
- Fortum (Finland)
- EnviTec Biogas AG (Germany)
- Pacific Bioenergy Corporation (Canada)
- Shell Plc (U.K.)
- BP Plc (U.K.))
SKU-

- Interactive Data Analysis Dashboard
- Company Analysis Dashboard for high growth potential opportunities
- Research Analyst Access for customization & queries
- Competitor Analysis with Interactive dashboard
- Latest News, Updates & Trend analysis
- Harness the Power of Benchmark Analysis for Comprehensive Competitor Tracking
Table of Content
1. INTRODUCTION
1.1 OBJECTIVES OF THE STUDY
1.2 MARKET DEFINITION
1.3 OVERVIEW OF GLOBAL BIOENERGY MARKET
1.4 CURRENCY AND PRICING
1.5 LIMITATION
1.6 MARKETS COVERED
2. MARKET SEGMENTATION
2.1 KEY TAKEAWAYS
2.2 ARRIVING AT THE GLOBAL BIOENERGY MARKET
2.3 VENDOR POSITIONING GRID
2.4 TECHNOLOGY LIFE LINE CURVE
2.5 MARKET GUIDE
2.6 MULTIVARIATE MODELLING
2.7 TOP TO BOTTOM ANALYSIS
2.8 STANDARDS OF MEASUREMENT
2.9 VENDOR SHARE ANALYSIS
2.10 DATA POINTS FROM KEY PRIMARY INTERVIEWS
2.11 DATA POINTS FROM KEY SECONDARY DATABASES
2.12 GLOBAL BIOENERGY MARKET: RESEARCH SNAPSHOT
2.13 ASSUMPTIONS
3. MARKET OVERVIEW
3.1 DRIVERS
3.2 RESTRAINTS
3.3 OPPORTUNITIES
3.4 CHALLENGES
4. EXECUTIVE SUMMARY
5. PREMIUM INSIGHTS
5.1 VALUE CHAIN ANALYSIS
5.2 BRAND ANALYSIS
5.3 ECOSYSTEM MARKET MAP
5.4 TECHNOLOGICAL TRENDS
5.5 TOP WINNING STRATEGIES
5.6 PORTER’S FIVE FORCES ANALYSIS
6. GLOBAL BIOENERGY MARKET, BY PRODUCT TYPE, 2020-2029, (USD MILLION)
(ASP, VALUE & VOLUME WILL BE PROVIDED FOR ALL THE SEGMENTS)
6.1 OVERVIEW
6.2 SOLID BIOMASS
6.2.1 BY MATERIAL
6.2.1.1. TIMBER
6.2.1.2. COMPOST
6.2.1.3. WASTE
6.2.1.4. SUGARCANE
6.2.1.5. STRAW
6.2.1.6. SAWDUST
6.2.1.7. WOOD CHIPS
6.2.1.8. BARK CHIPS
6.2.1.9. OTHERS
6.3 LIQUID BIOFUEL
6.4 BIOETHANOL
6.5 BIODIESEL
6.6 RENEWABLE DIESEL
6.7 BIOGAS
6.8 BIOLUBRICANTS
6.9 RENEWABLE WASTE
6.10 OTHERS
7. GLOBAL BIOENERGY MARKET, BY FEEDSTOCK, 2020-2029, (USD MILLION)
7.1 OVERVIEW
7.2 AGRICULTURAL WASTE
7.3 WOOD WASTE
7.4 SOLID WASTE
7.5 RECYCLED COOKING OIL
7.6 DISTILLERS CORN OIL
7.7 ANIMAL FATS
7.8 VEGETABLE OILS
7.9 OTHERS
8. GLOBAL BIOENERGY MARKET, BY TECHNOLOGY, 2020-2029, (USD MILLION)
8.1 OVERVIEW
8.2 GASIFICATION
8.3 FAST PYROLYSIS
8.4 FERMENTATION
8.5 OTHER TECHNOLOGIES
9. GLOBAL BIOENERGY MARKET, BY APPLICATION, 2020-2029, (USD MILLION)
9.1 OVERVIEW
9.2 POWER GENERATION
9.3 HEAT GENERATION
9.4 TRANSPORTATION
9.4.1 TRANSPORTATION, BY TYPE
9.4.1.1. PASSENGER VEHICLES
9.4.1.2. TRUCKS
9.4.1.3. SHIPS
9.4.1.4. AIRPLANES
9.4.1.5. OTHERS
9.5 HEATING & COOKING
9.6 OFF GRID ELECTRICITY SUPPLY
9.7 OTHERS
10. GLOBAL BIOENERGY MARKET, BY REGION, 2020-2029, (USD MILLION)
10.1 GLOBAL BIOENERGY MARKET, (ALL SEGMENTATION PROVIDED ABOVE IS REPRESENTED IN THIS CHAPTER BY COUNTRY)
10.1.1 NORTH AMERICA
10.1.1.1. U.S.
10.1.1.2. CANADA
10.1.1.3. MEXICO
10.1.2 EUROPE
10.1.2.1. GERMANY
10.1.2.2. FRANCE
10.1.2.3. U.K.
10.1.2.4. ITALY
10.1.2.5. SPAIN
10.1.2.6. RUSSIA
10.1.2.7. TURKEY
10.1.2.8. BELGIUM
10.1.2.9. NETHERLANDS
10.1.2.10. SWITZERLAND
10.1.2.11. DENMARK
10.1.2.12. SWEDEN
10.1.2.13. POLAND
10.1.2.14. NORWAY
10.1.2.15. FINLAND
10.1.2.16. REST OF EUROPE
10.1.3 ASIA PACIFIC
10.1.3.1. JAPAN
10.1.3.2. CHINA
10.1.3.3. SOUTH KOREA
10.1.3.4. INDIA
10.1.3.5. AUSTRALIA
10.1.3.6. SINGAPORE
10.1.3.7. THAILAND
10.1.3.8. MALAYSIA
10.1.3.9. INDONESIA
10.1.3.10. PHILIPPINES
10.1.3.11. NEW ZEALAND
10.1.3.12. TAIWAN
10.1.3.13. VIETNAM
10.1.3.14. REST OF ASIA PACIFIC
10.1.4 SOUTH AMERICA
10.1.4.1. BRAZIL
10.1.4.2. ARGENTINA
10.1.4.3. REST OF SOUTH AMERICA
10.1.5 MIDDLE EAST AND AFRICA
10.1.5.1. SOUTH AFRICA
10.1.5.2. EGYPT
10.1.5.3. BAHRAIN
10.1.5.4. QATAR
10.1.5.5. KUWAIT
10.1.5.6. OMAN
10.1.5.7. SAUDI ARABIA
10.1.5.8. U.A.E
10.1.5.9. ISRAEL
10.1.5.10. REST OF MIDDLE EAST AND AFRICA
10.2 KEY PRIMARY INSIGHTS: BY MAJOR COUNTRIES
11. GLOBAL BIOENERGY MARKET, COMPANY LANDSCAPE
11.1 COMPANY SHARE ANALYSIS: NORTH AMERICA
11.2 COMPANY SHARE ANALYSIS: EUROPE
11.3 COMPANY SHARE ANALYSIS: ASIA-PACIFIC
11.4 MERGERS & ACQUISITIONS
11.5 NEW PRODUCT DEVELOPMENT & APPROVALS
11.6 EXPANSIONS
11.7 REGULATORY CHANGES
11.8 PARTNERSHIP AND OTHER STRATEGIC DEVELOPMENTS
12. GLOBAL BIOENERGY MARKET, SWOT ANALYSIS
13. GLOBAL BIOENERGY MARKET, COMPANY PROFILE, 2020-2029, (USD MILLION)
13.1 CHEVRON RENEWABLE ENERGY GROUP, INC.
13.1.1 COMPANY SNAPSHOT
13.1.2 REVENUE ANALYSIS
13.1.3 GEOGRAPHIC PRESENCE
13.1.4 PRODUCT PORTFOLIO
13.1.5 RECENT DEVELOPMENTS
13.2 MITSUBISHI HEAVY INDUSTRIES, LTD.
13.2.1 COMPANY SNAPSHOT
13.2.2 REVENUE ANALYSIS
13.2.3 GEOGRAPHIC PRESENCE
13.2.4 PRODUCT PORTFOLIO
13.2.5 RECENT DEVELOPMENTS
13.3 MVV ENERGIE AG
13.3.1 COMPANY SNAPSHOT
13.3.2 REVENUE ANALYSIS
13.3.3 GEOGRAPHIC PRESENCE
13.3.4 PRODUCT PORTFOLIO
13.3.5 RECENT DEVELOPMENTS
13.4 A2A S.P.A
13.4.1 COMPANY SNAPSHOT
13.4.2 REVENUE ANALYSIS
13.4.3 GEOGRAPHIC PRESENCE
13.4.4 PRODUCT PORTFOLIO
13.4.5 RECENT DEVELOPMENTS
13.5 HITACHI ZOSEN CORPORATION
13.5.1 COMPANY SNAPSHOT
13.5.2 REVENUE ANALYSIS
13.5.3 GEOGRAPHIC PRESENCE
13.5.4 PRODUCT PORTFOLIO
13.5.5 RECENT DEVELOPMENTS
13.6 BTG BIOMASS TECHNOLOGY GROUP
13.6.1 COMPANY SNAPSHOT
13.6.2 REVENUE ANALYSIS
13.6.3 GEOGRAPHIC PRESENCE
13.6.4 PRODUCT PORTFOLIO
13.6.5 RECENT DEVELOPMENTS
13.7 BABCOCK & WILCOX ENTERPRISES, INC.
13.7.1 COMPANY SNAPSHOT
13.7.2 REVENUE ANALYSIS
13.7.3 GEOGRAPHIC PRESENCE
13.7.4 PRODUCT PORTFOLIO
13.7.5 RECENT DEVELOPMENTS
13.8 BIO-ENERGY ENGINEERING
13.8.1 COMPANY SNAPSHOT
13.8.2 REVENUE ANALYSIS
13.8.3 GEOGRAPHIC PRESENCE
13.8.4 PRODUCT PORTFOLIO
13.8.5 RECENT DEVELOPMENTS
13.9 BIOMASS ENGINEERING
13.9.1 COMPANY SNAPSHOT
13.9.2 REVENUE ANALYSIS
13.9.3 GEOGRAPHIC PRESENCE
13.9.4 PRODUCT PORTFOLIO
13.9.5 RECENT DEVELOPMENTS
13.10 ØRSTED A/S
13.10.1 COMPANY SNAPSHOT
13.10.2 REVENUE ANALYSIS
13.10.3 GEOGRAPHIC PRESENCE
13.10.4 PRODUCT PORTFOLIO
13.10.5 RECENT DEVELOPMENTS
13.11 ENERKEM
13.11.1 COMPANY SNAPSHOT
13.11.2 REVENUE ANALYSIS
13.11.3 GEOGRAPHIC PRESENCE
13.11.4 PRODUCT PORTFOLIO
13.11.5 RECENT DEVELOPMENTS
13.12 FORTUM
13.12.1 COMPANY SNAPSHOT
13.12.2 REVENUE ANALYSIS
13.12.3 GEOGRAPHIC PRESENCE
13.12.4 PRODUCT PORTFOLIO
13.12.5 RECENT DEVELOPMENTS
13.13 ENVITEC BIOGAS AG
13.13.1 COMPANY SNAPSHOT
13.13.2 REVENUE ANALYSIS
13.13.3 GEOGRAPHIC PRESENCE
13.13.4 PRODUCT PORTFOLIO
13.13.5 RECENT DEVELOPMENTS
13.14 SHELL PLC
13.14.1 COMPANY SNAPSHOT
13.14.2 REVENUE ANALYSIS
13.14.3 GEOGRAPHIC PRESENCE
13.14.4 PRODUCT PORTFOLIO
13.14.5 RECENT DEVELOPMENTS
13.15 BP PLC
13.15.1 COMPANY SNAPSHOT
13.15.2 REVENUE ANALYSIS
13.15.3 GEOGRAPHIC PRESENCE
13.15.4 PRODUCT PORTFOLIO
13.15.5 RECENT DEVELOPMENTS
13.16 ENVIVA
13.16.1 COMPANY SNAPSHOT
13.16.2 REVENUE ANALYSIS
13.16.3 GEOGRAPHIC PRESENCE
13.16.4 PRODUCT PORTFOLIO
13.16.5 RECENT DEVELOPMENTS
13.17 GREEN PLAINS INC.
13.17.1 COMPANY SNAPSHOT
13.17.2 REVENUE ANALYSIS
13.17.3 GEOGRAPHIC PRESENCE
13.17.4 PRODUCT PORTFOLIO
13.17.5 RECENT DEVELOPMENTS
13.18 LIGNETICS
13.18.1 COMPANY SNAPSHOT
13.18.2 REVENUE ANALYSIS
13.18.3 GEOGRAPHIC PRESENCE
13.18.4 PRODUCT PORTFOLIO
13.18.5 RECENT DEVELOPMENTS
13.19 DRAX GROUP
13.19.1 COMPANY SNAPSHOT
13.19.2 REVENUE ANALYSIS
13.19.3 GEOGRAPHIC PRESENCE
13.19.4 PRODUCT PORTFOLIO
13.19.5 RECENT DEVELOPMENTS
13.20 ENEXOR ENERGY
13.20.1 COMPANY SNAPSHOT
13.20.2 REVENUE ANALYSIS
13.20.3 GEOGRAPHIC PRESENCE
13.20.4 PRODUCT PORTFOLIO
13.20.5 RECENT DEVELOPMENTS
13.21 AMERESCO INC
13.21.1 COMPANY SNAPSHOT
13.21.2 REVENUE ANALYSIS
13.21.3 GEOGRAPHIC PRESENCE
13.21.4 PRODUCT PORTFOLIO
13.21.5 RECENT DEVELOPMENTS
13.22 POET
13.22.1 COMPANY SNAPSHOT
13.22.2 REVENUE ANALYSIS
13.22.3 GEOGRAPHIC PRESENCE
13.22.4 PRODUCT PORTFOLIO
13.22.5 RECENT DEVELOPMENTS
13.23 ADM
13.23.1 COMPANY SNAPSHOT
13.23.2 REVENUE ANALYSIS
13.23.3 GEOGRAPHIC PRESENCE
13.23.4 PRODUCT PORTFOLIO
13.23.5 RECENT DEVELOPMENTS
NOTE: THE COMPANIES PROFILED IS NOT EXHAUSTIVE LIST AND IS AS PER OUR PREVIOUS CLIENT REQUIREMENT. WE PROFILE MORE THAN 100 COMPANIES IN OUR STUDY AND HENCE THE LIST OF COMPANIES CAN BE MODIFIED OR REPLACED ON REQUEST
14. RELATED REPORTS
15. QUESTIONNAIRE
16. ABOUT DATA BRIDGE MARKET RESEARCH
Data collection and base year analysis are done using data collection modules with large sample sizes. The stage includes obtaining market information or related data through various sources and strategies. It includes examining and planning all the data acquired from the past in advance. It likewise envelops the examination of information inconsistencies seen across different information sources. The market data is analysed and estimated using market statistical and coherent models. Also, market share analysis and key trend analysis are the major success factors in the market report. To know more, please request an analyst call or drop down your inquiry.
The key research methodology used by DBMR research team is data triangulation which involves data mining, analysis of the impact of data variables on the market and primary (industry expert) validation. Data models include Vendor Positioning Grid, Market Time Line Analysis, Market Overview and Guide, Company Positioning Grid, Patent Analysis, Pricing Analysis, Company Market Share Analysis, Standards of Measurement, Global versus Regional and Vendor Share Analysis. To know more about the research methodology, drop in an inquiry to speak to our industry experts.
Data Bridge Market Research is a leader in advanced formative research. We take pride in servicing our existing and new customers with data and analysis that match and suits their goal. The report can be customized to include price trend analysis of target brands understanding the market for additional countries (ask for the list of countries), clinical trial results data, literature review, refurbished market and product base analysis. Market analysis of target competitors can be analyzed from technology-based analysis to market portfolio strategies. We can add as many competitors that you require data about in the format and data style you are looking for. Our team of analysts can also provide you data in crude raw excel files pivot tables (Fact book) or can assist you in creating presentations from the data sets available in the report.


