
Global Fermented Drinks Market
Market Size in USD Billion
 USD
4.51 Billion
USD
7.13 Billion
2025
2033
USD
4.51 Billion
USD
7.13 Billion
2025
2033
| 2026 - 2033 | |
| USD 4.51 Billion | |
| USD 7.13 Billion | |
| % | |
|
Fermented Drinks Market Overview
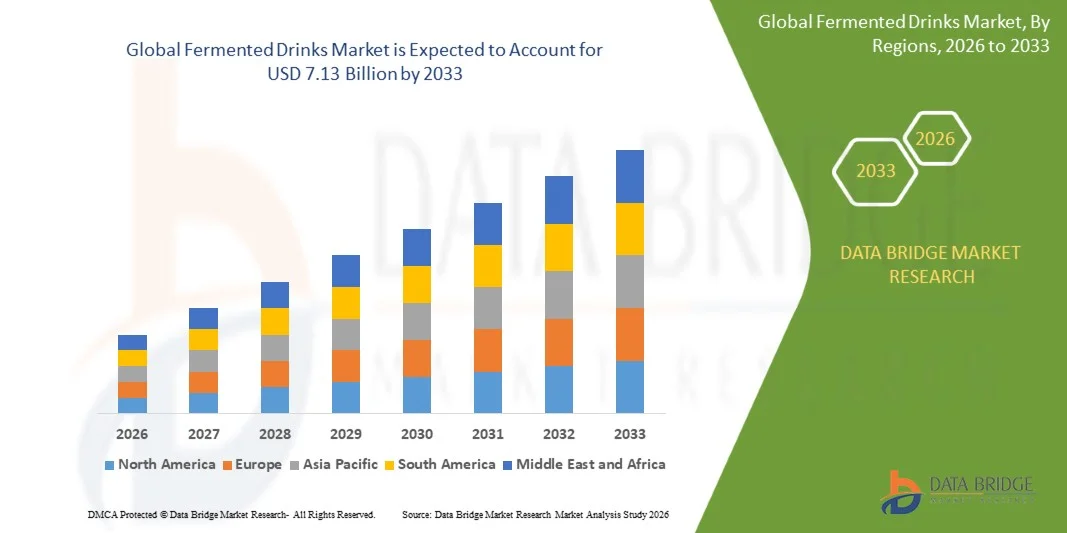
As per Data Bridge Market Research analysis The fermented drinks market was valued at USD 4.51 billion in 2025 and is projected to reach USD 7.13 billion by 2033, growing at a CAGR of 5.90% from 2026 to 2033. The market is experiencing consistent growth driven by rising consumer awareness of probiotic benefits, increasing demand for functional beverages supporting digestion and wellness, and growing preference for natural, organic, and plant-based fermented alternatives such as kombucha and kefir.
The increasing focus on gut health, immunity, and healthier lifestyle choices, combined with the shift toward low- and no-alcohol beverage options, is encouraging manufacturers to expand fermented drink portfolios. Alcoholic fermented beverages continue to dominate market value, while non-alcoholic probiotic beverages are witnessing faster growth due to wellness-focused consumer trends. Advancements in fermentation technologies, premium product innovation, sustainable packaging solutions, and expanding online retail channels are further supporting market expansion across global regions.
Market Size & Forecast
- Global Market Value (2025): USD 4.51 Billion
- Expected Market Value (2033): USD 7.13 Billion
- Forecast CAGR (2026–2033): 5.90%
- Leading Region in 2025: Asia Pacific
- Fastest Growing Region: Europe
Key Market Trends & Insights
- Asia-Pacific dominated the fermented drinks market with the largest revenue share of 33.82% in 2025, supported by high beer consumption volumes, strong traditional fermented beverage demand, and increasing adoption of kombucha and kefir across countries such as China, Japan, and India
- The alcoholic fermented beverages segment led the market with a 76.32% share in 2025, driven by established consumer consumption patterns, extensive production infrastructure, and strong global distribution networks
- Europe is expected to be the fastest-growing region at a CAGR of 9.5% from 2026 to 2033, fueled by strong traditional consumption of fermented beverages, rising consumer focus on gut health and wellness, and increasing demand for probiotic drinks such as kefir and kombucha
- Non-alcoholic fermented beverages are the fastest-growing type, projected to register a CAGR of 8.5%, reflecting the surge in functional beverages, digestive health solutions, and wellness-focused products
- The bottles segment dominated the packaging type category with a 50.89% revenue share in 2025, led by widespread adoption across alcoholic fermented beverages, kombucha, kefir, and premium beverage categories
- Off-trade accounted for 70.43% of the market, preferred by the strong presence of supermarkets, hypermarkets, specialty retailers, and increasing consumer preference for at-home beverage consumption
- The cans segment is the fastest-growing packaging type category, with a CAGR of 7.79%, driven by the increasing demand for convenient, lightweight, and recyclable packaging solutions
Report Scope and Fermented Drinks Market Segmentation
|
Attributes |
Fermented Drinks Key Market Insights |
|
Segments Covered |
|
|
Countries Covered |
North America
Europe
Asia-Pacific
Middle East and Africa
South America
|
|
Key Market Players |
|
|
Market Opportunities |
|
|
Value Added Data Infosets |
In addition to the insights on market scenarios such as market value, growth rate, segmentation, geographical coverage, and major players, the market reports curated by the Data Bridge Market Research also include in-depth expert analysis, pricing analysis, brand share analysis, consumer survey, demography analysis, supply chain analysis, value chain analysis, raw material/consumables overview, vendor selection criteria, PESTLE Analysis, Porter Analysis, and regulatory framework. |
Fermented Drinks Market Trends
Trend: Growth in Functional and Probiotic Beverage Consumption
Consumers are increasingly adopting fermented drinks such as kombucha, kefir, and probiotic beverages due to rising awareness of gut health, immunity support, and digestive wellness benefits. Beverage companies are investing in clean-label formulations, natural ingredients, and innovative flavors to meet growing demand for healthier alternatives to conventional beverages. The expansion of functional beverage categories and increasing preference for wellness-focused products are further accelerating fermented drink consumption across global markets. For instance, in August 2024, Tata Consumer Products launched Tetley Kombucha in India, a fermented sparkling beverage made using tea and SCOBY (symbiotic culture of bacteria and yeast), with prebiotic fibre formulation, reflecting increasing consumer demand for wellness-focused and functional fermented beverages.
The increasing consumer shift toward functional nutrition, digestive wellness, and immunity-supporting beverages is accelerating innovation in probiotic and fermented drink categories. Companies launching kombucha, kefir, and other health-focused fermented products are leveraging this trend to capture growing demand for natural and value-added beverage solutions.
Fermented Drinks Market Dynamics
Key Market Driver: Increasing Demand for Health-Oriented Functional Beverages
The growing focus on gut microbiome health, immunity enhancement, and preventive wellness is creating substantial demand for fermented drinks containing probiotics and beneficial microorganisms. Consumers are increasingly replacing traditional beverages with functional alternatives that provide additional health benefits beyond hydration. Manufacturers are expanding product offerings through advanced fermentation technologies, nutritional enrichment, and premium positioning to capture rising demand from health-conscious consumers globally. For instance, in December 2023, the International Scientific Association for Probiotics and Prebiotics (ISAPP) reported more than 6,600 scientific papers published in the field of biotic science and highlighted that consumer interest in gut health and probiotics was at an all-time high, supporting the increasing demand for functional fermented beverages.
Rising awareness of the connection between digestive health and overall wellness is acting as a key market driver, encouraging manufacturers to expand probiotic and functional fermented beverage offerings.
Key Restraint/Challenge: Short Shelf Life and Quality Preservation Challenges
A significant challenge in the fermented drinks market is maintaining product stability, microbial activity, and sensory quality throughout storage and transportation. Fermented beverages require controlled fermentation processes, temperature management, and specialized packaging solutions to preserve beneficial microorganisms and ensure consistent product performance. These requirements increase production complexity, logistics costs, and distribution challenges, particularly for small and emerging manufacturers entering competitive markets. For instance, in January 2022, a research published in Applied Sciences identified oxygen content, heating temperature, acidity, water activity, moisture content, and packaging materials as key factors affecting probiotic survival during food manufacturing and storage.
Shelf-life management and preservation requirements remain key barriers for market participants, requiring technological advancements in fermentation processes, packaging, and cold-chain distribution.
Key Market Opportunity: Expansion of Non-Alcoholic and Plant-Based Fermented Beverages
The rising consumer preference for healthier beverage choices is creating significant opportunities for non-alcoholic fermented drinks, including kombucha, kefir, and plant-based fermented alternatives. Companies are developing innovative products using natural ingredients, functional compounds, and sustainable production methods to attract wellness-focused consumers. The growth of e-commerce platforms, premium beverage channels, and direct-to-consumer models is further improving product accessibility and supporting expansion across emerging markets. For instance, in February 2024, Health-Ade launched SunSip, a prebiotic soda with gut-health benefits, expanding its functional beverage portfolio beyond kombucha and reflecting rising consumer demand for wellness-focused fermented and alternative beverage products.
Expansion of non-alcoholic, plant-based, and functional fermented beverages represents a major opportunity area, supported by changing consumer preferences toward healthier and value-added beverage products.
Fermented Drinks Market Scope
The fermented drinks market is segmented on the basis of type, packaging type, and distribution channel.
- By Type
On the basis of type, the fermented drinks market is segmented into alcoholic fermented beverages and non-alcoholic fermented beverages. The alcoholic fermented beverages segment dominated the market with a 76.32% share in 2025, driven by established consumer consumption patterns, extensive production infrastructure, and strong global distribution networks. The segment benefits from widespread acceptance of beer, wine, cider, and other fermented alcoholic beverages across developed and emerging markets. Strong brand recognition, mature manufacturing capabilities, and well-established supply chains enable companies to maintain large-scale production and market penetration. Increasing consumer interest in premium, craft, and specialty alcoholic beverages is encouraging manufacturers to introduce innovative flavors and differentiated products. The expansion of breweries, wineries, and online alcohol retail platforms is further supporting product accessibility worldwide.
The non-alcoholic fermented beverages segment is expected to witness the fastest growth at a CAGR of 8.5% during the forecast period, supported by increasing consumer demand for functional beverages, digestive health solutions, and wellness-focused products. Growing awareness regarding probiotics, gut health, and immunity-supporting ingredients is driving the adoption of beverages such as kombucha, kefir drinks, fermented teas, and probiotic-based beverages. Manufacturers are increasingly developing clean-label, low-sugar, and naturally fermented products to attract health-conscious consumers. Rising preference among younger demographics for healthier alternatives to carbonated and alcoholic beverages is further accelerating segment expansion. Increasing availability through supermarkets, specialty health stores, and e-commerce platforms is improving consumer access to fermented non-alcoholic drinks.
- By Packaging Type
On the basis of packaging type, the fermented drinks market is segmented into bottles, cans, tetra packs/cartons, kegs & barrels, and others. The bottles segment dominated the market with a 50.89% share in 2025, supported by widespread adoption across alcoholic fermented beverages, kombucha, kefir, and premium beverage categories. Glass bottles are preferred due to their ability to preserve beverage quality, maintain flavor characteristics, and provide a premium product appearance. The segment benefits from established filling infrastructure and strong consumer familiarity with bottled fermented beverages. Bottles are particularly important for brands positioning products as traditional, artisanal, or premium offerings. However, sustainability concerns and demand for lightweight packaging solutions are encouraging manufacturers to evaluate alternative formats.
The cans segment is projected to register the fastest growth expanding at a CAGR of 7.79% during the forecast period, driven by increasing demand for convenient, lightweight, and recyclable packaging solutions. Aluminum cans provide advantages including portability, efficient transportation, durability, and reduced packaging weight. Growing adoption of ready-to-drink fermented beverages, particularly kombucha and functional beverages, is supporting demand for canned formats. Sustainability initiatives and increasing focus on recyclable packaging materials are further encouraging manufacturers to adopt aluminum cans. Rising preference among younger consumers for convenient beverage formats is also accelerating segment expansion.
- By Distribution Channel
On the basis of distribution channel, the fermented drinks market is segmented into supermarket/hypermarket, speciality retail store, convenience store, on trade, off trade, online channel, and other distribution channels. The off-trade segment dominated the market with a 70.43% share in 2025, supported by the strong presence of supermarkets, hypermarkets, specialty retailers, and increasing consumer preference for at-home beverage consumption. Off-trade channels provide manufacturers with broad consumer reach and enable convenient access to packaged fermented beverages. Growth in organized retail infrastructure, refrigerated storage facilities, and premium beverage availability is strengthening this segment. The segment is benefiting from increasing household consumption of functional beverages and packaged wellness products. Expansion of retail chains in emerging markets is further supporting segment dominance.
The online channel segment is projected to register the fastest growth during the forecast period with a CAGR of 12.3% from 2026 to 2031, driven by increasing e-commerce penetration, direct-to-consumer business models, and rising availability of premium fermented beverages through digital platforms. Online channels allow emerging brands to reach consumers beyond traditional retail networks and provide wider product variety. Subscription models and targeted digital marketing are supporting consumer engagement and repeat purchases. Increasing smartphone adoption and digital payment penetration are further improving online beverage sales. The channel is expected to gain importance as consumers increasingly prefer convenient purchasing options for specialty and functional beverages
Fermented Drinks Market Regional Analysis
Asia-Pacific dominated the fermented drinks market with the largest revenue share of 33.82% in 2025, supported by high beer consumption volumes, strong traditional fermented beverage demand, and increasing adoption of kombucha and kefir across countries such as China, Japan, and India. The region also benefits from expanding beverage manufacturing capabilities, rising consumer awareness of gut health, and growing adoption of kombucha, kefir, and other fermented beverage products. Increasing investments in product innovation, premium beverage launches, and modern retail distribution channels are accelerating market development. Growing focus on wellness-oriented consumption, natural ingredients, and healthier beverage alternatives continues to strengthen Asia-Pacific’s leadership position in the global market.
U.S. Fermented Drinks Market Insight
The U.S. fermented drinks market is witnessing strong growth due to rising consumer demand for functional beverages, increasing awareness of gut health benefits, and growing adoption of probiotic drinks such as kombucha and kefir. The country’s mature beverage industry, along with increasing innovation in clean-label, organic, and plant-based fermented products, is driving demand across retail and direct-to-consumer channels. In addition, growing investments by beverage companies in wellness-focused product launches are accelerating market expansion. In February 2024, Health-Ade expanded its functional beverage portfolio with the launch of SunSip, a prebiotic soda designed to support gut health, reflecting rising U.S. consumer interest in wellness-oriented beverages.
Europe Fermented Drinks Market Insight
The Europe fermented drinks market remains a major contributor to global revenue, driven by strong consumer preference for natural beverages, increasing demand for probiotic products, and established consumption of traditional fermented beverages. The widespread adoption of kombucha, kefir, and fermented dairy drinks is supporting market expansion across the region. Increasing investments in functional beverage innovation, coupled with rising health awareness and demand for clean-label products, continue to enhance the adoption of fermented drinks throughout Europe. Yakult Europe produces fermented milk drinks containing Lactobacillus casei strain Shirota and distributes probiotic products across European markets, reflecting the region’s established demand for functional and health-oriented fermented beverages
U.K. Fermented Drinks Market Insight
The U.K. fermented drinks market is experiencing steady growth, supported by rising consumer interest in gut health, increasing demand for functional beverages, and growing availability of kombucha and probiotic drinks through supermarkets and online channels. Increasing investments in innovative beverage formulations and healthier alternatives to traditional drinks are contributing to market growth. Furthermore, expansion of premium fermented beverage brands and growing awareness of microbiome health are improving product adoption among health-conscious consumers. Remedy Kombucha expanded its U.K. retail footprint through launches in Sainsbury’s, WHSmith, Wasabi, and BP convenience stores, highlighting rising retailer acceptance and growing demand for healthier fermented functional beverages.
Germany Fermented Drinks Market Insight
The Germany fermented drinks market is expanding steadily due to strong consumer interest in organic beverages, traditional fermentation practices, and functional nutrition products. Beverage manufacturers and retailers are increasingly introducing fermented drinks such as kombucha, kefir, and other probiotic beverages to meet growing wellness trends. Continuous innovation in natural ingredients, sustainable production, and premium beverage offerings is further supporting market development in Germany. Germany-based Kombuchery has expanded its organic kombucha portfolio, offering fermented beverages positioned around natural ingredients and gut-health benefits, reflecting increasing consumer demand for functional fermented drinks in Germany.
Asia-Pacific Fermented Drinks Market Insight
The Asia-Pacific fermented drinks market is expected to witness rapid growth, driven by high consumption of traditional fermented beverages, rising awareness of probiotic benefits, and increasing demand for functional and wellness-oriented drinks across countries such as China, India, and Japan. Growing investments in beverage innovation, expanding organized retail networks, and increasing availability of kombucha and kefir products are supporting regional market expansion. In addition, the region’s strong fermentation heritage and growing health-conscious consumer base are accelerating adoption across commercial and household segments. Tata Consumer Products launched Tetley Kombucha in India, expanding access to fermented functional beverages and reflecting rising demand for wellness-focused drinks in the Asia-Pacific region.
Japan Fermented Drinks Market Insight
The Japan fermented drinks market is witnessing consistent growth due to the country’s long-standing fermentation culture, strong consumer acceptance of probiotic beverages, and increasing demand for functional health products. Beverage companies are increasingly developing fermented drinks targeting digestive wellness, immunity support, and preventive healthcare needs. Moreover, Japan’s advanced food technology ecosystem and consumer preference for scientifically supported health products are further contributing to market growth. Yakult Honsha continues to strengthen its probiotic beverage presence in Japan through Yakult 1000, a fermented milk drink containing Lacticaseibacillus paracasei strain Shirota (formerly classified as Lactobacillus casei strain Shirota), reflecting strong consumer demand for functional fermented beverages focused on gut health and wellness.
China Fermented Drinks Market Insight
The China fermented drinks market is growing rapidly, driven by increasing consumer awareness of digestive health, expanding middle-class spending, and rising demand for probiotic and functional beverages. Growing adoption of modern retail channels, e-commerce platforms, and innovative fermented beverage products is significantly boosting market demand. In addition, China’s strong traditional fermentation industry and increasing investments in health-oriented beverage categories are positioning the country as a key growth market for fermented drinks globally. Yakult China launched a peach-flavored fermented lactic acid bacteria drink containing Lacticaseibacillus paracasei strain Shirota, strengthening its probiotic beverage portfolio and highlighting rising consumer demand for functional fermented drinks in China.
Fermented Drinks Market Share
The fermented drinks industry is primarily led by well-established companies, including:
- Danone (France)
- Yakult Honsha Co., Ltd. (Japan)
- The Coca-Cola Company (U.S.)
- PepsiCo, Inc. (U.S.)
- Nestlé (Switzerland)
- Anheuser-Busch Companies LLC, (Belgium)
- HEINEKEN (Netherlands)
- Carlsberg Breweries A/S (Denmark)
- Kirin Holdings Company, Limited (Japan)
- ASAHI GROUP HOLDINGS, LTD. (Japan)
- SUNTORY HOLDINGS LIMITED (Japan)
- Keurig Dr Pepper Inc. (U.S.)
- Molson Coors Beverage Company (U.S.)
- Kombucha Wonder Drink (U.S.)
- Health-Ade LLC (U.S.)
- Remedy Drinks Pty Ltd (Australia)
- GT’s Living Foods LLC (U.S.)
- The Hain Celestial Group, Inc. (U.S.)
- Fonterra Co-operative Group Limited (New Zealand)
- Hansen Holding A/S (Denmark)
Latest Developments in Fermented Drinks Market
- In September 2025, Yakult Singapore launched Y1000, its most concentrated probiotic drink, expanding its fermented beverage portfolio with a product containing more than 100 billion live probiotics per bottle. The launch strengthens Yakult’s focus on science-backed functional beverages and responds to increasing consumer demand for gut-health-focused probiotic drinks in the Asian market.
- In May 2024, Health-Ade Kombucha launched two new limited-edition flavors, Orange Creamsicle and Pomegranate Blueberry, expanding its kombucha portfolio to meet rising consumer demand for innovative, gut-health-focused functional beverages. The launch highlights the company’s strategy of introducing flavor innovations while strengthening its position in the growing kombucha and wellness beverage category
- In February 2024, Health-Ade launched SunSip, a prebiotic soda designed as a gut-health-focused alternative to traditional soft drinks. The product expansion demonstrates the company’s move beyond kombucha into the broader functional beverage category, targeting consumers seeking healthier beverage options with digestive wellness benefits
- In March 2022, Brewerkz and Probicient launched a probiotic beer developed using probiotic technology, creating a new category of functional alcoholic beverages. The launch combined traditional fermentation with probiotic innovation and highlighted increasing industry interest in developing healthier alcoholic beverage alternatives with added functional benefits
- In June 2021, Remedy Drinks launched its range of live-cultured fermented beverages in the United States, expanding its kombucha portfolio into the North American market. The launch introduced canned kombucha products containing live active cultures, organic acids, and antioxidants, supporting the growing demand for sugar-free, functional, and wellness-oriented fermented beverages
SKU-

- Interactive Data Analysis Dashboard
- Company Analysis Dashboard for high growth potential opportunities
- Research Analyst Access for customization & queries
- Competitor Analysis with Interactive dashboard
- Latest News, Updates & Trend analysis
- Harness the Power of Benchmark Analysis for Comprehensive Competitor Tracking
Global Fermented Drinks Market, Supply Chain Analysis and Ecosystem Framework
To support market growth and help clients navigate the impact of geopolitical shifts, DBMR has integrated in-depth supply chain analysis into its Global Fermented Drinks Market research reports. This addition empowers clients to respond effectively to global changes affecting their industries. The supply chain analysis section includes detailed insights such as Global Fermented Drinks Market consumption and production by country, price trend analysis, the impact of tariffs and geopolitical developments, and import and export trends by country and HSN code. It also highlights major suppliers with data on production capacity and company profiles, as well as key importers and exporters. In addition to research, DBMR offers specialized supply chain consulting services backed by over a decade of experience, providing solutions like supplier discovery, supplier risk assessment, price trend analysis, impact evaluation of inflation and trade route changes, and comprehensive market trend analysis.
Data collection and base year analysis are done using data collection modules with large sample sizes. The stage includes obtaining market information or related data through various sources and strategies. It includes examining and planning all the data acquired from the past in advance. It likewise envelops the examination of information inconsistencies seen across different information sources. The market data is analysed and estimated using market statistical and coherent models. Also, market share analysis and key trend analysis are the major success factors in the market report. To know more, please request an analyst call or drop down your inquiry.
The key research methodology used by DBMR research team is data triangulation which involves data mining, analysis of the impact of data variables on the market and primary (industry expert) validation. Data models include Vendor Positioning Grid, Market Time Line Analysis, Market Overview and Guide, Company Positioning Grid, Patent Analysis, Pricing Analysis, Company Market Share Analysis, Standards of Measurement, Global versus Regional and Vendor Share Analysis. To know more about the research methodology, drop in an inquiry to speak to our industry experts.
Data Bridge Market Research is a leader in advanced formative research. We take pride in servicing our existing and new customers with data and analysis that match and suits their goal. The report can be customized to include price trend analysis of target brands understanding the market for additional countries (ask for the list of countries), clinical trial results data, literature review, refurbished market and product base analysis. Market analysis of target competitors can be analyzed from technology-based analysis to market portfolio strategies. We can add as many competitors that you require data about in the format and data style you are looking for. Our team of analysts can also provide you data in crude raw excel files pivot tables (Fact book) or can assist you in creating presentations from the data sets available in the report.


