
Global Flexible Packaging Market
Market Size in USD Billion
 USD
164.64 Billion
USD
266.37 Billion
2024
2032
USD
164.64 Billion
USD
266.37 Billion
2024
2032
| 2025 - 2032 | |
| USD 164.64 Billion | |
| USD 266.37 Billion | |
| % | |
|
Flexible Packaging Market Size
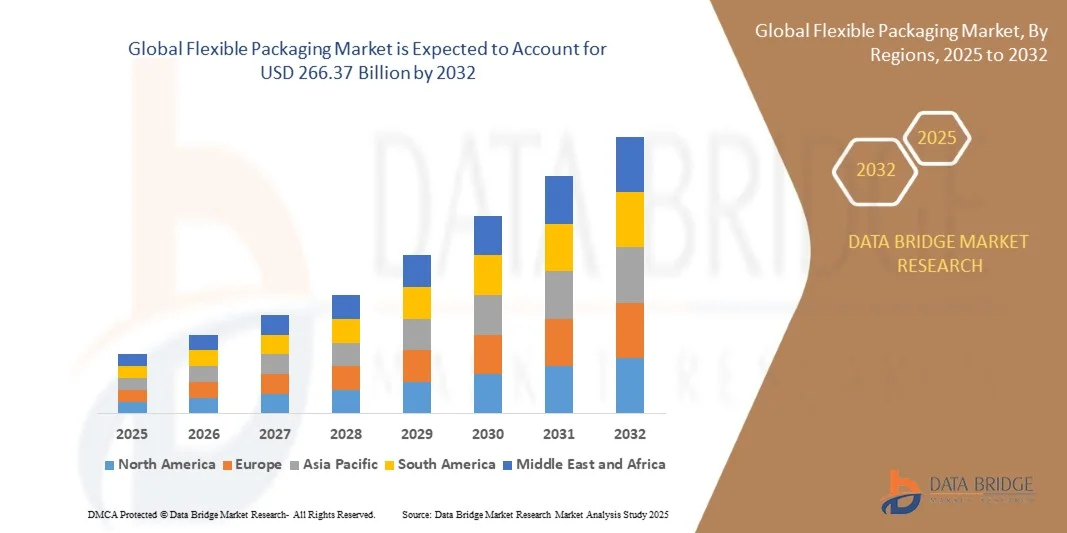
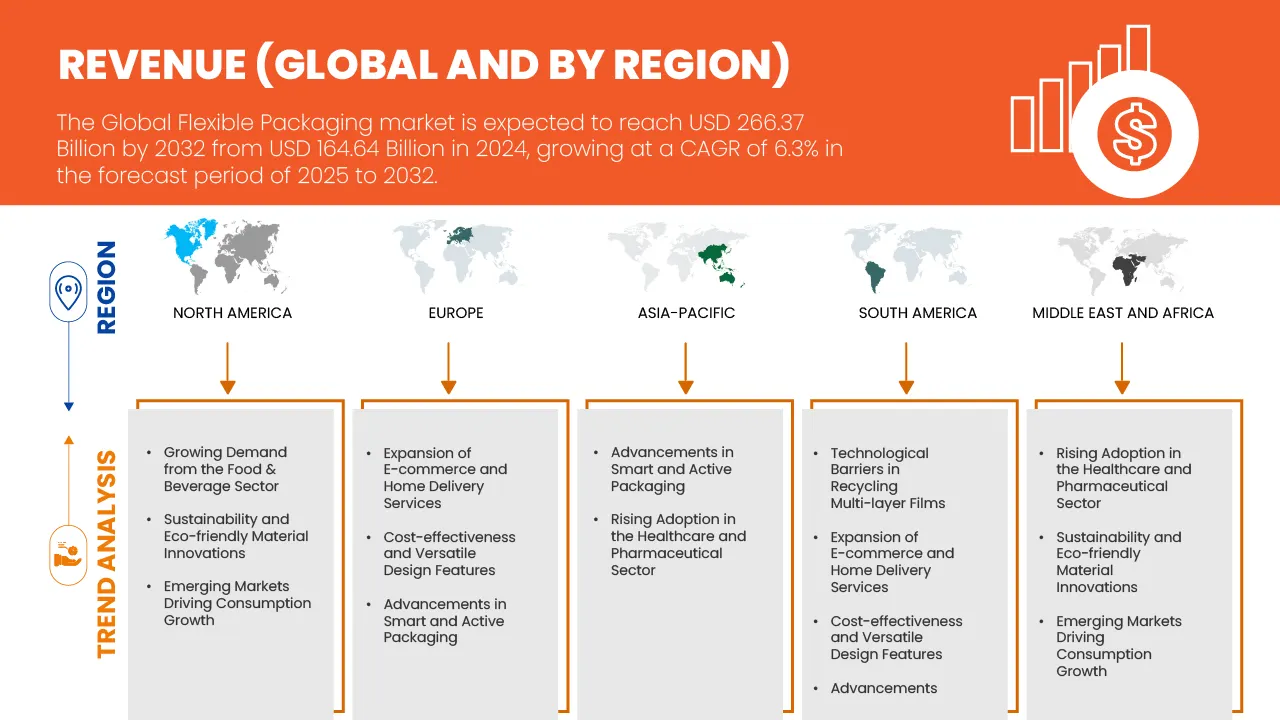
- The Flexible Packaging Market size was valued at USD 164.64 Billion in 2024 and is expected to reach USD 266.37 Billion by 2032, at a CAGR of 6.3% during the forecast period
- Growing demand from the food & beverage sector is a major factor driving demand across the region
- Advancements in smart and active packaging enhancing product shelf life and consumer experience is further strengthening market reach
Flexible Packaging Market Analysis
- Flexible packaging is packaging made from pliable materials such as films, foils, or paper that can easily change shape to protect, store, and transport products.
- The flexible packaging market is primarily driven by the rising demand for convenience, lightweight design, extended shelf life, e-commerce growth, sustainability trends, cost-effectiveness, and technological innovations in materials and printing
- Rising demand for sustainable and recyclable flexible packaging presents a significant growth opportunity, as consumers and regulators increasingly favor eco-friendly solutions across food, and beverage sector.
- Asia-Pacific dominates the flexible packaging market, supported by rapid urbanization and rising disposable incomes in countries like China and India are increasing demand for packaged food and beverages, boosting the flexible packaging market.
- In 2025, the pouches segment is expected to dominate the market with 43.73% market share due to its lightweight, resealable design, superior barrier properties, versatility across liquid and solid foods, extended shelf life, portability, and convenience for storage, transportation, and retail display. Their ability to maintain product freshness and consumer-friendly usability makes them the most preferred choice across global food and beverage packaging applications.
- The Asia-Pacific flexible packaging market is poised to grow at the fastest CAGR of approximately 6.7% from 2025 to 2032, driven by rapid urbanization, rising disposable incomes, and increasing demand for packaged and processed foods. Growth is also supported by expanding e-commerce and retail channels, adoption of lightweight, convenient, and sustainable flexible packaging formats, and investments by regional manufacturers in innovative printing and barrier technologies to meet consumer and regulatory requirements.
Report Scope and Flexible Packaging Market Segmentation
|
Attributes |
Global Flexible Packaging Key Market Insights |
|
Segments Covered |
|
|
Countries Covered |
|
|
Key Market Players |
|
|
Market Opportunities |
|
|
Value Added Data Infosets |
In addition to the insights on market scenarios such as market value, growth rate, segmentation, geographical coverage, and major players, the market reports curated by the Data Bridge Market Research also include in-depth expert analysis, Porter analysis, raw material coverage, climate change scenario, market entry strategies, supply chain analysis, technological advancements, pricing analysis, vendor selection criteria, cost analysis breakdown, and industry ecosystem analysis. |
Flexible Packaging Market Trends
“Sustainable & Recyclable Flexible Packaging”
- In the food & beverage sector, there’s a strong shift toward flexible packaging solutions that emphasise sustainability, recyclability and circular‑economy thinking.
- Brands are increasingly using mono‑material films (single polymer rather than multi‑layer laminates) to simplify recycling and reduce complexity.
- There is rising adoption of bio‑based, compostable or paper‑based flexible packaging especially for dry foods and snacks, to reduce reliance on fossil‑based plastics.
- Marketing and regulatory pressure: Governments are setting targets (e.g., single‑use packaging must be recyclable/compostable) and consumers expect eco‑friendly credentials.
- Lightweight flexible packaging reduces material use, shipping weight/volume and carbon footprint compared to rigid alternatives an advantage in food & drink logistics. inside-packaging.
- Flexible packaging formats (like stand‑up pouches, spouted pouches) dominate for convenience and adaptability, making the sustainable versions particularly impactful. Feeding Trends
- Barrier performance improvements (for moisture, oxygen, light) are being matched with sustainable choices, meaning brands don’t have to sacrifice shelf‑life or product integrity when going greener.
Flexible Packaging Market Dynamics
Driver
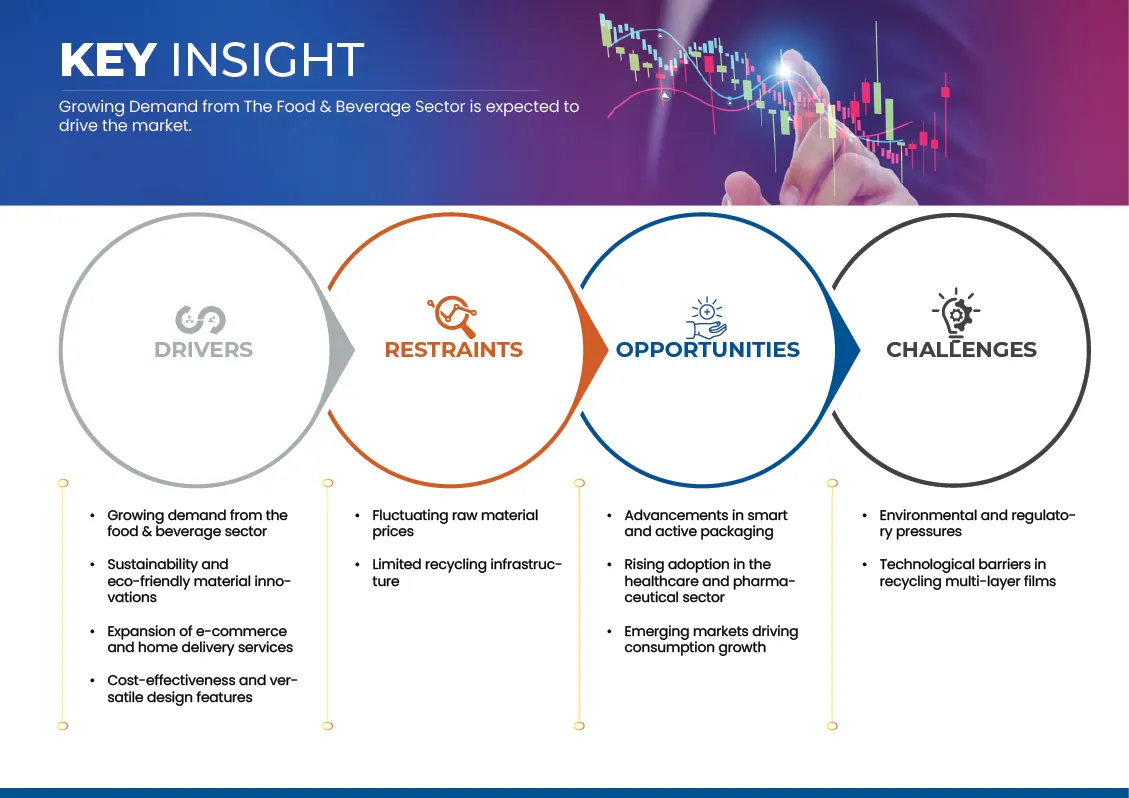
Growing Demand from The Food & Beverage Sector
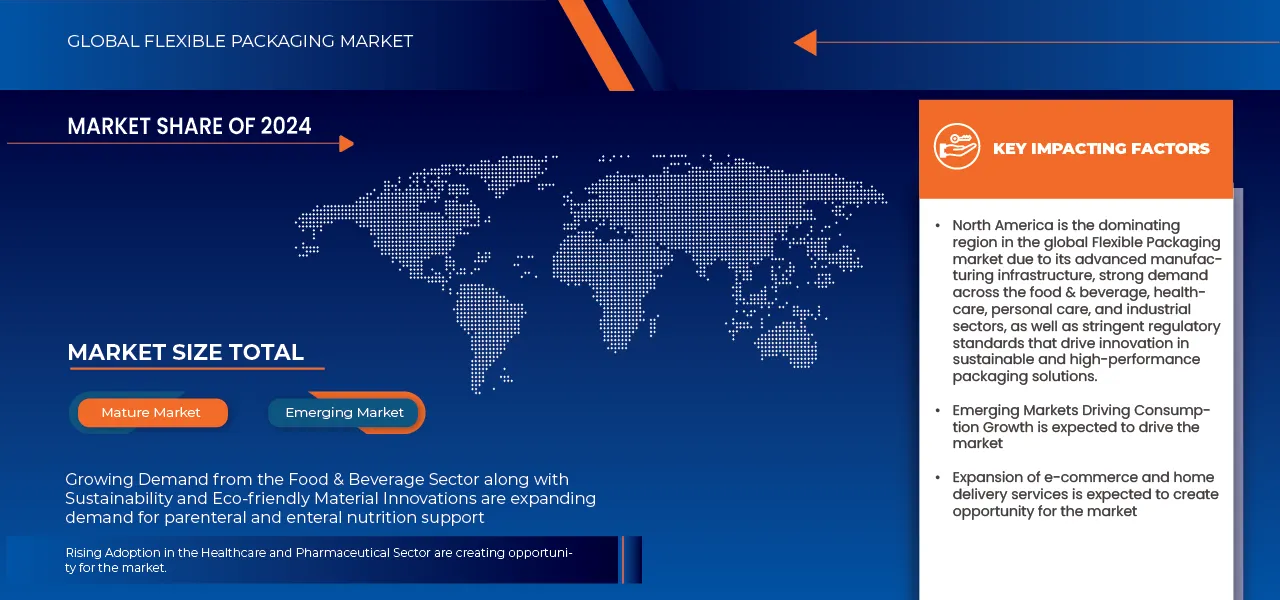
- The food and beverage sector continues to drive substantial demand for flexible packaging due to its excellent barrier properties, extended shelf life, and cost-effectiveness. The increasing consumption of ready-to-eat meals, snacks, and on-the-go foods, especially in emerging economies such as India, China, and Brazil, is contributing to market growth. Flexible packaging formats like pouches, wraps, and sachets are favored for their convenience, lightweight design, and reduced material usage compared to rigid alternatives. Additionally, the expansion of e-commerce grocery deliveries and adoption of sustainable packaging practices by food brands are accelerating the shift toward recyclable and bio-based flexible materials. This growing reliance on flexible packaging is expected to continue fueling global market expansion in the coming years.
- For instance, as highlighted by the Packaging Machinery Manufacturers Institute (PMMI) in June 2025, 68% of beverage companies anticipate moderate to significant increases in packaging machinery investments, with nearly 90% planning purchases. This investment drive is spurred by rising consumer demand for on-the-go drinks and increased use of flexible packaging formats.
- In May 2025 the Indian firm Jindal Poly Films Limited announced an investment of USD 84.34 million to expand its BOPP, PET and CPP film capacity at its Nashik facility, specifically to support growth in key sectors including food and beverage flexible packaging.
- The escalating demand from the food and beverage sector is a key driver for the flexible food packaging market. Rising consumer preference for convenience, on-the-go consumption, and product freshness is compelling manufacturers to adopt innovative and sustainable packaging solutions. As a result, F&B demand not only fuels market growth but also accelerates the development of flexible formats tailored to diverse product types and regulatory standards.
Restraint/Challenge
Fluctuating Raw Material Prices
- Fluctuating raw material prices remain a critical challenge for the Flexible Packaging Market. Variations in the cost of polymers such as polyethylene, polypropylene, and PET can significantly influence production expenses, profit margins, and pricing strategies. These fluctuations are often driven by global supply-demand imbalances, energy price volatility, and geopolitical factors, compelling manufacturers to adopt strategic sourcing, alternative materials, and cost-management measures. As a result, raw material price instability continues to shape operational decisions and competitiveness within the industry.
- For instance, In August 2025, Castrol India experienced a 5.1% increase in second-quarter profit, reaching USD 29,400, driven by consistent demand for its automobile and industrial lubricants. Revenue from operations rose by 7.1% to 14.97 billion, supported by a near 5% increase in India's retail vehicle sales during the quarter. However, total expenses grew by 6.6%, largely due to a 3.2% rise in raw material costs, highlighting the impact of fluctuating raw material prices on production costs and profit margins.
- Fluctuating raw material prices continue to pose a significant challenge for the flexible packaging industry, directly affecting production costs, profit margins, and pricing strategies. Variability in the costs of polymers, paper, and other essential inputs forces manufacturers to implement strategic sourcing, adopt alternative materials, and optimize supply chains. These fluctuations not only influence short-term profitability but also shape long-term operational and investment decisions, emphasizing the need for resilience and proactive cost management in a dynamic global market
Flexible Packaging Market Scope
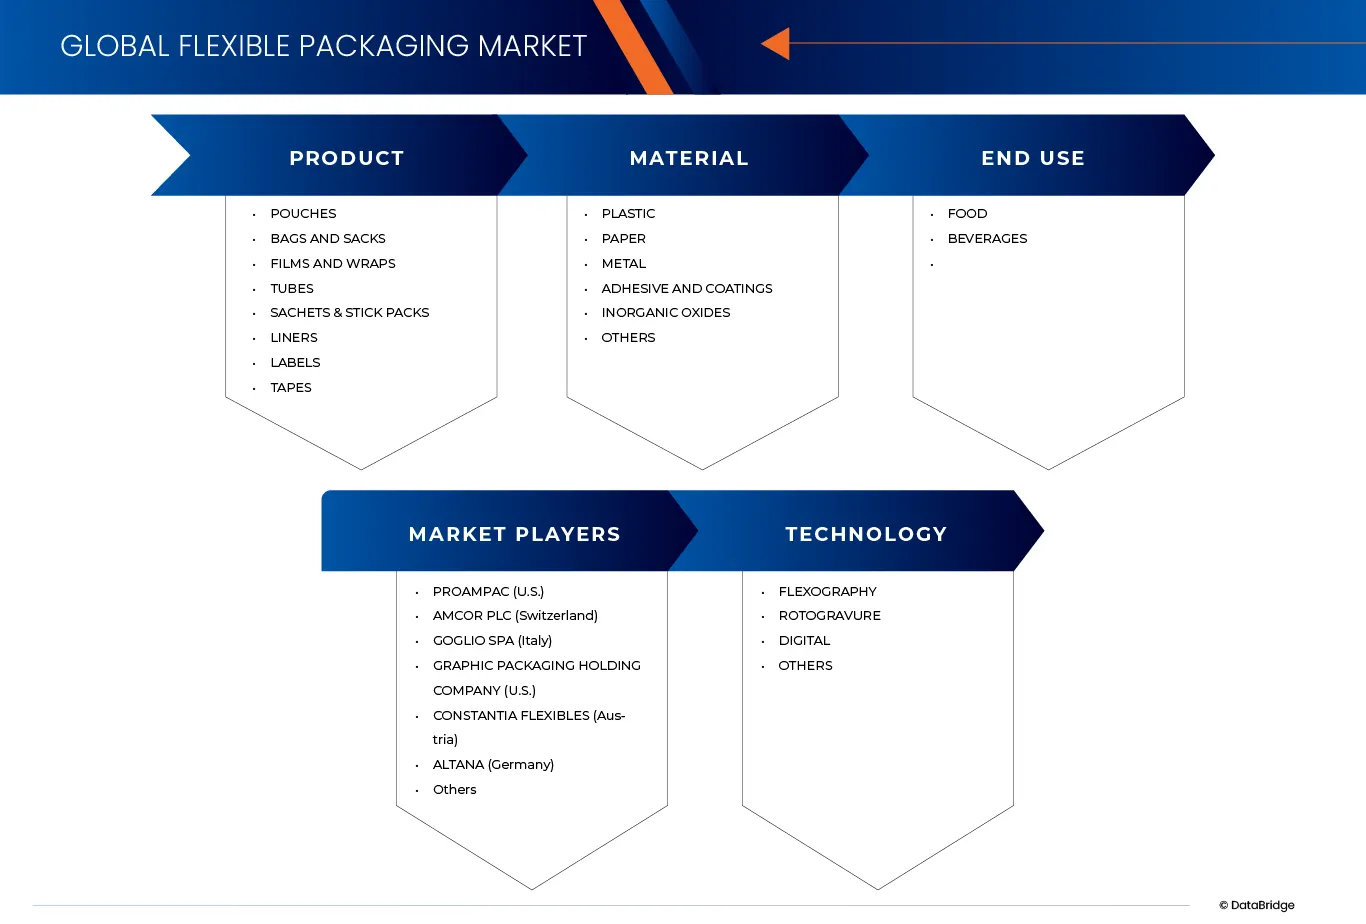
The market is segmented on the basis of product, material, end use industry, and technology.
By product
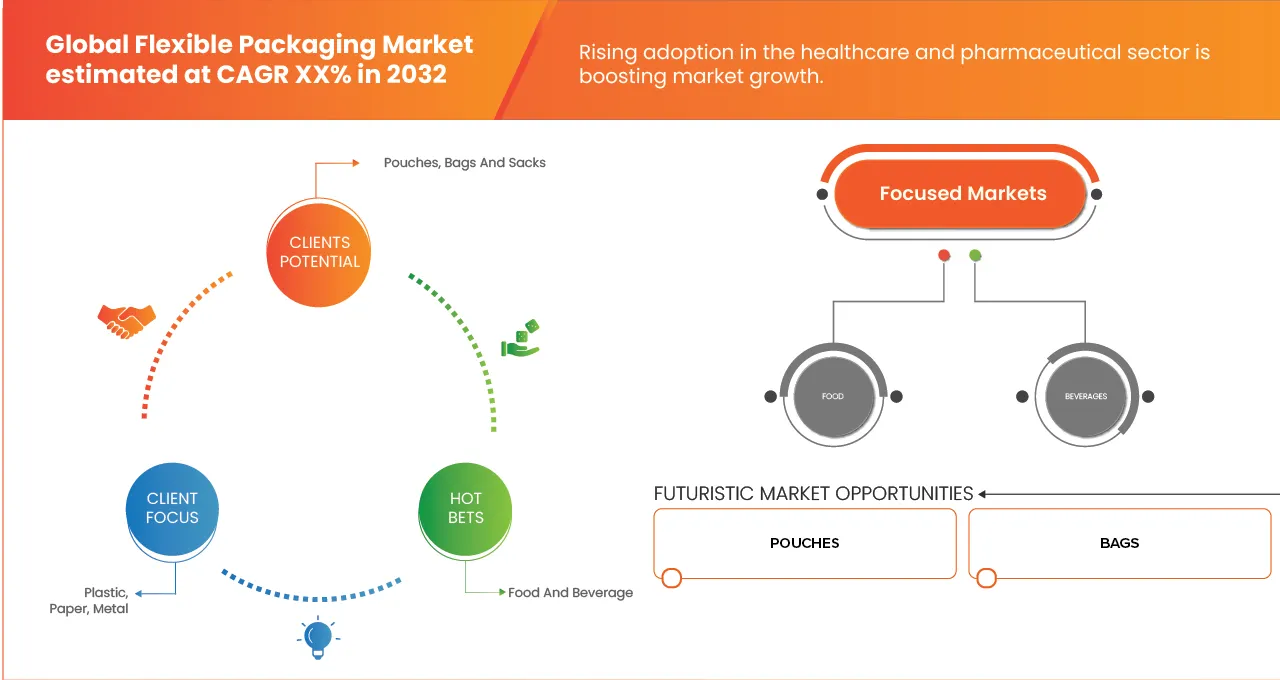
On the basis of product, the market is segmented into pouches, bags and sacks, tubes, liners, sachets and stick packs, labels, tapes, films, and wraps. In 2025, pouches dominate the Flexible Packaging Market with a market share of 43.73% due to its lightweight, resealable design, superior barrier properties, versatility across liquid and solid foods, extended shelf life, portability, and convenience for storage, transportation, and retail display. Their ability to maintain product freshness and consumer-friendly usability makes them the most preferred choice across global food and beverage packaging applications.
Moreover, this segment is further projected to register the highest CAGR of 6.6% during the forecast period of 2025 to 2032, owing to the increasing demand for single-serve, ready-to-eat meals, and on-the-go snacks, rising urbanization, convenience-focused lifestyles, e-commerce packaging needs, innovative pouch designs, and adoption by emerging food brands for cost-effective, sustainable, and visually appealing packaging solutions.
By material
On the basis of material, the market is segmented into plastic, paper, metal, inorganic oxides, adhesives and coatings, and others. In 2025, plastic dominates the global market with a market share of 69.37% owing to its durability, flexibility, lightweight nature, cost-effectiveness, superior moisture and oxygen barrier properties, compatibility with various printing and laminating technologies, and ability to preserve product quality, shelf life, and appearance across different food and beverage applications worldwide.
Moreover, the paper segment is further projected to register the highest CAGR of 6.7% during the forecast period of 2025 to 2032. The high growth is mainly due to rising sustainability trends, consumer preference for recyclable or biodegradable materials, government regulations on single-use plastics, increasing adoption of paper-based pouches and wraps, and growing eco-conscious packaging initiatives by global food and beverage brands.
By End Use Industry
On the basis of end use industry, the market is segmented into food and beverage. In 2025, food dominates the market with a market share of 83.78% due to high global consumption of packaged foods, rising demand for convenience and ready-to-eat products, urban lifestyles, longer shelf-life requirements, increasing retail distribution, and preference for safe, hygienic, and visually appealing packaging formats.
Furthermore, this segment is expected to witness the fastest growth of 6.4% during the forecast period, due to expanding processed and packaged food markets, rising disposable incomes, adoption of single-serve and snack formats, rising e-commerce food sales, increasing awareness about food preservation, and the need for sustainable, convenient, and portable packaging solutions.
By Technology
On the basis of technology, the market is segmented into flexography, rotogravure, digital, and others. In 2025, flexography dominates Flexible Packaging Market with a market share of 46.61% as it offers high-speed, cost-efficient printing on various substrates, consistent color quality, adaptability for flexible films, scalability for large production runs, superior ink adhesion, minimal setup time, and capability to deliver vibrant, high-resolution designs for branding and product appeal.
Furthermore, this segment is anticipated to witness the fastest growth of 6.6% during the forecast period. The growth of this segment is mainly due to the advancements in automation, improved plate-making technologies, digital hybrid integration, demand for high-quality, short-run prints, sustainability-driven ink innovations, ability to customize packaging quickly, and increased adoption by brands seeking visually attractive, efficient, and cost-effective printing solutions.
Flexible Packaging Market Regional Analysis
- Asia-pacific dominated the flexible packaging market with the large revenue share of 41.34%, driven by rapid urbanization and rising disposable incomes in countries like China and India are increasing demand for packaged food and beverages, boosting the flexible packaging market.
- Expansion of e-commerce and modern retail channels in the Asia-Pacific region is driving the adoption of convenient, lightweight, and durable flexible packaging solutions.
- Growing awareness of food safety, longer shelf-life requirements, and increasing use of ready-to-eat and processed food products are further fueling market growth, contributing to the region’s large revenue share.
U.S. Flexible Packaging Market Insight
The U.S. flexible packaging market accounted for a significant share within North America in 2024, due to its strong consumer demand for convenience foods, increasing adoption of ready-to-eat and on-the-go products, and growing e-commerce packaging requirements. Additionally, advancements in sustainable and recyclable packaging solutions, coupled with high investments by leading manufacturers in innovative flexible formats, have reinforced market dominance and supported consistent growth across food, beverage, and personal care segments.
Europe Flexible Packaging Market Insight
The Europe flexible packaging market is expected to grow steadily over the forecast period, driven by increasing consumer awareness of sustainability, government regulations on single-use plastics, and rising demand for recyclable and eco-friendly packaging solutions. Growth is further supported by the expansion of packaged food and beverage sectors, technological advancements in printing and barrier films, and increasing adoption of convenient flexible formats such as pouches, sachets, and wraps.
U.K. Flexible Packaging Market Insight
The U.K. flexible packaging market is expected to register steady growth over the forecast period, supported by rising demand for convenient and lightweight packaging solutions in food, beverages, and personal care sectors. Consumer preference for sustainable, recyclable, and biodegradable materials, along with growing e-commerce and retail packaging requirements, is driving adoption. Technological innovations in flexible films, barriers, and printing solutions further enhance product differentiation and market competitiveness.
Germany Flexible Packaging Market Insight
Germany flexible packaging market is anticipated to expand at a notable CAGR during the forecast period, supported by increasing consumer preference for sustainable and recyclable packaging formats. Growth is driven by a strong food and beverage sector, regulatory support for eco-friendly packaging, and rising adoption of advanced flexible films with enhanced barrier and printing properties. Manufacturers are investing in innovation and automation to meet demand for convenience and high-quality packaging solutions.
Asia-Pacific Flexible Packaging Market Insight
The Asia-Pacific flexible packaging market is poised to grow at the fastest CAGR of approximately 6.7% from 2025 to 2032, driven by rapid urbanization, rising disposable incomes, and increasing demand for packaged and processed foods. Growth is also supported by expanding e-commerce and retail channels, adoption of lightweight, convenient, and sustainable flexible packaging formats, and investments by regional manufacturers in innovative printing and barrier technologies to meet consumer and regulatory requirements.
China Flexible Packaging Market Insight
China holds the largest share of the Asia-Pacific flexible packaging market in 2024, attributable to its rapid population growth, increasing urbanization, and rising demand for packaged food and beverage products. Expansion of modern retail and e-commerce channels, government initiatives promoting sustainable packaging, and growing investments by domestic and international manufacturers in advanced flexible formats and printing technologies have strengthened China’s dominance, enabling widespread adoption across multiple end-use industries.
Japan Flexible Packaging Market Insight
The Japan flexible packaging market is growing steadily, propelled by consumer preference for convenient, portion-controlled, and ready-to-eat food products. Growth is further supported by increasing demand for sustainable and recyclable packaging solutions, technological advancements in flexible films, and the presence of well-established food and beverage manufacturing sectors. Manufacturers are focusing on innovative packaging designs, high-barrier materials, and premium aesthetics to cater to both domestic and export markets.
The Major Market Leaders Operating in the Market are:
- PROAMPAC (U.S.)
- AMCOR PLC (Switzerland)
- GOGLIO SPA (Italy)
- GRAPHIC PACKAGING HOLDING COMPANY (U.S.)
- CONSTANTIA FLEXIBLES (Austria)
- ALTANA (Germany)
- SONOCO PRODUCTS COMPANY (U.S.)
- FLAIR FLEXIBLE PACKAGING CORPORATION (U.S.)
- MONDI (U.K.)
- WESTROCK COMPANY (U.S.)
- TRANSCONTINENTAL INC. (Canada)
- WIPAK GROUP (Finland)
- SEALED AIR (U.S.)
- BBC CELLPACK PACKAGING (Switzerland)
- SCHUR FLEXIBLES (Austria)
- COVERIS (Austria)
- HUHTAMÄKI (Finland)
- BISCHOF + KLEIN SE & CO. KG (Germany)
- SÜDPAC (Germany)
Latest Developments in Global Flexible Packaging Market
- In September, Sealed Air introduced the AUTOBAG 850HB Hybrid Bagging Machine, designed for fulfillment operations that use either paper or poly mailers. The machine provides flexibility to run both substrate types, helping customers streamline equipment needs and support curb-side recyclable formats.
- In September 2025, Graphic Packaging, along with Henkel Adhesive Technologies and Kraton Corporation, formed a strategic partnership to develop next-generation sustainable packaging solutions. This collaboration focuses on aligning innovation with circular economy principles, accelerating the shift to more sustainable, high-performing materials. The partnership aims to drive sustainable progress in the packaging industry through combined expertise and resources.
- In July, BBC Cellpack Packaging enhanced its production capabilities at its Lauterecken (Germany) site with the installation of a BOBST EXPERT CI flexo press featuring eleven printing units. The investment enables faster job changeovers, reduced waste, and greater versatility across recyclable and sustainable flexible packaging, strengthening the company’s presence in confectionery, dry foods, and personal care segments.
- In August 2024, ACTEGA introduced the YUNICO technology platform, a water-based coating solution designed to enhance the sustainability of food packaging. This platform enables the dispersion of highly customizable compounds, providing barrier properties, recyclability, and adhesion in packaging materials. YUNICO aligns with ALTANA's commitment to sustainable packaging solution.
- In August 2023, Amcor acquired Phoenix Flexibles, a Gujarat-based company generating approximately USD 20 million in annual revenue from flexible packaging solutions for food, home care, and personal care sectors. This acquisition enhances Amcor's capacity in the high-growth Indian market and introduces advanced film technologies, enabling local production of sustainable packaging solutions.
- In April, Huhtamaki expanded its flexible packaging portfolio with the launch of its next-generation mono-material films under the blueloop platform. The new range, made from PE and PP, delivers full recyclability and high product protection, addressing the demand for sustainable flexible solutions across food and personal care markets. This innovation reflects Huhtamaki’s focus on circular packaging solutions and its long-term commitment to reducing plastic waste through material innovation.
SKU-

- Interactive Data Analysis Dashboard
- Company Analysis Dashboard for high growth potential opportunities
- Research Analyst Access for customization & queries
- Competitor Analysis with Interactive dashboard
- Latest News, Updates & Trend analysis
- Harness the Power of Benchmark Analysis for Comprehensive Competitor Tracking
Table of Content
1 INTRODUCTION
1.1 OBJECTIVES OF THE STUDY
1.2 MARKET DEFINITION
1.3 OVERVIEW OF GLOBAL FLEXIBLE PACKAGING MARKET
1.4 CURRENCY AND PRICING
1.5 LIMITATIONS
1.6 MARKETS COVERED
2 MARKET SEGMENTATION
2.1 MARKETS COVERED
2.2 GEOGRAPHICAL SCOPE
2.3 YEARS CONSIDERED FOR THE STUDY
2.4 DBMR TRIPOD DATA VALIDATION MODEL
2.5 PRIMARY INTERVIEWS WITH KEY OPINION LEADERS
2.6 DBMR MARKET POSITION GRID
2.7 VENDOR SHARE ANALYSIS
2.8 MULTIVARIATE MODELING
2.9 MATERIAL TIMELINE CURVE
2.1 MARKET END USE INDUSTRY COVERAGE GRID
2.11 SECONDARY SOURCES
2.12 ASSUMPTIONS
3 EXECUTIVE SUMMARY
4 PREMIUM INSIGHTS
4.1 PESTEL ANALYSIS
4.1.1 POLITICAL FACTORS
4.1.2 ECONOMIC FACTORS
4.1.3 SOCIAL FACTORS
4.1.4 TECHNOLOGICAL FACTORS
4.1.5 ENVIRONMENTAL FACTORS
4.1.6 LEGAL FACTORS
4.2 PORTER’S FIVE FORCES ANALYSIS
4.2.1 THREAT OF NEW ENTRANTS
4.2.2 BARGAINING POWER OF SUPPLIERS
4.2.3 BARGAINING POWER OF BUYERS
4.2.4 THREAT OF SUBSTITUTE PRODUCTS
4.2.5 INDUSTRY RIVALRY
4.3 CLIMATE CHANGE SCENARIO
4.3.1 ENVIRONMENTAL CONCERNS
4.3.2 INDUSTRY RESPONSE
4.3.3 GOVERNMENT’S ROLE
4.3.4 ANALYST RECOMMENDATIONS
4.4 RAW MATERIAL COVERAGE
4.4.1 POLYETHYLENE (PE)
4.4.2 POLYPROPYLENE (PP)
4.4.3 POLYETHYLENE TEREPHTHALATE (PET)
4.4.4 ALUMINUM FOIL
4.4.5 PAPER & CELLULOSIC MATERIALS
4.5 SUPPLY CHAIN ANALYSIS
4.5.1 OVERVIEW
4.5.2 LOGISTICS COST SCENARIO
4.5.3 IMPORTANCE OF LOGISTICS SERVICE PROVIDERS
4.6 PRODUCTION CAPACITY OVERVIEW OF THE FLEXIBLE PACKAGING MARKET
4.7 TECHNOLOGICAL ADVANCEMENTS BY MANUFACTURERS
4.7.1 HIGH-PERFORMANCE BARRIER FILMS AND NANOCOMPOSITE STRUCTURES
4.7.2 MONO-MATERIAL INNOVATIONS FOR CIRCULARITY
4.7.3 DIGITAL PRINTING AND SMART CONVERTING TECHNOLOGIES
4.7.4 BIO-BASED AND COMPOSTABLE POLYMER DEVELOPMENT
4.7.5 SMART AND FUNCTIONAL PACKAGING INTEGRATION
4.7.6 ADVANCED SEALING AND FORMING MECHANISMS
4.7.7 AUTOMATION, ROBOTICS, AND AI-ENABLED MANUFACTURING
4.7.8 RECYCLING-COMPATIBLE ADHESIVES AND COATINGS
4.7.9 DATA-DRIVEN DESIGN AND LIFECYCLE ANALYTICS
4.7.10 TOWARD A SMART, CIRCULAR FUTURE
4.8 VENDOR SELECTION CRITERIA
4.8.1 MATERIAL AND PRODUCT PORTFOLIO BREADTH
4.8.2 TECHNOLOGICAL CAPABILITY AND INNOVATION READINESS
4.8.3 SUSTAINABILITY AND REGULATORY COMPLIANCE
4.8.4 MANUFACTURING CAPACITY AND GLOBAL FOOTPRINT
4.8.5 QUALITY ASSURANCE AND CERTIFICATION STANDARDS
4.8.6 CUSTOMIZATION AND DESIGN FLEXIBILITY
4.8.7 SUPPLY CHAIN TRANSPARENCY AND TRACEABILITY
4.8.8 COST COMPETITIVENESS AND TOTAL VALUE PROPOSITION
4.8.9 DIGITAL INTEGRATION AND AFTER-SALES SUPPORT
4.8.10 REPUTATION, STRATEGIC PARTNERSHIPS, AND MARKET ENDORSEMENT
4.8.11 SUMMARY
4.9 PRICING ANALYSIS
5 REGULATION COVERAGE
5.1 PRODUCT CODE
5.1.1 INDIAN STANDARD (IS) CODES
5.1.2 INTERNATIONAL STANDARD CODES
5.2 CERTIFIED STANDARDS
5.3 SAFETY STANDARDS
5.3.1 MATERIAL HANDLING & STORAGE
5.3.2 TRANSPORT & PRECAUTIONS
5.3.3 HARAD IDENTIFICATION
6 MARKET OVERVIEW
6.1 DRIVERS
6.1.1 GROWING DEMAND FROM THE FOOD & BEVERAGE SECTOR
6.1.2 SUSTAINABILITY AND ECO-FRIENDLY MATERIAL INNOVATIONS
6.1.3 COST-EFFECTIVENESS AND VERSATILE DESIGN FEATURES
6.1.4 EXPANSION OF E-COMMERCE AND HOME DELIVERY SERVICES
6.2 RESTRAINS
6.2.1 FLUCTUATING RAW MATERIAL PRICES AFFECTING PRODUCTION COSTS AND PROFIT MARGINS
6.2.2 LIMITED RECYCLING INFRASTRUCTURE HINDERING CIRCULAR ECONOMY AND SUSTAINABILITY GOALS
6.3 OPPORTUNITIES
6.3.1 ADVANCEMENTS IN SMART AND ACTIVE PACKAGING ENHANCING PRODUCT SHELF LIFE AND CONSUMER EXPERIENCE
6.3.2 RISING ADOPTION IN THE HEALTHCARE AND PHARMACEUTICAL SECTOR
6.3.3 EMERGING MARKETS DRIVING CONSUMPTION GROWTH THROUGH RISING DISPOSABLE INCOME AND CHANGING CONSUMER PREFERENCES
6.4 CHALLENGES
6.4.1 ENVIRONMENTAL AND REGULATORY PRESSURES SHAPING PACKAGING DESIGN AND SUSTAINABILITY PRACTICES
6.4.2 TECHNOLOGICAL BARRIERS IN RECYCLING MULTI-LAYER FILMS
7 GLOBAL FLEXIBLE PACKAGING MARKET, BY PRODUCT
7.1 OVERVIEW
7.2 POUCHES
7.3 BAGS AND SACKS
7.4 FILMS AND WRAPS
7.5 TUBES
7.6 SACHETS & STICK PACKS
7.7 LINERS
7.8 LABELS
7.9 TAPES
8 GLOBAL FLEXIBLE PACKAGING MARKET, BY MATERIAL
8.1 OVERVIEW
8.2 PLASTIC
8.3 PAPER
8.4 METAL
8.5 ADHESIVE AND COATINGS
8.6 INORGANIC OXIDES
8.7 OTHERS
9 GLOBAL FLEXIBLE PACKAGING MARKET, BY TECHNOLOGY
9.1 OVERVIEW
9.2 FLEXOGRAPHY
9.3 ROTOGRAVURE
9.4 DIGITAL
9.5 OTHERS
10 GLOBAL FLEXIBLE PACKAGING MARKET, BY END USE
10.1 OVERVIEW
10.2 FOOD
10.3 BEVERAGE
11 GLOBAL FLEXIBLE PACKAGING MARKET BY REGIONS
11.1 OVERVIEW
11.2 ASIA PACIFIC
11.2.1 CHINA
11.2.2 INDIA
11.2.3 JAPAN
11.2.4 AUSTRALIA & NEW ZEALAND
11.2.5 SOUTH KOREA
11.2.6 INDONESIA
11.2.7 THAILAND
11.2.8 MALAYSIA
11.2.9 PHILIPPINES
11.2.10 SINGAPORE
11.2.11 REST OF ASIA-PACIFIC
11.3 NORTH AMERICA
11.3.1 U.S.
11.3.2 CANADA
11.3.3 MEXICO
11.4 EUROPE
11.4.1 GERMANY
11.4.2 FRANCE
11.4.3 U.K.
11.4.4 ITALY
11.4.5 SPAIN
11.4.6 RUSSIA
11.4.7 TURKEY
11.4.8 NETHERLANDS
11.4.9 BELGIUM
11.4.10 SWITZERLAND
11.4.11 LUXEMBOURG
11.4.12 REST OF EUROPE
11.5 SOUTH AMERICA
11.5.1 BRAZIL
11.5.2 ARGENTINA
11.5.3 REST OF SOUTH AMERICA
11.6 MIDDLE EAST AND AFRICA
11.6.1 SAUDI ARABIA
11.6.2 UAE
11.6.3 SOUTH AFRICA
11.6.4 EGYPT
11.6.5 ISRAEL
11.6.6 REST OF MIDDLE EAST AND AFRICA
12 GLOBAL FLEXIBLE PACKAGING MARKET: COMPANY LANDSCAPE
12.1 MANUFACTURER COMPANY SHARE ANALYSIS: GLOBAL
12.2 COMPANY SHARE ANALYSIS: EUROPE
12.3 COMPANY SHARE ANALYSIS: ASIA-PACIFIC
12.4 COMPANY SHARE ANALYSIS: NORTH AMERICA
13 SWOT ANALYSIS
14 COMPANY PROFILES
14.1 WESTROCK COMPANY
14.1.1 COMPANY SNAPSHOT
14.1.2 REVENUE ANALYSIS
14.1.3 COMPANY SHARE ANALYSIS
14.1.4 PRODUCT PORTFOLIO
14.1.5 RECENT DEVELOPMENT
14.2 AMCOR PLC
14.2.1 COMPANY SNAPSHOT
14.2.2 REVENUE ANALYSIS
14.2.3 COMPANY SHARE ANALYSIS
14.2.4 PRODUCT PORTFOLIO
14.2.5 RECENT DEVELOPMENT
14.3 GRAPHIC PACKAGING INTERNATIONAL, LLC (SUBSIDIARY OF A. R. PACKAGING SOLUTIONS)
14.3.1 COMPANY SNAPSHOT
14.3.2 REVENUE ANALYSIS
14.3.3 COMPANY SHARE ANALYSIS
14.3.4 PRODUCT PORTFOLIO
14.3.5 RECENT DEVELOPMENT
14.4 SEALED AIR
14.4.1 COMPANY SNAPSHOT
14.4.2 REVENUE ANALYSIS
14.4.3 COMPANY SHARE ANALYSIS
14.4.4 PRODUCT PORTFOLIO
14.4.5 RECENT DEVELOPMENT
14.5 HUHTAMÄKI OYJ
14.5.1 COMPANY SNAPSHOT
14.5.2 REVENUE ANALYSIS
14.5.3 COMPANY SHARE ANALYSIS
14.5.4 PRODUCT PORTFOLIO
14.5.5 RECENT DEVELOPMENT
14.6 ALTANA
14.6.1 COMPANY SNAPSHOT
14.6.2 REVENUE ANALYSIS
14.6.3 PRODUCT PORTFOLIO
14.6.4 RECENT DEVELOPMENT
14.7 BBC CELLPACK PACKAGING
14.7.1 COMPANY SNAPSHOT
14.7.2 PRODUCT PORTFOLIO
14.7.3 RECENT DEVELOPMENT
14.8 BISCHOF+KLEIN SE & CO. KG
14.8.1 COMPANY SNAPSHOT
14.8.2 PRODUCT PORTFOLIO
14.8.3 RECENT DEVELOPMENT
14.9 CONSTANTIA FLEXIBLES
14.9.1 COMPANY SNAPSHOT
14.9.2 PRODUCT PORTFOLIO
14.9.3 RECENT DEVELOPMENT
14.1 COVERIS
14.10.1 COMPANY SNAPSHOT
14.10.2 PRODUCT PORTFOLIO
14.10.3 RECENT DEVELOPMENT
14.11 FLAIR FLEXIBLE PACKAGING CORPORATION.
14.11.1 COMPANY SNAPSHOT
14.11.2 PRODUCT PORTFOLIO
14.11.3 RECENT DEVELOPMENT
14.12 GOGLIO SPA
14.12.1 COMPANY SNAPSHOT
14.12.2 PRODUCT PORTFOLIO
14.12.3 RECENT DEVELOPMENT
14.13 MONDI.
14.13.1 COMPANY SNAPSHOT
14.13.2 REVENUE ANALYSIS
14.13.3 PRODUCT PORTFOLIO
14.13.4 RECENT DEVELOPMENT
14.14 PROAMPAC.
14.14.1 COMPANY SNAPSHOT
14.14.2 PRODUCT PORTFOLIO
14.14.3 RECENT DEVELOPMENT
14.15 SCHUR
14.15.1 COMPANY SNAPSHOT
14.15.2 PRODUCT PORTFOLIO
14.15.3 RECENT DEVELOPMENT
14.16 SONOCO PRODUCTS COMPANY
14.16.1 COMPANY SNAPSHOT
14.16.2 REVENUE ANALYSIS
14.16.3 PRODUCT PORTFOLIO
14.16.4 RECENT DEVELOPMENT
14.17 SÜDPACK
14.17.1 COMPANY SNAPSHOT
14.17.2 PRODUCT PORTFOLIO
14.17.3 RECENT DEVELOPMENT
14.18 WIPAK
14.18.1 COMPANY SNAPSHOT
14.18.2 PRODUCT PORTFOLIO
14.18.3 RECENT DEVELOPMENT
15 QUESTIONNAIRE
16 RELATED REPORTS
List of Table
TABLE 1 GLOBAL FLEXIBLE PACKAGING MARKET, BY PRODUCT, 2018-2032 (USD MILLION)
TABLE 2 GLOBAL POUCHES IN FLEXIBLE PACKAGING MARKET, BY REGION, 2018-2032 (USD MILLION)
TABLE 3 GLOBAL BAGS AND SACKS IN FLEXIBLE PACKAGING MARKET, BY REGION, 2018-2032 (USD MILLION)
TABLE 4 GLOBAL FILMS AND WRAPS IN FLEXIBLE PACKAGING MARKET, BY REGION, 2018-2032 (USD MILLION)
TABLE 5 GLOBAL TUBES IN FLEXIBLE PACKAGING MARKET, BY REGION, 2018-2032 (USD MILLION)
TABLE 6 GLOBAL SACHETS & STICK PACKS IN FLEXIBLE PACKAGING MARKET, BY REGION, 2018-2032 (USD MILLION)
TABLE 7 GLOBAL LINERS IN FLEXIBLE PACKAGING MARKET, BY REGION, 2018-2032 (USD MILLION)
TABLE 8 GLOBAL LABELS IN FLEXIBLE PACKAGING MARKET, BY REGION, 2018-2032 (USD MILLION)
TABLE 9 GLOBAL TAPES IN FLEXIBLE PACKAGING MARKET, BY REGION, 2018-2032 (USD MILLION)
TABLE 10 GLOBAL FLEXIBLE PACKAGING MARKET, BY MATERIAL, 2018-2032 (USD MILLION)
TABLE 11 GLOBAL PLASTIC IN FLEXIBLE PACKAGING MARKET, BY REGION, 2018-2032 (USD MILLION)
TABLE 12 GLOBAL PAPER IN FLEXIBLE PACKAGING MARKET, BY REGION, 2018-2032 (USD MILLION)
TABLE 13 GLOBAL METAL IN FLEXIBLE PACKAGING MARKET, BY REGION, 2018-2032 (USD MILLION)
TABLE 14 GLOBAL ADHESIVE AND COATINGS IN FLEXIBLE PACKAGING MARKET, BY REGION, 2018-2032 (USD MILLION)
TABLE 15 GLOBAL INORGANIC OXIDES IN FLEXIBLE PACKAGING MARKET, BY REGION, 2018-2032 (USD MILLION)
TABLE 16 GLOBAL OTHERS IN FLEXIBLE PACKAGING MARKET, BY REGION, 2018-2032 (USD MILLION)
TABLE 17 GLOBAL FLEXIBLE PACKAGING MARKET, BY TECHNOLOGY, 2018-2032 (USD THOUSAND)
TABLE 18 GLOBAL FLEXIBLE PACKAGING MARKET, BY END USE, 2018-2032 (USD MILLION)
TABLE 19 GLOBAL FOOD IN FLEXIBLE PACKAGING MARKET, BY REGION, 2018-2032 (USD MILLION)
TABLE 20 GLOBAL FOOD IN FLEXIBLE PACKAGING MARKET, BY TYPE, 2018-2032 (USD MILLION)
TABLE 21 GLOBAL BEVERAGE IN FLEXIBLE PACKAGING MARKET, BY REGION, 2018-2032 (USD MILLION)
TABLE 22 GLOBAL FLEXIBLE PACKAGING MARKET, BY REGION, 2018-2032 (USD MILLION)
TABLE 23 GLOBAL FLEXIBLE PACKAGING MARKET, BY PRODUCT, 2018-2032 (USD MILLION)
TABLE 24 GLOBAL FLEXIBLE PACKAGING MARKET, BY MATERIAL, 2018-2032 (USD MILLION)
TABLE 25 GLOBAL FLEXIBLE PACKAGING MARKET, BY END USE, 2018-2032 (USD MILLION)
TABLE 26 GLOBAL FOOD IN FLEXIBLE PACKAGING MARKET, BY TYPE, 2018-2032 (USD MILLION)
TABLE 27 GLOBAL FLEXIBLE PACKAGING MARKET, BY TECHNOLOGY, 2018-2032 (USD MILLION)
TABLE 28 ASIA-PACIFIC FLEXIBLE PACKAGING MARKET, BY COUNTRY, 2018-2032 (USD MILLION)
TABLE 29 ASIA-PACIFIC FLEXIBLE PACKAGING MARKET, BY PRODUCT, 2018-2032 (USD MILLION)
TABLE 30 ASIA-PACIFIC FLEXIBLE PACKAGING MARKET, BY MATERIAL, 2018-2032 (USD MILLION)
TABLE 31 ASIA-PACIFIC FLEXIBLE PACKAGING MARKET, BY END USE, 2018-2032 (USD MILLION)
TABLE 32 ASIA-PACIFIC FOOD IN FLEXIBLE PACKAGING MARKET, BY TYPE, 2018-2032 (USD MILLION)
TABLE 33 ASIA-PACIFIC FLEXIBLE PACKAGING MARKET, BY TECHNOLOGY, 2018-2032 (USD MILLION)
TABLE 34 CHINA FLEXIBLE PACKAGING MARKET, BY PRODUCT, 2018-2032 (USD MILLION)
TABLE 35 CHINA FLEXIBLE PACKAGING MARKET, BY MATERIAL, 2018-2032 (USD MILLION)
TABLE 36 CHINA FLEXIBLE PACKAGING MARKET, BY END USE, 2018-2032 (USD MILLION)
TABLE 37 CHINA FOOD IN FLEXIBLE PACKAGING MARKET, BY TYPE, 2018-2032 (USD MILLION)
TABLE 38 CHINA FLEXIBLE PACKAGING MARKET, BY TECHNOLOGY, 2018-2032 (USD MILLION)
TABLE 39 INDIA FLEXIBLE PACKAGING MARKET, BY PRODUCT, 2018-2032 (USD MILLION)
TABLE 40 INDIA FLEXIBLE PACKAGING MARKET, BY MATERIAL, 2018-2032 (USD MILLION)
TABLE 41 INDIA FLEXIBLE PACKAGING MARKET, BY END USE, 2018-2032 (USD MILLION)
TABLE 42 INDIA FOOD IN FLEXIBLE PACKAGING MARKET, BY TYPE, 2018-2032 (USD MILLION)
TABLE 43 INDIA FLEXIBLE PACKAGING MARKET, BY TECHNOLOGY, 2018-2032 (USD MILLION)
TABLE 44 JAPAN FLEXIBLE PACKAGING MARKET, BY PRODUCT, 2018-2032 (USD MILLION)
TABLE 45 JAPAN FLEXIBLE PACKAGING MARKET, BY MATERIAL, 2018-2032 (USD MILLION)
TABLE 46 JAPAN FLEXIBLE PACKAGING MARKET, BY END USE, 2018-2032 (USD MILLION)
TABLE 47 JAPAN FOOD IN FLEXIBLE PACKAGING MARKET, BY TYPE, 2018-2032 (USD MILLION)
TABLE 48 JAPAN FLEXIBLE PACKAGING MARKET, BY TECHNOLOGY, 2018-2032 (USD MILLION)
TABLE 49 AUSTRALIA & NEW ZEALAND FLEXIBLE PACKAGING MARKET, BY PRODUCT, 2018-2032 (USD MILLION)
TABLE 50 AUSTRALIA & NEW ZEALAND FLEXIBLE PACKAGING MARKET, BY MATERIAL, 2018-2032 (USD MILLION)
TABLE 51 AUSTRALIA & NEW ZEALAND FLEXIBLE PACKAGING MARKET, BY END USE, 2018-2032 (USD MILLION)
TABLE 52 AUSTRALIA & NEW ZEALAND FOOD IN FLEXIBLE PACKAGING MARKET, BY TYPE, 2018-2032 (USD MILLION)
TABLE 53 AUSTRALIA & NEW ZEALAND FLEXIBLE PACKAGING MARKET, BY TECHNOLOGY, 2018-2032 (USD MILLION)
TABLE 54 SOUTH KOREA FLEXIBLE PACKAGING MARKET, BY PRODUCT, 2018-2032 (USD MILLION)
TABLE 55 SOUTH KOREA FLEXIBLE PACKAGING MARKET, BY MATERIAL, 2018-2032 (USD MILLION)
TABLE 56 SOUTH KOREA FLEXIBLE PACKAGING MARKET, BY END USE, 2018-2032 (USD MILLION)
TABLE 57 SOUTH KOREA FOOD IN FLEXIBLE PACKAGING MARKET, BY TYPE, 2018-2032 (USD MILLION)
TABLE 58 SOUTH KOREA FLEXIBLE PACKAGING MARKET, BY TECHNOLOGY, 2018-2032 (USD MILLION)
TABLE 59 INDONESIA FLEXIBLE PACKAGING MARKET, BY PRODUCT, 2018-2032 (USD MILLION)
TABLE 60 INDONESIA FLEXIBLE PACKAGING MARKET, BY MATERIAL, 2018-2032 (USD MILLION)
TABLE 61 INDONESIA FLEXIBLE PACKAGING MARKET, BY END USE, 2018-2032 (USD MILLION)
TABLE 62 INDONESIA FOOD IN FLEXIBLE PACKAGING MARKET, BY TYPE, 2018-2032 (USD MILLION)
TABLE 63 INDONESIA FLEXIBLE PACKAGING MARKET, BY TECHNOLOGY, 2018-2032 (USD MILLION)
TABLE 64 THAILAND FLEXIBLE PACKAGING MARKET, BY PRODUCT, 2018-2032 (USD MILLION)
TABLE 65 THAILAND FLEXIBLE PACKAGING MARKET, BY MATERIAL, 2018-2032 (USD MILLION)
TABLE 66 THAILAND FLEXIBLE PACKAGING MARKET, BY END USE, 2018-2032 (USD MILLION)
TABLE 67 THAILAND FOOD IN FLEXIBLE PACKAGING MARKET, BY TYPE, 2018-2032 (USD MILLION)
TABLE 68 THAILAND FLEXIBLE PACKAGING MARKET, BY TECHNOLOGY, 2018-2032 (USD MILLION)
TABLE 69 MALAYSIA FLEXIBLE PACKAGING MARKET, BY PRODUCT, 2018-2032 (USD MILLION)
TABLE 70 MALAYSIA FLEXIBLE PACKAGING MARKET, BY MATERIAL, 2018-2032 (USD MILLION)
TABLE 71 MALAYSIA FLEXIBLE PACKAGING MARKET, BY END USE, 2018-2032 (USD MILLION)
TABLE 72 MALAYSIA FOOD IN FLEXIBLE PACKAGING MARKET, BY TYPE, 2018-2032 (USD MILLION)
TABLE 73 MALAYSIA FLEXIBLE PACKAGING MARKET, BY TECHNOLOGY, 2018-2032 (USD MILLION)
TABLE 74 PHILIPPINES FLEXIBLE PACKAGING MARKET, BY PRODUCT, 2018-2032 (USD MILLION)
TABLE 75 PHILIPPINES FLEXIBLE PACKAGING MARKET, BY MATERIAL, 2018-2032 (USD MILLION)
TABLE 76 PHILIPPINES FLEXIBLE PACKAGING MARKET, BY END USE, 2018-2032 (USD MILLION)
TABLE 77 PHILIPPINES FOOD IN FLEXIBLE PACKAGING MARKET, BY TYPE, 2018-2032 (USD MILLION)
TABLE 78 PHILIPPINES FLEXIBLE PACKAGING MARKET, BY TECHNOLOGY, 2018-2032 (USD MILLION)
TABLE 79 SINGAPORE FLEXIBLE PACKAGING MARKET, BY PRODUCT, 2018-2032 (USD MILLION)
TABLE 80 SINGAPORE FLEXIBLE PACKAGING MARKET, BY MATERIAL, 2018-2032 (USD MILLION)
TABLE 81 SINGAPORE FLEXIBLE PACKAGING MARKET, BY END USE, 2018-2032 (USD MILLION)
TABLE 82 SINGAPORE FOOD IN FLEXIBLE PACKAGING MARKET, BY TYPE, 2018-2032 (USD MILLION)
TABLE 83 SINGAPORE FLEXIBLE PACKAGING MARKET, BY TECHNOLOGY, 2018-2032 (USD MILLION)
TABLE 84 REST OF ASIA-PACIFIC FLEXIBLE PACKAGING MARKET, BY PRODUCT, 2018-2032 (USD MILLION)
TABLE 85 REST OF ASIA-PACIFIC FLEXIBLE PACKAGING MARKET, BY MATERIAL, 2018-2032 (USD MILLION)
TABLE 86 REST OF ASIA-PACIFIC FLEXIBLE PACKAGING MARKET, BY END USE, 2018-2032 (USD MILLION)
TABLE 87 REST OF ASIA-PACIFIC FOOD IN FLEXIBLE PACKAGING MARKET, BY TYPE, 2018-2032 (USD MILLION)
TABLE 88 REST OF ASIA-PACIFIC FLEXIBLE PACKAGING MARKET, BY TECHNOLOGY, 2018-2032 (USD MILLION)
TABLE 89 NORTH AMERICA FLEXIBLE PACKAGING MARKET, BY COUNTRY, 2018-2032 (USD MILLION)
TABLE 90 NORTH AMERICA FLEXIBLE PACKAGING MARKET, BY PRODUCT, 2018-2032 (USD MILLION)
TABLE 91 NORTH AMERICA FLEXIBLE PACKAGING MARKET, BY MATERIAL, 2018-2032 (USD MILLION)
TABLE 92 NORTH AMERICA FLEXIBLE PACKAGING MARKET, BY END USE, 2018-2032 (USD MILLION)
TABLE 93 NORTH AMERICA FOOD IN FLEXIBLE PACKAGING MARKET, BY TYPE, 2018-2032 (USD MILLION)
TABLE 94 NORTH AMERICA FLEXIBLE PACKAGING MARKET, BY TECHNOLOGY, 2018-2032 (USD MILLION)
TABLE 95 U.S. FLEXIBLE PACKAGING MARKET, BY PRODUCT, 2018-2032 (USD MILLION)
TABLE 96 U.S. FLEXIBLE PACKAGING MARKET, BY MATERIAL, 2018-2032 (USD MILLION)
TABLE 97 U.S. FLEXIBLE PACKAGING MARKET, BY END USE, 2018-2032 (USD MILLION)
TABLE 98 U.S. FOOD IN FLEXIBLE PACKAGING MARKET, BY TYPE, 2018-2032 (USD MILLION)
TABLE 99 U.S. FLEXIBLE PACKAGING MARKET, BY TECHNOLOGY, 2018-2032 (USD MILLION)
TABLE 100 CANADA FLEXIBLE PACKAGING MARKET, BY PRODUCT, 2018-2032 (USD MILLION)
TABLE 101 CANADA FLEXIBLE PACKAGING MARKET, BY MATERIAL, 2018-2032 (USD MILLION)
TABLE 102 CANADA FLEXIBLE PACKAGING MARKET, BY END USE, 2018-2032 (USD MILLION)
TABLE 103 CANADA FOOD IN FLEXIBLE PACKAGING MARKET, BY TYPE, 2018-2032 (USD MILLION)
TABLE 104 CANADA FLEXIBLE PACKAGING MARKET, BY TECHNOLOGY, 2018-2032 (USD MILLION)
TABLE 105 MEXICO FLEXIBLE PACKAGING MARKET, BY PRODUCT, 2018-2032 (USD MILLION)
TABLE 106 MEXICO FLEXIBLE PACKAGING MARKET, BY MATERIAL, 2018-2032 (USD MILLION)
TABLE 107 MEXICO FLEXIBLE PACKAGING MARKET, BY END USE, 2018-2032 (USD MILLION)
TABLE 108 MEXICO FOOD IN FLEXIBLE PACKAGING MARKET, BY TYPE, 2018-2032 (USD MILLION)
TABLE 109 MEXICO FLEXIBLE PACKAGING MARKET, BY TECHNOLOGY, 2018-2032 (USD MILLION)
TABLE 110 EUROPE FLEXIBLE PACKAGING MARKET, BY COUNTRY, 2018-2032 (USD MILLION)
TABLE 111 EUROPE FLEXIBLE PACKAGING MARKET, BY PRODUCT, 2018-2032 (USD MILLION)
TABLE 112 EUROPE FLEXIBLE PACKAGING MARKET, BY MATERIAL, 2018-2032 (USD MILLION)
TABLE 113 EUROPE FLEXIBLE PACKAGING MARKET, BY END USE, 2018-2032 (USD MILLION)
TABLE 114 EUROPE FOOD IN FLEXIBLE PACKAGING MARKET, BY TYPE, 2018-2032 (USD MILLION)
TABLE 115 EUROPE FLEXIBLE PACKAGING MARKET, BY TECHNOLOGY, 2018-2032 (USD MILLION)
TABLE 116 GERMANY FLEXIBLE PACKAGING MARKET, BY PRODUCT, 2018-2032 (USD MILLION)
TABLE 117 GERMANY FLEXIBLE PACKAGING MARKET, BY MATERIAL, 2018-2032 (USD MILLION)
TABLE 118 GERMANY FLEXIBLE PACKAGING MARKET, BY END USE, 2018-2032 (USD MILLION)
TABLE 119 GERMANY FOOD IN FLEXIBLE PACKAGING MARKET, BY TYPE, 2018-2032 (USD MILLION)
TABLE 120 GERMANY FLEXIBLE PACKAGING MARKET, BY TECHNOLOGY, 2018-2032 (USD MILLION)
TABLE 121 FRANCE FLEXIBLE PACKAGING MARKET, BY PRODUCT, 2018-2032 (USD MILLION)
TABLE 122 FRANCE FLEXIBLE PACKAGING MARKET, BY MATERIAL, 2018-2032 (USD MILLION)
TABLE 123 FRANCE FLEXIBLE PACKAGING MARKET, BY END USE, 2018-2032 (USD MILLION)
TABLE 124 FRANCE FOOD IN FLEXIBLE PACKAGING MARKET, BY TYPE, 2018-2032 (USD MILLION)
TABLE 125 FRANCE FLEXIBLE PACKAGING MARKET, BY TECHNOLOGY, 2018-2032 (USD MILLION)
TABLE 126 U.K. FLEXIBLE PACKAGING MARKET, BY PRODUCT, 2018-2032 (USD MILLION)
TABLE 127 U.K. FLEXIBLE PACKAGING MARKET, BY MATERIAL, 2018-2032 (USD MILLION)
TABLE 128 U.K. FLEXIBLE PACKAGING MARKET, BY END USE, 2018-2032 (USD MILLION)
TABLE 129 U.K. FOOD IN FLEXIBLE PACKAGING MARKET, BY TYPE, 2018-2032 (USD MILLION)
TABLE 130 U.K. FLEXIBLE PACKAGING MARKET, BY TECHNOLOGY, 2018-2032 (USD MILLION)
TABLE 131 ITALY FLEXIBLE PACKAGING MARKET, BY PRODUCT, 2018-2032 (USD MILLION)
TABLE 132 ITALY FLEXIBLE PACKAGING MARKET, BY MATERIAL, 2018-2032 (USD MILLION)
TABLE 133 ITALY FLEXIBLE PACKAGING MARKET, BY END USE, 2018-2032 (USD MILLION)
TABLE 134 ITALY FOOD IN FLEXIBLE PACKAGING MARKET, BY TYPE, 2018-2032 (USD MILLION)
TABLE 135 ITALY FLEXIBLE PACKAGING MARKET, BY TECHNOLOGY, 2018-2032 (USD MILLION)
TABLE 136 SPAIN FLEXIBLE PACKAGING MARKET, BY PRODUCT, 2018-2032 (USD MILLION)
TABLE 137 SPAIN FLEXIBLE PACKAGING MARKET, BY MATERIAL, 2018-2032 (USD MILLION)
TABLE 138 SPAIN FLEXIBLE PACKAGING MARKET, BY END USE, 2018-2032 (USD MILLION)
TABLE 139 SPAIN FOOD IN FLEXIBLE PACKAGING MARKET, BY TYPE, 2018-2032 (USD MILLION)
TABLE 140 SPAIN FLEXIBLE PACKAGING MARKET, BY TECHNOLOGY, 2018-2032 (USD MILLION)
TABLE 141 RUSSIA FLEXIBLE PACKAGING MARKET, BY PRODUCT, 2018-2032 (USD MILLION)
TABLE 142 RUSSIA FLEXIBLE PACKAGING MARKET, BY MATERIAL, 2018-2032 (USD MILLION)
TABLE 143 RUSSIA FLEXIBLE PACKAGING MARKET, BY END USE, 2018-2032 (USD MILLION)
TABLE 144 RUSSIA FOOD IN FLEXIBLE PACKAGING MARKET, BY TYPE, 2018-2032 (USD MILLION)
TABLE 145 RUSSIA FLEXIBLE PACKAGING MARKET, BY TECHNOLOGY, 2018-2032 (USD MILLION)
TABLE 146 TURKEY FLEXIBLE PACKAGING MARKET, BY PRODUCT, 2018-2032 (USD MILLION)
TABLE 147 TURKEY FLEXIBLE PACKAGING MARKET, BY MATERIAL, 2018-2032 (USD MILLION)
TABLE 148 TURKEY FLEXIBLE PACKAGING MARKET, BY END USE, 2018-2032 (USD MILLION)
TABLE 149 TURKEY FOOD IN FLEXIBLE PACKAGING MARKET, BY TYPE, 2018-2032 (USD MILLION)
TABLE 150 TURKEY FLEXIBLE PACKAGING MARKET, BY TECHNOLOGY, 2018-2032 (USD MILLION)
TABLE 151 NETHERLANDS FLEXIBLE PACKAGING MARKET, BY PRODUCT, 2018-2032 (USD MILLION)
TABLE 152 NETHERLANDS FLEXIBLE PACKAGING MARKET, BY MATERIAL, 2018-2032 (USD MILLION)
TABLE 153 NETHERLANDS FLEXIBLE PACKAGING MARKET, BY END USE, 2018-2032 (USD MILLION)
TABLE 154 NETHERLANDS FOOD IN FLEXIBLE PACKAGING MARKET, BY TYPE, 2018-2032 (USD MILLION)
TABLE 155 NETHERLANDS FLEXIBLE PACKAGING MARKET, BY TECHNOLOGY, 2018-2032 (USD MILLION)
TABLE 156 BELGIUM FLEXIBLE PACKAGING MARKET, BY PRODUCT, 2018-2032 (USD MILLION)
TABLE 157 BELGIUM FLEXIBLE PACKAGING MARKET, BY MATERIAL, 2018-2032 (USD MILLION)
TABLE 158 BELGIUM FLEXIBLE PACKAGING MARKET, BY END USE, 2018-2032 (USD MILLION)
TABLE 159 BELGIUM FOOD IN FLEXIBLE PACKAGING MARKET, BY TYPE, 2018-2032 (USD MILLION)
TABLE 160 BELGIUM FLEXIBLE PACKAGING MARKET, BY TECHNOLOGY, 2018-2032 (USD MILLION)
TABLE 161 SWITZERLAND FLEXIBLE PACKAGING MARKET, BY PRODUCT, 2018-2032 (USD MILLION)
TABLE 162 SWITZERLAND FLEXIBLE PACKAGING MARKET, BY MATERIAL, 2018-2032 (USD MILLION)
TABLE 163 SWITZERLAND FLEXIBLE PACKAGING MARKET, BY END USE, 2018-2032 (USD MILLION)
TABLE 164 SWITZERLAND FOOD IN FLEXIBLE PACKAGING MARKET, BY TYPE, 2018-2032 (USD MILLION)
TABLE 165 SWITZERLAND FLEXIBLE PACKAGING MARKET, BY TECHNOLOGY, 2018-2032 (USD MILLION)
TABLE 166 LUXEMBOURG FLEXIBLE PACKAGING MARKET, BY PRODUCT, 2018-2032 (USD MILLION)
TABLE 167 LUXEMBOURG FLEXIBLE PACKAGING MARKET, BY MATERIAL, 2018-2032 (USD MILLION)
TABLE 168 LUXEMBOURG FLEXIBLE PACKAGING MARKET, BY END USE, 2018-2032 (USD MILLION)
TABLE 169 LUXEMBOURG FOOD IN FLEXIBLE PACKAGING MARKET, BY TYPE, 2018-2032 (USD MILLION)
TABLE 170 LUXEMBOURG FLEXIBLE PACKAGING MARKET, BY TECHNOLOGY, 2018-2032 (USD MILLION)
TABLE 171 REST OF EUROPE FLEXIBLE PACKAGING MARKET, BY PRODUCT, 2018-2032 (USD MILLION)
TABLE 172 REST OF EUROPE FLEXIBLE PACKAGING MARKET, BY MATERIAL, 2018-2032 (USD MILLION)
TABLE 173 REST OF EUROPE FLEXIBLE PACKAGING MARKET, BY END USE, 2018-2032 (USD MILLION)
TABLE 174 REST OF EUROPE FOOD IN FLEXIBLE PACKAGING MARKET, BY TYPE, 2018-2032 (USD MILLION)
TABLE 175 REST OF EUROPE FLEXIBLE PACKAGING MARKET, BY TECHNOLOGY, 2018-2032 (USD MILLION)
TABLE 176 SOUTH AMERICA FLEXIBLE PACKAGING MARKET, BY COUNTRY, 2018-2032 (USD MILLION)
TABLE 177 SOUTH AMERICA FLEXIBLE PACKAGING MARKET, BY PRODUCT, 2018-2032 (USD MILLION)
TABLE 178 SOUTH AMERICA FLEXIBLE PACKAGING MARKET, BY MATERIAL, 2018-2032 (USD MILLION)
TABLE 179 SOUTH AMERICA FLEXIBLE PACKAGING MARKET, BY END USE, 2018-2032 (USD MILLION)
TABLE 180 SOUTH AMERICA FOOD IN FLEXIBLE PACKAGING MARKET, BY TYPE, 2018-2032 (USD MILLION)
TABLE 181 SOUTH AMERICA FLEXIBLE PACKAGING MARKET, BY TECHNOLOGY, 2018-2032 (USD MILLION)
TABLE 182 BRAZIL FLEXIBLE PACKAGING MARKET, BY PRODUCT, 2018-2032 (USD MILLION)
TABLE 183 BRAZIL FLEXIBLE PACKAGING MARKET, BY MATERIAL, 2018-2032 (USD MILLION)
TABLE 184 BRAZIL FLEXIBLE PACKAGING MARKET, BY END USE, 2018-2032 (USD MILLION)
TABLE 185 BRAZIL FOOD IN FLEXIBLE PACKAGING MARKET, BY TYPE, 2018-2032 (USD MILLION)
TABLE 186 BRAZIL FLEXIBLE PACKAGING MARKET, BY TECHNOLOGY, 2018-2032 (USD MILLION)
TABLE 187 ARGENTINA FLEXIBLE PACKAGING MARKET, BY PRODUCT, 2018-2032 (USD MILLION)
TABLE 188 ARGENTINA FLEXIBLE PACKAGING MARKET, BY MATERIAL, 2018-2032 (USD MILLION)
TABLE 189 ARGENTINA FLEXIBLE PACKAGING MARKET, BY END USE, 2018-2032 (USD MILLION)
TABLE 190 ARGENTINA FOOD IN FLEXIBLE PACKAGING MARKET, BY TYPE, 2018-2032 (USD MILLION)
TABLE 191 ARGENTINA FLEXIBLE PACKAGING MARKET, BY TECHNOLOGY, 2018-2032 (USD MILLION)
TABLE 192 REST OF SOUTH AMERICA FLEXIBLE PACKAGING MARKET, BY PRODUCT, 2018-2032 (USD MILLION)
TABLE 193 REST OF SOUTH AMERICA FLEXIBLE PACKAGING MARKET, BY MATERIAL, 2018-2032 (USD MILLION)
TABLE 194 REST OF SOUTH AMERICA FLEXIBLE PACKAGING MARKET, BY END USE, 2018-2032 (USD MILLION)
TABLE 195 REST OF SOUTH AMERICA FOOD IN FLEXIBLE PACKAGING MARKET, BY TYPE, 2018-2032 (USD MILLION)
TABLE 196 REST OF SOUTH AMERICA FLEXIBLE PACKAGING MARKET, BY TECHNOLOGY, 2018-2032 (USD MILLION)
TABLE 197 MIDDLE EAST AND AFRICA FLEXIBLE PACKAGING MARKET, BY COUNTRY, 2018-2032 (USD MILLION)
TABLE 198 MIDDLE EAST AND AFRICA FLEXIBLE PACKAGING MARKET, BY PRODUCT, 2018-2032 (USD MILLION)
TABLE 199 MIDDLE EAST AND AFRICA FLEXIBLE PACKAGING MARKET, BY MATERIAL, 2018-2032 (USD MILLION)
TABLE 200 MIDDLE EAST AND AFRICA FLEXIBLE PACKAGING MARKET, BY END USE, 2018-2032 (USD MILLION)
TABLE 201 MIDDLE EAST AND AFRICA FOOD IN FLEXIBLE PACKAGING MARKET, BY TYPE, 2018-2032 (USD MILLION)
TABLE 202 MIDDLE EAST AND AFRICA FLEXIBLE PACKAGING MARKET, BY TECHNOLOGY, 2018-2032 (USD MILLION)
TABLE 203 SAUDI ARABIA FLEXIBLE PACKAGING MARKET, BY PRODUCT, 2018-2032 (USD MILLION)
TABLE 204 SAUDI ARABIA FLEXIBLE PACKAGING MARKET, BY MATERIAL, 2018-2032 (USD MILLION)
TABLE 205 SAUDI ARABIA FLEXIBLE PACKAGING MARKET, BY END USE, 2018-2032 (USD MILLION)
TABLE 206 SAUDI ARABIA FOOD IN FLEXIBLE PACKAGING MARKET, BY TYPE, 2018-2032 (USD MILLION)
TABLE 207 SAUDI ARABIA FLEXIBLE PACKAGING MARKET, BY TECHNOLOGY, 2018-2032 (USD MILLION)
TABLE 208 UAE FLEXIBLE PACKAGING MARKET, BY PRODUCT, 2018-2032 (USD MILLION)
TABLE 209 UAE FLEXIBLE PACKAGING MARKET, BY MATERIAL, 2018-2032 (USD MILLION)
TABLE 210 UAE FLEXIBLE PACKAGING MARKET, BY END USE, 2018-2032 (USD MILLION)
TABLE 211 UAE FOOD IN FLEXIBLE PACKAGING MARKET, BY TYPE, 2018-2032 (USD MILLION)
TABLE 212 UAE FLEXIBLE PACKAGING MARKET, BY TECHNOLOGY, 2018-2032 (USD MILLION)
TABLE 213 SOUTH AFRICA FLEXIBLE PACKAGING MARKET, BY PRODUCT, 2018-2032 (USD MILLION)
TABLE 214 SOUTH AFRICA FLEXIBLE PACKAGING MARKET, BY MATERIAL, 2018-2032 (USD MILLION)
TABLE 215 SOUTH AFRICA FLEXIBLE PACKAGING MARKET, BY END USE, 2018-2032 (USD MILLION)
TABLE 216 SOUTH AFRICA FOOD IN FLEXIBLE PACKAGING MARKET, BY TYPE, 2018-2032 (USD MILLION)
TABLE 217 SOUTH AFRICA FLEXIBLE PACKAGING MARKET, BY TECHNOLOGY, 2018-2032 (USD MILLION)
TABLE 218 EGYPT FLEXIBLE PACKAGING MARKET, BY PRODUCT, 2018-2032 (USD MILLION)
TABLE 219 EGYPT FLEXIBLE PACKAGING MARKET, BY MATERIAL, 2018-2032 (USD MILLION)
TABLE 220 EGYPT FLEXIBLE PACKAGING MARKET, BY END USE, 2018-2032 (USD MILLION)
TABLE 221 EGYPT FOOD IN FLEXIBLE PACKAGING MARKET, BY TYPE, 2018-2032 (USD MILLION)
TABLE 222 EGYPT FLEXIBLE PACKAGING MARKET, BY TECHNOLOGY, 2018-2032 (USD MILLION)
TABLE 223 ISRAEL FLEXIBLE PACKAGING MARKET, BY PRODUCT, 2018-2032 (USD MILLION)
TABLE 224 ISRAEL FLEXIBLE PACKAGING MARKET, BY MATERIAL, 2018-2032 (USD MILLION)
TABLE 225 ISRAEL FLEXIBLE PACKAGING MARKET, BY END USE, 2018-2032 (USD MILLION)
TABLE 226 ISRAEL FOOD IN FLEXIBLE PACKAGING MARKET, BY TYPE, 2018-2032 (USD MILLION)
TABLE 227 ISRAEL FLEXIBLE PACKAGING MARKET, BY TECHNOLOGY, 2018-2032 (USD MILLION)
TABLE 228 REST OF MIDDLE EAST AND AFRICA FLEXIBLE PACKAGING MARKET, BY PRODUCT, 2018-2032 (USD MILLION)
TABLE 229 REST OF MIDDLE EAST AND AFRICA FLEXIBLE PACKAGING MARKET, BY MATERIAL, 2018-2032 (USD MILLION)
TABLE 230 REST OF MIDDLE EAST AND AFRICA FLEXIBLE PACKAGING MARKET, BY END USE, 2018-2032 (USD MILLION)
TABLE 231 REST OF MIDDLE EAST AND AFRICA FOOD IN FLEXIBLE PACKAGING MARKET, BY TYPE, 2018-2032 (USD MILLION)
TABLE 232 REST OF MIDDLE EAST AND AFRICA FLEXIBLE PACKAGING MARKET, BY TECHNOLOGY, 2018-2032 (USD MILLION)
List of Figure
FIGURE 1 GLOBAL FLEXIBLE PACKAGING MARKET: SEGMENTATION
FIGURE 2 GLOBAL FLEXIBLE PACKAGING MARKET: DATA TRIANGULATION
FIGURE 3 GLOBAL FLEXIBLE PACKAGING MARKET: DROC ANALYSIS
FIGURE 4 GLOBAL FLEXIBLE PACKAGING MARKET: GLOBAL VS REGIONAL MARKET ANALYSIS
FIGURE 5 GLOBAL FLEXIBLE PACKAGING MARKET: COMPANY RESEARCH ANALYSIS
FIGURE 6 GLOBAL FLEXIBLE PACKAGING MARKET: INTERVIEW DEMOGRAPHICS
FIGURE 7 GLOBAL FLEXIBLE PACKAGING MARKET: DBMR MARKET POSITION GRID
FIGURE 8 GLOBAL FLEXIBLE PACKAGING MARKET: VENDOR SHARE ANALYSIS
FIGURE 9 GLOBAL FLEXIBLE PACKAGING MARKET: MULTIVARIATE MODELING
FIGURE 10 GLOBAL FLEXIBLE PACKAGING MARKET: MATERIAL TIMELINE CURVE
FIGURE 11 GLOBAL FLEXIBLE PACKAGING MARKET: END USE INDUSTRY COVERAGE GRID
FIGURE 12 GLOBAL FLEXIBLE PACKAGING MARKET: SEGMENTATION
FIGURE 13 TWO SEGMENTS COMPRISE THE GLOBAL FLEXIBLE PACKAGING MARKET, BY END USE INDUSTRY (2024)
FIGURE 14 GLOBAL FLEXIBLE PACKAGING MARKET: EXECUTIVE SUMMARY
FIGURE 15 STRATEGIC DECISIONS
FIGURE 16 GROWING DEMAND IN FODD & BEVERAGE SECTOR IS EXPECTED TO DRIVE THE GLOBAL FLEXIBLE PACKAGING MARKET DURING THE FORECAST PERIOD OF 2025 TO 2032
FIGURE 17 END USE INDUSTRY SEGMENT IS EXPECTED TO ACCOUNT FOR THE LARGEST SHARE OF THE GLOBAL FLEXIBLE PACKAGING MARKET IN 2025 & 2032
FIGURE 18 ASIA-PACIFIC IS EXPECTED TO BE THE DOMINANT AND FASTEST GROWING REGION IN THE GLOBAL FLEXIBLE PACKAGING MARKET IN THE FORECAST PERIOD OF 2025 TO 2032
FIGURE 19 ASIA PACIFIC IS THE FASTEST-GROWING REGION FOR THE GLOBAL FLEXIBLE PACKAGING MARKET IN THE FORECAST PERIOD OF 2025 TO 2032
FIGURE 20 PESTEL ANALYSIS
FIGURE 21 PORTER’S FIVE FORCES ANALYSIS
FIGURE 22 GLOBAL FLEXIBLE PACKAGING MARKET, 2024-2040, AVERAGE SELLING PRICE (USD/KG)
FIGURE 23 DROC ANALYSIS
FIGURE 24 GLOBAL FLEXIBLE PACKAGING MARKET, BY PRODUCT, 2024
FIGURE 25 GLOBAL FLEXIBLE PACKAGING MARKET: BY MATERIAL, 2024
FIGURE 26 GLOBAL FLEXIBLE PACKAGING MARKET: BY TECHNOLOGY, 2024
FIGURE 27 GLOBAL FLEXIBLE PACKAGING MARKET: BY END USE, 2024
FIGURE 28 GLOBAL FLEXIBLE PACKAGING MARKET SNAPSHOT
FIGURE 29 GLOBAL FLEXIBLE PACKAGING MARKET: COMPANY SHARE 2024 (%)
FIGURE 30 EUROPE FLEXIBLE PACKAGING MARKET: COMPANY SHARE 2024 (%)
FIGURE 31 ASIA-PACIFIC FLEXIBLE PACKAGING MARKET: COMPANY SHARE 2024 (%)
FIGURE 32 NORTH AMERICA FLEXIBLE PACKAGING MARKET: COMPANY SHARE 2024 (%)
Global Flexible Packaging Market, Supply Chain Analysis and Ecosystem Framework
To support market growth and help clients navigate the impact of geopolitical shifts, DBMR has integrated in-depth supply chain analysis into its Global Flexible Packaging Market research reports. This addition empowers clients to respond effectively to global changes affecting their industries. The supply chain analysis section includes detailed insights such as Global Flexible Packaging Market consumption and production by country, price trend analysis, the impact of tariffs and geopolitical developments, and import and export trends by country and HSN code. It also highlights major suppliers with data on production capacity and company profiles, as well as key importers and exporters. In addition to research, DBMR offers specialized supply chain consulting services backed by over a decade of experience, providing solutions like supplier discovery, supplier risk assessment, price trend analysis, impact evaluation of inflation and trade route changes, and comprehensive market trend analysis.
Data collection and base year analysis are done using data collection modules with large sample sizes. The stage includes obtaining market information or related data through various sources and strategies. It includes examining and planning all the data acquired from the past in advance. It likewise envelops the examination of information inconsistencies seen across different information sources. The market data is analysed and estimated using market statistical and coherent models. Also, market share analysis and key trend analysis are the major success factors in the market report. To know more, please request an analyst call or drop down your inquiry.
The key research methodology used by DBMR research team is data triangulation which involves data mining, analysis of the impact of data variables on the market and primary (industry expert) validation. Data models include Vendor Positioning Grid, Market Time Line Analysis, Market Overview and Guide, Company Positioning Grid, Patent Analysis, Pricing Analysis, Company Market Share Analysis, Standards of Measurement, Global versus Regional and Vendor Share Analysis. To know more about the research methodology, drop in an inquiry to speak to our industry experts.
Data Bridge Market Research is a leader in advanced formative research. We take pride in servicing our existing and new customers with data and analysis that match and suits their goal. The report can be customized to include price trend analysis of target brands understanding the market for additional countries (ask for the list of countries), clinical trial results data, literature review, refurbished market and product base analysis. Market analysis of target competitors can be analyzed from technology-based analysis to market portfolio strategies. We can add as many competitors that you require data about in the format and data style you are looking for. Our team of analysts can also provide you data in crude raw excel files pivot tables (Fact book) or can assist you in creating presentations from the data sets available in the report.


