
Global Free From Food Market
Market Size in USD Billion
 USD
121.57 Billion
USD
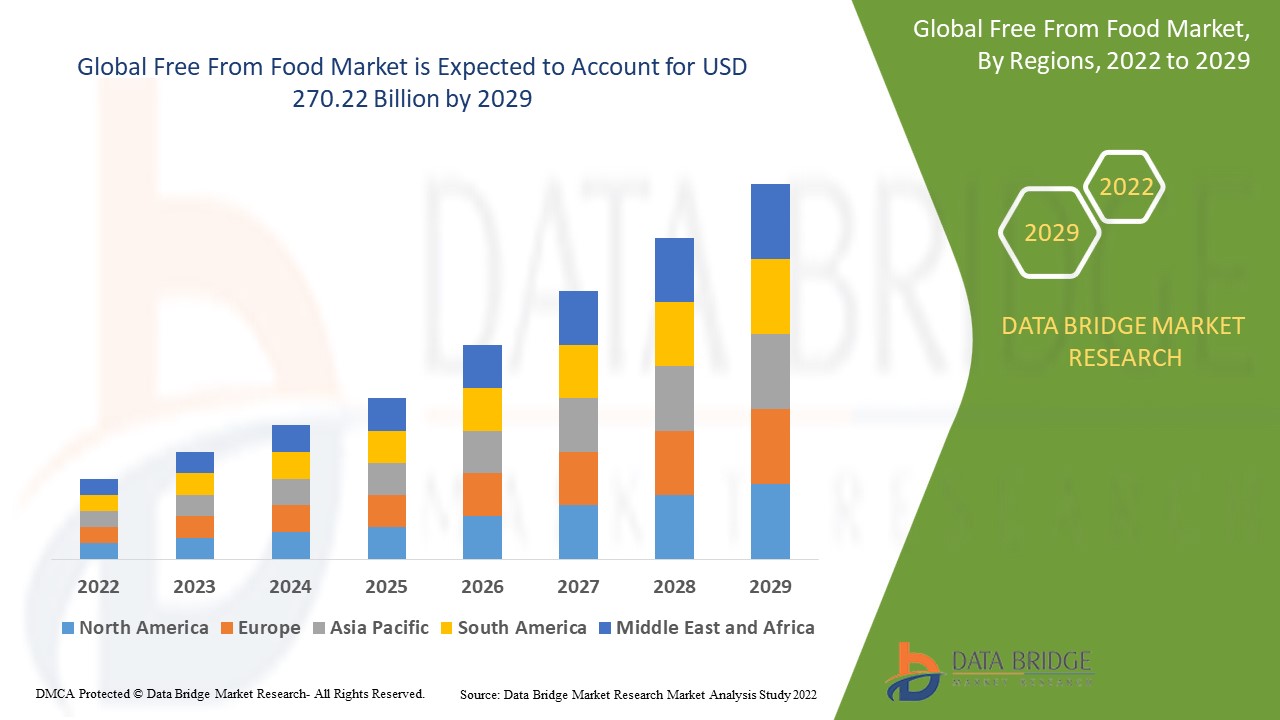
270.22 Billion
2021
2029
USD
121.57 Billion
USD
270.22 Billion
2021
2029
| 2022 - 2029 | |
| USD 121.57 Billion | |
| USD 270.22 Billion | |
| % | |
|
Free From Food Market Analysis and Size
In the last decade, the evolution of social media has played a significant role in raising awareness about the negative effects of traditional or conventional food and the benefits of free-from food. The free-from-food market is also thriving as a result of medical advancements that have analysed and provided a solid understanding of various immune system responses, allowing consumers to make informed decisions when purchasing food products.
Data Bridge Market Research analyses that the free from food market was valued at USD 121.57 billion in 2021 and is expected to reach the value of USD 270.22 billion by 2029, at a CAGR of 10.50% during the forecast period of 2022-2029. In addition to the insights on market scenarios such as market value, growth rate, segmentation, geographical coverage, and major players, the market reports curated by the Data Bridge Market Research also include in-depth expert analysis, geographically represented company-wise production and capacity, network layouts of distributors and partners, detailed and updated price trend analysis and deficit analysis of supply chain and demand.
Free From Food Market Scope and Segmentation
|
Report Metric |
Details |
|
Forecast Period |
2022 to 2029 |
|
Base Year |
2021 |
|
Historic Years |
2020 (Customizable to 2014 - 2019) |
|
Quantitative Units |
Revenue in USD Billion, Volumes in Units, Pricing in USD |
|
Segments Covered |
Type (Dairy-Free, Sugar-Free, Carb-Free, Lactose-Free, Artificial Ingredient-Free Food, Others), Distribution Channel (Supermarket & Hypermarket, Specialty Stores, Online Retail Stores, Others), Application (Bakery & Cereal Products, Beverage, Dairy, Oil, Snacks) |
|
Countries Covered |
U.S., Canada and Mexico in North America, Germany, Sweden, Poland, Denmark, France, U.K., Netherlands, Switzerland, Belgium, Russia, Italy, Spain, Turkey, Rest of Europe in Europe, China, Japan, India, South Korea, Singapore, Malaysia, Australia, Thailand, Indonesia, Philippines, Rest of Asia-Pacific (APAC) in the Asia-Pacific (APAC), Saudi Arabia, U.A.E, South Africa, Egypt, Israel, Rest of Middle East and Africa (MEA) as a part of Middle East and Africa (MEA), Brazil, Argentina and Rest of South America as part of South America |
|
Market Players Covered |
DSM (Netherlands), BASF SE (Germany), Lonza Group (Switzerland), Glanbia Plc (Ireland), ADM (U.S.), Farbest Brands (U.S.), SternVitamin GmbH & Co. K.G. (Germany), Adisseo (France), BTSA Biotechnologias Aplicadas S.L. (Spain)Rabar Pty Ltd (Australia) Golden Omega (Chile), Kinomega Biopharm Inc. (China), Sinomega Biotech Engineering Co. Ltd. (China), Polaris (U.S.), Pharma Marine AS (Norway), Huatai Biopharm (China), ALGISYS LLC (U.S.), and Biosearch Life (Spain) |
|
Opportunities |
|
Market Definition
Free-from food is a subset of clean-label edible products that are beneficial to overall health and well-being. Gluten-free, allergen-free, vegan, GMO-free, and lactose-free foods are among the most popular. Free-from foods include a wide range of fruits, vegetables, meat, cereals, pulses, spices, dairy products, and so on. These products are grown according to strict guidelines and are free of pesticides, synthetic fertilizers, hormones, antibiotics, and other chemicals.
Global Free From Food Market Dynamics
Drivers
- Growing chronic diseases due to unhealthy consumption of food
The high prevalence of various lifestyle diseases, such as diabetes, obesity, cardiovascular disease, and so on, is increasing demand for healthy food items. Furthermore, rising concerns about the presence of synthetic additives, preservatives, and GMOs in conventionally processed food products are fuelling the free-from food market. Aside from that, rising consumer living standards, fuelled by rising disposable income levels, have increased per capita spending on high-quality and premium food products.
- Growing demand for clean label products
Clean label products are in high demand because consumers look for plant-based proteins, and vegetarian foods are considered healthier. Clean label products are completely natural, non-GMO, and made with real ingredients, with no additives or preservatives. The main benefit of a clean label product is that consumers can easily read the ingredients and that it is organic and free of chemicals. Companies should have good packaging design, food product transparency, and simple ingredients with functional benefits.
Opportunity
The growing influence of social media trends and numerous celebrity endorsements promoting the consumption of gluten-free, vegan, and low-calorie food products is catalysing market growth even further. Furthermore, the global expansion of the superfood sector has boosted the market for clean-label products with long shelf lives and high nutritional value.
Restraints
However, the shelf life of free-from food is limited, which will pose a significant challenge to the market's growth. The high costs of the items will further limit the scope of growth for the free-form food market.
This free from food market report provides details of new recent developments, trade regulations, import-export analysis, production analysis, value chain optimization, market share, impact of domestic and localized market players, analyses opportunities in terms of emerging revenue pockets, changes in market regulations, strategic market growth analysis, market size, category market growths, application niches and dominance, product approvals, product launches, geographic expansions, technological innovations in the market. To gain more info on the free from food market contact Data Bridge Market Research for an Analyst Brief, our team will help you take an informed market decision to achieve market growth.
Impact and Current Market Scenario of Raw Material Shortage and Shipping Delays
Data Bridge Market Research offers a high-level analysis of the market and delivers information by keeping in account the impact and current market environment of raw material shortage and shipping delays. This translates into assessing strategic possibilities, creating effective action plans, and assisting businesses in making important decisions.
Apart from the standard report, we also offer in-depth analysis of the procurement level from forecasted shipping delays, distributor mapping by region, commodity analysis, production analysis, price mapping trends, sourcing, category performance analysis, supply chain risk management solutions, advanced benchmarking, and other services for procurement and strategic support.
COVID-19 Impact on Free-From Food Market
COVID-19 increased consumer interest in healthy eating significantly. This significant shift can be seen in industries such as gluten-free and dairy-free products. As a result of the pandemic, the global population prioritised health over other concerns, shifting toward healthier food products such as free-from items. Furthermore, during the COVID-19 outbreak, people began experimenting with new dairy alternatives as they sought healthier snacking options.
Expected Impact of Economic Slowdown on the Pricing and Availability of Products
When economic activity slows, industries begin to suffer. The forecasted effects of the economic downturn on the pricing and accessibility of the products are taken into account in the market insight reports and intelligence services provided by DBMR. With this, our clients can typically keep one step ahead of their competitors, project their sales and revenue, and estimate their profit and loss expenditures.
Recent Development
- Danone Food Company launched a new product in its "dairy-like" segment called "Silk Nextmilk and So Delicious Wondermilk" in 2022.
- Mondelez International will introduce the "Philadelphia vegan cream cheese alternative" in 2022. According to the company, this new product is entirely plant-based.
- In 2021, The Why Meat Co., an Australian company, developed a gluten-free, plant-based sausage roll made with pea protein derived from yellow and green split peas.
Global Free From Food Market Scope
The free-from food market is segmented on the basis of type, distribution channel and application. The growth amongst these segments will help you analyse meagre growth segments in the industries and provide the users with a valuable market overview and market insights to help them make strategic decisions for identifying core market applications.
Type
- Dairy-Free
- Sugar-Free
- Carb-Free
- Lactose-Free
- Artificial Ingredient Free Food
- Others
Application
- Bakery & Cereal Products
- Beverage
- Dairy
- Oil
- Snacks
Distribution channel
- Supermarket/ hypermarket
- Convenience stores
- Specialist stores
- Internet retailing
- Others.
Free From Food Market Regional Analysis/Insights
The free from food market is analysed and market size insights and trends are provided by country, type, distribution channel and application as referenced above.
The countries covered in the free from food market report are U.S., Canada and Mexico in North America, Germany, Sweden, Poland, Denmark, France, U.K., Netherlands, Switzerland, Belgium, Russia, Italy, Spain, Turkey, Rest of Europe in Europe, China, Japan, India, South Korea, Singapore, Malaysia, Australia, Thailand, Indonesia, Philippines, Rest of Asia-Pacific (APAC) in the Asia-Pacific (APAC), Saudi Arabia, U.A.E, South Africa, Egypt, Israel, Rest of Middle East and Africa (MEA) as a part of Middle East and Africa (MEA), Brazil, Argentina and Rest of South America as part of South America.
North America is dominating the free from food market due to various types of gluten-free, lactose-free, and natural ingredients because of increased demand from the food and beverage industries.
Asia-Pacific is expected to have significant free from food market opportunities in the future. Furthermore, the region has seen a significant increase in the number of millennials, who are the primary food consumers. As a result, the rise in millennial population is expected to provide a lucrative opportunity for the free from food market growth.
The country section of the report also provides individual market impacting factors and changes in market regulation that impact the current and future trends of the market. Data points like down-stream and upstream value chain analysis, technical trends and porter's five forces analysis, case studies are some of the pointers used to forecast the market scenario for individual countries. Also, the presence and availability of global brands and their challenges faced due to large or scarce competition from local and domestic brands, impact of domestic tariffs and trade routes are considered while providing forecast analysis of the country data.
Competitive Landscape and Free From Food Market Share Analysis
The free from food market competitive landscape provides details by competitor. Details included are company overview, company financials, revenue generated, market potential, investment in research and development, new market initiatives, global presence, production sites and facilities, production capacities, company strengths and weaknesses, product launch, product width and breadth, application dominance. The above data points provided are only related to the companies' focus related to free from food market.
Some of the major players operating in the free from food market are:
- DSM (Netherlands)
- BASF SE (Germany)
- Lonza Group (Switzerland)
- Glanbia Plc (Ireland)
- ADM (U.S.)
- Farbest Brands (U.S.)
- SternVitamin GmbH & Co. KG (Germany)
- Adisseo (France)
- BTSA Biotechnologias Aplicadas S.L. (Spain)
- Rabar Pty Ltd (Australia)
- Golden Omega (Chile)
- Kinomega Biopharm Inc. (China)
- Sinomega Biotech Engineering Co. Ltd. (China)
- Polaris (U.S.)
- Pharma Marine AS (Norway)
- Huatai Biopharm (China)
- ALGISYS LLC (U.S.)
- Biosearch Life (Spain)
SKU-

- Interactive Data Analysis Dashboard
- Company Analysis Dashboard for high growth potential opportunities
- Research Analyst Access for customization & queries
- Competitor Analysis with Interactive dashboard
- Latest News, Updates & Trend analysis
- Harness the Power of Benchmark Analysis for Comprehensive Competitor Tracking
Table of Content
1 INTRODUCTION
1.1 OBJECTIVES OF THE STUDY..
1.2 MARKET DEFINITION
1.3 OVERVIEW OF GLOBAL FREE FROM FOOD MARKET
1.4 CURRENCY AND PRICING
1.5 LIMITATION
1.6 MARKETS COVERED
2 MARKET SEGMENTATION
2.1 KEY TAKEAWAYS
2.2 ARRIVING AT THE GLOBAL FREE FROM FOOD MARKETSIZE
2.2.1 VENDOR POSITIONING GRID
2.2.2 TECHNOLOGY LIFE LINE CURVE
2.2.3 MARKET GUIDE
2.2.4 COMPANY POSITIONING GRID
2.2.5 COMAPANY MARKET SHARE ANALYSIS
2.2.6 MULTIVARIATE MODELLING
2.2.7 DEMAND AND SUPPLY-SIDE VARIABLES
2.2.8 TOP TO BOTTOM ANALYSIS
2.2.9 STANDARDS OF MEASUREMENT
2.2.10 VENDOR SHARE ANALYSIS
2.2.11 DATA POINTS FROM KEY PRIMARY INTERVIEWS
2.2.12 DATA POINTS FROM KEY SECONDARY DATABASES
2.3 GLOBAL FREE FROM FOOD MARKET: RESEARCH SNAPSHOT
2.4 ASSUMPTIONS
3 MARKET OVERVIEW
3.1 DRIVERS
3.2 RESTRAINTS
3.3 OPPORTUNITIES
3.4 CHALLENGES
4 EXECUTIVE SUMMARY
5 PREMIUM INSIGHTS
5.1 SUPPLY CHAIN ANALYSIS
5.2 FACTORS INFLUENCING PURCHASING DECISION
5.3 INDUSTRY TRENDS AND FUTURE PERSPECTIVES
5.4 GROWTH STRATEGIES ADOPTED BY KEY PLAYERS
5.5 SHOPPING BEHAVIOUR AND DYNAMICS
5.5.1 RECOMMENDATION FROM FAMILY & FRIENDS
5.5.2 RESEARCH
5.5.3 IMPULSIVE
5.5.4 ADVERTISEMENT
5.5.4.1. TELEVISION ADVERTISEMENT
5.5.4.2. ONLINE ADVERTISEMENT
5.5.4.3. IN-STORE ADVERTISEMENT
5.5.4.4. OUTDOOR ADVERTISEMENT
5.6 PRIVATE LABEL VS BRAND ANALYSIS
5.7 PROMOTIONAL ACTIVITIES
5.8 CONSUMER DISPOSABLE INCOME DYNAMICS/SPEND DYNAMICS
5.9 NEW PRODUCT LAUNCH STRATEGY
5.9.1 NUMBER OF NEW PRODUCT LAUNCH
5.9.1.1. LINE EXTENSTION
5.9.1.2. NEW PACKAGING
5.9.1.3. RE-LAUNCHED
5.9.1.4. NEW FORMULATION
5.1 CONSUMER LEVEL TRENDS
5.11 MEETING CONSUMER REQUIREMENT
6 IMPACT OF ECONOMIC SLOW DOWN ON MARKET
6.1 IMPACT ON PRICE
6.2 IMPACT ON SUPPLY CHAIN
6.3 IMPACT ON SHIPMENT
6.4 IMPACT ON COMPANY’S STRATEGIC DECISIONS
7 REGULATORY FRAMEWORK AND GUIDELINES
8 PRICING INDEX
9 BRAND OUTLOOK
9.1 COMPARATIVE BRAND ANALYSIS
9.2 PRODUCT VS BRAND OVERVIEW
10 GLOBAL FREE FROM FOOD MARKET, BY PRODUCT TYPE, 2021-2030, (USD MILLION)
10.1 OVERVIEW
10.2 SOY FREE
10.3 GLUTEN FREE
10.4 DAIRY FREE
10.5 NUTS FREE
10.6 FAT FREE
10.7 SUGAR FREE
10.8 CALORIE FREE
10.9 ARTIFICIAL PRESERVATIVE FREE
10.1 ARTIFICIAL COLOUR FREE
10.11 OTHERS (IF ANY)
11 GLOBAL FREE FROM FOOD MARKET, BY PRODUCT CATEGORY, 2021-2030, (USD MILLION)
11.1 OVERVIEW
11.2 BAKERY
11.2.1 BAKERY, BY TYPE
11.2.1.1. BREAD & ROLLS
11.2.1.2. CAKES, PASTRIES & TRUFFLE
11.2.1.3. BISCUIT
11.2.1.4. TART & PIES
11.2.1.5. BROWNIES
11.2.1.6. COOKIES & CRACKERS
11.2.1.7. TORTILLA
11.2.1.8. OTHERS
11.2.2 BAKERY, BY PRODUCT TYPE
11.2.2.1. SOY FREE
11.2.2.2. GLUTEN FREE
11.2.2.3. DAIRY FREE
11.2.2.4. NUTS FREE
11.2.2.5. FAT FREE
11.2.2.6. SUGAR FREE
11.2.2.7. CALORIE FREE
11.2.2.8. ARTIFICIAL PRESERVATIVE FREE
11.2.2.9. ARTIFICIAL COLOUR FREE
11.2.2.10. OTHERS (IF ANY)
11.3 DAIRY PRODUCTS
11.3.1 DAIRY PRODUCTS, BY TYPE
11.3.1.1. YOGURT
11.3.1.2. ICE CREAM
11.3.1.3. CHEESE
11.3.1.4. OTHERS
11.3.2 DAIRY PRODUCTS, BY PRODUCT TYPE
11.3.2.1. SOY FREE
11.3.2.2. GLUTEN FREE
11.3.2.3. DAIRY FREE
11.3.2.4. NUTS FREE
11.3.2.5. FAT FREE
11.3.2.6. SUGAR FREE
11.3.2.7. CALORIE FREE
11.3.2.8. ARTIFICIAL PRESERVATIVE FREE
11.3.2.9. ARTIFICIAL COLOUR FREE
11.3.2.10. OTHERS (IF ANY)
11.4 PROCESSED FOOD
11.4.1 PROCESSED FOOD, BY TYPE
11.4.1.1. READY MEALS
11.4.1.2. SAUCES, DRESSINGS AND CONDIMENTS
11.4.1.3. SOUPS
11.4.1.4. JAMS, PRESERVES & MARMALADES
11.4.1.5. CANNED FRUITS & VEGETABLES
11.4.1.6. FRUIT & VEGETABLE PUREE
11.4.1.7. OTHERS
11.4.2 PROCESSED FOOD, BY PRODUCT TYPE
11.4.2.1. SOY FREE
11.4.2.2. GLUTEN FREE
11.4.2.3. DAIRY FREE
11.4.2.4. NUTS FREE
11.4.2.5. FAT FREE
11.4.2.6. SUGAR FREE
11.4.2.7. CALORIE FREE
11.4.2.8. ARTIFICIAL PRESERVATIVE FREE
11.4.2.9. ARTIFICIAL COLOUR FREE
11.4.2.10. OTHERS (IF ANY)
11.5 CONFECTIONERY
11.5.1 CONFECTIONERY, BY TYPE
11.5.1.1. HARD-BOILED SWEETS
11.5.1.2. MINTS
11.5.1.3. GUMS & JELLIES
11.5.1.4. CHOCOLATE
11.5.1.5. CHOCOLATE SYRUPS
11.5.1.6. CARAMELS & TOFFEES
11.5.1.7. OTHERS
11.5.2 CONFECTIONERY, BY PRODUCT TYPE
11.5.2.1. SOY FREE
11.5.2.2. GLUTEN FREE
11.5.2.3. DAIRY FREE
11.5.2.4. NUTS FREE
11.5.2.5. FAT FREE
11.5.2.6. SUGAR FREE
11.5.2.7. CALORIE FREE
11.5.2.8. ARTIFICIAL PRESERVATIVE FREE
11.5.2.9. ARTIFICIAL COLOUR FREE
11.5.2.10. OTHERS (IF ANY)
11.6 FROZEN DESSERTS
11.6.1 FROZEN DESSERTS, BY TYPE
11.6.1.1. GELATO
11.6.1.2. CUSTARD
11.6.1.3. SORBET
11.6.1.4. OTHERS
11.6.2 FROZEN DESSERTS, BY PRODUCT TYPE
11.6.2.1. SOY FREE
11.6.2.2. GLUTEN FREE
11.6.2.3. DAIRY FREE
11.6.2.4. NUTS FREE
11.6.2.5. FAT FREE
11.6.2.6. SUGAR FREE
11.6.2.7. CALORIE FREE
11.6.2.8. ARTIFICIAL PRESERVATIVE FREE
11.6.2.9. ARTIFICIAL COLOUR FREE
11.6.2.10. OTHERS (IF ANY)
11.7 FUNCTIONAL FOOD
11.7.1 FUNCTIONAL FOOD, BY TYPE
11.7.1.1. BABY FOOD
11.7.1.2. MEAT AND SEAFOOD PRODUCTS
11.7.1.3. HONEY
11.7.1.4. NUTRITIONAL BARS
11.7.1.4.1. NUTRITIONAL BARS, BY TYPE
11.7.1.4.1.1 CEREAL BARS
11.7.1.4.1.1.1. CEREAL BARS, BY CATEGORY
A. GRANOLA BARS
B. OAT BARS
C. RICE BARS
D. MIXED CEREAL BARS
E. OTHERS
11.7.1.4.1.2 NUT BARS
11.7.1.4.1.2.1. NUT BARS, BY CATEGORY
A. ALMOND
B. CASHEW
C. PEANUT
D. DATES
E. HAZELNUTS
F. OTHERS
11.7.1.5. BREAKFAST CEREALS
11.7.2 FUNCTIONAL FOOD, BY PRODUCT TYPE
11.7.2.1. SOY FREE
11.7.2.2. GLUTEN FREE
11.7.2.3. DAIRY FREE
11.7.2.4. NUTS FREE
11.7.2.5. FAT FREE
11.7.2.6. SUGAR FREE
11.7.2.7. CALORIE FREE
11.7.2.8. ARTIFICIAL PRESERVATIVE FREE
11.7.2.9. ARTIFICIAL COLOUR FREE
11.7.2.10. OTHERS (IF ANY)
11.8 CONVENIENCE FOOD
11.8.1 CONVENIENCE FOOD, BY TYPE
11.8.1.1. NOODLES
11.8.1.1.1. NOODLES, BY TYPE
11.8.1.1.1.1 REGULAR NOODLES
11.8.1.1.1.2 INSTANT NOODLES
11.8.1.2. PIZZA & PASTA
11.8.1.3. SANCKS & EXTRUDED SNACKS
11.8.1.4. BITES
11.8.1.5. WEDGES
11.8.1.6. NUGGETS
11.8.1.7. OTHERS
11.8.2 CONVENIENCE FOOD, BY PRODUCT TYPE
11.8.2.1. SOY FREE
11.8.2.2. GLUTEN FREE
11.8.2.3. DAIRY FREE
11.8.2.4. NUTS FREE
11.8.2.5. FAT FREE
11.8.2.6. SUGAR FREE
11.8.2.7. CALORIE FREE
11.8.2.8. ARTIFICIAL PRESERVATIVE FREE
11.8.2.9. ARTIFICIAL COLOUR FREE
11.8.2.10. OTHERS (IF ANY)
11.9 BEVERAGES
11.9.1 BEVERAGES, BY TYPE
11.9.1.1. TEA & COFFEE
11.9.1.1.1. TEA
11.9.1.1.1.1 TEA, BY TYPE
11.9.1.1.1.1.1. GREEN TEA
11.9.1.1.1.1.2. BLACK TEA
11.9.1.1.1.1.3. MATCHA
11.9.1.1.1.1.4. HERBAL TEA
11.9.1.1.1.1.5. FERMENTED TEA
11.9.1.1.1.1.6. OTHERS
11.9.1.1.1.2 TEA, BY FLAVORS
11.9.1.1.1.2.1. LEMON
11.9.1.1.1.2.2. PEACH
11.9.1.1.1.2.3. MINT
11.9.1.1.1.2.4. LYCHEE
11.9.1.1.1.2.5. GINGER
11.9.1.1.1.2.6. MIXED
11.9.1.1.1.2.7. OTHERS
11.9.1.1.2. COFFEE
11.9.1.1.2.1 CAFFEINATED DRINKS
11.9.1.1.2.1.1. COFFEE DRINKS
11.9.1.1.2.1.2. ICED COFFEE
11.9.1.1.2.1.3. OTHERS
11.9.1.1.2.2 DECAFFEINATED COFFEE
11.9.1.2. JUICES
11.9.1.3. VEGETABLE DRINKS
11.9.1.4. PLANT-BASED MILK
11.9.1.4.1. PLANT-BASED MILK, BY TYPE
11.9.1.4.1.1 SOY MILK
11.9.1.4.1.2 OAT MILK
11.9.1.4.1.3 ALMOND MILK
11.9.1.4.1.4 CASHEW MILK
11.9.1.4.1.5 OTHERS
11.9.1.5. MILK-BASED DRINKS
11.9.1.6. DRINKABLE YOGURTS
11.9.1.7. SPORTS & ENERGY DRINKS
11.9.1.7.1. SPORTS DRINK
11.9.1.7.1.1 ISOTONIC
11.9.1.7.1.2 HYPERTONIC
11.9.1.7.1.3 HYPOTONIC
11.9.1.7.2. ENERGY DRINK
11.9.1.7.2.1 ENERGY DRINK, BY TYPE
11.9.1.7.2.1.1. STILL
11.9.1.7.2.1.2. CARBONATED
11.9.1.8. OTHERS
11.9.2 BEVERAGES, BY PRODUCT TYPE
11.9.2.1. SOY FREE
11.9.2.2. GLUTEN FREE
11.9.2.3. DAIRY FREE
11.9.2.4. NUTS FREE
11.9.2.5. FAT FREE
11.9.2.6. SUGAR FREE
11.9.2.7. CALORIE FREE
11.9.2.8. ARTIFICIAL PRESERVATIVE FREE
11.9.2.9. ARTIFICIAL COLOUR FREE
11.9.2.10. OTHERS (IF ANY)
12 GLOBAL FREE FROM FOOD MARKET, BY NATURE, 2021-2030, (USD MILLION)
12.1 OVERVIEW
12.2 ORGANIC
12.3 CONVENTIONAL
13 GLOBAL FREE FROM FOOD MARKET, BY GEOGRAPHY
13.1 OVERVIEW (ALL SEGMENTATION PROVIDED ABOVE IS REPRESNTED IN THIS CHAPTER BY COUNTRY)
13.2 NORTH AMERICA
13.2.1 U.S.
13.2.2 CANADA
13.2.3 MEXICO
13.3 EUROPE
13.3.1 GERMANY
13.3.2 U.K.
13.3.3 ITALY
13.3.4 FRANCE
13.3.5 SPAIN
13.3.6 SWITZERLAND
13.3.7 NETHERLANDS
13.3.8 BELGIUM
13.3.9 RUSSIA
13.3.10 TURKEY
13.3.11 NORWAY
13.3.12 FINLAND
13.3.13 SWEDEN
13.3.14 DENMARK
13.3.15 POLAND
13.3.16 REST OF EUROPE
13.4 ASIA-PACIFIC
13.4.1 JAPAN
13.4.2 CHINA
13.4.3 SOUTH KOREA
13.4.4 INDIA
13.4.5 AUSTRALIA
13.4.6 SINGAPORE
13.4.7 THAILAND
13.4.8 INDONESIA
13.4.9 MALAYSIA
13.4.10 PHILIPPINES
13.4.11 TAIWAN
13.4.12 VIETNAM
13.4.13 NEW ZEALAND
13.4.14 REST OF ASIA-PACIFIC
13.5 SOUTH AMERICA
13.5.1 BRAZIL
13.5.2 ARGENTINA
13.5.3 REST OF SOUTH AMERICA
13.6 MIDDLE EAST AND AFRICA
13.6.1 SOUTH AFRICA
13.6.2 UAE
13.6.3 SAUDI ARABIA
13.6.4 KUWAIT
13.6.5 EGYPT
13.6.6 ISRAEL
13.6.7 OMAN
13.6.8 BAHRAIN
13.6.9 REST OF MIDDLE EAST AND AFRICA
14 GLOBAL FREE FROM FOOD MARKET, COMPANY LANDSCAPE
14.1 COMPANY SHARE ANALYSIS: GLOBAL
14.2 COMPANY SHARE ANALYSIS: NORTH AMERICA
14.3 COMPANY SHARE ANALYSIS: EUROPE
14.4 COMPANY SHARE ANALYSIS: ASIA-PACIFIC
14.5 MERGERS & ACQUISITIONS
14.6 NEW PRODUCT DEVELOPMENT & APPROVALS
14.7 EXPANSIONS & PARTNERSHIP
14.8 REGULATORY CHANGES
15 GLOBAL FREE FROM FOOD MARKET, SWOT & DBMR ANALYSIS
16 GLOBAL FREE FROM FOOD MARKET, COMPANY PROFILE
16.1 GENERAL MILLS INC
16.1.1 COMPANY OVERVIEW
16.1.2 REVENUE ANALYSIS
16.1.3 GEOGRAPHICAL PRESENCE
16.1.4 PRODUCT PORTFOLIO
16.1.5 RECENT DEVELOPMENTS
16.2 DANONE
16.2.1 COMPANY OVERVIEW
16.2.2 REVENUE ANALYSIS
16.2.3 GEOGRAPHICAL PRESENCE
16.2.4 PRODUCT PORTFOLIO
16.2.5 RECENT DEVELOPMENTS
16.3 UNITED NATURAL FOODS, INC.
16.3.1 COMPANY OVERVIEW
16.3.2 REVENUE ANALYSIS
16.3.3 GEOGRAPHICAL PRESENCE
16.3.4 PRODUCT PORTFOLIO
16.3.5 RECENT DEVELOPMENTS
16.4 AMY’S KITCHEN
16.4.1 COMPANY OVERVIEW
16.4.2 REVENUE ANALYSIS
16.4.3 GEOGRAPHICAL PRESENCE
16.4.4 PRODUCT PORTFOLIO
16.4.5 RECENT DEVELOPMENTS
16.5 ORGANIC VALLEY
16.5.1 COMPANY OVERVIEW
16.5.2 REVENUE ANALYSIS
16.5.3 GEOGRAPHICAL PRESENCE
16.5.4 PRODUCT PORTFOLIO
16.5.5 RECENT DEVELOPMENTS
16.6 NEWMAN'S OWN INC.
16.6.1 COMPANY OVERVIEW
16.6.2 REVENUE ANALYSIS
16.6.3 GEOGRAPHICAL PRESENCE
16.6.4 PRODUCT PORTFOLIO
16.6.5 RECENT DEVELOPMENTS
16.7 PEPSICO INC.
16.7.1 COMPANY OVERVIEW
16.7.2 REVENUE ANALYSIS
16.7.3 GEOGRAPHICAL PRESENCE
16.7.4 PRODUCT PORTFOLIO
16.7.5 RECENT DEVELOPMENTS
16.8 THE KROGER CO.
16.8.1 COMPANY OVERVIEW
16.8.2 REVENUE ANALYSIS
16.8.3 GEOGRAPHICAL PRESENCE
16.8.4 PRODUCT PORTFOLIO
16.8.5 RECENT DEVELOPMENTS
16.9 CLIF BAR & COMPANY
16.9.1 COMPANY OVERVIEW
16.9.2 REVENUE ANALYSIS
16.9.3 GEOGRAPHICAL PRESENCE
16.9.4 PRODUCT PORTFOLIO
16.9.5 RECENT DEVELOPMENTS
16.1 THE KRAFT HEINZ COMPANY
16.10.1 COMPANY OVERVIEW
16.10.2 REVENUE ANALYSIS
16.10.3 GEOGRAPHICAL PRESENCE
16.10.4 PRODUCT PORTFOLIO
16.10.5 RECENT DEVELOPMENTS
16.11 WM MORRISON
16.11.1 COMPANY OVERVIEW
16.11.2 REVENUE ANALYSIS
16.11.3 GEOGRAPHICAL PRESENCE
16.11.4 PRODUCT PORTFOLIO
16.11.5 RECENT DEVELOPMENTS
16.12 HAIN CELESTIAL
16.12.1 COMPANY OVERVIEW
16.12.2 REVENUE ANALYSIS
16.12.3 GEOGRAPHICAL PRESENCE
16.12.4 PRODUCT PORTFOLIO
16.12.5 RECENT DEVELOPMENTS
16.13 DAIRY FARMERS OF AMERICA, INC.
16.13.1 COMPANY OVERVIEW
16.13.2 REVENUE ANALYSIS
16.13.3 GEOGRAPHICAL PRESENCE
16.13.4 PRODUCT PORTFOLIO
16.13.5 RECENT DEVELOPMENTS
16.14 AMUL
16.14.1 COMPANY OVERVIEW
16.14.2 REVENUE ANALYSIS
16.14.3 GEOGRAPHICAL PRESENCE
16.14.4 PRODUCT PORTFOLIO
16.14.5 RECENT DEVELOPMENTS
16.15 THE HERSHEY COMPANY
16.15.1 COMPANY OVERVIEW
16.15.2 REVENUE ANALYSIS
16.15.3 GEOGRAPHICAL PRESENCE
16.15.4 PRODUCT PORTFOLIO
16.15.5 RECENT DEVELOPMENTS
16.16 CONAGRA BRANDS, INC.
16.16.1 COMPANY OVERVIEW
16.16.2 REVENUE ANALYSIS
16.16.3 GEOGRAPHICAL PRESENCE
16.16.4 PRODUCT PORTFOLIO
16.16.5 RECENT DEVELOPMENTS
16.17 NESTLÉ
16.17.1 COMPANY OVERVIEW
16.17.2 REVENUE ANALYSIS
16.17.3 GEOGRAPHICAL PRESENCE
16.17.4 PRODUCT PORTFOLIO
16.17.5 RECENT DEVELOPMENTS
16.18 EDEN FOODS
16.18.1 COMPANY OVERVIEW
16.18.2 REVENUE ANALYSIS
16.18.3 GEOGRAPHICAL PRESENCE
16.18.4 PRODUCT PORTFOLIO
16.18.5 RECENT DEVELOPMENTS
16.19 SUNOPTA
16.19.1 COMPANY OVERVIEW
16.19.2 REVENUE ANALYSIS
16.19.3 GEOGRAPHICAL PRESENCE
16.19.4 PRODUCT PORTFOLIO
16.19.5 RECENT DEVELOPMENTS
16.2 UNCLE MATT'S ORGANIC
16.20.1 COMPANY OVERVIEW
16.20.2 REVENUE ANALYSIS
16.20.3 GEOGRAPHICAL PRESENCE
16.20.4 PRODUCT PORTFOLIO
16.20.5 RECENT DEVELOPMENTS
16.21 PS ORGANIC
16.21.1 COMPANY OVERVIEW
16.21.2 REVENUE ANALYSIS
16.21.3 GEOGRAPHICAL PRESENCE
16.21.4 PRODUCT PORTFOLIO
16.21.5 RECENT DEVELOPMENTS
16.22 THE COCA-COLA COMPANY
16.22.1 COMPANY OVERVIEW
16.22.2 REVENUE ANALYSIS
16.22.3 GEOGRAPHICAL PRESENCE
16.22.4 PRODUCT PORTFOLIO
16.22.5 RECENT DEVELOPMENTS
16.23 LUNDBERG FAMILY FARMS
16.23.1 COMPANY OVERVIEW
16.23.2 REVENUE ANALYSIS
16.23.3 GEOGRAPHICAL PRESENCE
16.23.4 PRODUCT PORTFOLIO
16.23.5 RECENT DEVELOPMENTS
16.24 NATURE'S PATH
16.24.1 COMPANY OVERVIEW
16.24.2 REVENUE ANALYSIS
16.24.3 GEOGRAPHICAL PRESENCE
16.24.4 PRODUCT PORTFOLIO
16.24.5 RECENT DEVELOPMENTS
16.25 STONYFIELD
16.25.1 COMPANY OVERVIEW
16.25.2 REVENUE ANALYSIS
16.25.3 GEOGRAPHICAL PRESENCE
16.25.4 PRODUCT PORTFOLIO
16.25.5 RECENT DEVELOPMENTS
16.26 FRONTIER CO-OP
16.26.1 COMPANY OVERVIEW
16.26.2 REVENUE ANALYSIS
16.26.3 GEOGRAPHICAL PRESENCE
16.26.4 PRODUCT PORTFOLIO
16.26.5 RECENT DEVELOPMENTS
16.27 NOW FOODS
16.27.1 COMPANY OVERVIEW
16.27.2 REVENUE ANALYSIS
16.27.3 GEOGRAPHICAL PRESENCE
16.27.4 PRODUCT PORTFOLIO
16.27.5 RECENT DEVELOPMENTS
16.28 PLUM ORGANICS
16.28.1 COMPANY OVERVIEW
16.28.2 REVENUE ANALYSIS
16.28.3 GEOGRAPHICAL PRESENCE
16.28.4 PRODUCT PORTFOLIO
16.28.5 RECENT DEVELOPMENTS
*NOTE: THE COMPANIES PROFILED IS NOT EXHAUSTIVE LIST AND IS AS PER OUR PREVIOUS CLIENT REQUIREMENT. WE PROFILE MORE THAN 100 COMPANIES IN OUR STUDY AND HENCE THE LIST OF COMPANIES CAN BE MODIFIED OR REPLACED ON REQUEST
17 RELATED REPORTS
18 CONCLUSION
19 QUESTIONNAIRE
20 ABOUT DATA BRIDGE MARKET RESEARCH
Global Free From Food Market, Supply Chain Analysis and Ecosystem Framework
To support market growth and help clients navigate the impact of geopolitical shifts, DBMR has integrated in-depth supply chain analysis into its Global Free From Food Market research reports. This addition empowers clients to respond effectively to global changes affecting their industries. The supply chain analysis section includes detailed insights such as Global Free From Food Market consumption and production by country, price trend analysis, the impact of tariffs and geopolitical developments, and import and export trends by country and HSN code. It also highlights major suppliers with data on production capacity and company profiles, as well as key importers and exporters. In addition to research, DBMR offers specialized supply chain consulting services backed by over a decade of experience, providing solutions like supplier discovery, supplier risk assessment, price trend analysis, impact evaluation of inflation and trade route changes, and comprehensive market trend analysis.
Data collection and base year analysis are done using data collection modules with large sample sizes. The stage includes obtaining market information or related data through various sources and strategies. It includes examining and planning all the data acquired from the past in advance. It likewise envelops the examination of information inconsistencies seen across different information sources. The market data is analysed and estimated using market statistical and coherent models. Also, market share analysis and key trend analysis are the major success factors in the market report. To know more, please request an analyst call or drop down your inquiry.
The key research methodology used by DBMR research team is data triangulation which involves data mining, analysis of the impact of data variables on the market and primary (industry expert) validation. Data models include Vendor Positioning Grid, Market Time Line Analysis, Market Overview and Guide, Company Positioning Grid, Patent Analysis, Pricing Analysis, Company Market Share Analysis, Standards of Measurement, Global versus Regional and Vendor Share Analysis. To know more about the research methodology, drop in an inquiry to speak to our industry experts.
Data Bridge Market Research is a leader in advanced formative research. We take pride in servicing our existing and new customers with data and analysis that match and suits their goal. The report can be customized to include price trend analysis of target brands understanding the market for additional countries (ask for the list of countries), clinical trial results data, literature review, refurbished market and product base analysis. Market analysis of target competitors can be analyzed from technology-based analysis to market portfolio strategies. We can add as many competitors that you require data about in the format and data style you are looking for. Our team of analysts can also provide you data in crude raw excel files pivot tables (Fact book) or can assist you in creating presentations from the data sets available in the report.


