
Global Hospital Air Purifiers Market
Market Size in USD Billion
 USD
7.70 Billion
USD
14.79 Billion
2022
2030
USD
7.70 Billion
USD
14.79 Billion
2022
2030
| 2023 - 2030 | |
| USD 7.70 Billion | |
| USD 14.79 Billion | |
| % | |
|
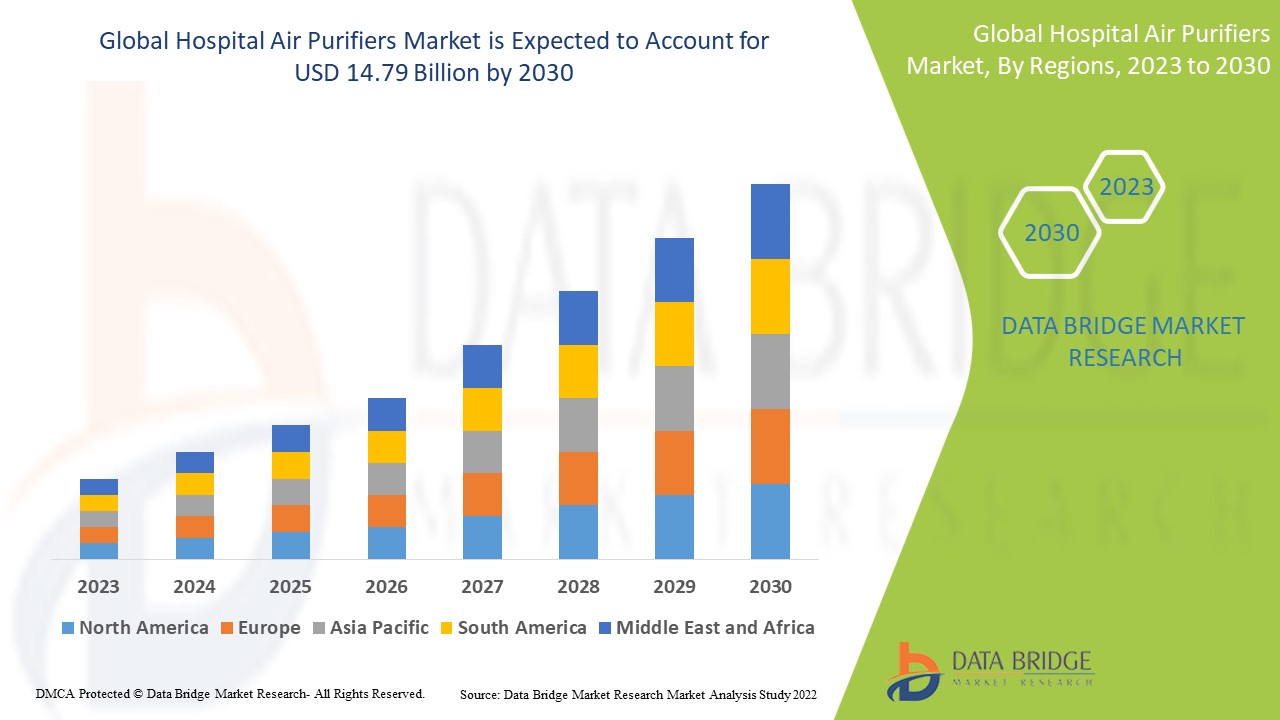
Hospital Air Purifiers Market Analysis and Size
The market is expected to be driven by rising airborne diseases and increased pollution levels in urban areas. Furthermore, rising health consciousness, along with an improving standard of living and rising disposable income, is expected to drive market growth. Increased sales of home appliances such as air purifiers, cleaning appliances, kitchen appliances, and water filtration devices have resulted from various governments' lockdown measures in preparation for the onset of the COVID-19 pandemic in 2020. Increasing health consciousness has boosted sales of air purifiers all over the world.
Data Bridge Market Research analyses that the hospital air purifiers market which was USD 7.7 billion in 2022, is expected to reach USD 14.79 billion by 2030, at a CAGR of 8.50% during the forecast period 2023 to 2030. In addition to the insights on market scenarios such as market value, growth rate, segmentation, geographical coverage, and major players, the market reports curated by the Data Bridge Market Research also include depth expert analysis, patient epidemiology, pipeline analysis, pricing analysis, and regulatory framework.
Hospital Air Purifiers Market Scope and Segmentation
|
Report Metric |
Details |
|
Forecast Period |
2023 to 2030 |
|
Base Year |
2022 |
|
Historic Years |
2021 (Customizable to 2015 - 2020) |
|
Quantitative Units |
Revenue in USD Billion, Volumes in Units, Pricing in USD |
|
Segments Covered |
Coverage (<324 Sq. Ft., 324-538 Sq. Ft., 539-753 Sq. Ft., >753 sq. Ft.), Product Type (Portable Air Purifiers, Whole-House Air Purifiers, and Cleaners, Electrostatic Precipitators, Smart air purifier, Others), Technology (Photo Plasma, High-Efficiency Particulate Air (HEPA), Ultraviolet Germicidal Irradiation, Thermodynamic Sterilization (TSS), Polarized-Media Electronic, Activated Carbon, UV Technology, Negative Ion, Ionizer Purifiers, Photocatalytic Oxidation (PCO), Titanium Dioxide, Ozone Generators, Others), Type (Dust Collectors, Fume and Smoke Collectors, Others), Application (Retail Shops, Residential, Industrial), Sales Channel (OEM, Aftermarket) |
|
Countries Covered |
U.S., Canada and Mexico in North America, Germany, France, U.K., Netherlands, Switzerland, Belgium, Russia, Italy, Spain, Turkey, Rest of Europe in Europe, China, Japan, India, South Korea, Singapore, Malaysia, Australia, Thailand, Indonesia, Philippines, Rest of Asia-Pacific (APAC) in the Asia-Pacific (APAC), Saudi Arabia, U.A.E, South Africa, Egypt, Israel, Rest of Middle East and Africa (MEA) as a part of Middle East and Africa (MEA), Brazil, Argentina and Rest of South America as part of South America |
|
Market Players Covered |
Honeywell International Inc. (U.S.), Xiaomi (China), LG Electronics (South Korea), Unilever (U.K.), COWAY CO.,LTD (South Korea), Koninklijke Philips N.V. (Netherlands), Sunbeam Products, Inc. (U.S.), Sharp Electronics Corporation (Japan), Alen Corporation (U.S.), Whirlpool of India (India), AustinAir (U.S.), Camfil (Sweden), Daikin Airconditioning India Pvt. Ltd. (India), Eureka Forbes (India), IQAir (Switzerland), Rabbit Air (U.S.) |
|
Market Opportunities |
|
Market Definition
An air purifier is used to reduce the presence of Total Volatile Organic Compounds (TVOCs), particulate matter (2.5-10 m), smoke, dust, harmful chemicals, gases, and other pollutants in the air. These purifiers are based on various filtration technologies to meet the diverse needs of consumers, the most common being the High-efficiency Particulate Air (HEPA) technology with a trapping capacity of at least 99.97%. As a result, air purifiers are becoming increasingly popular in homes, corporate and government offices, retail stores, public spaces, and other industrial infrastructures.
Global Hospital Air Purifiers Market Dynamics
Drivers
- Deteriorating air quality and increasing prevalence of airborne disease
The increasing level of air pollution caused by rapid industrialization and urbanization is a key factor driving the global air purifier market. According to the World Health Organization, air pollution kills 2.4 million people each year. Furthermore, air pollution is the leading cause of death in low- and middle-income countries. The demand for efficient air purifiers in residential and commercial spaces is expected to drive market growth during the forecast period due to the polluted air which can cause serious health effects such as lung cancer, asthma, and COPD, as well as increased cardiac risk.
- Launch of smart air purifiers
Air purifier manufacturers are incorporating advanced technologies such as artificial intelligence (AI), Internet of Things (IoT), and others into air purifiers to gain a competitive advantage with high growth potential and increasing competition. Acer introduced smart air purifiers with sensors that monitor air quality and automatically adjust the air purifier's speed in December 2021. Similarly, SHARP-QNET Smart Air will release its next-generation air purifier in March 2021. This newly released air purifier has IoT functionality that allows it to be connected to WiFi and accessed remotely via smartphones via the 'SHARP Air' mobile app. Such developments present the global hospital air purifiers market with lucrative growth opportunities.
Opportunities
- Rising health consciousness
The rise in health consciousness is helping to drive the growth of the hospital air purifiers market. Pathogens and infectious diseases have become more prevalent. This has resulted in a greater awareness of the importance of maintaining hygiene in healthcare and residential settings, which is driving the market for hospital air purifiers. This awareness has grown rapidly in recent years. In 2020, 35% of Indians changed their diet, and 34% began participating in yoga and fitness classes. As a result, rising health consciousness is propelling the hospital air purifiers market.
Restraints/Challenges
- High Cost of Air Purifiers
The high cost of air purifiers is a major impediment to the global air purifier market's growth. Air purifiers typically cost around USD 185 and up to USD 5000. The price of air purifiers is also affected by supply and demand. Furthermore, air purifiers in developing countries with high levels of air pollution, such as China or South Korea, are more expensive than in Europe or North America. This may limit its adoption, particularly among the middle and lower-income classes.
This hospital air purifiers market report provides details of new recent developments, trade regulations, import-export analysis, production analysis, value chain optimization, market share, impact of domestic and localized market players, analyses opportunities in terms of emerging revenue pockets, changes in market regulations, strategic market growth analysis, market size, category market growths, application niches and dominance, product approvals, product launches, geographic expansions, technological innovations in the market. To gain more info on the hospital air purifiers market contact Data Bridge Market Research for an Analyst Brief, our team will help you take an informed market decision to achieve market growth.
Recent Developments
- In November 2021, Bemis, a toilet seat manufacturer based in the United States, launched their first indoor air purifiers, consisting of three models: the Tower, The Pedestal, and The Pod.
- In November 2021, The Pyure Company, a US-based air purification company, announced the launch of a new line of advanced portable air purification products designed explicitly for the janitorial and sanitation industry.
Global Hospital Air Purifiers Market Scope
The hospital air purifiers market is segmented on the basis of product type, coverage, technology, type, and sales channel. The growth amongst these segments will help you analyze meagre growth segments in the industries and provide the users with a valuable market overview and market insights to help them make strategic decisions for identifying core market applications.
Coverage
- <324 Sq. Ft.
- 324-538 Sq. Ft.
- 539-753 Sq. Ft.
- >753 sq. Ft.
Product Type
- Portable Air Purifiers
- Whole-House Air Purifiers
- Cleaners
- Electrostatic Precipitators
- Smart Air Purifier
- Others
Technology
- Photo Plasma
- High Efficiency Particulate Air (HEPA)
- Ultraviolet Germicidal Irradiation
- Thermodynamic Sterilization (TSS)
- Polarized-Media Electronic
- Activated Carbon
- UV Technology
- Negative Ion
- Ionizer Purifiers
- Photocatalytic Oxidation (PCO)
- Titanium Dioxide
- Ozone Generators
- Others
Type
- Dust Collectors
- Fume and Smoke Collectors
- Others
Sales Channel
- OEM
- Aftermarket
Hospital Air Purifiers Market Regional Analysis/Insights
The hospital air purifiers market is analyzed and market size insights and trends are provided by country, product type, coverage, technology, type, and sales channel as referenced above.
The countries covered in the hospital air purifiers market report are U.S., Canada and Mexico in North America, Germany, France, U.K., Netherlands, Switzerland, Belgium, Russia, Italy, Spain, Turkey, Rest of Europe in Europe, China, Japan, India, South Korea, Singapore, Malaysia, Australia, Thailand, Indonesia, Philippines, Rest of Asia-Pacific (APAC) in the Asia-Pacific (APAC), Saudi Arabia, U.A.E, South Africa, Egypt, Israel, Rest of Middle East and Africa (MEA) as a part of Middle East and Africa (MEA), Brazil, Argentina and Rest of South America as part of South America.
North America dominates the hospital air purifiers market due to the increasing health consciousness among the people along with the prevalence of various market players in the region, while China, and India is expected to grow at the highest growth rate.
Asia-Pacific is expected to grow at the highest growth rate in the forecast period of 2023 to 2030 due to the rapid industrialization and rising pollution levels in the region.
The country section of the report also provides individual market impacting factors and changes in regulation in the market domestically that impacts the current and future trends of the market. Data points like down-stream and upstream value chain analysis, technical trends and porter's five forces analysis, case studies are some of the pointers used to forecast the market scenario for individual countries. Also, the presence and availability of global brands and their challenges faced due to large or scarce competition from local and domestic brands, impact of domestic tariffs and trade routes are considered while providing forecast analysis of the country data.
Healthcare Infrastructure Growth Installed base and New Technology Penetration
The hospital air purifiers market also provides you with detailed market analysis for every country growth in healthcare expenditure for capital equipment, installed base of different kind of products for hospital air purifiers market, impact of technology using life line curves and changes in healthcare regulatory scenarios and their impact on the hospital air purifiers market. The data is available for historic period 2011-2021.
Competitive Landscape and Hospital Air Purifiers Market Share Analysis
The hospital air purifiers market competitive landscape provides details by competitor. Details included are company overview, company financials, revenue generated, market potential, investment in research and development, new market initiatives, global presence, production sites and facilities, production capacities, company strengths and weaknesses, product launch, product width and breadth, application dominance. The above data points provided are only related to the companies' focus related to hospital air purifiers market.
Some of the major players operating in the hospital air purifiers market are:
- Honeywell International Inc. (U.S.)
- Xiaomi (China)
- LG Electronics (South Korea)
- Unilever (U.K.)
- COWAY CO.LTD (South Korea)
- Koninklijke Philips N.V. (Netherlands)
- Sunbeam Products, Inc. (U.S.)
- Sharp Electronics Corporation (Japan)
- Alen Corporation (U.S.)
- Whirlpool of India (India)
- AustinAir (U.S.)
- Camfil (Sweden)
- Daikin Airconditioning India Pvt. Ltd. (India)
- Eureka Forbes (India)
- IQAir (Switzerland)
- Rabbit Air (U.S.)
SKU-

- Interactive Data Analysis Dashboard
- Company Analysis Dashboard for high growth potential opportunities
- Research Analyst Access for customization & queries
- Competitor Analysis with Interactive dashboard
- Latest News, Updates & Trend analysis
- Harness the Power of Benchmark Analysis for Comprehensive Competitor Tracking
Table of Content
1 INTRODUCTION
1.1 OBJECTIVES OF THE STUDY
1.2 MARKET DEFINITION
1.3 OVERVIEW OF GLOBAL HOSPITAL AIR PURIFIERS MARKET
1.4 CURRENCY AND PRICING
1.5 LIMITATION
1.6 MARKETS COVERED
2 MARKET SEGMENTATION
2.1 KEY TAKEAWAYS
2.2 ARRIVING AT THE GLOBAL HOSPITAL AIR PURIFIERS MARKET SIZE
2.2.1 VENDOR POSITIONING GRID
2.2.2 TECHNOLOGY LIFE LINE CURVE
2.2.3 MARKET GUIDE
2.2.4 APPLICATION POSITIONING GRID
2.2.5 COMPANY MARKET SHARE ANALYSIS
2.2.6 MULTIVARIATE MODELLING
2.2.7 TOP TO BOTTOM ANALYSIS
2.2.8 STANDARDS OF MEASUREMENT
2.2.9 VENDOR SHARE ANALYSIS
2.2.10 SALES VOLUME DATA
2.2.11 DATA POINTS FROM KEY PRIMARY INTERVIEWS
2.2.12 DATA POINTS FROM KEY SECONDARY DATABASES
2.3 GLOBAL HOSPITAL AIR PURIFIERS MARKET : RESEARCH SNAPSHOT
2.4 ASSUMPTIONS
3 MARKET OVERVIEW
3.1 DRIVERS
3.2 RESTRAINTS
3.3 OPPORTUNITIES
3.4 CHALLENGES
4 EXECUTIVE SUMMARY
5 PREMIUM INSIGHTS
5.1 PESTEL ANALYSIS
5.2 PORTER’S 5 FORCES MODEL
5.3 CONSUMER BEHAVIOUR ANALYSIS
6 INDUSTRY INSIGHTS
7 REGULATORY FRAMEWORK
8 PIPELINE ANALYSIS
9 GLOBAL HOSPITAL AIR PURIFIERS MARKET , BY PRODUCT TYPE
9.1 OVERVIEW
9.2 PORTABLE AIR PURIFIERS
9.2.1 BY FILTER
9.2.1.1. PRE-FILTER
9.2.1.1.1. MARKET VALUE (USD MILLION)
9.2.1.1.2. MARKET VOLUME (UNITS)
9.2.1.1.3. AVERAGE SELLING PRICE (USD)
9.2.1.2. MEDICAL-GRADE HEPA FILTER
9.2.1.2.1. H-13 FILTER
9.2.1.2.1.1 MARKET VALUE (USD MILLION)
9.2.1.2.1.2 MARKET VOLUME (UNITS)
9.2.1.2.1.3 AVERAGE SELLING PRICE (USD)
9.2.1.2.2. H-14 FILTER
9.2.1.2.2.1 MARKET VALUE (USD MILLION)
9.2.1.2.2.2 MARKET VOLUME (UNITS)
9.2.1.2.2.3 AVERAGE SELLING PRICE (USD)
9.2.1.2.3. OTHERS
9.2.1.3. ACTIVATED CARBON FILTER
9.2.1.3.1. MARKET VALUE (USD MILLION)
9.2.1.3.2. MARKET VOLUME (UNITS)
9.2.1.3.3. AVERAGE SELLING PRICE (USD)
9.2.1.4. PRE-FILTER: NON-WOVEN FABRIC MESH
9.2.1.4.1. MARKET VALUE (USD MILLION)
9.2.1.4.2. MARKET VOLUME (UNITS)
9.2.1.4.3. AVERAGE SELLING PRICE (USD)
9.2.1.5. MEDICAL-GRADE HEPA FILTER
9.2.1.5.1. MARKET VALUE (USD MILLION)
9.2.1.5.2. MARKET VOLUME (UNITS)
9.2.1.5.3. AVERAGE SELLING PRICE (USD)
9.2.1.6. ACTIVATED CARBON FILTER
9.2.1.6.1. MARKET VALUE (USD MILLION)
9.2.1.6.2. MARKET VOLUME (UNITS)
9.2.1.6.3. AVERAGE SELLING PRICE (USD)
9.2.1.7. UV-C 24W BULB
9.2.1.7.1. MARKET VALUE (USD MILLION)
9.2.1.7.2. MARKET VOLUME (UNITS)
9.2.1.7.3. AVERAGE SELLING PRICE (USD)
9.2.2 BY CLEANING LEVEL
9.2.2.1. HIGH
9.2.2.1.1. MARKET VALUE (USD MILLION)
9.2.2.1.2. MARKET VOLUME (UNITS)
9.2.2.1.3. AVERAGE SELLING PRICE (USD)
9.2.2.2. MEDIUM
9.2.2.2.1. MARKET VALUE (USD MILLION)
9.2.2.2.2. MARKET VOLUME (UNITS)
9.2.2.2.3. AVERAGE SELLING PRICE (USD)
9.2.2.3. LOW
9.2.2.3.1. MARKET VALUE (USD MILLION)
9.2.2.3.2. MARKET VOLUME (UNITS)
9.2.2.3.3. AVERAGE SELLING PRICE (USD)
9.2.3 BY NOISE LEVEL
9.2.3.1. BELOW 30 DB
9.2.3.1.1. MARKET VALUE (USD MILLION)
9.2.3.1.2. MARKET VOLUME (UNITS)
9.2.3.1.3. AVERAGE SELLING PRICE (USD)
9.2.3.2. 30 – 66 DB
9.2.3.2.1. MARKET VALUE (USD MILLION)
9.2.3.2.2. MARKET VOLUME (UNITS)
9.2.3.2.3. AVERAGE SELLING PRICE (USD)
9.2.3.3. ABOVE 60 DB
9.2.3.3.1. MARKET VALUE (USD MILLION)
9.2.3.3.2. MARKET VOLUME (UNITS)
9.2.3.3.3. AVERAGE SELLING PRICE (USD)
9.2.4 BY DEGREE OF ROTATION
9.2.4.1. 180 DEGREE
9.2.4.1.1. MARKET VALUE (USD MILLION)
9.2.4.1.2. MARKET VOLUME (UNITS)
9.2.4.1.3. AVERAGE SELLING PRICE (USD)
9.2.4.2. 360 DEGREE
9.2.4.2.1. MARKET VALUE (USD MILLION)
9.2.4.2.2. MARKET VOLUME (UNITS)
9.2.4.2.3. AVERAGE SELLING PRICE (USD)
9.3 WHOLE-HOUSE AIR PURIFIERS
9.3.1 BY FILTER
9.3.1.1. CARTILEDGE FILTER
9.3.1.1.1. MARKET VALUE (USD MILLION)
9.3.1.1.2. MARKET VOLUME (UNITS)
9.3.1.1.3. AVERAGE SELLING PRICE (USD)
9.3.1.2. PARTICULATE FILTER
9.3.1.2.1. MARKET VALUE (USD MILLION)
9.3.1.2.2. MARKET VOLUME (UNITS)
9.3.1.2.3. AVERAGE SELLING PRICE (USD)
9.3.1.3. GAS PHASE FILTER
9.3.1.3.1. MARKET VALUE (USD MILLION)
9.3.1.3.2. MARKET VOLUME (UNITS)
9.3.1.3.3. AVERAGE SELLING PRICE (USD)
9.3.1.4. ODOUR FILTER
9.3.1.4.1. MARKET VALUE (USD MILLION)
9.3.1.4.2. MARKET VOLUME (UNITS)
9.3.1.4.3. AVERAGE SELLING PRICE (USD)
9.3.1.5. URETHANE FILTER
9.3.1.5.1. MARKET VALUE (USD MILLION)
9.3.1.5.2. MARKET VOLUME (UNITS)
9.3.1.5.3. AVERAGE SELLING PRICE (USD)
9.3.1.6. PRE-FILTER
9.3.1.6.1. MARKET VALUE (USD MILLION)
9.3.1.6.2. MARKET VOLUME (UNITS)
9.3.1.6.3. AVERAGE SELLING PRICE (USD)
9.3.1.7. MEDICAL-GRADE HEPA FILTER
9.3.1.7.1. MARKET VALUE (USD MILLION)
9.3.1.7.2. MARKET VOLUME (UNITS)
9.3.1.7.3. AVERAGE SELLING PRICE (USD)
9.3.1.8. ACTIVATED CARBON FILTER
9.3.1.8.1. MARKET VALUE (USD MILLION)
9.3.1.8.2. MARKET VOLUME (UNITS)
9.3.1.8.3. AVERAGE SELLING PRICE (USD)
9.3.2 BY COVERAGE
9.3.2.1. <324 SQ. FT.
9.3.2.1.1. MARKET VALUE (USD MILLION)
9.3.2.1.2. MARKET VOLUME (UNITS)
9.3.2.1.3. AVERAGE SELLING PRICE (USD)
9.3.2.2. 324-538 SQ. FT.
9.3.2.2.1. MARKET VALUE (USD MILLION)
9.3.2.2.2. MARKET VOLUME (UNITS)
9.3.2.2.3. AVERAGE SELLING PRICE (USD
9.3.2.3. 539-753 SQ. FT.
9.3.2.3.1. MARKET VALUE (USD MILLION)
9.3.2.3.2. MARKET VOLUME (UNITS)
9.3.2.3.3. AVERAGE SELLING PRICE (USD)
9.3.2.4. >753 SQ. FT
9.3.2.4.1. MARKET VALUE (USD MILLION)
9.3.2.4.2. MARKET VOLUME (UNITS)
9.3.2.4.3. AVERAGE SELLING PRICE (USD)
9.3.3 BY NOISE LEVEL
9.3.3.1. BELOW 30 DB
9.3.3.1.1. MARKET VALUE (USD MILLION)
9.3.3.1.2. MARKET VOLUME (UNITS)
9.3.3.1.3. AVERAGE SELLING PRICE (USD)
9.3.3.2. 30 – 66 DB
9.3.3.2.1. MARKET VALUE (USD MILLION)
9.3.3.2.2. MARKET VOLUME (UNITS)
9.3.3.2.3. AVERAGE SELLING PRICE (USD)
9.3.3.3. ABOVE 60 DB
9.3.3.3.1. MARKET VALUE (USD MILLION)
9.3.3.3.2. MARKET VOLUME (UNITS)
9.3.3.3.3. AVERAGE SELLING PRICE (USD)
9.3.4 BY MODE OF USE
9.3.4.1. AUTOMATIC
9.3.4.1.1. MARKET VALUE (USD MILLION)
9.3.4.1.2. MARKET VOLUME (UNITS)
9.3.4.1.3. AVERAGE SELLING PRICE (USD)
9.3.4.2. MANUAL OPERATING
9.3.4.2.1. MARKET VALUE (USD MILLION)
9.3.4.2.2. MARKET VOLUME (UNITS)
9.3.4.2.3. AVERAGE SELLING PRICE (USD)
9.4 SMART AIR PURIFIER
9.4.1 BY MODE OF USE
9.4.1.1. MANUAL
9.4.1.1.1. MARKET VALUE (USD MILLION)
9.4.1.1.2. MARKET VOLUME (UNITS)
9.4.1.1.3. AVERAGE SELLING PRICE (USD)
9.4.1.2. AUTOMATIC
9.4.1.2.1. ARKET VALUE (USD MILLION)
9.4.1.2.2. MARKET VOLUME (UNITS)
9.4.1.2.3. AVERAGE SELLING PRICE (USD)
9.4.2 BY POLUTION LEVEL
9.4.2.1. LOW
9.4.2.1.1. MARKET VALUE (USD MILLION)
9.4.2.1.2. MARKET VOLUME (UNITS)
9.4.2.1.3. AVERAGE SELLING PRICE (USD)
9.4.2.2. MEDIUM
9.4.2.2.1. MARKET VALUE (USD MILLION)
9.4.2.2.2. MARKET VOLUME (UNITS)
9.4.2.2.3. AVERAGE SELLING PRICE (USD)
9.4.2.3. HIGH
9.4.2.3.1. MARKET VALUE (USD MILLION)
9.4.2.3.2. MARKET VOLUME (UNITS)
9.4.2.3.3. AVERAGE SELLING PRICE (USD)
9.5 CLEANERS
9.5.1 BY CLEANING LEVEL
9.5.1.1. HIGH
9.5.1.1.1. MARKET VALUE (USD MILLION)
9.5.1.1.2. MARKET VOLUME (UNITS)
9.5.1.1.3. AVERAGE SELLING PRICE (USD)
9.5.1.2. MEDIUM
9.5.1.2.1. MARKET VALUE (USD MILLION)
9.5.1.2.2. MARKET VOLUME (UNITS)
9.5.1.2.3. AVERAGE SELLING PRICE (USD)
9.5.1.3. LOW
9.5.1.3.1. MARKET VALUE (USD MILLION)
9.5.1.3.2. MARKET VOLUME (UNITS)
9.5.1.3.3. AVERAGE SELLING PRICE (USD)
9.5.2 BY MODE OF USE
9.5.2.1. MANUAL
9.5.2.1.1. MARKET VALUE (USD MILLION)
9.5.2.1.2. MARKET VOLUME (UNITS)
9.5.2.1.3. AVERAGE SELLING PRICE (USD)
9.5.2.2. REMOTE CONTROL
9.5.2.2.1. MARKET VALUE (USD MILLION)
9.5.2.2.2. MARKET VOLUME (UNITS)
9.5.2.2.3. AVERAGE SELLING PRICE (USD)
9.6 ELECTROSTATIC PRECIPITATORS
9.6.1 BY DESIGN
9.6.1.1. PLATE WIRE
9.6.1.1.1. MARKET VALUE (USD MILLION)
9.6.1.1.2. MARKET VOLUME (UNITS)
9.6.1.1.3. AVERAGE SELLING PRICE (USD)
9.6.1.2. FLAT PLATE
9.6.1.2.1. MARKET VALUE (USD MILLION)
9.6.1.2.2. MARKET VOLUME (UNITS)
9.6.1.2.3. AVERAGE SELLING PRICE (USD)
9.6.1.3. TUBULAR
9.6.1.3.1. MARKET VALUE (USD MILLION)
9.6.1.3.2. MARKET VOLUME (UNITS)
9.6.1.3.3. AVERAGE SELLING PRICE (USD)
9.6.2 BY TYPE
9.6.2.1. DRY ESP
9.6.2.1.1. MARKET VALUE (USD MILLION)
9.6.2.1.2. MARKET VOLUME (UNITS)
9.6.2.1.3. AVERAGE SELLING PRICE (USD)
9.6.2.2. WET ESP
9.6.2.2.1. MARKET VALUE (USD MILLION)
9.6.2.2.2. MARKET VOLUME (UNITS)
9.6.2.2.3. AVERAGE SELLING PRICE (USD)
9.6.3 BY CONDITIONING AGENT
9.6.3.1. SULFUR TRIOXIDE
9.6.3.1.1. MARKET VALUE (USD MILLION)
9.6.3.1.2. MARKET VOLUME (UNITS)
9.6.3.1.3. AVERAGE SELLING PRICE (USD)
9.6.3.2. AMMONIUM SULFATE
9.6.3.2.1. MARKET VALUE (USD MILLION)
9.6.3.2.2. MARKET VOLUME (UNITS)
9.6.3.2.3. AVERAGE SELLING PRICE (USD)
9.6.3.3. TRIETHYLAMINE
9.6.3.3.1. MARKET VALUE (USD MILLION)
9.6.3.3.2. MARKET VOLUME (UNITS)
9.6.3.3.3. AVERAGE SELLING PRICE (USD)
9.6.3.4. SODIUM COMPOUNDS
9.6.3.4.1. MARKET VALUE (USD MILLION)
9.6.3.4.2. MARKET VOLUME (UNITS)
9.6.3.4.3. AVERAGE SELLING PRICE (USD)
9.6.3.5. TRANSITION METALS
9.6.3.5.1. MARKET VALUE (USD MILLION)
9.6.3.5.2. MARKET VOLUME (UNITS)
9.6.3.5.3. AVERAGE SELLING PRICE (USD)
9.6.3.6. OTHERS
9.7 OTHERS
10 GLOBAL HOSPITAL AIR PURIFIERS MARKET , BY COVERAGE
10.1 OVERVIEW
10.2 <324 SQ. FT.
10.3 324-538 SQ. FT.
10.4 539-753 SQ. FT.
10.5 >753 SQ. FT
11 GLOBAL HOSPITAL AIR PURIFIERS MARKET , BY TYPE
11.1 OVERVIEW
11.2 DUST COLLECTORS
11.3 FUME
11.4 SMOKE COLLECTORS
11.5 OTHERS
12 GLOBAL HOSPITAL AIR PURIFIERS MARKET , BY TECHNOLOGY
12.1 OVERVIEW
12.2 PHOTO PLASMA
12.3 HIGH-EFFICIENCY PARTICULATE AIR (HEPA)
12.4 ULTRAVIOLET GERMICIDAL IRRADIATION
12.5 THERMODYNAMIC STERILIZATION (TSS)
12.6 POLARIZED-MEDIA ELECTRONIC
12.7 ACTIVATED CARBON
12.8 UV TECHNOLOGY
12.9 ION EXCHANGE
12.1 NEGATIVE ION
12.11 IONIZER PURIFIERS
12.12 PHOTOCATALYTIC OXIDATION (PCO)
12.13 TITANIUM DIOXIDE
12.14 OZONE GENERATORS
12.15 OTHERS
13 GLOBAL HOSPITAL AIR PURIFIERS MARKET , BY CONFIGURATION
13.1 OVERVIEW
13.2 FIXED
13.2.1 WALL MOUNTED
13.2.2 CEILING MOUNTED
13.2.3 CENTRAL
13.2.4 OTHERS
13.3 PORTABLE
14 GLOBAL HOSPITAL AIR PURIFIERS MARKET , BY HOSPITAL TYPE
14.1 OVERVIEW
14.1.1 BY OWNERSHIP
14.2 PUBLIC
14.2.1 TIER 1
14.2.1.1. PORTABLE AIR PURIFIERS
14.2.1.1.1. MARKET VALUE (USD MILLION)
14.2.1.1.2. MARKET VOLUME (UNITS)
14.2.1.1.3. AVERAGE SELLING PRICE (USD)
14.2.1.2. WHOLE-HOUSE AIR PURIFIERS
14.2.1.2.1. MARKET VALUE (USD MILLION)
14.2.1.2.2. MARKET VOLUME (UNITS)
14.2.1.2.3. AVERAGE SELLING PRICE (USD)
14.2.1.3. AIR CLEANERS
14.2.1.3.1. MARKET VALUE (USD MILLION)
14.2.1.3.2. MARKET VOLUME (UNITS)
14.2.1.3.3. AVERAGE SELLING PRICE (USD)
14.2.1.4. ELECTROSTATIC PRECIPITATORS
14.2.1.4.1. MARKET VALUE (USD MILLION)
14.2.1.4.2. MARKET VOLUME (UNITS)
14.2.1.4.3. AVERAGE SELLING PRICE (USD)
14.2.1.5. SMART AIR PURIFIER,
14.2.1.5.1. MARKET VALUE (USD MILLION)
14.2.1.5.2. MARKET VOLUME (UNITS)
14.2.1.5.3. AVERAGE SELLING PRICE (USD)
14.2.1.6. OTHERS
14.2.2 TIER 2
14.2.2.1. PORTABLE AIR PURIFIERS
14.2.2.1.1. MARKET VALUE (USD MILLION)
14.2.2.1.2. MARKET VOLUME (UNITS)
14.2.2.1.3. AVERAGE SELLING PRICE (USD)
14.2.2.2. WHOLE-HOUSE AIR PURIFIERS
14.2.2.2.1. MARKET VALUE (USD MILLION)
14.2.2.2.2. MARKET VOLUME (UNITS)
14.2.2.2.3. AVERAGE SELLING PRICE (USD)
14.2.2.3. AIR CLEANERS
14.2.2.3.1. MARKET VALUE (USD MILLION)
14.2.2.3.2. MARKET VOLUME (UNITS)
14.2.2.3.3. AVERAGE SELLING PRICE (USD)
14.2.2.4. ELECTROSTATIC PRECIPITATORS
14.2.2.4.1. MARKET VALUE (USD MILLION)
14.2.2.4.2. MARKET VOLUME (UNITS)
14.2.2.4.3. AVERAGE SELLING PRICE (USD)
14.2.2.5. SMART AIR PURIFIER
14.2.2.5.1. MARKET VALUE (USD MILLION)
14.2.2.5.2. MARKET VOLUME (UNITS)
14.2.2.5.3. AVERAGE SELLING PRICE (USD)
14.2.2.6. OTHERS
14.2.3 TIER 3
14.2.3.1. PORTABLE AIR PURIFIERS
14.2.3.1.1. MARKET VALUE (USD MILLION)
14.2.3.1.2. MARKET VOLUME (UNITS)
14.2.3.1.3. AVERAGE SELLING PRICE (USD)
14.2.3.2. WHOLE-HOUSE AIR PURIFIERS
14.2.3.2.1. MARKET VALUE (USD MILLION)
14.2.3.2.2. MARKET VOLUME (UNITS)
14.2.3.2.3. AVERAGE SELLING PRICE (USD)
14.2.3.3. AIR CLEANERS
14.2.3.3.1. MARKET VALUE (USD MILLION)
14.2.3.3.2. MARKET VOLUME (UNITS)
14.2.3.3.3. AVERAGE SELLING PRICE (USD)
14.2.3.4. ELECTROSTATIC PRECIPITATORS
14.2.3.4.1. MARKET VALUE (USD MILLION)
14.2.3.4.2. MARKET VOLUME (UNITS)
14.2.3.4.3. AVERAGE SELLING PRICE (USD)
14.2.3.5. SMART AIR PURIFIER,
14.2.3.5.1. MARKET VALUE (USD MILLION)
14.2.3.5.2. MARKET VOLUME (UNITS)
14.2.3.5.3. AVERAGE SELLING PRICE (USD)
14.2.3.6. OTHERS
14.3 PRIVATE
14.3.1 TIER 1
14.3.1.1. PORTABLE AIR PURIFIERS
14.3.1.1.1. MARKET VALUE (USD MILLION)
14.3.1.1.2. MARKET VOLUME (UNITS)
14.3.1.1.3. AVERAGE SELLING PRICE (USD)
14.3.1.2. WHOLE-HOUSE AIR PURIFIERS
14.3.1.2.1. MARKET VALUE (USD MILLION)
14.3.1.2.2. MARKET VOLUME (UNITS)
14.3.1.2.3. AVERAGE SELLING PRICE (USD)
14.3.1.3. AIR CLEANERS
14.3.1.3.1. MARKET VALUE (USD MILLION)
14.3.1.3.2. MARKET VOLUME (UNITS)
14.3.1.3.3. AVERAGE SELLING PRICE (USD)
14.3.1.4. ELECTROSTATIC PRECIPITATORS
14.3.1.4.1. MARKET VALUE (USD MILLION)
14.3.1.4.2. MARKET VOLUME (UNITS)
14.3.1.4.3. AVERAGE SELLING PRICE (USD)
14.3.1.5. SMART AIR PURIFIER,
14.3.1.5.1. MARKET VALUE (USD MILLION)
14.3.1.5.2. MARKET VOLUME (UNITS)
14.3.1.5.3. AVERAGE SELLING PRICE (USD)
14.3.1.6. OTHERS
14.3.2 TIER 2
14.3.2.1. PORTABLE AIR PURIFIERS
14.3.2.1.1. MARKET VALUE (USD MILLION)
14.3.2.1.2. MARKET VOLUME (UNITS)
14.3.2.1.3. AVERAGE SELLING PRICE (USD)
14.3.2.2. WHOLE-HOUSE AIR PURIFIERS
14.3.2.2.1. MARKET VALUE (USD MILLION)
14.3.2.2.2. MARKET VOLUME (UNITS)
14.3.2.2.3. AVERAGE SELLING PRICE (USD)
14.3.2.3. AIR CLEANERS
14.3.2.3.1. MARKET VALUE (USD MILLION)
14.3.2.3.2. MARKET VOLUME (UNITS)
14.3.2.3.3. AVERAGE SELLING PRICE (USD)
14.3.2.4. ELECTROSTATIC PRECIPITATORS
14.3.2.4.1. MARKET VALUE (USD MILLION)
14.3.2.4.2. MARKET VOLUME (UNITS)
14.3.2.4.3. AVERAGE SELLING PRICE (USD)
14.3.2.5. SMART AIR PURIFIER
14.3.2.5.1. MARKET VALUE (USD MILLION)
14.3.2.5.2. MARKET VOLUME (UNITS)
14.3.2.5.3. AVERAGE SELLING PRICE (USD)
14.3.2.6. OTHERS
14.3.3 TIER 3
14.3.3.1. PORTABLE AIR PURIFIERS
14.3.3.1.1. MARKET VALUE (USD MILLION)
14.3.3.1.2. MARKET VOLUME (UNITS)
14.3.3.1.3. AVERAGE SELLING PRICE (USD)
14.3.3.2. WHOLE-HOUSE AIR PURIFIERS
14.3.3.2.1. MARKET VALUE (USD MILLION)
14.3.3.2.2. MARKET VOLUME (UNITS)
14.3.3.2.3. AVERAGE SELLING PRICE (USD)
14.3.3.3. AIR CLEANERS
14.3.3.3.1. MARKET VALUE (USD MILLION)
14.3.3.3.2. MARKET VOLUME (UNITS)
14.3.3.3.3. AVERAGE SELLING PRICE (USD)
14.3.3.4. ELECTROSTATIC PRECIPITATORS
14.3.3.4.1. MARKET VALUE (USD MILLION)
14.3.3.4.2. MARKET VOLUME (UNITS)
14.3.3.4.3. AVERAGE SELLING PRICE (USD)
14.3.3.5. SMART AIR PURIFIER,
14.3.3.5.1. MARKET VALUE (USD MILLION)
14.3.3.5.2. MARKET VOLUME (UNITS)
14.3.3.5.3. AVERAGE SELLING PRICE (USD)
14.3.3.6. OTHERS
15 GLOBAL HOSPITAL AIR PURIFIERS MARKET , BY DISTRIBUTION CHANNEL
15.1 OVERVIEW
15.2 DIRECT TENDERS
15.3 RETAIL SALES
15.4 ONLINE SALES
15.5 OTHERS
16 GLOBAL HOSPITAL AIR PURIFIERS MARKET , BY COUNTRY
16.1 GLOBAL HOSPITAL AIR PURIFIERS MARKET (ALL SEGMENTATION PROVIDED ABOVE IS REPRESENTED IN THIS CHAPTER BY COUNTRY)
16.1.1 NORTH AMERICA
16.1.1.1. U.S.
16.1.1.2. CANADA
16.1.1.3. MEXICO
16.1.2 EUROPE
16.1.2.1. GERMANY
16.1.2.2. U.K.
16.1.2.3. ITALY
16.1.2.4. FRANCE
16.1.2.5. SPAIN
16.1.2.6. RUSSIA
16.1.2.7. SWITZERLAND
16.1.2.8. TURKEY
16.1.2.9. BELGIUM
16.1.2.10. NETHERLANDS
16.1.2.11. DENMARK
16.1.2.12. SWEDEN
16.1.2.13. POLAND
16.1.2.14. NORWAY
16.1.2.15. FINLAND
16.1.2.16. REST OF EUROPE
16.1.3 ASIA-PACIFIC
16.1.3.1. JAPAN
16.1.3.2. CHINA
16.1.3.3. SOUTH KOREA
16.1.3.4. INDIA
16.1.3.5. SINGAPORE
16.1.3.6. THAILAND
16.1.3.7. INDONESIA
16.1.3.8. MALAYSIA
16.1.3.9. PHILIPPINES
16.1.3.10. AUSTRALIA
16.1.3.11. NEW ZEALAND
16.1.3.12. VIETNAM
16.1.3.13. TAIWAN
16.1.3.14. REST OF ASIA-PACIFIC
16.1.4 SOUTH AMERICA
16.1.4.1. BRAZIL
16.1.4.2. ARGENTINA
16.1.4.3. REST OF SOUTH AMERICA
16.1.5 MIDDLE EAST AND AFRICA
16.1.5.1. SOUTH AFRICA
16.1.5.2. EGYPT
16.1.5.3. BAHRAIN
16.1.5.4. UNITED ARAB EMIRATES
16.1.5.5. KUWAIT
16.1.5.6. OMAN
16.1.5.7. QATAR
16.1.5.8. SAUDI ARABIA
16.1.5.9. REST OF MEA
16.1.5.10. KEY PRIMARY INSIGHTS: BY MAJOR COUNTRIES
17 GLOBAL HOSPITAL AIR PURIFIERS MARKET , SWOT AND DBMR ANALYSIS
18 GLOBAL HOSPITAL AIR PURIFIERS MARKET , COMPANY LANDSCAPE
18.1 COMPANY SHARE ANALYSIS: GLOBAL
18.2 COMPANY SHARE ANALYSIS: NORTH AMERICA
18.3 COMPANY SHARE ANALYSIS: EUROPE
18.4 COMPANY SHARE ANALYSIS: ASIA-PACIFIC
18.5 MERGERS & ACQUISITIONS
18.6 NEW PRODUCT DEVELOPMENT & APPROVALS
18.7 EXPANSIONS
18.8 REGULATORY CHANGES
18.9 PARTNERSHIP AND OTHER STRATEGIC DEVELOPMENTS
19 GLOBAL HOSPITAL AIR PURIFIERS MARKET , COMPANY PROFILE
19.1 HONEYWELL
19.1.1 COMPANY OVERVIEW
19.1.2 REVENUE ANALYSIS
19.1.3 GEOGRAPHIC PRESENCE
19.1.4 PRODUCT PORTFOLIO
19.1.5 RECENT DEVELOPMENTS
19.2 XIAOMI
19.2.1 COMPANY OVERVIEW
19.2.2 REVENUE ANALYSIS
19.2.3 GEOGRAPHIC PRESENCE
19.2.4 PRODUCT PORTFOLIO
19.2.5 RECENT DEVELOPMENTS
19.3 LG ELECTRONICS
19.3.1 COMPANY OVERVIEW
19.3.2 REVENUE ANALYSIS
19.3.3 GEOGRAPHIC PRESENCE
19.3.4 PRODUCT PORTFOLIO
19.3.5 RECENT DEVELOPMENTS
19.4 CAMFIL
19.4.1 COMPANY OVERVIEW
19.4.2 REVENUE ANALYSIS
19.4.3 GEOGRAPHIC PRESENCE
19.4.4 PRODUCT PORTFOLIO
19.4.5 RECENT DEVELOPMENTS
19.5 MEDICAIR
19.5.1 COMPANY OVERVIEW
19.5.2 REVENUE ANALYSIS
19.5.3 GEOGRAPHIC PRESENCE
19.5.4 PRODUCT PORTFOLIO
19.5.5 RECENT DEVELOPMENTS
19.6 AIRGLE
19.6.1 COMPANY OVERVIEW
19.6.2 REVENUE ANALYSIS
19.6.3 GEOGRAPHIC PRESENCE
19.6.4 PRODUCT PORTFOLIO
19.6.5 RECENT DEVELOPMENTS
19.7 IQAIR
19.7.1 COMPANY OVERVIEW
19.7.2 REVENUE ANALYSIS
19.7.3 GEOGRAPHIC PRESENCE
19.7.4 PRODUCT PORTFOLIO
19.7.5 RECENT DEVELOPMENTS
19.8 KONINKLIJKE PHILIPS N.V.
19.8.1 COMPANY OVERVIEW
19.8.2 REVENUE ANALYSIS
19.8.3 GEOGRAPHIC PRESENCE
19.8.4 PRODUCT PORTFOLIO
19.8.5 RECENT DEVELOPMENTS
19.9 SHARP ELECTRONICS
19.9.1 COMPANY OVERVIEW
19.9.2 REVENUE ANALYSIS
19.9.3 GEOGRAPHIC PRESENCE
19.9.4 PRODUCT PORTFOLIO
19.9.5 RECENT DEVELOPMENTS
19.1 SAMSUNG
19.10.1 COMPANY OVERVIEW
19.10.2 REVENUE ANALYSIS
19.10.3 GEOGRAPHIC PRESENCE
19.10.4 PRODUCT PORTFOLIO
19.10.5 RECENT DEVELOPMENTS
19.11 PANASONIC
19.11.1 COMPANY OVERVIEW
19.11.2 REVENUE ANALYSIS
19.11.3 GEOGRAPHIC PRESENCE
19.11.4 PRODUCT PORTFOLIO
19.11.5 RECENT DEVELOPMENTS
19.12 COWAY
19.12.1 COMPANY OVERVIEW
19.12.2 REVENUE ANALYSIS
19.12.3 GEOGRAPHIC PRESENCE
19.12.4 PRODUCT PORTFOLIO
19.12.5 RECENT DEVELOPMENTS
19.13 ALEN CORPORATION
19.13.1 COMPANY OVERVIEW
19.13.2 REVENUE ANALYSIS
19.13.3 GEOGRAPHIC PRESENCE
19.13.4 PRODUCT PORTFOLIO
19.13.5 RECENT DEVELOPMENTS
19.14 DAIKIN AIRCONDITIONING INDIA PVT. LTD.
19.14.1 COMPANY OVERVIEW
19.14.2 REVENUE ANALYSIS
19.14.3 GEOGRAPHIC PRESENCE
19.14.4 PRODUCT PORTFOLIO
19.14.5 RECENT DEVELOPMENTS
19.15 EUREKA FORBES
19.15.1 COMPANY OVERVIEW
19.15.2 REVENUE ANALYSIS
19.15.3 GEOGRAPHIC PRESENCE
19.15.4 PRODUCT PORTFOLIO
19.15.5 RECENT DEVELOPMENTS
19.16 RABBIT AIR
19.16.1 COMPANY OVERVIEW
19.16.2 REVENUE ANALYSIS
19.16.3 GEOGRAPHIC PRESENCE
19.16.4 PRODUCT PORTFOLIO
19.16.5 RECENT DEVELOPMENTS
19.17 BIOBASE
19.17.1 COMPANY OVERVIEW
19.17.2 REVENUE ANALYSIS
19.17.3 GEOGRAPHIC PRESENCE
19.17.4 PRODUCT PORTFOLIO
19.17.5 RECENT DEVELOPMENTS
19.18 SHANGHAI ZHENGHUA MEDICAL TREATMENT EQUIPMENT LIMITED COMPANY
19.18.1 COMPANY OVERVIEW
19.18.2 REVENUE ANALYSIS
19.18.3 GEOGRAPHIC PRESENCE
19.18.4 PRODUCT PORTFOLIO
19.18.5 RECENT DEVELOPMENTS
19.19 ATA SAS
19.19.1 COMPANY OVERVIEW
19.19.2 REVENUE ANALYSIS
19.19.3 GEOGRAPHIC PRESENCE
19.19.4 PRODUCT PORTFOLIO
19.19.5 RECENT DEVELOPMENTS
19.2 AIRODOCTOR.
19.20.1 COMPANY OVERVIEW
19.20.2 REVENUE ANALYSIS
19.20.3 GEOGRAPHIC PRESENCE
19.20.4 PRODUCT PORTFOLIO
19.20.5 RECENT DEVELOPMENTS
19.21 BIOSAN
19.21.1 COMPANY OVERVIEW
19.21.2 REVENUE ANALYSIS
19.21.3 GEOGRAPHIC PRESENCE
19.21.4 PRODUCT PORTFOLIO
19.21.5 RECENT DEVELOPMENTS
19.22 CONIX
19.22.1 COMPANY OVERVIEW
19.22.2 REVENUE ANALYSIS
19.22.3 GEOGRAPHIC PRESENCE
19.22.4 PRODUCT PORTFOLIO
19.22.5 RECENT DEVELOPMENTS
19.23 HUBEI CFULL MEDICAL TECHNOLOGY CO., LTD.
19.23.1 COMPANY OVERVIEW
19.23.2 REVENUE ANALYSIS
19.23.3 GEOGRAPHIC PRESENCE
19.23.4 PRODUCT PORTFOLIO
19.23.5 RECENT DEVELOPMENTS
*NOTE: THE COMPANIES PROFILED IS NOT EXHAUSTIVE LIST AND IS AS PER OUR PREVIOUS CLIENT REQUIREMENT. WE PROFILE MORE THAN 100 COMPANIES IN OUR STUDY AND HENCE THE LIST OF COMPANIES CAN BE MODIFIED OR REPLACED ON REQUEST
20 RELATED REPORTS
21 QUESTIONNAIRE
22 ABOUT DATA BRIDGE MARKET RESEARCH
Data collection and base year analysis are done using data collection modules with large sample sizes. The stage includes obtaining market information or related data through various sources and strategies. It includes examining and planning all the data acquired from the past in advance. It likewise envelops the examination of information inconsistencies seen across different information sources. The market data is analysed and estimated using market statistical and coherent models. Also, market share analysis and key trend analysis are the major success factors in the market report. To know more, please request an analyst call or drop down your inquiry.
The key research methodology used by DBMR research team is data triangulation which involves data mining, analysis of the impact of data variables on the market and primary (industry expert) validation. Data models include Vendor Positioning Grid, Market Time Line Analysis, Market Overview and Guide, Company Positioning Grid, Patent Analysis, Pricing Analysis, Company Market Share Analysis, Standards of Measurement, Global versus Regional and Vendor Share Analysis. To know more about the research methodology, drop in an inquiry to speak to our industry experts.
Data Bridge Market Research is a leader in advanced formative research. We take pride in servicing our existing and new customers with data and analysis that match and suits their goal. The report can be customized to include price trend analysis of target brands understanding the market for additional countries (ask for the list of countries), clinical trial results data, literature review, refurbished market and product base analysis. Market analysis of target competitors can be analyzed from technology-based analysis to market portfolio strategies. We can add as many competitors that you require data about in the format and data style you are looking for. Our team of analysts can also provide you data in crude raw excel files pivot tables (Fact book) or can assist you in creating presentations from the data sets available in the report.


