Global In Line Uv Vis Spectroscopy Market
Market Size in USD Million
CAGR :
% 
 USD
388.00 Million
USD
670.15 Million
2025
2033
USD
388.00 Million
USD
670.15 Million
2025
2033
| 2026 –2033 | |
| USD 388.00 Million | |
| USD 670.15 Million | |
| % | |
|
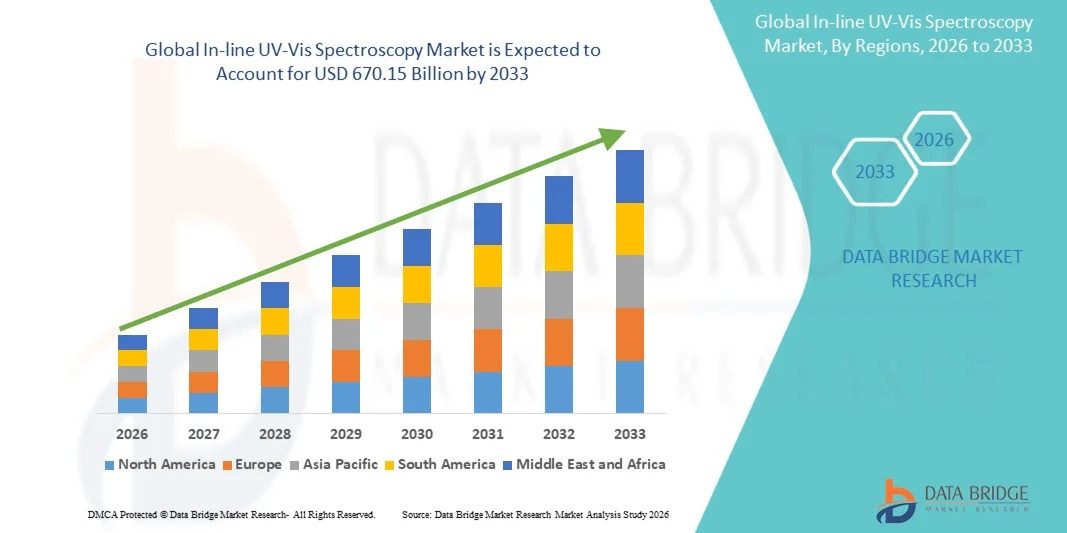
In-line UV-Vis Spectroscopy Market Size
- The global In-line UV-Vis Spectroscopy market size was valued at USD 388.00 Million in 2025and is expected to reach USD 670.15 Million by 2033, at a CAGR of 7.07% during the forecast period
- The market growth is largely fueled by the increasing adoption of process analytical technologies (PAT) in pharmaceutical, biotechnology, and chemical manufacturing, leading to improved real-time monitoring, higher process efficiency, and enhanced product quality control across production lines
- Furthermore, rising demand for continuous manufacturing, growing emphasis on real-time quality assurance, and expanding use of non-destructive analytical techniques in industrial process optimization are establishing In-line UV-Vis Spectroscopy solutions as a critical component of modern manufacturing analytics. These converging factors are accelerating the uptake of In-line UV-Vis Spectroscopy solutions, thereby significantly boosting the industry's growth
In-line UV-Vis Spectroscopy Market Analysis
- In-line UV-Vis spectroscopy systems, which provide real-time, non-destructive monitoring of chemical concentration, reaction kinetics, and process quality in manufacturing environments, are increasingly vital in pharmaceutical, chemical, biotechnology, and food industries due to their ability to enable continuous monitoring, improve process control, and ensure consistent product quality
- The escalating demand for in-line UV-Vis spectroscopy is primarily fueled by the growing adoption of Process Analytical Technology (PAT) frameworks, rising shift toward continuous manufacturing, increasing regulatory emphasis on real-time quality assurance, and expanding need for automation in industrial process monitoring
- North America dominated the In-line UV-Vis Spectroscopy market with the largest revenue share of 38.7% in 2025, driven by advanced pharmaceutical manufacturing infrastructure, strong adoption of PAT systems, high R&D investments, and widespread implementation of real-time analytical technologies, with the U.S. leading in deployment across biopharma and chemical industries
- Asia-Pacific is expected to be the fastest growing region in the In-line UV-Vis Spectroscopy market during the forecast period due to rapid expansion of pharmaceutical and chemical manufacturing, increasing industrial automation, rising investments in quality control technologies, and strong government support for advanced manufacturing in countries such as China, India, and Japan
- The chemical concentration segment accounted for the largest market revenue share of 42.9% in 2025, driven by widespread use of UV-Vis spectroscopy for real-time monitoring of chemical reactions and concentration levels in industrial processes
Report Scope and In-line UV-Vis Spectroscopy Market Segmentation
|
Attributes |
In-line UV-Vis Spectroscopy Key Market Insights |
|
Segments Covered |
|
|
Countries Covered |
North America · U.S. · Canada · Mexico Europe · Germany · France · U.K. · Netherlands · Switzerland · Belgium · Russia · Italy · Spain · Turkey · Rest of Europe Asia-Pacific · China · Japan · India · South Korea · Singapore · Malaysia · Australia · Thailand · Indonesia · Philippines · Rest of Asia-Pacific Middle East and Africa · Saudi Arabia · U.A.E. · South Africa · Egypt · Israel · Rest of Middle East and Africa South America · Brazil · Argentina · Rest of South America |
|
Key Market Players |
• Agilent Technologies, Inc. (U.S.) |
|
Market Opportunities |
· Rising Adoption of Process Analytical Technology (PAT) and Continuous Manufacturing · Expansion of Industrial Automation and Real-Time Quality Control Systems |
|
Value Added Data Infosets |
In addition to the insights on market scenarios such as market value, growth rate, segmentation, geographical coverage, and major players, the market reports curated by the Data Bridge Market Research also include in-depth expert analysis, patient epidemiology, pipeline analysis, pricing analysis, and regulatory framework. |
In-line UV-Vis Spectroscopy Market Trends
“Enhanced Process Monitoring and Real-Time Analytical Control”
- A significant and accelerating trend in the global In-line UV-Vis Spectroscopy market is the increasing adoption of real-time, continuous analytical monitoring within manufacturing and laboratory environments. This shift is driven by the need for faster decision-making, improved process efficiency, and higher product quality across pharmaceuticals, chemicals, food & beverage, and biotechnology industries
- In-line UV-Vis spectroscopy systems are increasingly being integrated directly into production lines and bioprocessing units, enabling continuous measurement of critical parameters such as concentration, reaction kinetics, and impurity levels without the need for manual sampling. This reduces delays associated with traditional offline laboratory testing and enhances overall process control
- Advanced data processing and chemometric models are further improving the interpretability of spectral data, allowing operators to convert raw absorbance readings into actionable process insights in real time. This is particularly valuable in process analytical technology (PAT) frameworks, where consistent product quality and regulatory compliance are essential
- The growing emphasis on automation and digital manufacturing is also accelerating the deployment of in-line UV-Vis systems, as industries move toward fully integrated smart production environments with minimal human intervention and higher operational efficiency
In-line UV-Vis Spectroscopy Market Dynamics
Driver
“Rising Demand for Process Efficiency, Quality Assurance, and Regulatory Compliance”
- The increasing need for stringent quality control and process optimization in regulated industries such as pharmaceuticals and biotechnology is a key driver for the adoption of in-line UV-Vis spectroscopy systems. Manufacturers are under growing pressure to ensure consistent product quality while minimizing batch failures and production variability
- Regulatory frameworks such as Process Analytical Technology (PAT) and Quality by Design (QbD) are encouraging the use of real-time analytical tools, including UV-Vis spectroscopy, to improve process understanding and ensure compliance with international manufacturing standards
- In addition, industries are adopting these systems to reduce production costs associated with offline laboratory testing, manual sampling errors, and delayed corrective actions. Real-time monitoring enables faster intervention during deviations, improving yield and reducing waste
- The expansion of biopharmaceutical production, fermentation-based processes, and continuous manufacturing models further supports market growth, as these applications require precise and uninterrupted monitoring of critical process parameters
Restraint/Challenge
“High Instrumentation Costs and Technical Integration Complexity”
- Despite strong adoption potential, the high initial cost of advanced in-line UV-Vis spectroscopy systems remains a significant barrier, particularly for small and medium-sized enterprises. The cost of sensors, calibration systems, and supporting analytical software can be substantial
- Integration of in-line spectroscopy systems into existing production infrastructure can also be technically challenging. Many legacy manufacturing setups require significant modification to accommodate real-time analytical instruments, leading to additional installation time and operational disruption
- Another key challenge is the requirement for skilled personnel capable of interpreting spectral data and maintaining calibration accuracy. Inadequate expertise can limit the effectiveness of these systems and reduce return on investment
- Furthermore, variability in sample matrices, fouling of probes in harsh process environments, and the need for frequent validation can impact system reliability and increase maintenance requirements, thereby slowing broader adoption in cost-sensitive or less technologically mature industries
In-line UV-Vis Spectroscopy Market Scope
The market is segmented on the basis of instrument type, application, and end-user.
- By Instrument Type
On the basis of instrument type, the In-line UV-Vis Spectroscopy market is segmented into single-beam, dual-beam, array-based, and handheld systems. The dual-beam segment dominated the largest market revenue share of 38.6% in 2025, driven by its superior measurement accuracy, stability, and ability to compensate for light source fluctuations during continuous industrial monitoring. Dual-beam systems are widely used in high-precision process industries such as pharmaceuticals and chemicals due to their reliable real-time analytical performance. The segment benefits from increasing demand for advanced process analytical technologies (PAT) in manufacturing environments. Growing emphasis on quality control and regulatory compliance is significantly supporting adoption. Integration of digital monitoring and automated calibration features is further enhancing system efficiency. Rising adoption in continuous production processes is contributing to market expansion. Technological advancements in optical design and detector sensitivity are improving analytical accuracy. Expansion of industrial automation across end-user industries is also driving demand. Furthermore, increasing focus on real-time process optimization is expected to sustain segment dominance during the forecast period.
The array-based segment is expected to witness the fastest CAGR of 12.4% from 2026 to 2033, driven by increasing demand for high-speed spectral acquisition and multi-wavelength analysis capabilities. Array-based systems offer rapid data collection without mechanical scanning, making them highly suitable for real-time industrial monitoring applications. The segment benefits from rising adoption of compact and high-resolution spectroscopic instruments. Pharmaceutical and food industries are increasingly utilizing array-based UV-Vis systems for continuous quality monitoring. Technological advancements in photodiode arrays and detector miniaturization are enhancing system performance. Growing integration with AI-based analytical software is improving predictive process control. Expansion of smart manufacturing and Industry 4.0 initiatives is further supporting market growth. Increasing need for high-throughput analysis in chemical processing is driving adoption. Continuous innovation in optical instrumentation is strengthening market competitiveness. Furthermore, rising demand for efficient and low-maintenance systems is expected to drive strong segment growth during the forecast period.
- By Application
On the basis of application, the In-line UV-Vis Spectroscopy market is segmented into color measurement, chemical concentration, turbidity & haze measurement, and thickness measurement. The chemical concentration segment accounted for the largest market revenue share of 42.9% in 2025, driven by widespread use of UV-Vis spectroscopy for real-time monitoring of chemical reactions and concentration levels in industrial processes. This application is critical in ensuring product consistency, quality control, and process optimization across industries. The segment benefits from increasing adoption of automated process analytical technologies in pharmaceuticals and chemicals. Rising demand for precise and continuous monitoring of reaction kinetics is significantly supporting market growth. Integration of UV-Vis systems with digital control platforms is enhancing operational efficiency. Expanding industrial automation and smart manufacturing initiatives are further driving adoption. Regulatory requirements for product quality and safety are also contributing to segment expansion. Technological advancements in inline sensors and optical probes are improving measurement accuracy. Furthermore, increasing focus on real-time process optimization is expected to sustain segment dominance during the forecast period.
The color measurement segment is expected to witness the fastest CAGR of 11.8% from 2026 to 2033, driven by increasing demand for precise and continuous color quality monitoring in industries such as food & beverages, paints, and plastics. UV-Vis spectroscopy enables accurate color analysis during production processes, ensuring product consistency and compliance with quality standards. The segment benefits from growing adoption of inline monitoring systems in manufacturing lines. Rising consumer demand for high-quality and visually consistent products is significantly supporting growth. Technological advancements in optical sensing and calibration techniques are improving measurement reliability. Increasing use of automation in production facilities is further driving adoption. Expansion of packaging and consumer goods
- By End-User
On the basis of end-user, the In-line UV-Vis Spectroscopy market is segmented into plastics industry, chemical industry, food & beverages, pharmaceutical industry, painting & coating industry, and other industries. The pharmaceutical industry segment dominated the largest market revenue share of 34.7% in 2025, driven by stringent regulatory requirements and the need for precise real-time monitoring of drug manufacturing processes. UV-Vis spectroscopy is extensively used for concentration analysis, impurity detection, and quality assurance in pharmaceutical production. The segment benefits from increasing adoption of continuous manufacturing technologies and process analytical tools. Rising global demand for pharmaceuticals and biologics is significantly supporting market growth. Regulatory agencies such as the FDA and EMA encourage real-time quality monitoring systems, further driving adoption. Integration of advanced analytical instruments with automated production lines is enhancing efficiency. Expanding biopharmaceutical manufacturing activities are also contributing to segment expansion. Increasing focus on quality-by-design (QbD) approaches is strengthening demand. Furthermore, rising investment in pharmaceutical R&D and production infrastructure is expected to sustain segment dominance during the forecast period.
The food & beverages segment is expected to witness the fastest CAGR of 12.1% from 2026 to 2033, driven by increasing demand for real-time quality control and safety monitoring in food processing. UV-Vis spectroscopy is widely used for analyzing color, additives, contaminants, and nutritional content in food products. The segment benefits from rising consumer awareness regarding food safety and quality standards. Growing adoption of automation in food production facilities is significantly supporting market growth. Regulatory compliance requirements for food quality assurance are further driving adoption. Technological advancements in portable and inline spectroscopic systems are improving operational efficiency. Increasing demand for processed and packaged foods is also contributing to market expansion. Integration of smart sensors and AI-driven analytics is enhancing quality monitoring capabilities. Expansion of global food manufacturing industries is strengthening demand. Furthermore, rising focus on transparency and product consistency is expected to drive strong segment growth during the forecast period.
In-line UV-Vis Spectroscopy Market Regional Analysis
- North America dominated the In-line UV-Vis Spectroscopy market with the largest revenue share of 38.7% in 2025, driven by advanced pharmaceutical manufacturing infrastructure, strong adoption of Process Analytical Technology (PAT) systems, high R&D investments, and widespread implementation of real-time analytical monitoring solutions. The region benefits from the presence of leading biopharmaceutical and chemical companies that are increasingly integrating in-line UV-Vis spectroscopy into continuous manufacturing and quality assurance workflows to enhance process efficiency and product consistency
- The growing emphasis on real-time process monitoring, regulatory compliance, and product quality optimization has significantly accelerated the adoption of in-line UV-Vis spectroscopy across pharmaceutical, biotechnology, and chemical industries
- This widespread adoption is further supported by rising investments in industrial automation, increasing demand for continuous manufacturing technologies, and expanding use of advanced analytical instrumentation in R&D and production environments, establishing in-line UV-Vis spectroscopy as a critical tool in modern process analytics
U.S. In-line UV-Vis Spectroscopy Market Insight
The U.S. In-line UV-Vis Spectroscopy market captured the largest revenue share within North America in 2025, driven by strong pharmaceutical and biopharmaceutical manufacturing activity, high R&D expenditure, and early adoption of advanced analytical technologies. The country is a major hub for innovation in Process Analytical Technology (PAT), with widespread deployment of in-line UV-Vis systems across biopharma production, chemical processing, and research laboratories. Additionally, increasing regulatory expectations for real-time quality assurance and the shift toward continuous manufacturing are further supporting market expansion in the U.S.
Europe In-line UV-Vis Spectroscopy Market Insight
The Europe In-line UV-Vis Spectroscopy market is projected to expand at a substantial CAGR throughout the forecast period, primarily driven by stringent regulatory frameworks, increasing adoption of continuous manufacturing practices, and strong demand for advanced analytical solutions in pharmaceutical and chemical industries. The region is witnessing growing integration of PAT tools in production environments to improve efficiency, ensure compliance, and enhance product quality. Investments in industrial automation and laboratory modernization are also contributing to market growth across Europe.
U.K. In-line UV-Vis Spectroscopy Market Insight
The U.K. In-line UV-Vis Spectroscopy market is anticipated to grow at a noteworthy CAGR during the forecast period, driven by increasing pharmaceutical R&D activities, rising adoption of advanced analytical instrumentation, and strong focus on process optimization in drug development and manufacturing. The country’s well-established life sciences sector and emphasis on innovation in analytical technologies are supporting the adoption of in-line UV-Vis spectroscopy across both academic and industrial applications.
Germany In-line UV-Vis Spectroscopy Market Insight
The Germany In-line UV-Vis Spectroscopy market is expected to expand at a considerable CAGR during the forecast period, fueled by strong chemical and pharmaceutical manufacturing industries, increasing adoption of Industry 4.0 technologies, and growing emphasis on process efficiency and quality control. Germany’s advanced industrial base and focus on precision engineering are driving the integration of real-time spectroscopic monitoring systems in production and R&D environments.
Asia-Pacific In-line UV-Vis Spectroscopy Market Insight
The Asia-Pacific In-line UV-Vis Spectroscopy market is poised to grow at the fastest CAGR during the forecast period of 2026 to 2033, driven by rapid expansion of pharmaceutical and chemical manufacturing, increasing industrial automation, rising investments in quality control technologies, and strong government support for advanced manufacturing initiatives across countries such as China, India, and Japan. The region is also witnessing growing adoption of PAT systems as manufacturers aim to improve production efficiency, regulatory compliance, and product quality.
Japan In-line UV-Vis Spectroscopy Market Insight
The Japan In-line UV-Vis Spectroscopy market is gaining momentum due to the country’s advanced pharmaceutical and chemical industries, strong focus on precision manufacturing, and increasing adoption of automated analytical technologies. Japan’s emphasis on high-quality standards and process optimization is driving the integration of real-time spectroscopic tools in production and research applications.
China In-line UV-Vis Spectroscopy Market Insight
The China In-line UV-Vis Spectroscopy market accounted for the largest market revenue share in Asia Pacific in 2025, attributed to the country’s rapidly expanding pharmaceutical and chemical manufacturing base, increasing adoption of industrial automation, and strong government support for advanced manufacturing technologies. China is witnessing growing implementation of Process Analytical Technology (PAT) frameworks in both domestic and multinational production facilities, significantly boosting demand for in-line UV-Vis spectroscopy solutions.
In-line UV-Vis Spectroscopy Market Share
The In-line UV-Vis Spectroscopy industry is primarily led by well-established companies, including:
• Agilent Technologies, Inc. (U.S.)
• Thermo Fisher Scientific Inc. (U.S.)
• PerkinElmer, Inc. (U.S.)
• Shimadzu Corporation (Japan)
• Sartorius AG (Germany)
• Mettler-Toledo International Inc. (U.S.)
• ABB Ltd (Switzerland)
• Endress+Hauser Group (Switzerland)
• Hach Company (U.S.)
• Metrohm AG (Switzerland)
• Yokogawa Electric Corporation (Japan)
• Anton Paar GmbH (Austria)
• Bruker Corporation (U.S.)
• Analytik Jena AG (Germany)
• HORIBA, Ltd. (Japan)
• Waters Corporation (U.S.)
• Kett Electric Laboratory (Japan)
• Ocean Insight (U.S.)
• Metrohm Autolab (Switzerland)
• Jasco Inc. (Japan)
Latest Developments in Global In-line UV-Vis Spectroscopy Market
- In February 2021, pharmaceutical and chemical manufacturing industries increasingly expanded adoption of Process Analytical Technology (PAT) frameworks, integrating in-line UV-Vis spectroscopy systems for real-time monitoring of reaction kinetics, concentration changes, and quality control in continuous manufacturing environments. This shift was driven by regulatory encouragement from agencies like the FDA for real-time release testing (RTRT) in drug manufacturing
- In March 2022, ABB Ltd. strengthened its analytical instrumentation portfolio by expanding inline optical spectroscopy solutions for industrial process monitoring. The development supported enhanced real-time UV-Vis absorbance measurement systems for chemical and pharmaceutical production lines, improving automation and process control efficiency
- In January 2023, Thermo Fisher Scientific expanded its in-process UV-Vis spectroscopy and PAT-enabled analytics platforms, integrating advanced fiber-optic probe technologies for real-time reaction monitoring in biopharma and API manufacturing workflows. The development supported continuous manufacturing trends in regulated pharmaceutical production
- In July 2023, increasing adoption of fiber-optic in-line UV-Vis probes was reported across pharmaceutical and food & beverage industries, enabling non-invasive real-time measurement of chemical concentrations, turbidity, and reaction endpoints. This advancement improved scalability of continuous manufacturing systems globally
- In April 2024, Agilent Technologies advanced its spectroscopy solutions portfolio by enhancing integration of UV-Vis systems with automated process control software, supporting in-line and at-line measurement applications for pharmaceutical quality assurance and chemical process optimization
- In September 2024, industry reports highlighted growing deployment of AI-enabled chemometric models integrated with in-line UV-Vis spectroscopy systems, allowing predictive analysis of chemical reactions, impurity detection, and automated batch correction in real time across pharmaceutical manufacturing facilities
- In March 2025, Shimadzu Corporation expanded its industrial spectroscopy offerings by enhancing in-line UV-Vis process analyzers with improved sensitivity and faster scanning capabilities, designed for continuous monitoring in chemical synthesis, polymer production, and bioprocessing applications
SKU-
Get online access to the report on the World's First Market Intelligence Cloud

- Interactive Data Analysis Dashboard
- Company Analysis Dashboard for high growth potential opportunities
- Research Analyst Access for customization & queries
- Competitor Analysis with Interactive dashboard
- Latest News, Updates & Trend analysis
- Harness the Power of Benchmark Analysis for Comprehensive Competitor Tracking
Research Methodology
Data collection and base year analysis are done using data collection modules with large sample sizes. The stage includes obtaining market information or related data through various sources and strategies. It includes examining and planning all the data acquired from the past in advance. It likewise envelops the examination of information inconsistencies seen across different information sources. The market data is analysed and estimated using market statistical and coherent models. Also, market share analysis and key trend analysis are the major success factors in the market report. To know more, please request an analyst call or drop down your inquiry.
The key research methodology used by DBMR research team is data triangulation which involves data mining, analysis of the impact of data variables on the market and primary (industry expert) validation. Data models include Vendor Positioning Grid, Market Time Line Analysis, Market Overview and Guide, Company Positioning Grid, Patent Analysis, Pricing Analysis, Company Market Share Analysis, Standards of Measurement, Global versus Regional and Vendor Share Analysis. To know more about the research methodology, drop in an inquiry to speak to our industry experts.
Customization Available
Data Bridge Market Research is a leader in advanced formative research. We take pride in servicing our existing and new customers with data and analysis that match and suits their goal. The report can be customized to include price trend analysis of target brands understanding the market for additional countries (ask for the list of countries), clinical trial results data, literature review, refurbished market and product base analysis. Market analysis of target competitors can be analyzed from technology-based analysis to market portfolio strategies. We can add as many competitors that you require data about in the format and data style you are looking for. Our team of analysts can also provide you data in crude raw excel files pivot tables (Fact book) or can assist you in creating presentations from the data sets available in the report.


