
Global Membrane Chemicals Market
Market Size in USD Million
 USD
800.00 Million
USD
1,111.81 Million
2021
2029
USD
800.00 Million
USD
1,111.81 Million
2021
2029
| 2022 - 2029 | |
| USD 800.00 Million | |
| USD 1,111.81 Million | |
| % | |
|
Market Analysis and Size
Membrane chemicals are mainly used to treat water by removing bacteria and impurities. These chemicals are very effective for the filtering of water impurities. These chemicals are also used across pulp and paper production, oil & gas, electric power and food & beverage. Membrane chemicals are non-hazardous and eco-friendly and also keep the whole water system in optimal condition. Desalination, paper & pulp, Waste water treatment, power, food & beverages and pharmaceuticals are some of the major end-user industries of the membrane chemicals.
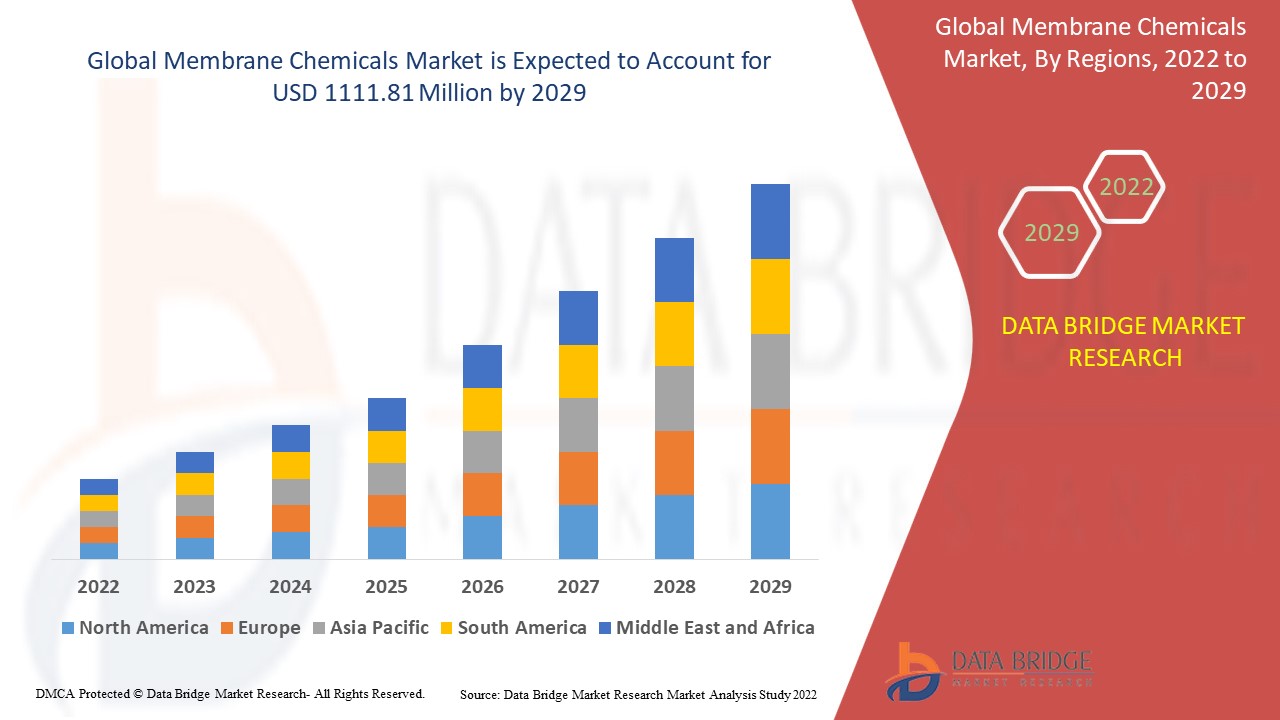
Data Bridge Market Research analyses that the membrane chemicals market is expected to undergo a CAGR of 4.20% during the forecast period. This indicates that the market value, which was USD 800.00 million in 2021, would rocket up to USD 1111.81 million by 2029. In addition to the insights on market scenarios such as market value, growth rate, segmentation, geographical coverage, and major players, the market reports curated by the Data Bridge Market Research also include in-depth expert analysis, geographically represented company-wise production and capacity, network layouts of distributors and partners, detailed and updated price trend analysis and deficit analysis of supply chain and demand.
Report Scope and Market Segmentation
|
Report Metric |
Details |
|
Forecast Period |
2022 to 2029 |
|
Base Year |
2021 |
|
Historic Years |
2020 (Customizable to 2014 - 2019) |
|
Quantitative Units |
Revenue in USD Million, Volumes in Units, Pricing in USD |
|
Segments Covered |
Product (Scale Inhibitors, Coagulants and Flocculants, Biocides, pH Adjusters, Dechlorinates, Others), End user (Waste Water Treatment, Power, Food and Beverages, Desalination, Chemicals, Paper and Pulp, Pharmaceuticals, Others) |
|
Countries Covered |
U.S., Canada and Mexico in North America, Germany, France, U.K., Netherlands, Switzerland, Belgium, Russia, Italy, Spain, Turkey, Rest of Europe in Europe, China, Japan, India, South Korea, Singapore, Malaysia, Australia, Thailand, Indonesia, Philippines, Rest of Asia-Pacific (APAC) in the Asia-Pacific (APAC), Saudi Arabia, U.A.E, South Africa, Egypt, Israel, Rest of Middle East and Africa (MEA) as a part of Middle East and Africa (MEA), Brazil, Argentina and Rest of South America as part of South America |
|
Market Players Covered |
Veolia Water Technologies (France), Ecolab (U.S.), Kemira (Finland), General Electric (U.S.), BWA Water Additives UK Limited (U.K.), Genesys International Corporation Ltd (India), H2O Innovation (Canada), Reverse Osmosis Chemicals International (U.K.), King Lee Technologies (U.S.), Lenntech BV (U.A.E), Applied Membranes Inc. (U.S.), Acuro Organics Limited (India), American Water Chemicals Inc. (U.S.), SUEZ (France), Aceepta (U.K.), Koch Separation Solutions (U.S.) |
|
Market Opportunities |
|
Market Definition
A membrane is a thin selective barrier that allows some things to pass through but stops others. These things may be ions, molecules, or other some other small particles. The chemical of the membrane are lipid (such as cholesterol, phospholipid and sphingolipid), Proteins and carbohydrate (such as glycoprotein)
Membrane Chemicals Market Dynamics
Drivers
- Expansion and Growth influenced the market growth
Expansion and Growth of water treatment industry has promoted the growth of the membrane chemical market. In other words, rising demand of extraction, filtration and distillation which make the membrane chemicals are a crucial part of waste water management. The surging rate of urbanization and rising demand for pure water in all areas directly influence the market growth rate.
- Rising demand of RO chemical membrane in pharmaceutical sector
The demand for high-quality pure water devoid of harmful bacteria and microorganisms has been increasing in the pharmaceutical sector, specifically for the applications such as equipment rinsing, cleaning and manufacturing of active pharmaceutical ingredients (APIs), drugs, non-compendial waters and laboratory waters. The increasing use of RO membrane chemicals in the pharmaceutical sector are likely to drive the market growth rate.
Opportunities
- Large investment and installation of RO technology
Growing installation of RO technology across the water-intensive companies for their processes. Also, the companies are also investing large amount to develop lucrative chemicals for preventing membrane treating and fouling RO membranes. Growing such investment and installation by the manufacturer is expected to offer an immense opportunity for the growth of the membrane chemicals market
Restraints/Challenges
- Fluctuating prices
Volatility in the prices of raw materials and high maintenance cost is posing a major issue to the growth of the membrane chemicals market. Additionally, uneven availability of the raw materials at one specific location is demeaning the market's growth, which are the major market restraint for the market.
-
Use of alternative options
Overall, the world is encouraging renewable energy sources to reduce the dependence on fossil fuels. Most of the membrane chemicals industry comes through the thermal-based power industries. But, renewable energy sources are suffering from traction compared to thermal and nuclear-based power industries. This is also anticipated to hinder the growth rate of the market.
This membrane chemicals market report provides details of new recent developments, trade regulations, import-export analysis, production analysis, value chain optimization, market share, impact of domestic and localized market players, analyses opportunities in terms of emerging revenue pockets, changes in market regulations, strategic market growth analysis, market size, category market growths, application niches and dominance, product approvals, product launches, geographic expansions, technological innovations in the market. To gain more info on the membrane chemicals market contact Data Bridge Market Research for an Analyst Brief, our team will help you take an informed market decision to achieve market growth.
Global Membrane Chemicals Market Scope
The membrane chemicals market is segmented on the basis of product and end user. The growth amongst these segments will help you analyze meagre growth segments in the industries and provide the users with a valuable market overview and market insights to help them make strategic decisions for identifying core market applications.
Product
- Scale Inhibitors
- Coagulants and Flocculants
- Biocides
- pH Adjusters
- Dechlorinates
- Others
End user
- Waste Water Treatment
- Power
- Food and Beverages
- Desalination
- Chemicals
- Paper and Pulp
- Pharmaceuticals
- Others
Membrane Chemicals Market Regional Analysis/Insights
The membrane chemicals market is analysed and market size insights and trends are provided by country, product and end user as referenced above.
The countries covered in the membrane chemicals market report are U.S., Canada and Mexico in North America, Germany, France, U.K., Netherlands, Switzerland, Belgium, Russia, Italy, Spain, Turkey, Rest of Europe in Europe, China, Japan, India, South Korea, Singapore, Malaysia, Australia, Thailand, Indonesia, Philippines, Rest of Asia-Pacific (APAC) in the Asia-Pacific (APAC), Saudi Arabia, U.A.E, South Africa, Egypt, Israel, Rest of Middle East and Africa (MEA) as a part of Middle East and Africa (MEA), Brazil, Argentina and Rest of South America as part of South America.
Asia-Pacific dominates the membrane chemicals market due to the rapidly increasing application of membrane technologies in this region during the forecast period. However, North America has seen wide research and development pertaining to polymers and paving the way to new avenues for market players in membrane chemicals.
The country section of the report also provides individual market impacting factors and changes in regulation in the market domestically that impacts the current and future trends of the market. Data points like down-stream and upstream value chain analysis, technical trends and porter's five forces analysis, case studies are some of the pointers used to forecast the market scenario for individual countries. Also, the presence and availability of global brands and their challenges faced due to large or scarce competition from local and domestic brands, impact of domestic tariffs and trade routes are considered while providing forecast analysis of the country data.
Competitive Landscape and Membrane Chemicals Market Share Analysis
The membrane chemicals market competitive landscape provides details by competitor. Details included are company overview, company financials, revenue generated, market potential, investment in research and development, new market initiatives, global presence, production sites and facilities, production capacities, company strengths and weaknesses, product launch, product width and breadth, application dominance. The above data points provided are only related to the companies' focus related to membrane chemicals market.
Some of the major players operating in the membrane chemicals market are:
- Veolia Water Technologies (France)
- Ecolab (U.S.)
- Kemira (Finland)
- General Electric (U.S.)
- BWA Water Additives UK Limited (U.K.)
- Genesys International Corporation Ltd (India)
- H2O Innovation (Canada)
- Reverse Osmosis Chemicals International (U.K.)
- King Lee Technologies (U.S.)
- Lenntech BV (U.A.E)
- Applied Membranes Inc. (U.S.)
- Acuro Organics Limited (India)
- American Water Chemicals Inc. (U.S.)
- SUEZ (France)
- Aceepta (U.K.)
- Koch Separation Solutions (U.S.)
SKU-

- Interactive Data Analysis Dashboard
- Company Analysis Dashboard for high growth potential opportunities
- Research Analyst Access for customization & queries
- Competitor Analysis with Interactive dashboard
- Latest News, Updates & Trend analysis
- Harness the Power of Benchmark Analysis for Comprehensive Competitor Tracking
Table of Content
1. INTRODUCTION
1.1 OBJECTIVES OF THE STUDY
1.2 MARKET DEFINITION
1.3 OVERVIEW OF GLOBAL MEMBRANE CHEMICALS MARKET
1.4 CURRENCY AND PRICING
1.5 LIMITATION
1.6 MARKETS COVERED
2. MARKET SEGMENTATION
2.1 KEY TAKEAWAYS
2.2 ARRIVING AT THE GLOBAL MEMBRANE CHEMICALS MARKET SIZE
2.3 VENDOR POSITIONING GRID
2.4 MARKETS COVERED
2.5 GEOGRAPHIC SCOPE
2.6 YEARS CONSIDERED FOR THE STUDY
2.7 RESEARCH METHODOLOGY
2.8 TECHNOLOGY LIFE LINE CURVE
2.9 MULTIVARIATE MODELLING
2.10 PRIMARY INTERVIEWS WITH KEY OPINION LEADERS
2.11 DBMR MARKET POSITION GRID
2.12 MARKET APPLICATION COVERAGE GRID
2.13 DBMR MARKET CHALLENGE MATRIX
2.14 SECONDARY SOURCES
2.15 GLOBAL MEMBRANE CHEMICALS MARKET: RESEARCH SNAPSHOT
2.16 ASSUMPTIONS
3. MARKET OVERVIEW
3.1 DRIVERS
3.2 RESTRAINTS
3.3 OPPORTUNITIES
3.4 CHALLENGES
4. EXECUTIVE SUMMARY
5. PREMIUM INSIGHTS
5.1 RAW MATERIAL COVERAGE
5.2 PRODUCTION CONSUMPTION ANALYSIS
5.3 IMPORT EXPORT SCENARIO
5.4 TECHNOLOGICAL ADVANCEMENT BY MANUFACTURERS
5.5 PORTER’S FIVE FORCES
5.6 VENDOR SELECTION CRITERIA
5.7 PESTEL ANALYSIS
5.8 REGULATION COVERAGE
5.8.1 PRODUCT CODES
5.8.2 CERTIFIED STANDARDS
5.8.3 SAFETY STANDARDS
5.8.3.1. MATERIAL HANDLING & STORAGE
5.8.3.2. TRANSPORT & PRECAUTIONS
5.8.3.3. HARAD IDENTIFICATION
6. PRICE INDEX
7. PRODUCTION CAPACITY OVERVIEW
8. SUPPLY CHAIN ANALYSIS
8.1 OVERVIEW
8.2 LOGISTIC COST SCENARIO
8.3 IMPORTANCE OF LOGISTICS SERVICE PROVIDERS
9. CLIMATE CHANGE SCENARIO
9.1 ENVIRONMENTAL CONCERNS
9.2 INDUSTRY RESPONSE
9.3 GOVERNMENT’S ROLE
9.4 ANALYST RECOMMENDATIONS
10. GLOBAL MEMBRANE CHEMICALS MARKET, BY PRODUCT, (2020-2029), (USD MILLION) (TONS)
(VALUE, VOLUME AND ASP FOR EACH SEGMENT WILL BE PROVIDED)
10.1 OVERVIEW
10.2 SCALE INHIBITORS
10.2.1 SCALE INHIBITORS, BY TECHNOLOGY
10.2.1.1. ACTIFLO PROCESS
10.2.1.2. MICROWAVE ULTRAVIOLET (UV) DISINFECTION
10.2.1.3. NANOFILTRATION (NF)
10.2.1.4. REVERSE OSMOSIS (RO)
10.2.1.5. MULTI-STAGE FILTRATION
10.2.2 SCALE INHIBITORS , BY TYPE
10.2.2.1. ORGANIC
10.2.2.1.1. POLY(ACRYLIC ACID) (PAA)
10.2.2.1.2. PHOSPHINOCARBOXYLIC ACID
10.2.2.1.3. SULFONATED POLYMERS
10.2.2.1.4. PHOSPHONATES
10.2.2.2. INORGANIC
10.2.2.2.1. POLY(METAPHOSPHATE)S
10.2.2.2.2. PHOSPHATE SALTS
10.2.3 SCALE INHIBITORS , BY CATEGORY
10.2.3.1. THERMODYNAMIC INHIBITORS
10.2.3.2. KINETIC INHIBITORS
10.3 COAGULANTS AND FLOCCULANTS
10.3.1 COAGULANTS AND FLOCCULANTS, BY TECHNOLOGY
10.3.1.1. ACTIFLO PROCESS
10.3.1.2. MICROWAVE ULTRAVIOLET (UV) DISINFECTION
10.3.1.3. NANOFILTRATION (NF)
10.3.1.4. REVERSE OSMOSIS (RO)
10.3.1.5. MULTI-STAGE FILTRATION
10.3.2 INORGANIC
10.3.2.1. ALUMINUM SULFATE
10.3.2.2. ALUMINUM CHLORIDE
10.3.2.3. POLYALUMINUM CHLORIDE (PACL)
10.3.2.4. ALUMINUM CHLOROHYDRATE (ACH)
10.3.2.5. FERRIC
10.3.2.6. FERROUS SULFATE
10.3.2.7. FERRIC CHLORIDE
10.3.3 ORGANIC
10.3.3.1. POLYAMINE
10.3.3.2. POLYDADMAC
10.3.3.3. MELAMINE FORMALDEHYDES
10.3.3.4. TANNINS
10.3.3.5. POLYELECTROLYTES
10.4 BIOCIDES
10.4.1 BIOCIDE, BY TECHNOLOGY
10.4.1.1. ACTIFLO PROCESS
10.4.1.2. MICROWAVE ULTRAVIOLET (UV) DISINFECTION
10.4.1.3. NANOFILTRATION (NF)
10.4.1.4. REVERSE OSMOSIS (RO)
10.4.1.5. MULTI-STAGE FILTRATION
10.4.2 BIOCIDES, BY CATEGORY
10.4.2.1. OXIDIZING BIOCIDES
10.4.2.2. NON-OXIDIZING BIOCIDES
10.4.3 BIOCIDES, BY TYPE
10.4.3.1. ALGAECIDES
10.4.3.2. BACTERICIDES
10.4.3.3. FUNGICIDES
10.4.3.4. GERMICIDES
10.4.3.5. HERBICIDES
10.4.3.6. INSECTICIDES
10.4.3.7. OTHERS
10.5 PH ADJUSTERS
10.5.1 PH ADJUSTERS, BY TECHNOLOGY
10.5.1.1. ACTIFLO PROCESS
10.5.1.2. MICROWAVE ULTRAVIOLET (UV) DISINFECTION
10.5.1.3. NANOFILTRATION (NF)
10.5.1.4. REVERSE OSMOSIS (RO)
10.5.1.5. MULTI-STAGE FILTRATION
10.5.2 PH ADJUSTER , BY TYPE
10.5.2.1. PH UP
10.5.2.2. PH DOWN
10.5.3 PH ADJUSTER, BY CATEGORY
10.5.3.1. LACTIC ACID
10.5.3.2. CITRIC ACID
10.5.3.3. GLUCONO DELTA LACTONE
10.5.3.4. AMINOMETHYL PROPANOL
10.5.3.5. OTHERS
10.6 DECHLORINATES
10.6.1 DECHLORINATES, BY TECHNOLOGY
10.6.1.1. ACTIFLO PROCESS
10.6.1.2. MICROWAVE ULTRAVIOLET (UV) DISINFECTION
10.6.1.3. NANOFILTRATION (NF)
10.6.1.4. REVERSE OSMOSIS (RO)
10.6.1.5. MULTI-STAGE FILTRATION
10.6.2 DECHLORINATES, BY PROCESS
10.6.2.1. ULTRAVIOLET DECHLORINATION
10.6.2.2. CHEMICAL DECHLORINATION
10.6.2.3. ADSORPTION DECHLORINATION
10.7 ANTISCALANTS
10.7.1 ANTISCALANTS, BY TECHNOLOGY
10.7.1.1. ACTIFLO PROCESS
10.7.1.2. MICROWAVE ULTRAVIOLET (UV) DISINFECTION
10.7.1.3. NANOFILTRATION (NF)
10.7.1.4. REVERSE OSMOSIS (RO)
10.7.1.5. MULTI-STAGE FILTRATION
10.7.2 SEAWATER
10.7.3 PHOPHOROUS FREE ANTISCALANTS
10.7.4 IRON SCALING
10.7.5 CARBONATE SCALING-HIG SATURATION
10.7.6 SULFATE SCALING-HIGH SATURATION
10.7.7 HIGH SILICA RO ANTISCALANT
10.7.8 HIGH OUTPUT POWDER ANTISCALANT
10.7.9 ANTISCALANT FOR SEAWATER DESALINATION
10.7.10 ANTISCALANT WITH SILICA INHIBITION
10.7.11 SUPREME PH RO ANTISCALANT
10.7.12 LOW PH ANTISCALANT
10.7.13 GENERAL PURPOSE RO ANTISCALANT
10.8 CLEANERS
10.8.1 CLEANERS, BY TECHNOLOGY
10.8.1.1. ACTIFLO PROCESS
10.8.1.2. MICROWAVE ULTRAVIOLET (UV) DISINFECTION
10.8.1.3. NANOFILTRATION (NF)
10.8.1.4. REVERSE OSMOSIS (RO)
10.8.1.5. MULTI-STAGE FILTRATION
10.8.2 ACID MEMBRANE CLEANER
10.8.3 ALKALINE MEMBRANE CLEANER
10.9 PRE-TREATMENT CHEMICALS
10.9.1 PRE-TREATMENT CHEMICALS, BY TECHNOLOGY
10.9.1.1. ACTIFLO PROCESS
10.9.1.2. MICROWAVE ULTRAVIOLET (UV) DISINFECTION
10.9.1.3. NANOFILTRATION (NF)
10.9.1.4. REVERSE OSMOSIS (RO)
10.9.1.5. MULTI-STAGE FILTRATION
10.10 OTHERS
11. GLOBAL MEMBRANE CHEMICALS MARKET, BY MEMBRANE COMPOSITION, (2020-2029), (USD MILLION) (KILO TONS)
(VALUE, VOLUME FOR EACH SEGMENT WILL BE PROVIDED)
11.1 OVERVIEW
11.2 LIPID
11.2.1 CHOLESTEROL
11.2.2 PHOSPHOLIPID
11.2.3 SPHINGOLIPID
11.2.4 OTHERS
11.3 PROTEINS
11.3.1 ALBUMIN
11.3.2 GLYCOPROTEINS
11.3.3 CHROMOPROTEINS
11.3.4 SCLEROPROTEINS (ALBUMINOIDS) 5
11.3.5 SILK FIBROIN
11.3.6 COLLAGEN
11.4 CARBOHYDRATE
11.4.1 MONOSACCHARIDES
11.4.2 DISACCHARIDES
11.4.3 OLIGOSACCHARIDES
11.5 WATER-BASED
11.6 OTHERS
12. GLOBAL MEMBRANE CHEMICALS MARKET, BY TECHNOLOGY, (2020-2029), (USD MILLION)
12.1 OVERVIEW
12.2 ACTIFLO PROCESS
12.3 MICROWAVE ULTRAVIOLET (UV) DISINFECTION
12.4 NANOFILTRATION (NF)
12.5 REVERSE OSMOSIS (RO)
12.6 MULTI-STAGE FILTRATION
13. GLOBAL MEMBRANE CHEMICALS MARKET, BY MATERIAL, (2020-2029), (USD MILLION)
13.1 OVERVIEW
13.2 POLYMER
13.2.1 NATURAL POLYMER
13.2.1.1. NATURAL POLYMER, BY TYPE
13.2.1.1.1. WOOL
13.2.1.1.2. RUBBER
13.2.1.1.3. CELLULOSE
13.2.2 SYNTHETIC POLYMER
13.2.2.1. SYNTHETIC POLYMER,BY TYPE
13.2.2.1.1. POLYAMIDE
13.2.2.1.2. POLYSULFONE
13.2.2.1.3. POLYETHERSULFONE
13.2.2.1.4. POLYMETHYLPENTENE
13.2.2.1.5. POLYSTYRENE
13.2.2.1.6. POLYTETRAFLUOROETHYLENE
13.2.2.1.7. OTHERS
13.3 CERAMIC
13.3.1 SUBMERGED CERAMIC MEMBRANE
13.3.2 PRESURIZED CERAMIC MEMBRANE
14. GLOBAL MEMBRANE CHEMICALS MARKET, BY APPLICATION, (2020-2029), (USD MILLION)
14.1 OVERVIEW
14.2 WASTE WATER TREATMENT
14.2.1 WASTE WATER TREATMENT, BY PRODUCT TYPE
14.2.1.1. SCALE INHIBITORS
14.2.1.2. COAGULANTS AND FLOCCULANTS
14.2.1.3. BIOCIDES
14.2.1.4. PH ADJUSTERS
14.2.1.5. DECHLORINATES
14.2.1.6. ANTISCALANTS
14.2.1.7. CLEANERS
14.2.1.8. PRE-TREATMENT CHEMICALS
14.2.1.9. OTHERS
14.3 POWER
14.3.1 POWER, BY PRODUCT TYPE
14.3.1.1. SCALE INHIBITORS
14.3.1.2. COAGULANTS AND FLOCCULANTS
14.3.1.3. BIOCIDES
14.3.1.4. PH ADJUSTERS
14.3.1.5. DECHLORINATES
14.3.1.6. ANTISCALANTS
14.3.1.7. CLEANERS
14.3.1.8. PRE-TREATMENT CHEMICALS
14.3.1.9. OTHERS
14.4 FOOD AND BEVERAGES
14.4.1 FOOD AND BEVERAGES, BY PRODUCT TYPE
14.4.1.1. SCALE INHIBITORS
14.4.1.2. COAGULANTS AND FLOCCULANTS
14.4.1.3. BIOCIDES
14.4.1.4. PH ADJUSTERS
14.4.1.5. DECHLORINATES
14.4.1.6. ANTISCALANTS
14.4.1.7. CLEANERS
14.4.1.8. PRE-TREATMENT CHEMICALS
14.4.1.9. OTHERS
14.5 DESALINATION
14.5.1 DESALINATION, BY PRODUCT TYPE
14.5.1.1. SCALE INHIBITORS
14.5.1.2. COAGULANTS AND FLOCCULANTS
14.5.1.3. BIOCIDES
14.5.1.4. PH ADJUSTERS
14.5.1.5. DECHLORINATES
14.5.1.6. ANTISCALANTS
14.5.1.7. CLEANERS
14.5.1.8. PRE-TREATMENT CHEMICALS
14.5.1.9. OTHERS
14.6 CHEMICAL
14.6.1 CHEMICAL, BY PRODUCT TYPE
14.6.1.1. SCALE INHIBITORS
14.6.1.2. COAGULANTS AND FLOCCULANTS
14.6.1.3. BIOCIDES
14.6.1.4. PH ADJUSTERS
14.6.1.5. DECHLORINATES
14.6.1.6. ANTISCALANTS
14.6.1.7. CLEANERS
14.6.1.8. PRE-TREATMENT CHEMICALS
14.6.1.9. OTHERS
14.7 PAPER AND PULP
14.7.1 PAPER AND PULP, BY PRODUCT TYPE
14.7.1.1. SCALE INHIBITORS
14.7.1.2. COAGULANTS AND FLOCCULANTS
14.7.1.3. BIOCIDES
14.7.1.4. PH ADJUSTERS
14.7.1.5. DECHLORINATES
14.7.1.6. ANTISCALANTS
14.7.1.7. CLEANERS
14.7.1.8. PRE-TREATMENT CHEMICALS
14.7.1.9. OTHERS
14.8 PHARMACEUTICALS
14.8.1 PHARMACEUTICALS, BY PRODUCT TYPE
14.8.1.1. SCALE INHIBITORS
14.8.1.2. COAGULANTS AND FLOCCULANTS
14.8.1.3. BIOCIDES
14.8.1.4. PH ADJUSTERS
14.8.1.5. DECHLORINATES
14.8.1.6. ANTISCALANTS
14.8.1.7. CLEANERS
14.8.1.8. PRE-TREATMENT CHEMICALS
14.8.1.9. OTHERS
14.9 MUNICIPAL
14.9.1 MUNICIPAL, BY PRODUCT TYPE
14.9.1.1. SCALE INHIBITORS
14.9.1.2. COAGULANTS AND FLOCCULANTS
14.9.1.3. BIOCIDES
14.9.1.4. PH ADJUSTERS
14.9.1.5. DECHLORINATES
14.9.1.6. ANTISCALANTS
14.9.1.7. CLEANERS
14.9.1.8. PRE-TREATMENT CHEMICALS
14.9.1.9. OTHERS
14.10 OTHERS
15. GLOBAL MEMBRANE CHEMICALS MARKET, BY REGION, (2020-2029), (USD MILLION) (TONS)
GLOBAL MEMBRANE CHEMICALS MARKET, (ALL SEGMENTATION PROVIDED ABOVE IS REPRESENTED IN THIS CHAPTER BY COUNTRY)
15.1 NORTH AMERICA
15.1.1 U.S.
15.1.2 CANADA
15.1.3 MEXICO
15.2 EUROPE
15.2.1 ERMANY
15.2.2 U.K.
15.2.3 ITALY
15.2.4 FRANCE
15.2.5 SPAIN
15.2.6 RUSSIA
15.2.7 SWITZERLAND
15.2.8 TURKEY
15.2.9 BELGIUM
15.2.10 NETHERLANDS
15.2.11 DENMARK
15.2.12 SWEDEN
15.2.13 POLAND
15.2.14 NORWAY
15.2.15 FINLAND
15.2.16 REST OF EUROPE
15.3 ASIA-PACIFIC
15.3.1 JAPAN
15.3.2 CHINA
15.3.3 SOUTH KOREA
15.3.4 INDIA
15.3.5 SINGAPORE
15.3.6 THAILAND
15.3.7 INDONESIA
15.3.8 MALAYSIA
15.3.9 PHILIPPINES
15.3.10 AUSTRALIA
15.3.11 NEW ZEALAND
15.3.12 VIETNAM
15.3.13 TAIWAN
15.3.14 REST OF ASIA-PACIFIC
15.4 SOUTH AMERICA
15.4.1 BRAZIL
15.4.2 ARGENTINA
15.4.3 REST OF SOUTH AMERICA
15.5 MIDDLE EAST AND AFRICA
15.5.1 SOUTH AFRICA
15.5.2 EGYPT
15.5.3 BAHRAIN
15.5.4 UNITED ARAB EMIRATES
15.5.5 KUWAIT
15.5.6 OMAN
15.5.7 QATAR
15.5.8 SAUDI ARABIA
15.5.9 REST OF MEA
16. GLOBAL MEMBRANE CHEMICALS MARKET, COMPANY LANDSCAPE
16.1 COMPANY SHARE ANALYSIS: GLOBAL
16.2 COMPANY SHARE ANALYSIS: NORTH AMERICA
16.3 COMPANY SHARE ANALYSIS: EUROPE
16.4 COMPANY SHARE ANALYSIS: ASIA-PACIFIC
16.5 MERGERS AND ACQUISITIONS
16.6 NEW PRODUCT DEVELOPMENT AND APPROVALS
16.7 EXPANSIONS
16.8 PARTNERSHIP AND OTHER STRATEGIC DEVELOPMENTS
17. SWOT AND DATA BRIDGE MARKET RESEARCH ANALYSIS
18. GLOBAL MEMBRANE CHEMICALS MARKET - COMPANY PROFILES
18.1 VEOLIA WATER TECHNOLOGIES
18.1.1 COMPANY SNAPSHOT
18.1.2 PRODUCT PORTFOLIO
18.1.3 PRODUCTION CAPACITY OVERVIEW
18.1.4 SWOT ANALYSIS
18.1.5 REVENUE ANALYSIS
18.1.6 RECENT UPDATES
18.2 ECOLAB
18.2.1 COMPANY SNAPSHOT
18.2.2 PRODUCT PORTFOLIO
18.2.3 PRODUCTION CAPACITY OVERVIEW
18.2.4 SWOT ANALYSIS
18.2.5 REVENUE ANALYSIS
18.2.6 RECENT UPDATES
18.3 KEMIRA (FINLAND)
18.3.1 COMPANY SNAPSHOT
18.3.2 PRODUCT PORTFOLIO
18.3.3 PRODUCTION CAPACITY OVERVIEW
18.3.4 SWOT ANALYSIS
18.3.5 REVENUE ANALYSIS
18.3.6 RECENT UPDATES
18.4 GENERAL ELECTRIC
18.4.1 COMPANY SNAPSHOT
18.4.2 PRODUCT PORTFOLIO
18.4.3 PRODUCTION CAPACITY OVERVIEW
18.4.4 SWOT ANALYSIS
18.4.5 REVENUE ANALYSIS
18.4.6 RECENT UPDATES
18.5 BWA WATER ADDITIVES UK LIMITED
18.5.1 COMPANY SNAPSHOT
18.5.2 PRODUCT PORTFOLIO
18.5.3 PRODUCTION CAPACITY OVERVIEW
18.5.4 SWOT ANALYSIS
18.5.5 REVENUE ANALYSIS
18.5.6 RECENT UPDATES
18.6 GENESYS INTERNATIONAL CORPORATION LTD
18.6.1 COMPANY SNAPSHOT
18.6.2 PRODUCT PORTFOLIO
18.6.3 PRODUCTION CAPACITY OVERVIEW
18.6.4 SWOT ANALYSIS
18.6.5 REVENUE ANALYSIS
18.6.6 RECENT UPDATES
18.7 H2O INNOVATION
18.7.1 COMPANY SNAPSHOT
18.7.2 PRODUCT PORTFOLIO
18.7.3 PRODUCTION CAPACITY OVERVIEW
18.7.4 SWOT ANALYSIS
18.7.5 REVENUE ANALYSIS
18.7.6 RECENT UPDATES
18.8 REVERSE OSMOSIS CHEMICALS INTERNATIONAL
18.8.1 COMPANY SNAPSHOT
18.8.2 PRODUCT PORTFOLIO
18.8.3 PRODUCTION CAPACITY OVERVIEW
18.8.4 SWOT ANALYSIS
18.8.5 REVENUE ANALYSIS
18.8.6 RECENT UPDATES
18.9 KING LEE TECHNOLOGIES
18.9.1 COMPANY SNAPSHOT
18.9.2 PRODUCT PORTFOLIO
18.9.3 PRODUCTION CAPACITY OVERVIEW
18.9.4 SWOT ANALYSIS
18.9.5 REVENUE ANALYSIS
18.9.6 RECENT UPDATES
18.10 LENNTECH BV
18.10.1 COMPANY SNAPSHOT
18.10.2 PRODUCT PORTFOLIO
18.10.3 PRODUCTION CAPACITY OVERVIEW
18.10.4 SWOT ANALYSIS
18.10.5 REVENUE ANALYSIS
18.10.6 RECENT UPDATES
18.11 APPLIED MEMBRANES INC.
18.11.1 COMPANY SNAPSHOT
18.11.2 PRODUCT PORTFOLIO
18.11.3 PRODUCTION CAPACITY OVERVIEW
18.11.4 SWOT ANALYSIS
18.11.5 REVENUE ANALYSIS
18.11.6 RECENT UPDATES
18.12 ACURO ORGANICS LIMITED
18.12.1 COMPANY SNAPSHOT
18.12.2 PRODUCT PORTFOLIO
18.12.3 PRODUCTION CAPACITY OVERVIEW
18.12.4 SWOT ANALYSIS
18.12.5 REVENUE ANALYSIS
18.12.6 RECENT UPDATES
18.13 AMERICAN WATER CHEMICALS INC.
18.13.1 COMPANY SNAPSHOT
18.13.2 PRODUCT PORTFOLIO
18.13.3 PRODUCTION CAPACITY OVERVIEW
18.13.4 SWOT ANALYSIS
18.13.5 REVENUE ANALYSIS
18.13.6 RECENT UPDATES
18.14 SUEZ
18.14.1 COMPANY SNAPSHOT
18.14.2 PRODUCT PORTFOLIO
18.14.3 PRODUCTION CAPACITY OVERVIEW
18.14.4 SWOT ANALYSIS
18.14.5 REVENUE ANALYSIS
18.14.6 RECENT UPDATES
18.15 ACEEPTA
18.15.1 COMPANY SNAPSHOT
18.15.2 PRODUCT PORTFOLIO
18.15.3 PRODUCTION CAPACITY OVERVIEW
18.15.4 SWOT ANALYSIS
18.15.5 REVENUE ANALYSIS
18.15.6 RECENT UPDATES
18.16 KOCH SEPARATION SOLUTIONS
18.16.1 COMPANY SNAPSHOT
18.16.2 PRODUCT PORTFOLIO
18.16.3 PRODUCTION CAPACITY OVERVIEW
18.16.4 SWOT ANALYSIS
18.16.5 REVENUE ANALYSIS
18.16.6 RECENT UPDATES
18.17 NALCO
18.17.1 COMPANY SNAPSHOT
18.17.2 PRODUCT PORTFOLIO
18.17.3 PRODUCTION CAPACITY OVERVIEW
18.17.4 SWOT ANALYSIS
18.17.5 REVENUE ANALYSIS
18.17.6 RECENT UPDATES
18.18 GE WATER & PROCESS TECHNOLOGIES
18.18.1 COMPANY SNAPSHOT
18.18.2 PRODUCT PORTFOLIO
18.18.3 PRODUCTION CAPACITY OVERVIEW
18.18.4 SWOT ANALYSIS
18.18.5 REVENUE ANALYSIS
18.18.6 RECENT UPDATES
18.19 TORAY INDUSTRIES
18.19.1 COMPANY SNAPSHOT
18.19.2 PRODUCT PORTFOLIO
18.19.3 PRODUCTION CAPACITY OVERVIEW
18.19.4 SWOT ANALYSIS
18.19.5 REVENUE ANALYSIS
18.19.6 RECENT UPDATES
18.20 KURITA WATER INDUSTRIES
18.20.1 COMPANY SNAPSHOT
18.20.2 PRODUCT PORTFOLIO
18.20.3 PRODUCTION CAPACITY OVERVIEW
18.20.4 SWOT ANALYSIS
18.20.5 REVENUE ANALYSIS
18.20.6 RECENT UPDATES
18.21 APPLIED MEMBRANES
18.21.1 COMPANY SNAPSHOT
18.21.2 PRODUCT PORTFOLIO
18.21.3 PRODUCTION CAPACITY OVERVIEW
18.21.4 SWOT ANALYSIS
18.21.5 REVENUE ANALYSIS
18.21.6 RECENT UPDATES
18.22 AMPAC USA
18.22.1 COMPANY SNAPSHOT
18.22.2 PRODUCT PORTFOLIO
18.22.3 PRODUCTION CAPACITY OVERVIEW
18.22.4 SWOT ANALYSIS
18.22.5 REVENUE ANALYSIS
18.22.6 RECENT UPDATES
18.23 HARSH GROUP
18.23.1 COMPANY SNAPSHOT
18.23.2 PRODUCT PORTFOLIO
18.23.3 PRODUCTION CAPACITY OVERVIEW
18.23.4 SWOT ANALYSIS
18.23.5 REVENUE ANALYSIS
18.23.6 RECENT UPDATES
18.24 AXEON
18.24.1 COMPANY SNAPSHOT
18.24.2 PRODUCT PORTFOLIO
18.24.3 PRODUCTION CAPACITY OVERVIEW
18.24.4 SWOT ANALYSIS
18.24.5 REVENUE ANALYSIS
18.24.6 RECENT UPDATES
18.25 KROFF, INC.
18.25.1 COMPANY SNAPSHOT
18.25.2 PRODUCT PORTFOLIO
18.25.3 PRODUCTION CAPACITY OVERVIEW
18.25.4 SWOT ANALYSIS
18.25.5 REVENUE ANALYSIS
18.25.6 RECENT UPDATES
*NOTE: THE COMPANIES PROFILED IS NOT EXHAUSTIVE LIST AND IS AS PER OUR PREVIOUS CLIENT REQUIREMENT. WE PROFILE MORE THAN 100 COMPANIES IN OUR STUDY AND HENCE THE LIST OF COMPANIES CAN BE MODIFIED OR REPLACED ON REQUEST
19. RELATED REPORTS
20. QUESTIONNAIRE
21. CONCLUSION
22. ABOUT DATA BRIDGE MARKET RESEARCH
Global Membrane Chemicals Market, Supply Chain Analysis and Ecosystem Framework
To support market growth and help clients navigate the impact of geopolitical shifts, DBMR has integrated in-depth supply chain analysis into its Global Membrane Chemicals Market research reports. This addition empowers clients to respond effectively to global changes affecting their industries. The supply chain analysis section includes detailed insights such as Global Membrane Chemicals Market consumption and production by country, price trend analysis, the impact of tariffs and geopolitical developments, and import and export trends by country and HSN code. It also highlights major suppliers with data on production capacity and company profiles, as well as key importers and exporters. In addition to research, DBMR offers specialized supply chain consulting services backed by over a decade of experience, providing solutions like supplier discovery, supplier risk assessment, price trend analysis, impact evaluation of inflation and trade route changes, and comprehensive market trend analysis.
Data collection and base year analysis are done using data collection modules with large sample sizes. The stage includes obtaining market information or related data through various sources and strategies. It includes examining and planning all the data acquired from the past in advance. It likewise envelops the examination of information inconsistencies seen across different information sources. The market data is analysed and estimated using market statistical and coherent models. Also, market share analysis and key trend analysis are the major success factors in the market report. To know more, please request an analyst call or drop down your inquiry.
The key research methodology used by DBMR research team is data triangulation which involves data mining, analysis of the impact of data variables on the market and primary (industry expert) validation. Data models include Vendor Positioning Grid, Market Time Line Analysis, Market Overview and Guide, Company Positioning Grid, Patent Analysis, Pricing Analysis, Company Market Share Analysis, Standards of Measurement, Global versus Regional and Vendor Share Analysis. To know more about the research methodology, drop in an inquiry to speak to our industry experts.
Data Bridge Market Research is a leader in advanced formative research. We take pride in servicing our existing and new customers with data and analysis that match and suits their goal. The report can be customized to include price trend analysis of target brands understanding the market for additional countries (ask for the list of countries), clinical trial results data, literature review, refurbished market and product base analysis. Market analysis of target competitors can be analyzed from technology-based analysis to market portfolio strategies. We can add as many competitors that you require data about in the format and data style you are looking for. Our team of analysts can also provide you data in crude raw excel files pivot tables (Fact book) or can assist you in creating presentations from the data sets available in the report.


