
Global Neoantigens Market
Market Size in USD Billion
 USD
2.62 Billion
USD
29.00 Billion
2022
2030
USD
2.62 Billion
USD
29.00 Billion
2022
2030
| 2023 - 2030 | |
| USD 2.62 Billion | |
| USD 29.00 Billion | |
| % | |
|
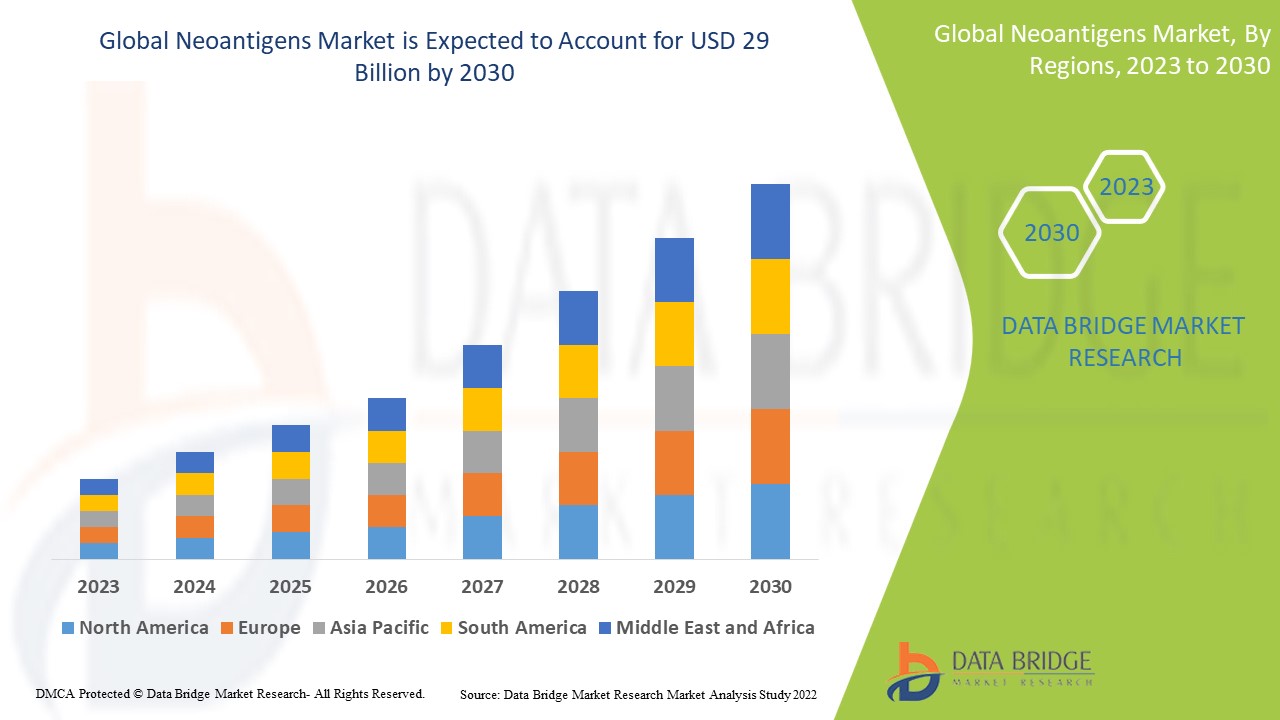
Neoantigens Market Analysis and Size
The rising prevalence of cancer has put a strain on healthcare systems globally. According to the World Health Organization (WHO), cancer was the major cause of death among people under the age of 70 years in 183 countries and the fourth top cause of mortality in 123 countries in 2019. The recent clinical developments in biotechnology and increasing investments in the research of neoantigens and associated mechanisms are expected to increase the global neoantigens market.
Data Bridge Market Research analyses a growth rate in the global neoantigens market in the forecast period 2023-2030. The expected CAGR of the global neoantigens market tends to be around 35.00% in the mentioned forecast period. The market was valued at USD 2.62 billion in 2022 and would grow to USD 29 billion by 2030. In addition to the market insights such as market value, growth rate, market segments, geographical coverage, market players, and market scenario, the market report curated by the Data Bridge Market Research team also includes in-depth expert analysis, patient epidemiology, pipeline analysis, pricing analysis, and regulatory framework.
Neoantigens Market Scope and Segmentation
|
Report Metric |
Details |
|
Forecast Period |
2023 to 2030 |
|
Base Year |
2022 |
|
Historic Years |
2021 (Customizable to 2015 - 2020) |
|
Quantitative Units |
Revenue in USD Billion, Volumes in Units, Pricing in USD |
|
Segments Covered |
Treatment (Combination Therapy and Mono Therapy), Therapeutic Specialty (Lung Cancer, Urinary System Cancer, Melanoma, Liver Cancer, Head and Neck Cancer, and Blood and Bone Marrow Cancer), Line of Therapy (First Line, Second Line, and Later Lines), End-Users (Hospitals, Homecare, Speciality Centres, Others), Distribution Channel (Hospital Pharmacy, Online Pharmacy, Retail Pharmacy) |
|
Countries Covered |
U.S., Canada, and Mexico in North America, Germany, France, U.K., Netherlands, Switzerland, Belgium, Russia, Italy, Spain, Turkey, Rest of Europe in Europe, China, Japan, India, South Korea, Singapore, Malaysia, Australia, Thailand, Indonesia, Philippines, Rest of Asia-Pacific (APAC) in the Asia-Pacific (APAC), Saudi Arabia, U.A.E, South Africa, Egypt, Israel, Rest of Middle East and Africa (MEA) as a part of Middle East and Africa (MEA), Brazil, Argentina and Rest of South America as part of South America |
|
Market Players Covered |
Achilles Therapeutics plc (U.K.), Advaxis Immunotherapies (U.S.), Genocea (U.S.), Gradalis, Inc.(U.S.), Gritstone bio (U.S.), Iovance Biotherapetics Inc (U.S.), Medigene AG (Germany), BioNTech SE (U.S.), Lilly (U.S.), Scicomvisuals (Netherlands), Moderna, Inc.(U.S.), F. Hoffmann-La Roche Ltd. (Switzerland)., Merck KGaA (Germany), Sun Pharmaceutical Industries Ltd. (India) |
|
Market Opportunities |
|
Market Definition
Neoantigens are known as newly formed antigens that are not previously recognized by the immune system. Neoantigens are used for targeted therapies for the treatment of cancerous cells. It is also tumor-specific and highly immunogenic. Therefore, neoantigens are not expressed in healthy tissue. The neoantigens play a major role in tumor-specific T-cell mediated antitumor response and cancer immunotherapies. Furthermore, many research studies stated that neoantigens could help in immune escape, immunoediting, and sensitivity to immune checkpoint inhibitors.
Global Neoantigens Market Dynamics
Drivers
- Increasing prevalence of cancers
The rising prevalence of different forms of cancer is estimated to enhance the market's growth. In 2012, WHO projected that 8.2 million people died globally due to various malignancies. Lung, colorectal, breast, and liver cancers were among the most common cancers, with lung, colorectal, and breast cancers being the most common. Brain tumors (medulloblastoma and glioma) and neuroblastoma are the most frequent solid tumors, whereas rhabdomyosarcoma and osteosarcoma are less common solid cancers.
- Higher demand for biotechnological advancements
Biotechnology advancements have resulted in a acceptance of immunotherapy, which is pushing its application in personalized medications. Immunotherapy is commonly used to treat cancer; a few treatments include neoantigens found on the surface of cancer cells. As a result, neoantigen use for cancer treatment is being far researched.
Opportunities
- Increasing government initiatives for cancer treatment
Numerous governments have launched initiatives and programs to improve cancer treatment and prevention. For instance, in 2017, the World Health Assembly passed Resolution Cancer (WHA70.12), an integrated approach to cancer prevention and control. The program has urged the WHO and other governments to increase the efforts to meet the targets outlined in the Global Action Plan (2013-2020) for the prevention and management of non-communicable diseases (NCDs) and the 2030 UN Agenda for Sustainable Development to reduce cancer-related premature deaths.
- Higher drug launches for fast patient recovery
There are varied drugs that are launched widely to increase the recovery process. For instance, in October 2019, Corning Incorporated launched two new products, Elplasia and Matrigel, to its organoid culture portfolio to provide new solutions to support spheroid and organoid culture models. Elplasia, a 3D cell culture microplate, features a microcavity technology that enables high-volume spheroid formation, culture, and analysis. The Matrigel matrix for organoid culture is optimized to support organoid growth and differentiation. Thus, this factor create many opportunities for market growth.
Restraints/Challenges
- High cost of neoantigens
The huge expenditure of the varied neoantigens hampers the market growth. It becomes quite unaffordable for many of the sections and thus restricts the market growth.
This global neoantigens market report provides details of new recent developments, trade regulations, import-export analysis, production analysis, value chain optimization, market share, impact of domestic and localized market players, analyses opportunities in terms of emerging revenue pockets, changes in market regulations, strategic market growth analysis, market size, category market growths, application niches and dominance, product approvals, product launches, geographic expansions, technological innovations in the market. To gain more info on the global neoantigens market contact Data Bridge Market Research for an Analyst Brief, our team will help you take an informed market decision to achieve market growth.
Global Neoantigens Market Scope
The global neoantigens market is segmented on the basis of treatment, therapeutic specialty, line of therapy, distribution channel and end-user. The growth amongst these segments will help you analyze meagre growth segments in the industries and provide the users with a valuable market overview and market insights to help them make strategic decisions for identifying core market applications.
Therapeutic Specialty
- Lung Cancer
- Urinary System Cancer
- Melanoma
- Liver Cancer
- Head and Neck Cancer
- Blood and Bone Marrow Cancer
Treatment
- Combination Therapy
- Mono Therapy
Line of Therapy
- First Line
- Second Line
- Later Lines
End-Users
- Hospitals
- Homecare
- Speciality Centres
- Others
Distribution Channel
- Hospital Pharmacy
- Online Pharmacy
- Retail Pharmacy
Neoantigens Market Regional Analysis/Insights
The global neoantigens market is analyzed and market size insights and trends are provided by treatment, therapeutic specialty, line of therapy, distribution channel and end-user as referenced above.
The major countries covered in the global neoantigens market report are the U.S., Canada and Mexico in North America, Germany, France, U.K., Netherlands, Switzerland, Belgium, Russia, Italy, Spain, Turkey, Rest of Europe in Europe, China, Japan, India, South Korea, Singapore, Malaysia, Australia, Thailand, Indonesia, Philippines, Rest of Asia-Pacific (APAC) in the Asia-Pacific (APAC), Saudi Arabia, U.A.E, South Africa, Egypt, Israel, Rest of Middle East and Africa (MEA) as a part of Middle East and Africa (MEA), Brazil, Argentina and Rest of South America as part of South America.
Asia-Pacific is expected to have the highest market growth due to the presence of key product manufacturers, increasing research and development activities, and healthcare expenditure.
North America dominates the market due to the latest technology development and the presence of a variety of innovative drug molecules to enhance the treatment procedure.
The country section of the report also provides individual market impacting factors and changes in regulation in the market domestically that impacts the current and future trends of the market. Also, the presence and availability of global brands and their challenges faced due to large or scarce competition from local and domestic brands, impact of domestic tariffs and trade routes are considered while providing forecast analysis of the country data.
Competitive Landscape and Global Neoantigens Market Share Analysis
The global neoantigens market competitive landscape provides details by competitor. Details included are company overview, company financials, revenue generated, market potential, investment in research and development, new market initiatives, global presence, production sites and facilities, production capacities, company strengths and weaknesses, product launch, product width and breadth, application dominance. The above data points provided are only related to the companies' focus related to global neoantigens market.
Key players operating in the global neoantigens market include:
- Achilles Therapeutics plc (U.K.)
- Advaxis Immunotherapies (U.S.)
- Genocea (U.S.)
- Gradalis, Inc.(U.S.)
- Gritstone bio (U.S.)
- Iovance Biotherapetics Inc (U.S.)
- Medigene AG (Germany)
- BioNTech SE (U.S.)
- Lilly (U.S.)
- Scicomvisuals (Netherlands)
- Moderna, Inc.(U.S.)
- F. Hoffmann-La Roche Ltd. (Switzerland).
- Merck KGaA (Germany)
- Sun Pharmaceutical Industries Ltd. (India)
SKU-

- Interactive Data Analysis Dashboard
- Company Analysis Dashboard for high growth potential opportunities
- Research Analyst Access for customization & queries
- Competitor Analysis with Interactive dashboard
- Latest News, Updates & Trend analysis
- Harness the Power of Benchmark Analysis for Comprehensive Competitor Tracking
Table of Content
1 INTRODUCTION
1.1 OBJECTIVES OF THE STUDY
1.2 MARKET DEFINITION
1.3 OVERVIEW OF GLOBAL NEOANTIGENS MARKET
1.4 CURRENCY AND PRICING
1.5 LIMITATION
1.6 MARKETS COVERED
2 MARKET SEGMENTATION
2.1 KEY TAKEAWAYS
2.2 ARRIVING AT THE GLOBAL NEOANTIGENS MARKET SIZE
2.2.1 VENDOR POSITIONING GRID
2.2.2 TECHNOLOGY LIFE LINE CURVE
2.2.3 TRIPOD DATA VALIDATION MODEL
2.2.4 MARKET GUIDE
2.2.5 MULTIVARIATE MODELLING
2.2.6 TOP TO BOTTOM ANALYSIS
2.2.7 CHALLENGE MATRIX
2.2.8 APPLICATION COVERAGE GRID
2.2.9 STANDARDS OF MEASUREMENT
2.2.10 VENDOR SHARE ANALYSIS
2.2.11 EPIDEMIOLOGY BASED MODEL
2.2.12 DATA POINTS FROM KEY PRIMARY INTERVIEWS
2.2.13 DATA POINTS FROM KEY SECONDARY DATABASES
2.3 GLOBAL NEOANTIGENS MARKET: RESEARCH SNAPSHOT
2.4 ASSUMPTIONS
3 MARKET OVERVIEW
3.1 DRIVERS
3.2 RESTRAINTS
3.3 OPPORTUNITIES
3.4 CHALLENGES
4 EXECUTIVE SUMMARY
5 PREMIUM INSIGHTS
5.1 PESTEL ANALYSIS
5.2 PORTER’S 5 FORCES MODEL
6 INDUSTRY INSIGHTS
6.1 PATENT ANALYSIS
6.1.1 PATENT LANDSCAPE
6.1.2 USPTO NUMBER
6.1.3 PATENT EXPIRY
6.1.4 EPIO NUMBER
6.1.5 PATENT STRENGTH AND QUALITY
6.1.6 PATENT CLAIMS
6.1.7 PATENT CITATIONS
6.1.8 PATENT LITIGATION AND LICENSING
6.1.9 FILE OF PATENT
6.1.10 PATENT RECEIVED CONTRIES
6.1.11 TECHNOLOGY BACKGROUND
6.2 DRUG TREATMENT RATE BY MATURED MARKETS
6.3 DEMOGRAPHIC TRENDS: IMPACTS ON ALL INCIDENCE RATES
6.4 PATIENT FLOW DIAGRAM
6.5 KEY PRICING STRATEGIES
6.6 KEY PATIENT ENROLLMENT STRATEGIES
6.7 INTERVIEWS WITH SPECIALIST
6.8 OTHER KOL SNAPSHOTS
7 MERGERS AND ACQUISITION
7.1 LICENSING
7.2 COMMERCIALIZATION AGREEMENTS
8 REGULATORY FRAMEWORK
8.1 REGULATORY APPROVAL PROCESS
8.2 GEOGRAPHIES’ EASE OF REGULATORY APPROVAL
8.3 REGULATORY APPROVAL PATHWAYS
8.4 LICENSING AND REGISTRATION
8.5 POST-MARKETING SURVEILLANCE
8.6 GOOD MANUFACTURING PRACTICES (GMPS) GUIDELINES
9 PIPELINE ANALYSIS
9.1 CLINICAL TRIALS AND PHASE ANALYSIS
9.2 DRUG THERAPY PIPELINE
9.3 PHASE III CANDIDATES
9.4 PHASE II CANDIDATES
9.5 PHASE I CANDIDATES
9.6 OTHERS (PRE-CLINICAL AND RESEARCH)
10 R & D ANALYSIS
10.1 COMPARATIVE ANALYSIS
10.2 DRUG DEVELOPMENTAL LANDSCAPE
10.3 IN-DEPTH INSIGHTS ON REGULATORY MILESTONES
10.4 THERAPEUTIC ASSESSMENT
10.5 ASSET-BASED COLLABORATIONS AND PARTNERSHIPS
11 GLOBAL NEOANTIGENS MARKET, BY TREATMENT
11.1 OVERVIEW
11.2 COMBINATION THERAPY
11.3 MONO THERAPY
12 GLOBAL NEOANTIGENS MARKET, BY TYPE
12.1 OVERVIEW
12.2 PERSONALIZED NEOANTIGEN VACCINES
12.3 OFF-THE-SHELF NEOANTIGEN VACCINES
13 GLOBAL NEOANTIGENS MARKET, BY PRODUCT TYPE
13.1 OVERVIEW
13.2 VACCINES
13.2.1 NUCLEIC ACID/DNA VACCINES
13.2.1.1. BY THERAPY
13.2.1.1.1. COMBINATION THERAPY
13.2.1.1.2. MONO THERAPY
13.2.1.2. BY TYPE
13.2.1.2.1. PERSONALIZED NEOANTIGEN VACCINES
13.2.1.2.2. OFF-THE-SHELF NEOANTIGEN VACCINES
13.2.2 RNA VACCINES
13.2.2.1. BY TYPE
13.2.2.1.1. COMBINATION THERAPY
13.2.2.1.2. MONO THERAPY
13.2.2.2. BY TYPE
13.2.2.2.1. PERSONALIZED NEOANTIGEN VACCINES
13.2.2.2.2. OFF-THE-SHELF NEOANTIGEN VACCINES
13.2.3 PEPTIDE VACCINES
13.2.3.1. BY TYPE
13.2.3.1.1. COMBINATION THERAPY
13.2.3.1.2. MONO THERAPY
13.2.3.2. BY TYPE
13.2.3.2.1. PERSONALIZED NEOANTIGEN VACCINES
13.2.3.2.2. OFF-THE-SHELF NEOANTIGEN VACCINES
13.2.4 DENDRITIC CELL–BASED VACCINES
13.2.4.1. BY TYPE
13.2.4.1.1. COMBINATION THERAPY
13.2.4.1.2. MONO THERAPY
13.2.4.2. BY TYPE
13.2.4.2.1. PERSONALIZED NEOANTIGEN VACCINES
13.2.4.2.2. OFF-THE-SHELF NEOANTIGEN VACCINES
13.3 ADOPTIVE T CELL THERAPY
13.3.1 EMERGING DRUGS
13.3.1.1. NIVOLUMAB
13.3.1.2. PEMBROLIZUMAB
13.3.1.3. FLUDARABINE
13.3.1.4. CYCLOPHOSPHAMIDE
13.3.1.5. OTHERS
14 GLOBAL NEOANTIGENS MARKET, BY APPROACH
14.1 OVERVIEW
14.2 NEOANTIGEN-BASED CANCER VACCINES
14.3 NEOANTIGEN-BASED ADOPTIVE CELL TRANSFER (ACT)
15 GLOBAL NEOANTIGENS MARKET, BY LINE OF THERAPY
15.1 OVERVIEW
15.2 FIRST LINE NEOVACCINES REGIMENS
15.3 SECOND LINE NEOVACCINE REGIMENS
15.4 LATER LINES NEOVACCINES REGIMENS
16 GLOBAL NEOANTIGENS MARKET, BY THERAPEUTIC
16.1 OVERVIEW
16.2 HEMATOLOGICAL MALIGNANCIES
16.2.1 BY APPROCH
16.2.1.1. NEOANTIGEN-BASED CANCER VACCINES
16.2.1.2. NEOANTIGEN-BASED ADOPTIVE CELL TRANSFER (ACT)
16.2.2 BY LINE OF THERAPY
16.2.2.1. FIRST LINE NEOVACCINES REGIMENS
16.2.2.2. SECOND LINE NEOVACCINE REGIMENS
16.2.2.3. LATER LINES NEOVACCINES REGIMENS
16.3 MELANOMA
16.3.1 BY APPROCH
16.3.1.1. NEOANTIGEN-BASED CANCER VACCINES
16.3.1.2. NEOANTIGEN-BASED ADOPTIVE CELL TRANSFER (ACT)
16.3.2 BY LINE OF THERAPY
16.3.2.1. FIRST LINE NEOVACCINES REGIMENS
16.3.2.2. SECOND LINE NEOVACCINE REGIMENS
16.3.2.3. LATER LINES NEOVACCINES REGIMENS
16.4 BREAST CANCER
16.4.1 BY APPROCH
16.4.1.1. NEOANTIGEN-BASED CANCER VACCINES
16.4.1.2. NEOANTIGEN-BASED ADOPTIVE CELL TRANSFER (ACT)
16.4.2 BY LINE OF THERAPY
16.4.2.1. FIRST LINE NEOVACCINES REGIMENS
16.4.2.2. SECOND LINE NEOVACCINE REGIMENS
16.4.2.3. LATER LINES NEOVACCINES REGIMENS
16.5 GASTROINTESTINAL CANCER
16.5.1 BY APPROCH
16.5.1.1. NEOANTIGEN-BASED CANCER VACCINES
16.5.1.2. NEOANTIGEN-BASED ADOPTIVE CELL TRANSFER (ACT)
16.5.2 BY LINE OF THERAPY
16.5.2.1. FIRST LINE NEOVACCINES REGIMENS
16.5.2.2. SECOND LINE NEOVACCINE REGIMENS
16.5.2.3. LATER LINES NEOVACCINES REGIMENS
16.6 LUNG CANCER
16.6.1 BY APPROCH
16.6.1.1. NEOANTIGEN-BASED CANCER VACCINES
16.6.1.2. NEOANTIGEN-BASED ADOPTIVE CELL TRANSFER (ACT)
16.6.2 BY LINE OF THERAPY
16.6.2.1. FIRST LINE NEOVACCINES REGIMENS
16.6.2.2. SECOND LINE NEOVACCINE REGIMENS
16.6.2.3. LATER LINES NEOVACCINES REGIMENS
16.7 SOLID TUMORS
16.7.1 BY APPROCH
16.7.1.1. NEOANTIGEN-BASED CANCER VACCINES
16.7.1.2. NEOANTIGEN-BASED ADOPTIVE CELL TRANSFER (ACT)
16.7.2 BY LINE OF THERAPY
16.7.2.1. FIRST LINE NEOVACCINES REGIMENS
16.7.2.2. SECOND LINE NEOVACCINE REGIMENS
16.7.2.3. LATER LINES NEOVACCINES REGIMENS
16.8 URINARY SYSTEM CANCER
16.8.1 BY APPROCH
16.8.1.1. NEOANTIGEN-BASED CANCER VACCINES
16.8.1.2. NEOANTIGEN-BASED ADOPTIVE CELL TRANSFER (ACT)
16.8.2 BY LINE OF THERAPY
16.8.2.1. FIRST LINE NEOVACCINES REGIMENS
16.8.2.2. SECOND LINE NEOVACCINE REGIMENS
16.8.2.3. LATER LINES NEOVACCINES REGIMENS
16.9 PROSTATE CANCER
16.9.1 BY APPROCH
16.9.1.1. NEOANTIGEN-BASED CANCER VACCINES
16.9.1.2. NEOANTIGEN-BASED ADOPTIVE CELL TRANSFER (ACT)
16.9.2 BY LINE OF THERAPY
16.9.2.1. FIRST LINE NEOVACCINES REGIMENS
16.9.2.2. SECOND LINE NEOVACCINE REGIMENS
16.9.2.3. LATER LINES NEOVACCINES REGIMENS
16.1 HEAD AND NECK CANCERS
16.10.1 BY APPROCH
16.10.1.1. NEOANTIGEN-BASED CANCER VACCINES
16.10.1.2. NEOANTIGEN-BASED ADOPTIVE CELL TRANSFER (ACT)
16.10.2 BY LINE OF THERAPY
16.10.2.1. FIRST LINE NEOVACCINES REGIMENS
16.10.2.2. SECOND LINE NEOVACCINE REGIMENS
16.10.2.3. LATER LINES NEOVACCINES REGIMENS
16.11 GYNECOLOGIC CANCERS
16.11.1 BY APPROCH
16.11.1.1. NEOANTIGEN-BASED CANCER VACCINES
16.11.1.2. NEOANTIGEN-BASED ADOPTIVE CELL TRANSFER (ACT)
16.11.2 BY LINE OF THERAPY
16.11.2.1. FIRST LINE NEOVACCINES REGIMENS
16.11.2.2. SECOND LINE NEOVACCINE REGIMENS
16.11.2.3. LATER LINES NEOVACCINES REGIMENS
16.12 BRAIN CANCER
16.12.1 BY APPROCH
16.12.1.1. NEOANTIGEN-BASED CANCER VACCINES
16.12.1.2. NEOANTIGEN-BASED ADOPTIVE CELL TRANSFER (ACT)
16.12.2 BY LINE OF THERAPY
16.12.2.1. FIRST LINE NEOVACCINES REGIMENS
16.12.2.2. SECOND LINE NEOVACCINE REGIMENS
16.12.2.3. LATER LINES NEOVACCINES REGIMENS
16.13 OTHERS
17 GLOBAL NEOANTIGENS MARKET, BY AGE GROUP
17.1 OVERVIEW
17.2 PEDIATRICS
17.3 ADULTS
17.4 GERIATRICS
18 GLOBAL NEOANTIGENS MARKET, BY GENDER
18.1 OVERVIEW
18.2 MALE
18.3 FEMALE
19 GLOBAL NEOANTIGENS MARKET, BY END USER
19.1 OVERVIEW
19.2 HOSPITAL
19.2.1 PUBLIC
19.2.2 PRIVATE
19.3 CLINICS
19.4 COMMUNITY CENTERS
19.5 OTHERS
20 GLOBAL NEOANTIGENS MARKET, BY DISTRIBUTION
20.1 OVERVIEW
20.2 DIRECT TENDER
20.3 RETAIL SALES
20.4 OTHERS
21 GLOBAL NEOANTIGENS MARKET, COMPANY LANDSCAPE
21.1 COMPANY SHARE ANALYSIS: GLOBAL
21.2 COMPANY SHARE ANALYSIS: NORTH AMERICA
21.3 COMPANY SHARE ANALYSIS: EUROPE
21.4 COMPANY SHARE ANALYSIS: ASIA-PACIFIC
21.5 MERGERS & ACQUISITIONS
21.6 NEW PRODUCT DEVELOPMENT & APPROVALS
21.7 EXPANSIONS
21.8 REGULATORY CHANGES
21.9 PARTNERSHIP AND OTHER STRATEGIC DEVELOPMENTS
22 GLOBAL NEOANTIGENS MARKET, BY GEOGRAPHY
Global Neoantigens market (ALL SEGMENTATION PROVIDED ABOVE IS REPRESENTED IN THIS CHAPTER BY COUNTRY)
22.1 NORTH AMERICA
22.1.1 U.S.
22.1.2 CANADA
22.1.3 MEXICO
22.2 EUROPE
22.2.1 GERMANY
22.2.2 FRANCE
22.2.3 U.K.
22.2.4 HUNGARY
22.2.5 LITHUANIA
22.2.6 AUSTRIA
22.2.7 IRELAND
22.2.8 NORWAY
22.2.9 POLAND
22.2.10 ITALY
22.2.11 SPAIN
22.2.12 RUSSIA
22.2.13 TURKEY
22.2.14 NETHERLANDS
22.2.15 SWITZERLAND
22.2.16 REST OF EUROPE
22.3 ASIA-PACIFIC
22.3.1 JAPAN
22.3.2 CHINA
22.3.3 SOUTH KOREA
22.3.4 INDIA
22.3.5 AUSTRALIA
22.3.6 SINGAPORE
22.3.7 THAILAND
22.3.8 MALAYSIA
22.3.9 INDONESIA
22.3.10 PHILIPPINES
22.3.11 VIETNAM
22.3.12 REST OF ASIA-PACIFIC
22.4 SOUTH AMERICA
22.4.1 BRAZIL
22.4.2 ARGENTINA
22.4.3 PERU
22.4.4 REST OF SOUTH AMERICA
22.5 MIDDLE EAST AND AFRICA
22.5.1 SOUTH AFRICA
22.5.2 SAUDI ARABIA
22.5.3 UAE
22.5.4 EGYPT
22.5.5 KUWAIT
22.5.6 ISRAEL
22.5.7 REST OF MIDDLE EAST AND AFRICA
22.6 KEY PRIMARY INSIGHTS: BY MAJOR COUNTRIES
23 GLOBAL NEOANTIGENS MARKET, SWOT AND DBMR ANALYSIS
24 GLOBAL NEOANTIGENS MARKET, COMPANY PROFILE
24.1 MODERNA, INC.
24.1.1 COMPANY OVERVIEW
24.1.2 REVENUE ANALYSIS
24.1.3 GEOGRAPHIC PRESENCE
24.1.4 PRODUCT PORTFOLIO
24.1.5 RECENT DEVELOPEMENTS
24.2 F. HOFFMANN-LA ROCHE LTD
24.2.1 COMPANY OVERVIEW
24.2.2 REVENUE ANALYSIS
24.2.3 GEOGRAPHIC PRESENCE
24.2.4 PRODUCT PORTFOLIO
24.2.5 RECENT DEVELOPEMENTS
24.3 AGENUS INC.
24.3.1 COMPANY OVERVIEW
24.3.2 REVENUE ANALYSIS
24.3.3 GEOGRAPHIC PRESENCE
24.3.4 PRODUCT PORTFOLIO
24.3.5 RECENT DEVELOPEMENTS
24.4 ADVAXIS, INC./AMGEN INC
24.4.1 COMPANY OVERVIEW
24.4.2 REVENUE ANALYSIS
24.4.3 GEOGRAPHIC PRESENCE
24.4.4 PRODUCT PORTFOLIO
24.4.5 RECENT DEVELOPEMENTS
24.5 MEDIGENE AG
24.5.1 COMPANY OVERVIEW
24.5.2 REVENUE ANALYSIS
24.5.3 GEOGRAPHIC PRESENCE
24.5.4 PRODUCT PORTFOLIO
24.5.5 RECENT DEVELOPEMENTS
24.6 GRITSTONE ONCOLOGY
24.6.1 COMPANY OVERVIEW
24.6.2 REVENUE ANALYSIS
24.6.3 GEOGRAPHIC PRESENCE
24.6.4 PRODUCT PORTFOLIO
24.6.5 RECENT DEVELOPEMENTS
24.7 NOUSCOM
24.7.1 COMPANY OVERVIEW
24.7.2 REVENUE ANALYSIS
24.7.3 GEOGRAPHIC PRESENCE
24.7.4 PRODUCT PORTFOLIO
24.7.5 RECENT DEVELOPEMENTS
24.8 BIOLINERX LTD.
24.8.1 COMPANY OVERVIEW
24.8.2 REVENUE ANALYSIS
24.8.3 GEOGRAPHIC PRESENCE
24.8.4 PRODUCT PORTFOLIO
24.8.5 RECENT DEVELOPEMENTS
24.9 GENEOS THERAPEUTICS, INC.
24.9.1 COMPANY OVERVIEW
24.9.2 REVENUE ANALYSIS
24.9.3 GEOGRAPHIC PRESENCE
24.9.4 PRODUCT PORTFOLIO
24.9.5 RECENT DEVELOPEMENTS
24.1 ACHILLES THERAPEUTICS PLC
24.10.1 COMPANY OVERVIEW
24.10.2 REVENUE ANALYSIS
24.10.3 GEOGRAPHIC PRESENCE
24.10.4 PRODUCT PORTFOLIO
24.10.5 RECENT DEVELOPMENTS
24.11 BIONTECH SE
24.11.1 COMPANY OVERVIEW
24.11.2 REVENUE ANALYSIS
24.11.3 GEOGRAPHIC PRESENCE
24.11.4 PRODUCT PORTFOLIO
24.11.5 RECENT DEVELOPEMENTS
24.12 GRADALIS, INC.
24.12.1 COMPANY OVERVIEW
24.12.2 REVENUE ANALYSIS
24.12.3 GEOGRAPHIC PRESENCE
24.12.4 PRODUCT PORTFOLIO
24.12.5 RECENT DEVELOPEMENTS
NOTE: THE COMPANIES PROFILED IS NOT EXHAUSTIVE LIST AND IS AS PER OUR PREVIOUS CLIENT REQUIREMENT. WE PROFILE MORE THAN 100 COMPANIES IN OUR STUDY AND HENCE THE LIST OF COMPANIES CAN BE MODIFIED OR REPLACED ON REQUEST
25 RELATED REPORTS
26 CONCLUSION
27 QUESTIONNAIRE
28 ABOUT DATA BRIDGE MARKET RESEARCH
Data collection and base year analysis are done using data collection modules with large sample sizes. The stage includes obtaining market information or related data through various sources and strategies. It includes examining and planning all the data acquired from the past in advance. It likewise envelops the examination of information inconsistencies seen across different information sources. The market data is analysed and estimated using market statistical and coherent models. Also, market share analysis and key trend analysis are the major success factors in the market report. To know more, please request an analyst call or drop down your inquiry.
The key research methodology used by DBMR research team is data triangulation which involves data mining, analysis of the impact of data variables on the market and primary (industry expert) validation. Data models include Vendor Positioning Grid, Market Time Line Analysis, Market Overview and Guide, Company Positioning Grid, Patent Analysis, Pricing Analysis, Company Market Share Analysis, Standards of Measurement, Global versus Regional and Vendor Share Analysis. To know more about the research methodology, drop in an inquiry to speak to our industry experts.
Data Bridge Market Research is a leader in advanced formative research. We take pride in servicing our existing and new customers with data and analysis that match and suits their goal. The report can be customized to include price trend analysis of target brands understanding the market for additional countries (ask for the list of countries), clinical trial results data, literature review, refurbished market and product base analysis. Market analysis of target competitors can be analyzed from technology-based analysis to market portfolio strategies. We can add as many competitors that you require data about in the format and data style you are looking for. Our team of analysts can also provide you data in crude raw excel files pivot tables (Fact book) or can assist you in creating presentations from the data sets available in the report.


