
Global Oil And Gas Process Simulation Software Market
Market Size in USD Million
 USD
1,087.53 Million
USD
1,643.88 Million
2022
2030
USD
1,087.53 Million
USD
1,643.88 Million
2022
2030
| 2023 - 2030 | |
| USD 1,087.53 Million | |
| USD 1,643.88 Million | |
| % | |
|
Oil and Gas Process Simulation Software Market Analysis and Size
Market players in the oil and gas industry have recognized the importance of advanced technologies that can enhance their manufacturing facilities' complete operational processes. These market players are progressively adopting numerous developing technologies such as data analytics and connected devices. This trend positively influences the demand for process simulation software in oil and gas industry. Solutions offered by the developers and players in the global oil and gas process simulation software market are set of software tools that provide designing capabilities and modeling. Products in the global market are utilized for analysis, development, design and optimization of numerous technical processes.
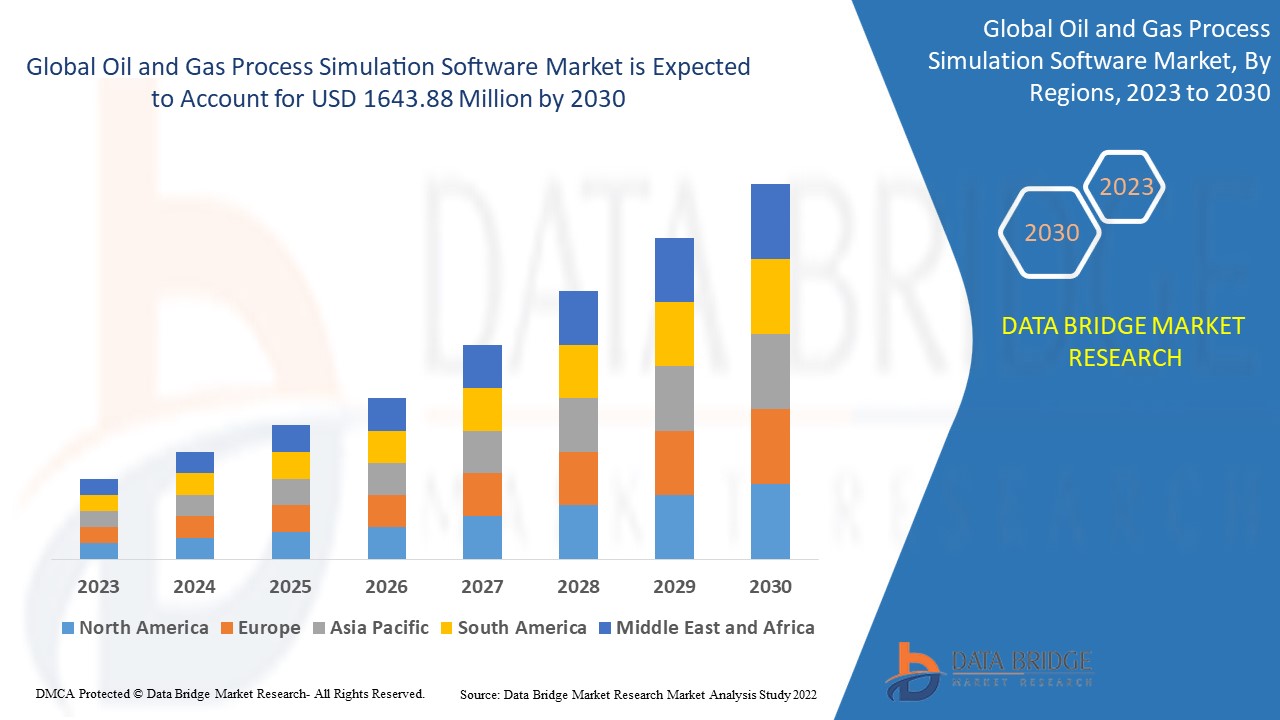
Data Bridge Market Research analyses that the oil and gas process simulation software market was valued at USD 1087.53 million in 2022 and is expected to reach the value of USD 1643.88 million by 2030, at a CAGR of 5.30% during the forecast period. In addition to the market insights such as market value, growth rate, market segments, geographical coverage, market players, and market scenario, the market report curated by the Data Bridge Market Research team includes in-depth expert analysis, import/export analysis, pricing analysis, production consumption analysis, and pestle analysis.
Oil and Gas Process Simulation Software Scope and Segmentation
|
Report Metric |
Details |
|
Forecast Period |
2023 to 2030 |
|
Base Year |
2022 |
|
Historic Years |
2021 (Customizable to 2015 - 2020) |
|
Quantitative Units |
Revenue in USD Million, Volumes in Units, Pricing in USD |
|
Segments Covered |
Component (Software and Services), Operation Type (Off-Shore, On-Shore, Heavy Oil and Unconventional), Application (Upstream, Midstream, Oil and Gas Processing, Cryogenic Processes, Refining, Petrochemicals and Green Engineering) |
|
Countries Covered |
U.S., Canada and Mexico in North America, Germany, France, U.K., Netherlands, Switzerland, Belgium, Russia, Italy, Spain, Turkey, Rest of Europe in Europe, China, Japan, India, South Korea, Singapore, Malaysia, Australia, Thailand, Indonesia, Philippines, Rest of Asia-Pacific (APAC) in the Asia-Pacific (APAC), Saudi Arabia, U.A.E, Israel, Egypt, South Africa, Rest of Middle East and Africa (MEA) as a part of Middle East and Africa (MEA), Brazil, Argentina and Rest of South America as part of South America |
|
Market Players Covered |
AspenTech (U.S.), Honeywell International Inc. (U.S.), AVEVA Group plc (U.K.), Siemens (Netherland), Chemstations Inc. (U.S.), GSE Solutions (U.S.), SLB (U.S.), ProSim (U.S.), Schneider Electric (France), Bryan Research & Engineering, LLC (U.S.), Halliburton (U.S.), SimuTech Group (U.S.), Simul8 Corporation (U.K.), ANSYS, Inc. (U.S.), MOSIMTEC, LLC (U.S.), Hexagon AB (Sweden) and TietoEVRY (Finland) |
|
Market Opportunities |
|
Market Definition
Oil and gas process simulation software is a tool that offers modeling and designing capabilities to oil & gas pipelines, oil & gas plants and other major equipment. These designing tools aid site engineers, project manager and site laborers to clearly understand the product and operation in a virtualized environment, which ultimately helps them in designing the plant, pipeline and other according to requirements. This software assist oil and gas companies to optimize total production cost and diminish the risk of error.
Oil and Gas Process Simulation Software Market
Drivers
- Increasing adoption of cloud-based solutions
Growing adoption of cloud-based solutions is expected to drive the growth rate of process simulation software in oil and gas market all over the globe. Cloud-based solutions aid oil and gas industries in increasing their plant infrastructure's uptime, life span, and reliability, which ultimately upsurges return on investment (ROI).
- Surging growth of software segment
Software segment is anticipated to dominate the market growth during the forecast period. Increasing application of process simulation software at oil and gas activities to proficiently design and analyze each process during production and exploration of oil and gas is a vital factor which is increasing the development of the oil and gas process simulation software market globally.
Opportunities
- Increasing investment in AR/ VR based 3D simulation tools/solution
Rising investment in AR and VR based 3D simulation tools or solution is one of the main factors that is expected to create new and ample opportunities for market growth during the forecast period. Oil and gas companies are anticipated to progressively use AR or VR to maintain and fix equipment at oil and gas facilities, train engineers and other staff. This will also help to visualize underground pipelines and assets professionally to avoid any breaks during digging.
Restraints
- Issues associated with oil and gas process simulation software
High initial investment related with oil and gas process simulation will be a major challenge for the market's growth. Moreover, Difficulties associated with the interpretation of simulated processes to real life operations will further generate limitations for the growth of the market.
This oil and gas process simulation software market report provides details of new recent developments, trade regulations, import-export analysis, production analysis, value chain optimization, market share, impact of domestic and localized market players, analyses opportunities in terms of emerging revenue pockets, changes in market regulations, strategic market growth analysis, market size, category market growths, application niches and dominance, product approvals, product launches, geographic expansions, technological innovations in the market. To gain more info on the oil and gas process simulation software market contact Data Bridge Market Research for an Analyst Brief, our team will help you take an informed market decision to achieve market growth.
COVID-19 Impact on Oil and Gas Process Simulation Software Market
Most industries all over the globe have been adversely impacted over the past few months. This can be attributed to major manufacturing and supply-chain disruptions due to numerous precautionary lockdowns and other restrictions imposed by governing authorities all over the globe. The same applies to the Oil and gas process simulation software market. Furthermore, consumer demand has also consequently decreased as individuals are now keener on removing non-essential expenses from their budgets because the normal economic status of most individuals has been adversely affected by this outbreak. These factors above are expected to burden the revenue trajectory of the market over the forecast timeline. However, the government authorities begin to lift these imposed lockdowns, the global oil and gas process simulation software market is expected to recover accordingly.
Global Oil and Gas Process Simulation Software Market Scope
The oil and gas process simulation software market is segmented on the basis component, operation type and application. The growth amongst these segments will help you analyze meagre growth segments in the industries and provide the users with a valuable market overview and market insights to help them make strategic decisions for identifying core market applications.
Component
- Software
- Cloud-based
- On-premise
- Services
- Consultancy
- Training
- Support
Operation Type
- Off-Shore
- On-Shore
- Heavy Oil
- Unconventional
Application
- Upstream
- Flow Assurance
- Fluid Properties
- Production Facilities
- Equipment Design and Analysis
- Gathering Systems
- Midstream
- Storage
- Pipeline Design and Analysis & Pipeline Equipment
- Pipeline Integrity
- Flow Dynamics
- Flow Assurance (Metering &Economics)
- Network Analysis & Optimization
- Oil and Gas Processing
- Oil and Gas Separation
- Sulfur Recovery
- Sweetening
- CO2 Freezing
- Liquefaction
- Dehydration
- Cryogenic Processes
- Refining
- Crude Oil Distillation
- Heavy Oil Processing
- Petrochemicals
- Green Engineering
- HSE Systems
- Flaring
Oil and Gas Process Simulation Software Market Regional Analysis/Insights
The oil and gas process simulation software market is analyzed and market size insights and trends are provided by country, component, operation type and application as referenced above.
The countries covered in the oil and gas process simulation software market report are U.S., Canada and Mexico in North America, Germany, France, U.K., Netherlands, Switzerland, Belgium, Russia, Italy, Spain, Turkey, Rest of Europe in Europe, China, Japan, India, South Korea, Singapore, Malaysia, Australia, Thailand, Indonesia, Philippines, Rest of Asia-Pacific (APAC) in the Asia-Pacific (APAC), Saudi Arabia, U.A.E, Israel, Egypt, South Africa, Rest of Middle East and Africa (MEA) as a part of Middle East and Africa (MEA), Brazil, Argentina and Rest of South America as part of South America.
North America dominates the oil and gas process simulation software market in terms of revenue and market share due to growing digitization and prevalence of advanced in this region.
Asia-Pacific will continue to project the highest compound annual growth rate during the forecast period of 2023-2030 due to augmented focus of the major market players to tap the market in this region.
The country section of the report also provides individual market impacting factors and changes in market regulation that impact the current and future trends of the market. Data points like down-stream and upstream value chain analysis, technical trends and porter's five forces analysis, case studies are some of the pointers used to forecast the market scenario for individual countries. Also, the presence and availability of Global brands and their challenges faced due to large or scarce competition from local and domestic brands, impact of domestic tariffs and trade routes are considered while providing forecast analysis of the country data.
Competitive Landscape and Oil and Gas Process Simulation Software Market Share Analysis
The oil and gas process simulation software market competitive landscape provides details by competitor. Details included are company overview, company financials, revenue generated, market potential, investment in research and development, new market initiatives, Global presence, production sites and facilities, production capacities, company strengths and weaknesses, product launch, product width and breadth, application dominance. The above data points provided are only related to the companies' focus related to oil and gas process simulation software market.
Some of the major players operating in the oil and gas process simulation software market are:
- AspenTech (U.S.)
- Honeywell International Inc. (U.S.)
- AVEVA Group plc (U.K.)
- Siemens (Netherlands)
- Chemstations Inc. (U.S.)
- GSE Solutions (U.S.)
- SLB (U.S.)
- ProSim (U.S.)
- Schneider Electric (France)
- Bryan Research & Engineering, LLC (U.S.)
- Halliburton (U.S.)
- SimuTech Group (U.S.)
- Simul8 Corporation (U.K.)
- ANSYS, Inc. (U.S.)
- MOSIMTEC, LLC (U.S.)
- Hexagon AB (Sweden)
- TietoEVRY (Finland)
SKU-

- Interactive Data Analysis Dashboard
- Company Analysis Dashboard for high growth potential opportunities
- Research Analyst Access for customization & queries
- Competitor Analysis with Interactive dashboard
- Latest News, Updates & Trend analysis
- Harness the Power of Benchmark Analysis for Comprehensive Competitor Tracking
Table of Content
1 INTRODUCTION
1.1 OBJECTIVES OF THE STUDY
1.2 MARKET DEFINITION
1.3 OVERVIEW OF GLOBAL OIL AND GAS PROCESS SIMULATION SOFTWARE MARKET
1.4 CURRENCY AND PRICING
1.5 IMPACT OF COVID-19 PANDEMIC ON THE MARKET
1.5.1 PRICE IMPACT
1.5.2 IMPACT ON DEMAND
1.5.3 IMPACT ON SUPPLY CHAIN
1.5.4 CONCLUSION
1.6 LIMITATION
1.7 MARKETS COVERED
2 MARKET SEGMENTATION
2.1 KEY TAKEAWAYS
2.2 ARRIVING AT THE GLOBAL OIL AND GAS PROCESS SIMULATION SOFTWARE MARKET
2.2.1 VENDOR POSITIONING GRID
2.2.2 TECHNOLOGY LIFE LINE CURVE
2.2.3 MARKET GUIDE
2.2.4 COMPANY POSITIONING GRID
2.2.5 COMAPANY MARKET SHARE ANALYSIS
2.2.6 MULTIVARIATE MODELLING
2.2.7 TOP TO BOTTOM ANALYSIS
2.2.8 STANDARDS OF MEASUREMENT
2.2.9 VENDOR SHARE ANALYSIS
2.2.10 DATA POINTS FROM KEY PRIMARY INTERVIEWS
2.2.11 DATA POINTS FROM KEY SECONDARY DATABASES
2.3 GLOBAL OIL AND GAS PROCESS SIMULATION SOFTWARE MARKET: RESEARCH SNAPSHOT
2.4 ASSUMPTIONS
3 MARKET OVERVIEW
3.1 DRIVERS
3.2 RESTRAINTS
3.3 OPPORTUNITIES
3.4 CHALLENGES
4 EXECUTIVE SUMMARY
5 PREMIUM INSIGHTS
5.1 PORTERS FIVE FORCES ANALYSIS
5.2 VALUE CHAIN ANALYSIS
5.3 REGULATORY FRAMEWORK
5.4 TECHNOLOGICAL TRENDS
5.5 COMPANY COMPARATIVE ANALYSIS
6 GLOBAL OIL AND GAS PROCESS SIMULATION SOFTWARE MARKET, BY OFFERING
6.1 OVERVIEW
6.2 SOFTWARE
6.2.1 FINITE ELEMENT ANALYSIS (FEA)
6.2.2 COMPUTIONAL FLUID DYNAMICS (CFD)
6.2.3 ELECTROMAGNETIC WAVES (EMW)
6.3 SERVICE
6.3.1 TRAINING & CONSULTING
6.3.2 SUPPORT & MAINTENANCE
6.3.3 IMPLMENTATION & INTERGRATION
7 GLOBAL OIL AND GAS PROCESS SIMULATION SOFTWARE MARKET, BY DEPLOYMENT TYPE
7.1 OVERVIEW
7.2 CLOUD
7.3 ON PREMISE
8 GLOBAL OIL AND GAS PROCESS SIMULATION SOFTWARE MARKET, BY SYSTEM TYPE
8.1 OVERVIEW
8.2 NEW TURBOMACHINERY CONTROL SYSTEM
8.3 RETROFIT TURBOMACHINERY CONTROL SYSTEM AND ANCILLARY SERVICES
9 GLOBAL OIL AND GAS PROCESS SIMULATION SOFTWARE MARKET, BY OPERATIONAL TYPE
9.1 OVERVIEW
9.2 OFF-SHORE
9.3 ON-SHORE
9.4 HEAVY OIL
9.5 UNCONVENTIONAL
10 GLOBAL OIL AND GAS PROCESS SIMULATION SOFTWARE MARKET, BY APPLICATION
10.1 OVERVIEW
10.2 TURBINE CONTROLS
10.3 STEAM TURBINE CONTROLS
10.4 GAS TURBINE CONTROLS
10.5 COMPRESSOR CONTROLS
10.6 GENERATOR CONTROLS
10.7 UPSTREAM
10.7.1 BY TYPE
10.7.1.1. FLOW ASSURANCE
10.7.1.2. FLUID PROPERTIES
10.7.1.3. PRODUCTION FACILITIES
10.7.1.4. EQUIPMENT DESIGN & ANALYSIS
10.7.1.5. GATHERING SYSTEMS
10.7.2 BY OFFERING
10.7.2.1. SOFTWARE
10.7.2.2. SERVICES
10.8 MIDSTREAM
10.8.1 BY TYPE
10.8.1.1. STORAGE
10.8.1.2. PIPELINE DESIGN AND ANALYSIS & PIPELINE EQUIPMENT
10.8.1.3. PIPELINE INTEGRITY
10.8.1.4. FLOW DYNAMICS
10.8.1.5. FLOW ASSURANCE (METERING & ECONOMICS)
10.8.1.6. NETWORK ANALYSIS & OPTIMIZATION
10.8.2 BY OFFERING
10.8.2.1. SOFTWARE
10.8.2.2. SERVICES
10.9 OIL & GAS PROCESSING
10.9.1 BY TYPE
10.9.1.1. OIL & GAS SEPARATION
10.9.1.2. SULFUR RECOVERY
10.9.1.3. SWEETENING
10.9.1.4. CO2 FREEZING
10.9.1.5. LIQUEFACTION
10.9.1.6. DEHYDRATION
10.9.2 BY OFFERING
10.9.2.1. SOFTWARE
10.9.2.2. SERVICES
10.1 CRYOGENIC PROCESSES
10.10.1 BY TYPE
10.10.1.1. CRUDE OIL DISTILLATION
10.10.1.2. HEAVY OIL PROCESSING
10.10.2 BY OFFERING
10.10.2.1. SOFTWARE
10.10.2.2. SERVICES
10.11 REFINING
10.11.1 BY OFFERING
10.11.1.1. SOFTWARE
10.11.1.2. SERVICES
10.12 GREEN ENGINEERING
10.12.1 BY TYPE
10.12.1.1. HSE SYSTEMS
10.12.1.2. FLARING`
10.12.2 BY OFFERING
10.12.2.1. SOFTWARE
10.12.2.2. SERVICES
10.13 OTHERS
11 GLOBAL OIL AND GAS PROCESS SIMULATION SOFTWARE MARKET, BY GEOGRAPHY
11.1 OVERVIEW
11.2 OIL AND GAS INDUSTRY
11.3 ENERGY AND POWER INDUSTRY
12 GLOBAL OIL AND GAS PROCESS SIMULATION SOFTWARE MARKET, BY GEOGRAPHY
12.1 GLOBAL OIL AND GAS PROCESS SIMULATION SOFTWARE MARKET, (ALL SEGMENTATION PROVIDED ABOVE IS REPRESENTED IN THIS CHAPTER BY COUNTRY)
12.1.1 NORTH AMERICA
12.1.1.1. U.S.
12.1.1.2. CANADA
12.1.1.3. MEXICO
12.1.2 EUROPE
12.1.2.1. GERMANY
12.1.2.2. FRANCE
12.1.2.3. U.K.
12.1.2.4. ITALY
12.1.2.5. SPAIN
12.1.2.6. RUSSIA
12.1.2.7. TURKEY
12.1.2.8. BELGIUM
12.1.2.9. NETHERLANDS
12.1.2.10. NORWAY
12.1.2.11. FINLAND
12.1.2.12. SWITZERLAND
12.1.2.13. DENMARK
12.1.2.14. SWEDEN
12.1.2.15. POLAND
12.1.2.16. REST OF EUROPE
12.1.3 ASIA PACIFIC
12.1.3.1. JAPAN
12.1.3.2. CHINA
12.1.3.3. SOUTH KOREA
12.1.3.4. INDIA
12.1.3.5. AUSTRALIA & NEW ZEALAND
12.1.3.6. SINGAPORE
12.1.3.7. THAILAND
12.1.3.8. MALAYSIA
12.1.3.9. INDONESIA
12.1.3.10. PHILIPPINES
12.1.3.11. TAIWAN
12.1.3.12. VIETNAM
12.1.3.13. REST OF ASIA PACIFIC
12.1.4 SOUTH AMERICA
12.1.4.1. BRAZIL
12.1.4.2. ARGENTINA
12.1.4.3. REST OF SOUTH AMERICA
12.1.5 MIDDLE EAST AND AFRICA
12.1.5.1. SOUTH AFRICA
12.1.5.2. EGYPT
12.1.5.3. SAUDI ARABIA
12.1.5.4. U.A.E
12.1.5.5. ISRAEL
12.1.5.6. OMAN
12.1.5.7. BAHRAIN
12.1.5.8. KUWAIT
12.1.5.9. QATAR
12.1.5.10. REST OF MIDDLE EAST AND AFRICA
12.1.6 KEY PRIMARY INSIGHTS: BY MAJOR COUNTRIES
13 GLOBAL OIL AND GAS PROCESS SIMULATION SOFTWARE MARKET,COMPANY LANDSCAPE
13.1 COMPANY SHARE ANALYSIS: GLOBAL
13.2 COMPANY SHARE ANALYSIS: NORTH AMERICA
13.3 COMPANY SHARE ANALYSIS: EUROPE
13.4 COMPANY SHARE ANALYSIS: ASIA PACIFIC
13.5 MERGERS & ACQUISITIONS
13.6 NEW PRODUCT DEVELOPMENT AND APPROVALS
13.7 EXPANSIONS
13.8 REGULATORY CHANGES
13.9 PARTNERSHIP AND OTHER STRATEGIC DEVELOPMENTS
14 GLOBAL OIL AND GAS PROCESS SIMULATION SOFTWARE MARKET , SWOT & DBMR ANALYSIS
15 GLOBAL OIL AND GAS PROCESS SIMULATION SOFTWARE MARKET, COMPANY PROFILE
15.1 AVEVA GROUP PLC
15.1.1 COMPANY SNAPSHOT
15.1.2 REVENUE ANALYSIS
15.1.3 GEOGRAPHIC PRESENCE
15.1.4 PRODUCT PORTFOLIO
15.1.5 RECENT DEVELOPMENTS
15.2 CHEMSTATIONS INC.
15.2.1 COMPANY SNAPSHOT
15.2.2 REVENUE ANALYSIS
15.2.3 GEOGRAPHIC PRESENCE
15.2.4 PRODUCT PORTFOLIO
15.2.5 RECENT DEVELOPMENTS
15.3 BRYAN RESEARCH & ENGINEERING, LLC
15.3.1 COMPANY SNAPSHOT
15.3.2 REVENUE ANALYSIS
15.3.3 GEOGRAPHIC PRESENCE
15.3.4 PRODUCT PORTFOLIO
15.3.5 RECENT DEVELOPMENTS
15.4 KBC
15.4.1 COMPANY SNAPSHOT
15.4.2 REVENUE ANALYSIS
15.4.3 GEOGRAPHIC PRESENCE
15.4.4 PRODUCT PORTFOLIO
15.4.5 RECENT DEVELOPMENTS
15.5 HONEYWELL INTERNATIONAL
15.5.1 COMPANY SNAPSHOT
15.5.2 REVENUE ANALYSIS
15.5.3 GEOGRAPHIC PRESENCE
15.5.4 PRODUCT PORTFOLIO
15.5.5 RECENT DEVELOPMENTS
15.6 ASPEN TECHNOLOGY, INC
15.6.1 COMPANY SNAPSHOT
15.6.2 REVENUE ANALYSIS
15.6.3 GEOGRAPHIC PRESENCE
15.6.4 PRODUCT PORTFOLIO
15.6.5 RECENT DEVELOPMENTS
15.7 KONGSBERG DIGITAL
15.7.1 COMPANY SNAPSHOT
15.7.2 GEOGRAPHIC PRESENCE
15.7.3 PRODUCT PORTFOLIO
15.7.4 RECENT DEVELOPMENTS
15.8 SCHNEIDER ELECTRIC
15.8.1 COMPANY SNAPSHOT
15.8.2 GEOGRAPHIC PRESENCE
15.8.3 PRODUCT PORTFOLIO
15.8.4 RECENT DEVELOPMENTS
15.9 PROCESS SYSTEMS ENTERPRISELIMITED
15.9.1 COMPANY SNAPSHOT
15.9.2 GEOGRAPHIC PRESENCE
15.9.3 PRODUCT PORTFOLIO
15.9.4 RECENT DEVELOPMENTS
15.1 GSE SYSTEMS, INC.
15.10.1 COMPANY SNAPSHOT
15.10.2 REVENUE ANALYSIS
15.10.3 GEOGRAPHIC PRESENCE
15.10.4 PRODUCT PORTFOLIO
15.10.5 RECENT DEVELOPMENTS
15.11 PROSIM
15.11.1 COMPANY SNAPSHOT
15.11.2 REVENUE ANALYSIS
15.11.3 GEOGRAPHIC PRESENCE
15.11.4 PRODUCT PORTFOLIO
15.11.5 RECENT DEVELOPMENTS
15.12 SCHLUMBERGER LIMITED
15.12.1 COMPANY SNAPSHOT
15.12.2 GEOGRAPHIC PRESENCE
15.12.3 PRODUCT PORTFOLIO
15.12.4 RECENT DEVELOPMENTS
15.13 TIETO
15.13.1 COMPANY SNAPSHOT
15.13.2 GEOGRAPHIC PRESENCE
15.13.3 PRODUCT PORTFOLIO
15.13.4 RECENT DEVELOPMENTS
15.14 ANSYS, INC.
15.14.1 COMPANY SNAPSHOT
15.14.2 GEOGRAPHIC PRESENCE
15.14.3 PRODUCT PORTFOLIO
15.14.4 RECENT DEVELOPMENTS
15.15 SIEMENS
15.15.1 COMPANY SNAPSHOT
15.15.2 REVENUE ANALYSIS
15.15.3 GEOGRAPHIC PRESENCE
15.15.4 PRODUCT PORTFOLIO
15.15.5 RECENT DEVELOPMENT
15.16 HEXAGON AB
15.16.1 COMPANY SNAPSHOT
15.16.2 GEOGRAPHIC PRESENCE
15.16.3 PRODUCT PORTFOLIO
15.16.4 RECENT DEVELOPMENTS
15.17 DASSAULT SYSTÈMES
15.17.1 COMPANY SNAPSHOT
15.17.2 GEOGRAPHIC PRESENCE
15.17.3 PRODUCT PORTFOLIO
15.17.4 RECENT DEVELOPMENTS
15.18 MOSIMTEC, LLC
15.18.1 COMPANY SNAPSHOT
15.18.2 GEOGRAPHIC PRESENCE
15.18.3 PRODUCT PORTFOLIO
15.18.4 RECENT DEVELOPMENTS
15.19 EQ-COMP
15.19.1 COMPANY SNAPSHOT
15.19.2 GEOGRAPHIC PRESENCE
15.19.3 PRODUCT PORTFOLIO
15.19.4 RECENT DEVELOPMENTS
15.2 THE ANYLOGIC COMPANY
15.20.1 COMPANY SNAPSHOT
15.20.2 GEOGRAPHIC PRESENCE
15.20.3 PRODUCT PORTFOLIO
15.20.4 RECENT DEVELOPMENTS
15.21 HALLIBURTON
15.21.1 COMPANY SNAPSHOT
15.21.2 GEOGRAPHIC PRESENCE
15.21.3 PRODUCT PORTFOLIO
15.21.4 RECENT DEVELOPMENTS
15.22 SIMUL8 CORPORATION
15.22.1 COMPANY SNAPSHOT
15.22.2 GEOGRAPHIC PRESENCE
15.22.3 PRODUCT PORTFOLIO
15.22.4 RECENT DEVELOPMENTS
15.23 SIMUTECH GROUP
15.23.1 COMPANY SNAPSHOT
15.23.2 GEOGRAPHIC PRESENCE
15.23.3 PRODUCT PORTFOLIO
15.23.4 RECENT DEVELOPMENTS
15.24 SLB
15.24.1 COMPANY SNAPSHOT
15.24.2 GEOGRAPHIC PRESENCE
15.24.3 PRODUCT PORTFOLIO
15.24.4 RECENT DEVELOPMENTS
NOTE: THE COMPANIES PROFILED IS NOT EXHAUSTIVE LIST AND IS AS PER OUR PREVIOUS CLIENT REQUIREMENT. WE PROFILE MORE THAN 100 COMPANIES IN OUR STUDY AND HENCE THE LIST OF COMPANIES CAN BE MODIFIED OR REPLACED ON REQUEST
16 CONCLUSION
17 RELATED REPORTS
18 ABOUT DATA BRIDGE MARKET RESEARCH
Data collection and base year analysis are done using data collection modules with large sample sizes. The stage includes obtaining market information or related data through various sources and strategies. It includes examining and planning all the data acquired from the past in advance. It likewise envelops the examination of information inconsistencies seen across different information sources. The market data is analysed and estimated using market statistical and coherent models. Also, market share analysis and key trend analysis are the major success factors in the market report. To know more, please request an analyst call or drop down your inquiry.
The key research methodology used by DBMR research team is data triangulation which involves data mining, analysis of the impact of data variables on the market and primary (industry expert) validation. Data models include Vendor Positioning Grid, Market Time Line Analysis, Market Overview and Guide, Company Positioning Grid, Patent Analysis, Pricing Analysis, Company Market Share Analysis, Standards of Measurement, Global versus Regional and Vendor Share Analysis. To know more about the research methodology, drop in an inquiry to speak to our industry experts.
Data Bridge Market Research is a leader in advanced formative research. We take pride in servicing our existing and new customers with data and analysis that match and suits their goal. The report can be customized to include price trend analysis of target brands understanding the market for additional countries (ask for the list of countries), clinical trial results data, literature review, refurbished market and product base analysis. Market analysis of target competitors can be analyzed from technology-based analysis to market portfolio strategies. We can add as many competitors that you require data about in the format and data style you are looking for. Our team of analysts can also provide you data in crude raw excel files pivot tables (Fact book) or can assist you in creating presentations from the data sets available in the report.


