Global Optical Emission Spectroscopy Oes Market
Market Size in USD Million
CAGR :
% 
 USD
883.58 Million
USD
1,496.73 Million
2025
2033
USD
883.58 Million
USD
1,496.73 Million
2025
2033
| 2026 –2033 | |
| USD 883.58 Million | |
| USD 1,496.73 Million | |
| % | |
|
What is the Global Optical Emission Spectroscopy (OES) Market Size and Growth Rate?
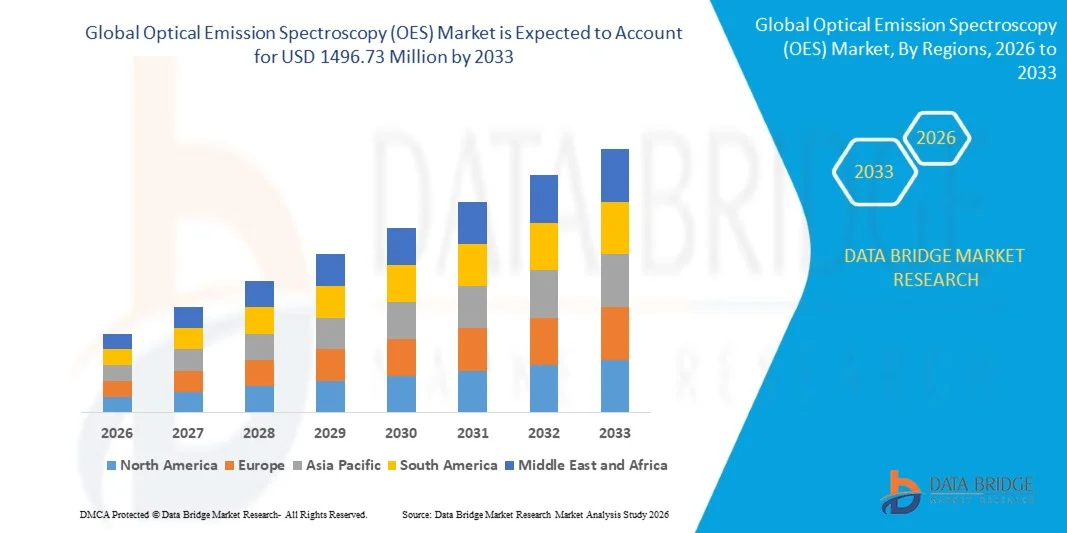
- The global optical emission spectroscopy (OES) market size was valued at USD 883.58 million in 2025 and is expected to reach USD 1496.73 million by 2033, at a CAGR of 6.81% during the forecast period
- Rising demand from the automotive and transportation industry will emerge as the major market growth driving factors. Stringent regulations imposed by the government on the pertaining to safety and quality control, surging technological developments in telecom sector coupled with the improvement in protocols pertaining to 4G and 5G networks, increasing product innovations, rising penetration of smartphones in the developing economies and widespread industrialization will further aggravate the market value
What are the Major Takeaways of Optical Emission Spectroscopy (OES) Market?
- Growing expenditure to undertake research and development proficiencies and surging inclination towards outsourcing analytical requirements to third-party service providers will further carve the way for the growth of the market
- However, high costs associated with the research and development proficiencies and with the initial investment will act as growth restraints for the market. Also, stringent regulatory framework in the developing economies and lack of standardization, skilled labour and technical requirements will further dampen the growth rate of the market
- Asia-Pacific dominated the optical emission spectroscopy (OES) market with a 41.3% revenue share in 2025, driven by rapid industrialization, strong metals and heavy machinery production, expanding automotive manufacturing, and increasing adoption of material testing technologies across China, Japan, India, and South Korea
- North America is projected to register the fastest CAGR of 9.34% from 2026 to 2033, driven by strong growth in industrial automation, aerospace, pharmaceuticals, environmental testing, and advanced materials research across the U.S. and Canada
- The Equipment segment dominated the market with a 71.4% share in 2025, as it remains the primary revenue contributor across industrial testing, quality control laboratories, and material analysis facilities
Report Scope and Optical Emission Spectroscopy (OES) Market Segmentation
|
Attributes |
Optical Emission Spectroscopy (OES) Key Market Insights |
|
Segments Covered |
|
|
Countries Covered |
North America
Europe
Asia-Pacific
Middle East and Africa
South America
|
|
Key Market Players |
|
|
Market Opportunities |
|
|
Value Added Data Infosets |
In addition to the insights on market scenarios such as market value, growth rate, segmentation, geographical coverage, and major players, the market reports curated by the Data Bridge Market Research also include in-depth expert analysis, pricing analysis, brand share analysis, consumer survey, demography analysis, supply chain analysis, value chain analysis, raw material/consumables overview, vendor selection criteria, PESTLE Analysis, Porter Analysis, and regulatory framework. |
What is the Key Trend in the Optical Emission Spectroscopy (OES) Market?
“Increasing Shift Toward High-Speed, Compact, and Automated OES Systems”
- The optical emission spectroscopy (OES) market is witnessing strong adoption of compact, portable, and high-throughput spectrometers designed to support rapid elemental analysis across metallurgy, environmental testing, pharmaceuticals, and industrial quality control
- Manufacturers are introducing AI-enabled, software-integrated, and cloud-connected OES systems that offer automated calibration, real-time data processing, and enhanced detector sensitivity for faster and more accurate results
- Growing demand for cost-efficient, lightweight, and field-deployable material testing equipment is driving usage across metal recycling units, automotive plants, aerospace labs, and research centers
- For instance, companies such as Thermo Fisher Scientific, HORIBA, Agilent Technologies, and Bruker are upgrading their OES portfolios with enhanced detector technologies, cloud-enabled analytics, and multi-element testing capabilities
- Increasing need for rapid metal verification, alloy identification, and real-time elemental composition analysis is accelerating the shift toward automated and portable OES systems
- As industrial quality standards become more stringent, OES systems will remain vital for fast testing, compliance monitoring, and advanced material characterization
What are the Key Drivers of Optical Emission Spectroscopy (OES) Market?
- Rising demand for fast, accurate, and easy-to-use elemental analysis systems to support material testing, alloy verification, and quality assurance across industrial sectors
- For instance, in 2025, leading companies such as Thermo Fisher Scientific, Agilent Technologies, and Shimadzu Corporation upgraded their OES platforms to support higher sensitivity, faster throughput, and automated workflows
- Growing adoption across automotive, aerospace, heavy machinery, recycling, and environmental testing industries is boosting demand across the U.S., Europe, and Asia-Pacific
- Advancements in solid-state detectors, excitation sources, and software-based calibration systems have strengthened performance, portability, and analytical efficiency
- Rising use in scrap metal sorting, emission monitoring, and pharmaceutical trace element analysis is creating demand for high-performance OES solutions
- Supported by steady investments in industrial automation, manufacturing quality control, and environmental compliance infrastructure, the OES market is expected to witness strong long-term growth
Which Factor is Challenging the Growth of the Optical Emission Spectroscopy (OES) Market?
- High costs associated with premium benchtop, ICP-OES, and multi-element automated spectrometers restrict adoption among small laboratories and SMEs
- For instance, during 2024–2025, fluctuations in detector component prices, semiconductor supply constraints, and rising maintenance costs increased device manufacturing expenses for several global vendors
- Complexity in analyzing multi-element samples, trace impurities, and high-volume industrial workflows increases the need for skilled operators and training
- Limited awareness in emerging markets regarding advanced OES capabilities, software integration, and regulatory compliance benefits slows adoption
- Competition from XRF systems, mass spectrometry solutions, and outsourced testing services creates pricing pressure and reduces product differentiation
- To address these issues, companies are focusing on cost-optimized designs, training resources, AI-driven calibration, and deeper software integration to increase global adoption of OES systems
How is the Optical Emission Spectroscopy (OES) Market Segmented?
The market is segmented on the basis of offering, form factor, excitation source type, detector type, and end user.
• By Offering
On the basis of offering, the Optical Emission Spectroscopy (OES) market is segmented into Equipment and Services. The Equipment segment dominated the market with a 71.4% share in 2025, as it remains the primary revenue contributor across industrial testing, quality control laboratories, and material analysis facilities. OES equipment, including benchtop and portable systems, is widely used for elemental composition analysis, alloy verification, contamination detection, and compliance testing. Growing demand from metallurgy, automotive, aerospace, and environmental testing industries continues to support strong adoption. The increasing integration of advanced detectors, automated calibration systems, and AI-based analytics further strengthens equipment demand.
The Services segment is expected to grow at the fastest CAGR from 2026 to 2033, driven by rising outsourcing of material testing, calibration, maintenance, software upgrades, and compliance certification services. Increasing adoption of annual service contracts and third-party laboratory testing is accelerating segment growth globally.
• By Form Factor
On the basis of form factor, the market is segmented into Benchtop and Portable. The Benchtop segment dominated the market with a 63.8% share in 2025, supported by its widespread use in laboratories, industrial plants, research institutions, and quality control centers. Benchtop OES systems offer higher precision, better detection limits, improved sample throughput, and advanced multi-element analysis capabilities, making them ideal for high-volume industrial workflows. Their extensive use in metal processing, pharmaceuticals, and environmental laboratories continues to drive dominance.
The Portable segment is projected to grow at the fastest CAGR from 2026 to 2033, driven by increasing demand for on-site testing, field-based alloy verification, scrap sorting, and real-time inspection applications. Rising adoption across construction, oil & gas, automotive maintenance, and recycling industries is significantly boosting segment expansion due to portability and faster decision-making capabilities.
• By Excitation Source Type
On the basis of excitation source type, the market is segmented into Arc/Spark Optical Emission Spectroscopy and Inductively Coupled Plasma Optical Emission Spectroscopy (ICP-OES). The Inductively Coupled Plasma Optical Emission Spectroscopy segment dominated the market with a 58.6% share in 2025, owing to its extensive use in trace element analysis, pharmaceutical testing, environmental monitoring, and chemical laboratories. ICP-OES systems offer high sensitivity, broad elemental coverage, and superior analytical accuracy, making them highly preferred across regulated industries.
The Arc/Spark Optical Emission Spectroscopy segment is expected to grow at the fastest CAGR from 2026 to 2033, driven by strong demand for rapid metal analysis, alloy verification, and industrial quality control in heavy machinery and manufacturing sectors. Increasing use in foundries, steel plants, and scrap recycling operations is accelerating segment growth.
• By Detector Type
On the basis of detector type, the OES market is segmented into Photomultiplier Tube (PMT), Solid State Detector (SSD), and Hybrid. The Solid State Detector (SSD) segment dominated the market with a 46.9% share in 2025, supported by advancements in CMOS and CCD detector technologies. SSD-based systems provide high-speed data acquisition, better stability, lower maintenance requirements, and enhanced spectral resolution, driving strong adoption across industrial and laboratory applications.
The Hybrid segment is expected to grow at the fastest CAGR from 2026 to 2033, driven by rising demand for high sensitivity combined with faster processing capabilities. Hybrid systems combine the benefits of PMT and SSD technologies, enabling improved precision, multi-element detection, and superior throughput for advanced research and industrial testing.
• By End User
On the basis of end user, the optical emission spectroscopy (OES) market is segmented into Oil and Gas, Metals and Heavy Machinery, Automotive, Scrap and Recycling, Aerospace and Defence, Chemicals, Infrastructure, Pharmaceuticals and Life Sciences, Power Generation, Food and Beverages, Environmental, and Others. The Metals and Heavy Machinery segment dominated the market with a 29.7% share in 2025, driven by extensive use in alloy testing, steel quality control, foundry operations, and raw material verification. OES systems are critical for ensuring material composition accuracy and compliance with industrial standards.
The Scrap and Recycling segment is projected to grow at the fastest CAGR from 2026 to 2033, driven by increasing global focus on metal recycling, circular economy initiatives, and real-time scrap sorting applications. Rising demand for rapid on-site alloy identification is accelerating adoption across recycling facilities worldwide.
Which Region Holds the Largest Share of the Optical Emission Spectroscopy (OES) Market?
- Asia-Pacific dominated the optical emission spectroscopy (OES) market with a 41.3% revenue share in 2025, driven by rapid industrialization, strong metals and heavy machinery production, expanding automotive manufacturing, and increasing adoption of material testing technologies across China, Japan, India, and South Korea. High-volume manufacturing activities in metallurgy, foundries, scrap recycling, and electronics continue to fuel demand for OES systems across industrial laboratories, quality control facilities, and research centres
- Leading companies in Asia-Pacific are introducing advanced benchtop and portable OES systems with higher detector sensitivity, faster calibration, and AI-enabled analytics, strengthening the region’s technological advantage. Continuous investments in infrastructure, automotive, and manufacturing quality control are driving long-term market expansion
- Strong industrial ecosystems, cost-efficient manufacturing capabilities, and sustained investment in metals testing and environmental compliance further reinforce regional market leadership
China Optical Emission Spectroscopy (OES) Market Insight
China is the largest contributor to Asia-Pacific due to massive investments in steel production, automotive manufacturing, heavy machinery, and electronics fabrication. Rising demand for alloy verification, raw material testing, and industrial quality control drives strong adoption of OES systems. Local manufacturing strength and competitive pricing further support domestic and export market growth.
Japan Optical Emission Spectroscopy (OES) Market Insight
Japan shows steady growth supported by advanced precision manufacturing, automotive engineering, aerospace components, and electronics production. Strong focus on high-quality analytical equipment and strict industrial compliance standards continues to drive adoption of premium OES systems. Increasing use in advanced R&D and specialty alloy testing reinforces long-term market expansion.
India Optical Emission Spectroscopy (OES) Market Insight
India is emerging as a major growth hub, driven by expanding metal fabrication, infrastructure projects, automotive manufacturing, and pharmaceutical testing laboratories. Growing demand for portable and benchtop OES systems in steel plants, foundries, and environmental labs continues to accelerate market penetration. Rising industrialization and quality control investments further support growth.
South Korea Optical Emission Spectroscopy (OES) Market Insight
South Korea contributes significantly due to strong demand from automotive components, electronics manufacturing, semiconductors, and industrial machinery sectors. Rapid development of high-performance materials and advanced manufacturing processes drives adoption of high-precision OES solutions. Technological innovation and strong industrial ecosystems support sustained market growth.
North America Optical Emission Spectroscopy (OES) Market
North America is projected to register the fastest CAGR of 9.34% from 2026 to 2033, driven by strong growth in industrial automation, aerospace, pharmaceuticals, environmental testing, and advanced materials research across the U.S. and Canada. Increasing use of OES systems for quality control, trace element analysis, and regulatory compliance continues to accelerate demand across laboratories and industrial testing centres.
U.S. Optical Emission Spectroscopy (OES) Market Insight
The U.S. is the largest contributor in North America, supported by strong adoption across aerospace, automotive, oil & gas, pharmaceutical, and environmental sectors. Increasing development of advanced materials, alloys, and compliance-driven testing workflows intensifies demand for OES systems. Presence of major analytical instrument manufacturers and robust R&D ecosystems further drives market growth.
Canada Optical Emission Spectroscopy (OES) Market Insight
Canada contributes significantly to regional growth, driven by expanding industrial laboratories, rising adoption in mining, heavy machinery, metals, and environmental monitoring applications. Government-supported research initiatives and strong quality assurance frameworks continue to strengthen market adoption across the country.
Which are the Top Companies in Optical Emission Spectroscopy (OES) Market?
The optical emission spectroscopy (OES) industry is primarily led by well-established companies, including:
- Thermo Fisher Scientific Inc. (U.S.)
- HORIBA, Ltd. (Japan)
- Hitachi High-Tech Corporation (Japan)
- Bruker (U.S.)
- Shimadzu Corporation (Japan)
- Ametek Inc. (U.S.)
- Skyray Instrument Inc. (China)
- Teledyne Leeman Labs (U.S.)
- PerkinElmer, Inc. (U.S.) (now part of Revvity)
- Agilent Technologies, Inc. (U.S.)
- Analytik Jena GmbH (Germany)
- Focused Photonics Inc. (China)
- GBC Scientific Equipment (Australia)
- G.N.R. s.r.l. (Italy)
- SGS SA (Switzerland)
- Bureau Veritas SA (France)
- Intertek Group plc (U.K.)
- TÜV SÜD (Germany)
- Element Materials Technology Ltd. (U.K.)
- TÜV Rheinland (Germany)
What are the Recent Developments in Global Optical Emission Spectroscopy (OES) Market?
- In June 2024, Bruker introduced the Q6 NEWTON benchtop spark optical emission spectroscopy (OES) system, designed for advanced alloy composition analysis in the metals industry. The instrument incorporates HighSense detection technology for improved sensitivity, SmartSpark source technology for ultra-stable plasma generation, and ArgonShield contamination protection, enabling high precision and operational reliability across industrial testing workflows. This launch is expected to strengthen Bruker’s presence in the metals testing segment and accelerate adoption of high-accuracy benchtop OES solutions
- In March 2024, SPECTRO Analytical Instruments launched the latest version of its SPECTROMAXx arc/spark optical emission spectrometry analyzer, one of the industry’s best-selling systems for material control analysis. The upgraded platform offers exceptional repeatability, reproducibility, and reliability, supporting consistent material verification across the supply chain and industrial production environments. This development is expected to enhance process quality assurance and reinforce the company’s leadership in industrial elemental analysis solutions
- In January 2024, Shimadzu Corporation launched the ICPMS-2040/2050 Series, featuring advanced mini-torch systems, redesigned collision/reaction cells, and high-performance quadrupole mass filters. These next-generation spectrometers deliver high-resolution and precise elemental analysis, improving laboratory efficiency and detection performance for research and industrial applications. This launch is expected to support growing demand for advanced spectroscopy solutions across pharmaceuticals, chemicals, and environmental testing
- In August 2021, HORIBA Scientific collaborated with Covalent Metrology to inaugurate the HORIBA Scientific North American Demonstration Lab at Covalent’s Silicon Valley headquarters. This strategic collaboration was aimed at expanding customer access to advanced spectroscopy demonstrations, application testing, and analytical service capabilities. This initiative is expected to strengthen regional customer engagement and accelerate innovation in spectroscopy-based material characterization
SKU-
Get online access to the report on the World's First Market Intelligence Cloud

- Interactive Data Analysis Dashboard
- Company Analysis Dashboard for high growth potential opportunities
- Research Analyst Access for customization & queries
- Competitor Analysis with Interactive dashboard
- Latest News, Updates & Trend analysis
- Harness the Power of Benchmark Analysis for Comprehensive Competitor Tracking
Global Optical Emission Spectroscopy Oes Market, Supply Chain Analysis and Ecosystem Framework
To support market growth and help clients navigate the impact of geopolitical shifts, DBMR has integrated in-depth supply chain analysis into its Global Optical Emission Spectroscopy Oes Market research reports. This addition empowers clients to respond effectively to global changes affecting their industries. The supply chain analysis section includes detailed insights such as Global Optical Emission Spectroscopy Oes Market consumption and production by country, price trend analysis, the impact of tariffs and geopolitical developments, and import and export trends by country and HSN code. It also highlights major suppliers with data on production capacity and company profiles, as well as key importers and exporters. In addition to research, DBMR offers specialized supply chain consulting services backed by over a decade of experience, providing solutions like supplier discovery, supplier risk assessment, price trend analysis, impact evaluation of inflation and trade route changes, and comprehensive market trend analysis.
Research Methodology
Data collection and base year analysis are done using data collection modules with large sample sizes. The stage includes obtaining market information or related data through various sources and strategies. It includes examining and planning all the data acquired from the past in advance. It likewise envelops the examination of information inconsistencies seen across different information sources. The market data is analysed and estimated using market statistical and coherent models. Also, market share analysis and key trend analysis are the major success factors in the market report. To know more, please request an analyst call or drop down your inquiry.
The key research methodology used by DBMR research team is data triangulation which involves data mining, analysis of the impact of data variables on the market and primary (industry expert) validation. Data models include Vendor Positioning Grid, Market Time Line Analysis, Market Overview and Guide, Company Positioning Grid, Patent Analysis, Pricing Analysis, Company Market Share Analysis, Standards of Measurement, Global versus Regional and Vendor Share Analysis. To know more about the research methodology, drop in an inquiry to speak to our industry experts.
Customization Available
Data Bridge Market Research is a leader in advanced formative research. We take pride in servicing our existing and new customers with data and analysis that match and suits their goal. The report can be customized to include price trend analysis of target brands understanding the market for additional countries (ask for the list of countries), clinical trial results data, literature review, refurbished market and product base analysis. Market analysis of target competitors can be analyzed from technology-based analysis to market portfolio strategies. We can add as many competitors that you require data about in the format and data style you are looking for. Our team of analysts can also provide you data in crude raw excel files pivot tables (Fact book) or can assist you in creating presentations from the data sets available in the report.


