
Global Vertical Farming Market
Market Size in USD Billion
 USD
4.60 Billion
USD
32.74 Billion
2022
2030
USD
4.60 Billion
USD
32.74 Billion
2022
2030
| 2023 - 2030 | |
| USD 4.60 Billion | |
| USD 32.74 Billion | |
| % | |
|
Vertical Farming Market Analysis and Size
Vertical farming is considered a highly sustainable and efficient way of producing food. For instance, Nordic Harvest uses 250 times less water than a traditional farm would require. Furthermore, vertical farming is less disruptive to native animals and plants because of its limited land usage, further protecting native wildlife and flora. As a result, the vertical farming market in North America and other regions, such as the Middle East, have higher record amounts. Venture capitalists, individual investors, governments, and financial institutions are among the sector's major investors today.
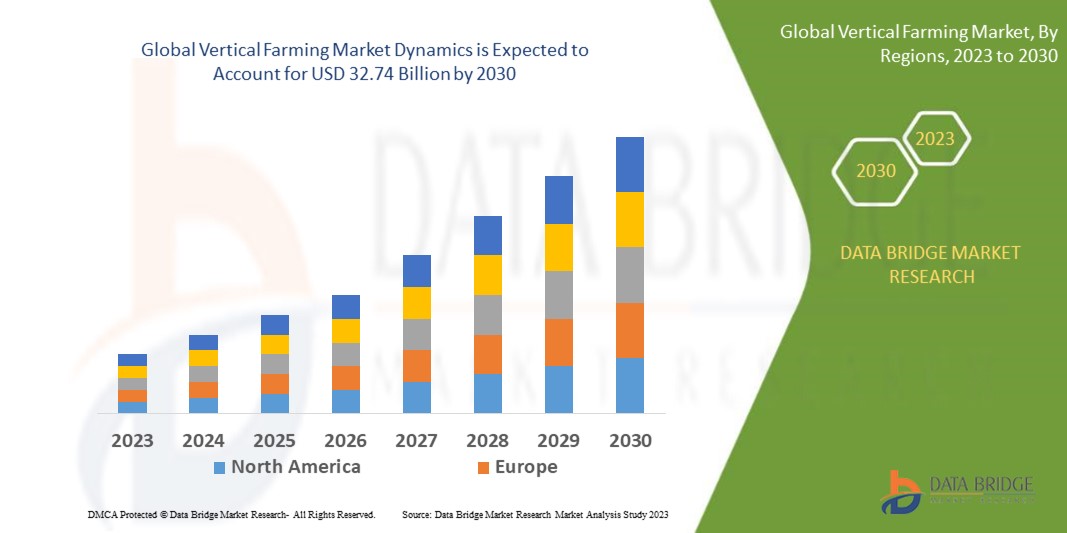
Data Bridge Market Research analyses that the vertical farming market is expected to reach USD 32.74 billion by 2030, which was USD 4.60 billion in 2022, registering a CAGR of 27.80% during the forecast period of 2023 to 2030. In addition to the insights on market scenarios such as market value, growth rate, segmentation, geographical coverage, and major players, the market reports curated by the Data Bridge Market Research also include in-depth expert analysis, geographically represented company-wise production and capacity, network layouts of distributors and partners, detailed and updated price trend analysis and deficit analysis of supply chain and demand.
Vertical Farming Market Scope and Segmentation
|
Report Metric |
Details |
|
Forecast Period |
2023 - 2030 |
|
Base Year |
2022 |
|
Historic Years |
2021 (Customizable to 2015 - 2020) |
|
Quantitative Units |
Revenue in USD Billion, Volumes in Units, Pricing in USD |
|
Segments Covered |
Growth Mechanism (Hydroponics, Aeroponics, Terraponics, Aquaponics), Structure (Shipping Containers, Building Based), Type (Biopesticides, Biofertilizer, Biostimulants), Crop Type (Leafy Green, Pollinated Plants, Nutraceutical Plant), Application (Indoor, Outdoor), Offering (Hardware, Software Services), Component (Lighting System, Irrigation and Fertigation System, Climate Control, Sensors, Building Material, HVAC Systems, Shelves and Racks, Others), Fruits, Vegetables and Herbs (Bell and Chili peppers, Strawberry, Tomato, Lettuce, Cucumber, Herbs, Leafy Greens (excluding lettuce), Others) |
|
Countries Covered |
U.S., Canada and Mexico in North America, Germany, France, U.K., Netherlands, Switzerland, Belgium, Russia, Italy, Spain, Turkey, Rest of Europe in Europe, China, Japan, India, South Korea, Singapore, Malaysia, Australia, Thailand, Indonesia, Philippines, Rest of Asia-Pacific (APAC) in the Asia-Pacific (APAC), Saudi Arabia, U.A.E, Israel, Egypt, South Africa, Rest of Middle East and Africa (MEA) as a part of Middle East and Africa (MEA), Brazil, Argentina and Rest of South America as part of South America |
|
Market Players Covered |
Deere and Company (U.S.), CropMetrics LLC (Netherlands), Trimble Navigation Limited (Australia), CropX (U.S.), AgSmarts Inc (India), AgSense, LLC (India), AGCO Corporation (Austria), DICKEY-john (U.K), Monsanto Company (Mexico), Ag Leader Technology (U.S.) Farmers Edge (U.S.), GEOSYS (U.S.), Granular (U.S.), Gro Intelligence (U.S.), Proagrica (U.K.), Fasal (India), AGEYE Technologies (U.S.), HelioPas AI (Germany), OneSoil (Belarus) |
|
Market Opportunities |
|
Market Definition
Vertical farming is the process of producing vegetables in layers that are mainly piled vertically. The technique may employ aeroponic, hydroponic, or soil-growing techniques. Vertical farms try to produce food in tough situations, such as those where arable land is unavailable or few. It is a technique for increasing food in water without using soil and mineral nutrition solutions. The main benefits of this process are that it minimizes soil-related cultivation problems such as illnesses, soil-borne pests, and insects.
Global Vertical Farming Market Dynamics
Drivers
- The increasing rate of population widens the market scope
As a result of the increasing rate of population, which has changed consumer preferences for more healthy, organic, and environmentally friendly foods, the vertical farming industry has been developing in various ways across the globe. This has created several chances for vertical farming businesses. The market for organic farming, which naturally inclines to produce vegetables and fruits without pesticides and insecticides, is extremely dependent on vertical farming. Therefore, the increasing rate of population is expected to drive market growth.
- Growing popularity of vertical farming due to its better yield than the conventional one
The increasing popularity of vertical farming due to its better yield than conventional one is likely to propel the market growth during the forecast period. This is because vertical agriculture uses climate control, which continuously modifies humidity and temperature, and LED lighting. As a result, vertical farming yields are higher than conventional farming. Vertical farming also provides significant output benefits. It has been witnessed that vertical farming may surge agricultural output by 240 times, using 99 percent less land, zero pesticides, and 95% less water. As a result of all these factors, the market growth during the forecast period is enhanced.
Opportunities
- Increasing adoption of advanced technology in vertical farming
With the increasing innovation in agricultural technology, the vertical farming industry is rising rapidly and attracting more individual and commercial attention. Numerous commercial growers are adopting these innovative and high capital expenditure technologies, such as advanced electronic traceability and hydroponic systems. Also, growers are investing in LEDs and other innovative lighting products in vertical farming to decrease their exposure to associated risks by careful monitoring. Hence, increasing adoption of advanced technology in vertical farming will help likely create lucrative market growth opportunities in upcoming years.
The increased demand for organic products among consumers, fueled by the improved standard of living and higher disposable income, paved the way for the development of vertical farming, wherein organic farming is practiced widely.
- Growing adoption of automation and digitization in vertical farming
The rising adoption of automation and digitization in vertical farming is expected to create ample opportunities for market growth in the projected period. Automation and digitization minimizes time, reduces environmental expenses, improves production and standardizes food quality. The Internet of things (IoT) has become the major technology in vertical farming, creating numerous market growth opportunities. The growth in the internet of things (IoT) has revolutionized the agriculture industry and boosted the market's growth.
Restraints/ Challenges
- Lack of practical knowledge
Lack of practical knowledge related to vertical farming among farmers is also a major factor expected to obstruct market growth. Lack of knowledge regarding using A.I.-based vertical farming among farmers is hampering the market growth. Artificial intelligence (A.I.) in vertical farming aids in managing the farmer's energy and create numerous opportunities to make farming more easy and sustainable.
- The high initial cost associated with vertical farming
The high initial cost of vertical farming will likely hinder market growth in the forecast period. Vertical farming is an expensive procedure because cost is a major factor in every step of this process, from locating the right facilities to choosing the best performing crops. Furthermore, the land prices alone significantly increase the upfront cost because land in the metropolitan areas is normally costly. Hence, these factors will obstruct market growth.
This vertical farming market report provides details of new recent developments, trade regulations, import-export analysis, production analysis, value chain optimization, market share, impact of domestic and localized market players, analyses opportunities in terms of emerging revenue pockets, changes in market regulations, strategic market growth analysis, market size, category market growths, application niches and dominance, product approvals, product launches, geographic expansions, technological innovations in the market. To gain more info on the vertical farming market contact Data Bridge Market Research for an Analyst Brief, our team will help you take an informed market decision to achieve market growth.
Impact and Current Market Scenario of Raw Material Shortage and Shipping Delays
Data Bridge Market Research offers a high-level analysis of the market and delivers information by keeping in account the impact and current market environment of raw material shortage and shipping delays. This translates into assessing strategic possibilities, creating effective action plans, and assisting businesses in making important decisions.
Apart from the standard report, we also offer in-depth analysis of the procurement level from forecasted shipping delays, distributor mapping by region, commodity analysis, production analysis, price mapping trends, sourcing, category performance analysis, supply chain risk management solutions, advanced benchmarking, and other services for procurement and strategic support.
Expected Impact of Economic Slowdown on the Pricing and Availability of Products
When economic activity slows, industries begin to suffer. The forecasted effects of the economic downturn on the pricing and accessibility of the products are taken into account in the market insight reports and intelligence services provided by DBMR. With this, our clients can typically keep one step ahead of their competitors, project their sales and revenue, and estimate their profit and loss expenditures.
Recent Development
- In 2022, Sky Urban Solutions Holding, which is the parent company of Sky Greens, announced signing an agreement with GEM, which is a Luxembourg-based private substitute investment group. This agreement offers Sky Urban a shared membership capacity of up to USD 50 million for 36 months.
- In 2022, AeroFarms decided to develop their business nationwide from the Northeast area to all whole food markets, particularly after seeing growing demand for their specialty green. AeroFarms will be the primary indoor farming company in the Whole Foods Market Global Planogram.
- In 2022, Singrow, a Singapore-headquartered agtech company, intended to develop across and beyond Asia and introduce its consumer concept brand Blooom. This company plans to surge its partner farm footprint to the Philippines, Hong Kong, Thailand, and the Middle East, beyond its present presence in Indonesia, China, and Singapore.
Global Vertical Farming Market Scope
The vertical farming market is segmented on the basis of growth mechanism, structure, type, application, offering, component and fruits, vegetables and herbs. The growth amongst these segments will help you analyze meagre growth segments in the industries and provide the users with a valuable market overview and market insights to help them make strategic decisions for identifying core market applications.
Growth Mechanism
- Hydroponics
- Aeroponics
- Terraponics
- Aquaponics
Structure
- Shipping Containers
- Building Based
Type
- Bio pesticides
- Bio fertilizer
- Bio stimulants
Crop Type
- Leafy Green
- Pollinated Plants
- Nutraceutical Plants
Application
- Indoor
- Outdoor
Offering
- Hardware
- Lighting
- Hydroponic
- Climate Control
- Sensors
- Software
- Services
Component
- Lighting System
- Irrigation and Fertigation System
- Climate Control
- Sensors
- Building Material
- HVAC systems
- Shelves and Racks
- Others
Fruits, Vegetables and Herbs
- Bell and Chili peppers
- Strawberry
- Tomato
- Lettuce
- Cucumber
- Herbs
- Leafy Greens (excluding lettuce)
- Others
Vertical Farming Market Regional Analysis/Insights
The vertical farming market is analyzed and market size insights and trends are provided by country, growth mechanism, structure, type, application, offering, component and fruits, vegetables and herbs as referenced above.
The countries covered in the vertical farming market report are U.S., Canada and Mexico in North America, Germany, France, U.K., Netherlands, Switzerland, Belgium, Russia, Italy, Spain, Turkey, Rest of Europe in Europe, China, Japan, India, South Korea, Singapore, Malaysia, Australia, Thailand, Indonesia, Philippines, Rest of Asia-Pacific (APAC) in the Asia-Pacific (APAC), Saudi Arabia, U.A.E, Israel, Egypt, South Africa, Rest of Middle East and Africa (MEA) as a part of Middle East and Africa (MEA), Brazil, Argentina and Rest of South America as part of South America.
Asia-Pacific dominates the vertical farming market because of increasing population levels and augmented food demand within the region. Furthermore, the availability of labor at reasonable wages and the prevalence of enormous farmland areas will further increase the growth of the vertical farming market.
Europe is anticipated to be the fastest-growing region in the vertical farming market during the forecast period of 2023-2030 because of increasing technological advancements in this region. Moreover, the growing adoption of robotics and nanotechnology for farming are some other factors that will further increase the market growth,
The country section of the report also provides individual market impacting factors and changes in market regulation that impact the current and future trends of the market. Data points like down-stream and upstream value chain analysis, technical trends and porter's five forces analysis, case studies are some of the pointers used to forecast the market scenario for individual countries. Also, the presence and availability of global brands and their challenges faced due to large or scarce competition from local and domestic brands, impact of domestic tariffs and trade routes are considered while providing forecast analysis of the country data.
Competitive Landscape and Vertical Farming Market Share Analysis
The vertical farming market competitive landscape provides details by competitor. Details included are company overview, company financials, revenue generated, market potential, investment in research and development, new market initiatives, global presence, production sites and facilities, production capacities, company strengths and weaknesses, product launch, product width and breadth, application dominance. The above data points provided are only related to the companies' focus related to vertical farming market.
Some of the major players operating in the vertical farming market are:
- Deere and Company (U.S.)
- CropMetrics LLC (Netherlands)
- Trimble Navigation Limited (Australia)
- CropX (U.S.)
- AgSmarts Inc (India)
- AgSense, LLC (India)
- AGCO Corporation (Austria)
- DICKEY-john (U.K.)
- Monsanto Company (Mexico)
- Ag Leader Technology (U.S.)
- Farmers Edge (U.S.)
- GEOSYS (U.S.)
- Granular (U.S.)
- Gro Intelligence (U.S.)
- Proagrica (U.K.)
- Fasal (India)
- AGEYE Technologies (U.S.)
- HelioPas AI (Germany)
- OneSoil (Belarus)
SKU-

- Interactive Data Analysis Dashboard
- Company Analysis Dashboard for high growth potential opportunities
- Research Analyst Access for customization & queries
- Competitor Analysis with Interactive dashboard
- Latest News, Updates & Trend analysis
- Harness the Power of Benchmark Analysis for Comprehensive Competitor Tracking
Table of Content
- introduction
- OBJECTIVES OF THE STUDY
- MARKET DEFINITION
- Currency and Pricing
- LIMITATIONS
- MARKETS COVERED
- MARKET SEGMENTATION
- MARKETS COVERED
- geographicAL scope
- years considered for the study
- DBMR TRIPOD DATA VALIDATION MODEL
- primary interviews with key opinion leaders
- DBMR MARKET POSITION GRID
- vendor share analysis
- Multivariate Modeling
- GROWTH MECHANISM timeline curve
- MARKET APPLICATION COVERAGE GRID
- secondary sourcEs
- assumptions
- EXECUTIVE SUMMARY
- premium insights
- market overview
- drivers
- INCREASING DEMAND FOR ORGANIC FOOD
- LIMITED LAND AVAILABILITY FOR TRADITIONAL AGRICULTURE
- GROWING CONCERNS REGARDING POLLUTION FREE ENVIRONMENT
- RISING ADOPTION OF ADVANCED TECHNOLOGIES FOR FOOD PRODUCTION
- RISING ADOPTION OF vertical farming for the production of cannabis
- RESTRAINTS
- HIGH INITIAL INVESTMENTS IN VERTICAL FARMING
- LIMITED VARIETY OF CROPS RESULTS IN ECONOMICAL FEASIBILITY
- HIGHER ENERGY CONSUMPTION OF LIGHT AND AIR CONDITIONING
- OPPoRTUNITIES
- INCREASING UTILIZATION OF IOT SENSORS IN CROP PRODUCTION
- GROWING PRODUCTION OF BIOPHARMACEUTICAL PRODUCTS
- GROWING ADOPTION OF LED LIGHTING
- CHALLENGES
- COMPLEXITY OF HORTICULTURE LIGHTING
- MAINTENANCE OF AIR CIRCULATION IN VERTICAL FARMING
- VERTICAL FARMING DONE ON LARGE SCALE utilizes more cost
- COVID-19 IMPACT ON GLOBAL VERTICAL FARMING MARKET
- ANALYSIS ON IMPACT OF COVID-19 ON THE MARKET
- AFTERMATH OF COVID-19
- STRATEGIC DECISIONS FOR COMPANIES AFTER COVID-19 TO GAIN COMPETITIVE MARKET SHARE
- IMPACT ON DEMAND
- IMPACT ON SUPPLY CHAIN
- CONCLUSION
- Global Vertical farming MARKET, BY Growth Mechanism
- overview
- hydroponics
- aeroponics
- aquaponics
- Global Vertical farming market, BY structure
- overview
- shipping containers
- building based
- Global Vertical farming market, BY type
- overview
- biopesticides
- microbials
- pheromones
- plant extracts
- biofertilizer
- nitrogen fixing
- phosphate-solubilizing
- potash-Mobilizing
- biostimulants
- dry
- liquid
- GLOBAL vertical farming MARKET, By crop type
- overview
- leafy green
- pollinated plants
- Nutraceutical Plant
- Global Vertical farming market, BY application
- overview
- indoor
- outdoor
- Global Vertical farming market, BY component
- overview
- lighting
- grow light
- grow ballast
- grow reflectors
- hydroponic component
- pump & irrigation
- Water Filtration
- Meters & Solutions
- others
- Climate control
- ventilation fans
- air purification/control
- sensors
- Co2 sensors
- temperature sensors
- Nutrient sensors
- Crop sensors
- ph sensors
- others
- Global vertical farming market, by geography
- overview
- North America vertical farming market
- U.S.
- CANADA
- mexico
- europe vertical farming market
- Germany
- u.k.
- france
- spain
- italy
- netherlands
- switzerland
- Russia
- Turkey
- Belgium
- Rest of Europe
- Asia-Pacific vertical farming market
- China
- Japan
- South Korea
- singapore
- australia
- india
- Thailand
- Indonesia
- Malaysia
- philippines
- Rest of Asia-Pacific
- South America vertical farming market
- Brazil
- Argentina
- rest of south america
- middle east and africa vertical farming market
- south africa
- saudi arabia
- u.a.e.
- egypt
- Israel
- Rest of middle east and africa
- GLOBAL Vertical Farming market: COMPANY landscape
- Company share analysis: Global
- company share analysis: north AMERICA
- company share analysis: europe
- Company share analysis: asia-pacific
- SWOT ANALYSIS
- COMPANY PROFILE
- Signify Holding
- COMPANY snapshot
- REVENUE ANALYSIS
- Company share analysis
- Brand PORTFOLIO
- recent DEVELOPMENTS
- osram gmbh
- COMPANY snapshot
- Revenue analysis
- Company share analysis
- product PORTFOLIO
- recent DEVELOPMENTS
- everlight
- COMPANY snapshot
- revenue analysis
- COMPANY SHARE ANALYSIS
- product PORTFOLIO
- recent DEVELOPMENT
- AeroFarms
- COMPANY snapshot
- technology PORTFOLIO
- recent DEVELOPMENTs
- AGM Services
- COMPANY snapshot
- PRODUCT PORTFOLIO
- recent DEVELOPMENT
- Agrilution
- COMPANY snapshot
- PRODUCT PORTFOLIO
- recent DEVELOPMENT
- Altius Farms
- COMPANY snapshot
- PRODUCT PORTFOLIO
- recent DEVELOPMENTs
- AmHydro
- COMPANY snapshot
- PRODUCT PORTFOLIO
- recent DEVELOPMENT
- BOWERY FARMING INC.
- COMPANY snapshot
- PRODUCT PORTFOLIO
- recent DEVELOPMENT
- CropOne
- COMPANY snapshot
- PRODUCT PORTFOLIO
- recent DEVELOPMENTS
- CubicFarm Systems Corp.
- COMPANY snapshot
- REVENUE ANALYSIS
- product PORTFOLIO
- recent DEVELOPMENTS
- Freight Farms, Inc.
- COMPANY snapshot
- PRODUCT PORTFOLIO
- recent DEVELOPMENT
- Gills N Claws Pte Ltd
- COMPANY snapshot
- PRODUCT PORTFOLIO
- recent DEVELOPMENT
- Green Sense Farms Holdings, Inc.
- COMPANY snapshot
- PRODUCT PORTFOLIO
- recent DEVELOPMENT
- heliospectra ab
- COMPANY snapshot
- Revenue Analysis
- product PORTFOLIO
- recent DEVELOPMENTS
- Infarm-Indoor Urban Farming GmbH
- COMPANY snapshot
- technology PORTFOLIO
- recent DEVELOPMENT
- PLENTY UNLIMITED INC.
- COMPANY snapshot
- product PORTFOLIO
- recent DEVELOPMENTs
- SANANBIO
- COMPANY snapshot
- PRODUCT PORTFOLIO
- recent DEVELOPMENTS
- Sky Greens
- COMPANY snapshot
- PRODUCT PORTFOLIO
- recent DEVELOPMENTs
- SPREAD Co., Ltd.
- COMPANY snapshot
- PRODUCT PORTFOLIO
- recent DEVELOPMENTs
- Triton Foodworks
- COMPANY snapshot
- PRODUCT PORTFOLIO
- recent DEVELOPMENT
- Urban Crop Solutions
- COMPANY snapshot
- solution PORTFOLIO
- recent DEVELOPMENT
- valoya
- COMPANY snapshot
- product PORTFOLIO
- recent DEVELOPMENTS
- zipgrow inc.
- COMPANY snapshot
- product PORTFOLIO
- recent DEVELOPMENT
- Jain Irrigation Systems Ltd
- COMPANY snapshot
- REVENUE ANALYSIS
- COMPANY SHARE ANALYSIS
- product PORTFOLIO
- recent DEVELOPMENT
- questionnaire
- related reports
List of Table
TABLE 1 Global Vertical farming Market, By growth mechanism 2019-2028 (USD Million)
TABLE 2 Global hydroponics Vertical farming Market, By Region,2019-2028, (USD Million)
TABLE 3 Global aeroponics Vertical farming Market, By Region,2019-2028, (USD Million)
TABLE 4 Global aquaponics Vertical farming Market, By Region,2019-2028, (USD Million)
TABLE 5 Global Vertical farming Market, By structure 2019-2028 (USD Million)
TABLE 6 Global shipping containers Vertical farming Market, By Region,2019-2028, (USD Million)
TABLE 7 Global building based Vertical farming Market, By Region,2019-2028, (USD Million)
TABLE 8 Global Vertical farming Market, By type 2019-2028 (USD Million)
TABLE 9 Global biopesticides Vertical farming Market, By Region,2019-2028, (USD Million)
TABLE 10 Global biopesticides in Vertical farming Market, By type 2019-2028 (USD Million)
TABLE 11 Global biofertilizer Vertical farming Market, By Region,2019-2028, (USD Million)
TABLE 12 Global biofertilizer in Vertical farming Market, By type 2019-2028 (USD Million)
TABLE 13 Global biostimulants Vertical farming Market, By Region,2019-2028, (USD Million)
TABLE 14 Global biostimulants in Vertical farming Market, By type 2019-2028 (USD Million)
TABLE 15 Global Vertical farming Market, By crop type 2019-2028 (USD Million)
TABLE 16 Global leafy green Vertical farming Market, By Region,2019-2028, (USD Million)
TABLE 17 Global pollinated plants Vertical farming Market, By Region,2019-2028, (USD Million)
TABLE 18 Global Nutraceutical Plant Vertical farming Market, By Region,2019-2028, (USD Million)
TABLE 19 Global Vertical farming Market, By application 2019-2028 (USD Million)
TABLE 20 Global indoor Vertical farming Market, By Region,2019-2028, (USD Million)
TABLE 21 Global outdoor Vertical farming Market, By Region,2019-2028, (USD Million)
TABLE 22 Global Vertical farming Market, By component 2019-2028 (USD Million)
TABLE 23 Global lighting Vertical farming Market, By Region,2019-2028, (USD Million)
TABLE 24 Global Lighting Vertical farming Market, By type 2019-2028 (USD Million)
TABLE 25 Global hydroponic component Vertical farming Market, By Region,2019-2028, (USD Million)
TABLE 26 Global hydroponic component Vertical farming Market, By type 2019-2028 (USD Million)
TABLE 27 Global CLIMATE CONTROL Vertical farming Market, By Region,2019-2028, (USD Million)
TABLE 28 Global climate control in Vertical farming Market, By type 2019-2028 (USD Million)
TABLE 29 Global Sensors Vertical farming Market, By Region,2019-2028, (USD Million)
TABLE 30 Global biostimulants in Vertical farming Market, By type 2019-2028 (USD Million)
TABLE 31 GLOBAL vertical FARMING MARKET, By Region, 2019-2028 (USD Million)
TABLE 32 North America vertical farming market, By Country, 2019-2028 (USD Million)
TABLE 33 North America Vertical farming Market, By growth mechanism 2019-2028 (USD Million)
TABLE 34 North America Vertical farming Market, By structure 2019-2028 (USD Million)
TABLE 35 North America Vertical farming Market, By type 2019-2028 (USD Million)
TABLE 36 North America biopesticides Vertical farming Market, By type 2019-2028 (USD Million)
TABLE 37 North America biofertilizer Vertical farming Market, By type 2019-2028 (USD Million)
TABLE 38 North America biostimulants Vertical farming Market, By type 2019-2028 (USD Million)
TABLE 39 North America Vertical farming Market, By crop type 2019-2028 (USD Million)
TABLE 40 North America Vertical farming Market, By Application 2019-2028 (USD Million)
TABLE 41 North America Vertical farming Market, By component 2019-2028 (USD Million)
TABLE 42 North America Lighting Vertical farming Market, By component 2019-2028 (USD Million)
TABLE 43 North America hydroponic component Vertical farming Market, By Component 2019-2028 (USD Million)
TABLE 44 North America Climate control Vertical farming Market, By Component 2019-2028 (USD Million)
TABLE 45 North America Sensors Vertical farming Market, By Component 2019-2028 (USD Million)
TABLE 46 U.S. Vertical farming Market, By growth mechanism 2019-2028 (USD Million)
TABLE 47 U.S. Vertical farming Market, By structure 2019-2028 (USD Million)
TABLE 48 U.S. Vertical farming Market, By type 2019-2028 (USD Million)
TABLE 49 U.S. biopesticides Vertical farming Market, By type 2019-2028 (USD Million)
TABLE 50 U.S. biofertilizer Vertical farming Market, By type 2019-2028 (USD Million)
TABLE 51 U.S. biostimulants Vertical farming Market, By type 2019-2028 (USD Million)
TABLE 52 U.S. Vertical farming Market, By crop type 2019-2028 (USD Million)
TABLE 53 U.S. Vertical farming Market, By Application 2019-2028 (USD Million)
TABLE 54 U.S. Vertical farming Market, By component 2019-2028 (USD Million)
TABLE 55 U.S. Lighting Vertical farming Market, By component 2019-2028 (USD Million)
TABLE 56 U.S. hydroponic component Vertical farming Market, By Component 2019-2028 (USD Million)
TABLE 57 U.S. Climate control Vertical farming Market, By Component 2019-2028 (USD Million)
TABLE 58 U.S. Sensors Vertical farming Market, By Component 2019-2028 (USD Million)
TABLE 59 CANADA Vertical farming Market, By growth mechanism 2019-2028 (USD Million)
TABLE 60 CANADA Vertical farming Market, By structure 2019-2028 (USD Million)
TABLE 61 CANADA Vertical farming Market, By type 2019-2028 (USD Million)
TABLE 62 CANADA biopesticides Vertical farming Market, By type 2019-2028 (USD Million)
TABLE 63 CANADA biofertilizer Vertical farming Market, By type 2019-2028 (USD Million)
TABLE 64 CANADA biostimulants Vertical farming Market, By type 2019-2028 (USD Million)
TABLE 65 CANADA Vertical farming Market, By crop type 2019-2028 (USD Million)
TABLE 66 CANADA Vertical farming Market, By Application 2019-2028 (USD Million)
TABLE 67 CANADA Vertical farming Market, By component 2019-2028 (USD Million)
TABLE 68 CANADA Lighting Vertical farming Market, By component 2019-2028 (USD Million)
TABLE 69 CANADA hydroponic component Vertical farming Market, By Component 2019-2028 (USD Million)
TABLE 70 CANADA Climate control Vertical farming Market, By Component 2019-2028 (USD Million)
TABLE 71 CANADA Sensors Vertical farming Market, By Component 2019-2028 (USD Million)
TABLE 72 MEXICO Vertical farming Market, By growth mechanism 2019-2028 (USD Million)
TABLE 73 MEXICO Vertical farming Market, By structure 2019-2028 (USD Million)
TABLE 74 MEXICO Vertical farming Market, By type 2019-2028 (USD Million)
TABLE 75 MEXICO biopesticides Vertical farming Market, By type 2019-2028 (USD Million)
TABLE 76 MEXICO biofertilizer Vertical farming Market, By type 2019-2028 (USD Million)
TABLE 77 MEXICO biostimulants Vertical farming Market, By type 2019-2028 (USD Million)
TABLE 78 MEXICO Vertical farming Market, By crop type 2019-2028 (USD Million)
TABLE 79 MEXICO Vertical farming Market, By Application 2019-2028 (USD Million)
TABLE 80 MEXICO Vertical farming Market, By component 2019-2028 (USD Million)
TABLE 81 MEXICO Lighting Vertical farming Market, By component 2019-2028 (USD Million)
TABLE 82 MEXICO hydroponic component Vertical farming Market, By Component 2019-2028 (USD Million)
TABLE 83 MEXICO Climate control Vertical farming Market, By Component 2019-2028 (USD Million)
TABLE 84 MEXICO Sensors Vertical farming Market, By Component 2019-2028 (USD Million)
TABLE 85 Europe vertical farming market, By Country, 2019-2028 (USD Million)
TABLE 86 EUROPE Vertical farming Market, By growth mechanism 2019-2028 (USD Million)
TABLE 87 EUROPE Vertical farming Market, By structure 2019-2028 (USD Million)
TABLE 88 EUROPE Vertical farming Market, By type 2019-2028 (USD Million)
TABLE 89 EUROPE biopesticides Vertical farming Market, By type 2019-2028 (USD Million)
TABLE 90 EUROPE biofertilizer Vertical farming Market, By type 2019-2028 (USD Million)
TABLE 91 EUROPE biostimulants Vertical farming Market, By type 2019-2028 (USD Million)
TABLE 92 EUROPE Vertical farming Market, By crop type 2019-2028 (USD Million)
TABLE 93 EUROPE Vertical farming Market, By Application 2019-2028 (USD Million)
TABLE 94 EUROPE Vertical farming Market, By component 2019-2028 (USD Million)
TABLE 95 EUROPE Lighting Vertical farming Market, By component 2019-2028 (USD Million)
TABLE 96 EUROPE hydroponic component Vertical farming Market, By Component 2019-2028 (USD Million)
TABLE 97 EUROPE Climate control Vertical farming Market, By Component 2019-2028 (USD Million)
TABLE 98 EUROPE Sensors Vertical farming Market, By Component 2019-2028 (USD Million)
TABLE 99 GERMANY Vertical farming Market, By growth mechanism 2019-2028 (USD Million)
TABLE 100 GERMANY Vertical farming Market, By structure 2019-2028 (USD Million)
TABLE 101 GERMANY Vertical farming Market, By type 2019-2028 (USD Million)
TABLE 102 GERMANY biopesticides Vertical farming Market, By type 2019-2028 (USD Million)
TABLE 103 GERMANY biofertilizer Vertical farming Market, By type 2019-2028 (USD Million)
TABLE 104 GERMANY biostimulants Vertical farming Market, By type 2019-2028 (USD Million)
TABLE 105 GERMANY Vertical farming Market, By crop type 2019-2028 (USD Million)
TABLE 106 GERMANY Vertical farming Market, By Application 2019-2028 (USD Million)
TABLE 107 GERMANY Vertical farming Market, By component 2019-2028 (USD Million)
TABLE 108 GERMANY Lighting Vertical farming Market, By component 2019-2028 (USD Million)
TABLE 109 GERMANY hydroponic component Vertical farming Market, By Component 2019-2028 (USD Million)
TABLE 110 GERMANY Climate control Vertical farming Market, By Component 2019-2028 (USD Million)
TABLE 111 GERMANY Sensors Vertical farming Market, By Component 2019-2028 (USD Million)
TABLE 112 U.K. Vertical farming Market, By growth mechanism 2019-2028 (USD Million)
TABLE 113 U.K. Vertical farming Market, By structure 2019-2028 (USD Million)
TABLE 114 U.K. Vertical farming Market, By type 2019-2028 (USD Million)
TABLE 115 U.K. biopesticides Vertical farming Market, By type 2019-2028 (USD Million)
TABLE 116 U.K. biofertilizer Vertical farming Market, By type 2019-2028 (USD Million)
TABLE 117 U.K. biostimulants Vertical farming Market, By type 2019-2028 (USD Million)
TABLE 118 U.K. Vertical farming Market, By crop type 2019-2028 (USD Million)
TABLE 119 U.K. Vertical farming Market, By Application 2019-2028 (USD Million)
TABLE 120 U.K. Vertical farming Market, By component 2019-2028 (USD Million)
TABLE 121 U.K. Lighting Vertical farming Market, By component 2019-2028 (USD Million)
TABLE 122 U.K. hydroponic component Vertical farming Market, By Component 2019-2028 (USD Million)
TABLE 123 U.K. Climate control Vertical farming Market, By Component 2019-2028 (USD Million)
TABLE 124 U.K. Sensors Vertical farming Market, By Component 2019-2028 (USD Million)
TABLE 125 FRANCE Vertical farming Market, By growth mechanism 2019-2028 (USD Million)
TABLE 126 FRANCE Vertical farming Market, By structure 2019-2028 (USD Million)
TABLE 127 FRANCE Vertical farming Market, By type 2019-2028 (USD Million)
TABLE 128 FRANCE biopesticides Vertical farming Market, By type 2019-2028 (USD Million)
TABLE 129 FRANCE biofertilizer Vertical farming Market, By type 2019-2028 (USD Million)
TABLE 130 FRANCE biostimulants Vertical farming Market, By type 2019-2028 (USD Million)
TABLE 131 FRANCE Vertical farming Market, By crop type 2019-2028 (USD Million)
TABLE 132 FRANCE Vertical farming Market, By Application 2019-2028 (USD Million)
TABLE 133 FRANCE Vertical farming Market, By component 2019-2028 (USD Million)
TABLE 134 FRANCE Lighting Vertical farming Market, By component 2019-2028 (USD Million)
TABLE 135 FRANCE hydroponic component Vertical farming Market, By Component 2019-2028 (USD Million)
TABLE 136 FRANCE Climate control Vertical farming Market, By Component 2019-2028 (USD Million)
TABLE 137 FRANCE Sensors Vertical farming Market, By Component 2019-2028 (USD Million)
TABLE 138 SPAIN Vertical farming Market, By growth mechanism 2019-2028 (USD Million)
TABLE 139 SPAIN Vertical farming Market, By structure 2019-2028 (USD Million)
TABLE 140 SPAIN Vertical farming Market, By type 2019-2028 (USD Million)
TABLE 141 SPAIN biopesticides Vertical farming Market, By type 2019-2028 (USD Million)
TABLE 142 SPAIN biofertilizer Vertical farming Market, By type 2019-2028 (USD Million)
TABLE 143 SPAIN biostimulants Vertical farming Market, By type 2019-2028 (USD Million)
TABLE 144 SPAIN Vertical farming Market, By crop type 2019-2028 (USD Million)
TABLE 145 SPAIN Vertical farming Market, By Application 2019-2028 (USD Million)
TABLE 146 SPAIN Vertical farming Market, By component 2019-2028 (USD Million)
TABLE 147 SPAIN Lighting Vertical farming Market, By component 2019-2028 (USD Million)
TABLE 148 SPAIN hydroponic component Vertical farming Market, By Component 2019-2028 (USD Million)
TABLE 149 SPAIN Climate control Vertical farming Market, By Component 2019-2028 (USD Million)
TABLE 150 SPAIN Sensors Vertical farming Market, By Component 2019-2028 (USD Million)
TABLE 151 ITALY Vertical farming Market, By growth mechanism 2019-2028 (USD Million)
TABLE 152 ITALY Vertical farming Market, By structure 2019-2028 (USD Million)
TABLE 153 ITALY Vertical farming Market, By type 2019-2028 (USD Million)
TABLE 154 ITALY biopesticides Vertical farming Market, By type 2019-2028 (USD Million)
TABLE 155 ITALY biofertilizer Vertical farming Market, By type 2019-2028 (USD Million)
TABLE 156 ITALY biostimulants Vertical farming Market, By type 2019-2028 (USD Million)
TABLE 157 ITALY Vertical farming Market, By crop type 2019-2028 (USD Million)
TABLE 158 ITALY Vertical farming Market, By Application 2019-2028 (USD Million)
TABLE 159 ITALY Vertical farming Market, By component 2019-2028 (USD Million)
TABLE 160 ITALY Lighting Vertical farming Market, By component 2019-2028 (USD Million)
TABLE 161 ITALY hydroponic component Vertical farming Market, By Component 2019-2028 (USD Million)
TABLE 162 ITALY Climate control Vertical farming Market, By Component 2019-2028 (USD Million)
TABLE 163 ITALY Sensors Vertical farming Market, By Component 2019-2028 (USD Million)
TABLE 164 NETHERLANDS Vertical farming Market, By growth mechanism 2019-2028 (USD Million)
TABLE 165 NETHERLANDS Vertical farming Market, By structure 2019-2028 (USD Million)
TABLE 166 NETHERLANDS Vertical farming Market, By type 2019-2028 (USD Million)
TABLE 167 NETHERLANDS biopesticides Vertical farming Market, By type 2019-2028 (USD Million)
TABLE 168 NETHERLANDS biofertilizer Vertical farming Market, By type 2019-2028 (USD Million)
TABLE 169 NETHERLANDS biostimulants Vertical farming Market, By type 2019-2028 (USD Million)
TABLE 170 NETHERLANDS Vertical farming Market, By crop type 2019-2028 (USD Million)
TABLE 171 NETHERLANDS Vertical farming Market, By Application 2019-2028 (USD Million)
TABLE 172 NETHERLANDS Vertical farming Market, By component 2019-2028 (USD Million)
TABLE 173 NETHERLANDS Lighting Vertical farming Market, By component 2019-2028 (USD Million)
TABLE 174 NETHERLANDS hydroponic component Vertical farming Market, By Component 2019-2028 (USD Million)
TABLE 175 NETHERLANDS Climate control Vertical farming Market, By Component 2019-2028 (USD Million)
TABLE 176 NETHERLANDS Sensors Vertical farming Market, By Component 2019-2028 (USD Million)
TABLE 177 SWITZERLAND Vertical farming Market, By growth mechanism 2019-2028 (USD Million)
TABLE 178 SWITZERLAND Vertical farming Market, By structure 2019-2028 (USD Million)
TABLE 179 SWITZERLAND Vertical farming Market, By type 2019-2028 (USD Million)
TABLE 180 SWITZERLAND biopesticides Vertical farming Market, By type 2019-2028 (USD Million)
TABLE 181 SWITZERLAND biofertilizer Vertical farming Market, By type 2019-2028 (USD Million)
TABLE 182 SWITZERLAND biostimulants Vertical farming Market, By type 2019-2028 (USD Million)
TABLE 183 SWITZERLAND Vertical farming Market, By crop type 2019-2028 (USD Million)
TABLE 184 SWITZERLAND Vertical farming Market, By Application 2019-2028 (USD Million)
TABLE 185 SWITZERLAND Vertical farming Market, By component 2019-2028 (USD Million)
TABLE 186 SWITZERLAND Lighting Vertical farming Market, By component 2019-2028 (USD Million)
TABLE 187 SWITZERLAND hydroponic component Vertical farming Market, By Component 2019-2028 (USD Million)
TABLE 188 SWITZERLAND Climate control Vertical farming Market, By Component 2019-2028 (USD Million)
TABLE 189 SWITZERLAND Sensors Vertical farming Market, By Component 2019-2028 (USD Million)
TABLE 190 RUSSIA Vertical farming Market, By growth mechanism 2019-2028 (USD Million)
TABLE 191 RUSSIA Vertical farming Market, By structure 2019-2028 (USD Million)
TABLE 192 RUSSIA Vertical farming Market, By type 2019-2028 (USD Million)
TABLE 193 RUSSIA biopesticides Vertical farming Market, By type 2019-2028 (USD Million)
TABLE 194 RUSSIA biofertilizer Vertical farming Market, By type 2019-2028 (USD Million)
TABLE 195 RUSSIA biostimulants Vertical farming Market, By type 2019-2028 (USD Million)
TABLE 196 RUSSIA Vertical farming Market, By crop type 2019-2028 (USD Million)
TABLE 197 RUSSIA Vertical farming Market, By Application 2019-2028 (USD Million)
TABLE 198 RUSSIA Vertical farming Market, By component 2019-2028 (USD Million)
TABLE 199 RUSSIA Lighting Vertical farming Market, By component 2019-2028 (USD Million)
TABLE 200 RUSSIA hydroponic component Vertical farming Market, By Component 2019-2028 (USD Million)
TABLE 201 RUSSIA Climate control Vertical farming Market, By Component 2019-2028 (USD Million)
TABLE 202 RUSSIA Sensors Vertical farming Market, By Component 2019-2028 (USD Million)
TABLE 203 TURKEY Vertical farming Market, By growth mechanism 2019-2028 (USD Million)
TABLE 204 TURKEY Vertical farming Market, By structure 2019-2028 (USD Million)
TABLE 205 TURKEY Vertical farming Market, By type 2019-2028 (USD Million)
TABLE 206 TURKEY biopesticides Vertical farming Market, By type 2019-2028 (USD Million)
TABLE 207 TURKEY biofertilizer Vertical farming Market, By type 2019-2028 (USD Million)
TABLE 208 TURKEY biostimulants Vertical farming Market, By type 2019-2028 (USD Million)
TABLE 209 TURKEY Vertical farming Market, By crop type 2019-2028 (USD Million)
TABLE 210 TURKEY Vertical farming Market, By Application 2019-2028 (USD Million)
TABLE 211 TURKEY Vertical farming Market, By component 2019-2028 (USD Million)
TABLE 212 TURKEY Lighting Vertical farming Market, By component 2019-2028 (USD Million)
TABLE 213 TURKEY hydroponic component Vertical farming Market, By Component 2019-2028 (USD Million)
TABLE 214 TURKEY Climate control Vertical farming Market, By Component 2019-2028 (USD Million)
TABLE 215 TURKEY Sensors Vertical farming Market, By Component 2019-2028 (USD Million)
TABLE 216 BELGIUM Vertical farming Market, By growth mechanism 2019-2028 (USD Million)
TABLE 217 BELGIUM Vertical farming Market, By structure 2019-2028 (USD Million)
TABLE 218 BELGIUM Vertical farming Market, By type 2019-2028 (USD Million)
TABLE 219 BELGIUM biopesticides Vertical farming Market, By type 2019-2028 (USD Million)
TABLE 220 BELGIUM biofertilizer Vertical farming Market, By type 2019-2028 (USD Million)
TABLE 221 BELGIUM biostimulants Vertical farming Market, By type 2019-2028 (USD Million)
TABLE 222 BELGIUM Vertical farming Market, By crop type 2019-2028 (USD Million)
TABLE 223 BELGIUM Vertical farming Market, By Application 2019-2028 (USD Million)
TABLE 224 BELGIUM Vertical farming Market, By component 2019-2028 (USD Million)
TABLE 225 BELGIUM Lighting Vertical farming Market, By component 2019-2028 (USD Million)
TABLE 226 BELGIUM hydroponic component Vertical farming Market, By Component 2019-2028 (USD Million)
TABLE 227 BELGIUM Climate control Vertical farming Market, By Component 2019-2028 (USD Million)
TABLE 228 BELGIUM Sensors Vertical farming Market, By Component 2019-2028 (USD Million)
TABLE 229 Rest of EUROPE Vertical farming Market, By growth mechanism 2019-2028 (USD Million)
TABLE 230 Asia-Pacific vertical farming market, By Country, 2019-2028 (USD Million)
TABLE 231 ASIA-PACIFIC Vertical farming Market, By growth mechanism 2019-2028 (USD Million)
TABLE 232 ASIA-PACIFIC Vertical farming Market, By structure 2019-2028 (USD Million)
TABLE 233 ASIA-PACIFIC Vertical farming Market, By type 2019-2028 (USD Million)
TABLE 234 ASIA-PACIFIC biopesticides Vertical farming Market, By type 2019-2028 (USD Million)
TABLE 235 ASIA-PACIFIC biofertilizer Vertical farming Market, By type 2019-2028 (USD Million)
TABLE 236 ASIA-PACIFIC biostimulants Vertical farming Market, By type 2019-2028 (USD Million)
TABLE 237 ASIA-PACIFIC Vertical farming Market, By crop type 2019-2028 (USD Million)
TABLE 238 ASIA-PACIFIC Vertical farming Market, By Application 2019-2028 (USD Million)
TABLE 239 ASIA-PACIFIC Vertical farming Market, By component 2019-2028 (USD Million)
TABLE 240 ASIA-PACIFIC Lighting Vertical farming Market, By component 2019-2028 (USD Million)
TABLE 241 ASIA-PACIFIC hydroponic component Vertical farming Market, By Component 2019-2028 (USD Million)
TABLE 242 ASIA-PACIFIC Climate control Vertical farming Market, By Component 2019-2028 (USD Million)
TABLE 243 ASIA-PACIFIC Sensors Vertical farming Market, By Component 2019-2028 (USD Million)
TABLE 244 CHINA Vertical farming Market, By growth mechanism 2019-2028 (USD Million)
TABLE 245 CHINA Vertical farming Market, By structure 2019-2028 (USD Million)
TABLE 246 CHINA Vertical farming Market, By type 2019-2028 (USD Million)
TABLE 247 CHINA biopesticides Vertical farming Market, By type 2019-2028 (USD Million)
TABLE 248 CHINA biofertilizer Vertical farming Market, By type 2019-2028 (USD Million)
TABLE 249 CHINA biostimulants Vertical farming Market, By type 2019-2028 (USD Million)
TABLE 250 CHINA Vertical farming Market, By crop type 2019-2028 (USD Million)
TABLE 251 CHINA Vertical farming Market, By Application 2019-2028 (USD Million)
TABLE 252 CHINA Vertical farming Market, By component 2019-2028 (USD Million)
TABLE 253 CHINA Lighting Vertical farming Market, By component 2019-2028 (USD Million)
TABLE 254 CHINA hydroponic component Vertical farming Market, By Component 2019-2028 (USD Million)
TABLE 255 CHINA Climate control Vertical farming Market, By Component 2019-2028 (USD Million)
TABLE 256 CHINA Sensors Vertical farming Market, By Component 2019-2028 (USD Million)
TABLE 257 JAPAN Vertical farming Market, By growth mechanism 2019-2028 (USD Million)
TABLE 258 JAPAN Vertical farming Market, By structure 2019-2028 (USD Million)
TABLE 259 JAPAN Vertical farming Market, By type 2019-2028 (USD Million)
TABLE 260 JAPAN biopesticides Vertical farming Market, By type 2019-2028 (USD Million)
TABLE 261 JAPAN biofertilizer Vertical farming Market, By type 2019-2028 (USD Million)
TABLE 262 JAPAN biostimulants Vertical farming Market, By type 2019-2028 (USD Million)
TABLE 263 JAPAN Vertical farming Market, By crop type 2019-2028 (USD Million)
TABLE 264 JAPAN Vertical farming Market, By Application 2019-2028 (USD Million)
TABLE 265 JAPAN Vertical farming Market, By component 2019-2028 (USD Million)
TABLE 266 JAPAN Lighting Vertical farming Market, By component 2019-2028 (USD Million)
TABLE 267 JAPAN hydroponic component Vertical farming Market, By Component 2019-2028 (USD Million)
TABLE 268 JAPAN Climate control Vertical farming Market, By Component 2019-2028 (USD Million)
TABLE 269 JAPAN Sensors Vertical farming Market, By Component 2019-2028 (USD Million)
TABLE 270 SOUTH KOREA Vertical farming Market, By growth mechanism 2019-2028 (USD Million)
TABLE 271 SOUTH KOREA Vertical farming Market, By structure 2019-2028 (USD Million)
TABLE 272 SOUTH KOREA Vertical farming Market, By type 2019-2028 (USD Million)
TABLE 273 SOUTH KOREA biopesticides Vertical farming Market, By type 2019-2028 (USD Million)
TABLE 274 SOUTH KOREA biofertilizer Vertical farming Market, By type 2019-2028 (USD Million)
TABLE 275 SOUTH KOREA biostimulants Vertical farming Market, By type 2019-2028 (USD Million)
TABLE 276 SOUTH KOREA Vertical farming Market, By crop type 2019-2028 (USD Million)
TABLE 277 SOUTH KOREA Vertical farming Market, By Application 2019-2028 (USD Million)
TABLE 278 SOUTH KOREA Vertical farming Market, By component 2019-2028 (USD Million)
TABLE 279 SOUTH KOREA Lighting Vertical farming Market, By component 2019-2028 (USD Million)
TABLE 280 SOUTH KOREA hydroponic component Vertical farming Market, By Component 2019-2028 (USD Million)
TABLE 281 SOUTH KOREA Climate control Vertical farming Market, By Component 2019-2028 (USD Million)
TABLE 282 SOUTH KOREA Sensors Vertical farming Market, By Component 2019-2028 (USD Million)
TABLE 283 SINGAPORE Vertical farming Market, By growth mechanism 2019-2028 (USD Million)
TABLE 284 SINGAPORE Vertical farming Market, By structure 2019-2028 (USD Million)
TABLE 285 SINGAPORE Vertical farming Market, By type 2019-2028 (USD Million)
TABLE 286 SINGAPORE biopesticides Vertical farming Market, By type 2019-2028 (USD Million)
TABLE 287 SINGAPORE biofertilizer Vertical farming Market, By type 2019-2028 (USD Million)
TABLE 288 SINGAPORE biostimulants Vertical farming Market, By type 2019-2028 (USD Million)
TABLE 289 SINGAPORE Vertical farming Market, By crop type 2019-2028 (USD Million)
TABLE 290 SINGAPORE Vertical farming Market, By Application 2019-2028 (USD Million)
TABLE 291 SINGAPORE Vertical farming Market, By component 2019-2028 (USD Million)
TABLE 292 SINGAPORE Lighting Vertical farming Market, By component 2019-2028 (USD Million)
TABLE 293 SINGAPORE hydroponic component Vertical farming Market, By Component 2019-2028 (USD Million)
TABLE 294 SINGAPORE Climate control Vertical farming Market, By Component 2019-2028 (USD Million)
TABLE 295 SINGAPORE Sensors Vertical farming Market, By Component 2019-2028 (USD Million)
TABLE 296 AUSTRALIA Vertical farming Market, By growth mechanism 2019-2028 (USD Million)
TABLE 297 AUSTRALIA Vertical farming Market, By structure 2019-2028 (USD Million)
TABLE 298 AUSTRALIA Vertical farming Market, By type 2019-2028 (USD Million)
TABLE 299 AUSTRALIA biopesticides Vertical farming Market, By type 2019-2028 (USD Million)
TABLE 300 AUSTRALIA biofertilizer Vertical farming Market, By type 2019-2028 (USD Million)
TABLE 301 AUSTRALIA biostimulants Vertical farming Market, By type 2019-2028 (USD Million)
TABLE 302 AUSTRALIA Vertical farming Market, By crop type 2019-2028 (USD Million)
TABLE 303 AUSTRALIA Vertical farming Market, By Application 2019-2028 (USD Million)
TABLE 304 AUSTRALIA Vertical farming Market, By component 2019-2028 (USD Million)
TABLE 305 AUSTRALIA Lighting Vertical farming Market, By component 2019-2028 (USD Million)
TABLE 306 AUSTRALIA hydroponic component Vertical farming Market, By Component 2019-2028 (USD Million)
TABLE 307 AUSTRALIA Climate control Vertical farming Market, By Component 2019-2028 (USD Million)
TABLE 308 AUSTRALIA Sensors Vertical farming Market, By Component 2019-2028 (USD Million)
TABLE 309 INDIA Vertical farming Market, By growth mechanism 2019-2028 (USD Million)
TABLE 310 INDIA Vertical farming Market, By structure 2019-2028 (USD Million)
TABLE 311 INDIA Vertical farming Market, By type 2019-2028 (USD Million)
TABLE 312 INDIA biopesticides Vertical farming Market, By type 2019-2028 (USD Million)
TABLE 313 INDIA biofertilizer Vertical farming Market, By type 2019-2028 (USD Million)
TABLE 314 INDIA biostimulants Vertical farming Market, By type 2019-2028 (USD Million)
TABLE 315 INDIA Vertical farming Market, By crop type 2019-2028 (USD Million)
TABLE 316 INDIA Vertical farming Market, By Application 2019-2028 (USD Million)
TABLE 317 INDIA Vertical farming Market, By component 2019-2028 (USD Million)
TABLE 318 INDIA Lighting Vertical farming Market, By component 2019-2028 (USD Million)
TABLE 319 INDIA hydroponic component Vertical farming Market, By Component 2019-2028 (USD Million)
TABLE 320 INDIA Climate control Vertical farming Market, By Component 2019-2028 (USD Million)
TABLE 321 INDIA Sensors Vertical farming Market, By Component 2019-2028 (USD Million)
TABLE 322 THAILAND Vertical farming Market, By growth mechanism 2019-2028 (USD Million)
TABLE 323 THAILAND Vertical farming Market, By structure 2019-2028 (USD Million)
TABLE 324 THAILAND Vertical farming Market, By type 2019-2028 (USD Million)
TABLE 325 THAILAND biopesticides Vertical farming Market, By type 2019-2028 (USD Million)
TABLE 326 THAILAND biofertilizer Vertical farming Market, By type 2019-2028 (USD Million)
TABLE 327 THAILAND biostimulants Vertical farming Market, By type 2019-2028 (USD Million)
TABLE 328 THAILAND Vertical farming Market, By crop type 2019-2028 (USD Million)
TABLE 329 THAILAND Vertical farming Market, By Application 2019-2028 (USD Million)
TABLE 330 THAILAND Vertical farming Market, By component 2019-2028 (USD Million)
TABLE 331 THAILAND Lighting Vertical farming Market, By component 2019-2028 (USD Million)
TABLE 332 THAILAND hydroponic component Vertical farming Market, By Component 2019-2028 (USD Million)
TABLE 333 THAILAND Climate control Vertical farming Market, By Component 2019-2028 (USD Million)
TABLE 334 THAILAND Sensors Vertical farming Market, By Component 2019-2028 (USD Million)
TABLE 335 INDONESIA Vertical farming Market, By growth mechanism 2019-2028 (USD Million)
TABLE 336 INDONESIA Vertical farming Market, By structure 2019-2028 (USD Million)
TABLE 337 INDONESIA Vertical farming Market, By type 2019-2028 (USD Million)
TABLE 338 INDONESIA biopesticides Vertical farming Market, By type 2019-2028 (USD Million)
TABLE 339 INDONESIA biofertilizer Vertical farming Market, By type 2019-2028 (USD Million)
TABLE 340 INDONESIA biostimulants Vertical farming Market, By type 2019-2028 (USD Million)
TABLE 341 INDONESIA Vertical farming Market, By crop type 2019-2028 (USD Million)
TABLE 342 INDONESIA Vertical farming Market, By Application 2019-2028 (USD Million)
TABLE 343 INDONESIA Vertical farming Market, By component 2019-2028 (USD Million)
TABLE 344 INDONESIA Lighting Vertical farming Market, By component 2019-2028 (USD Million)
TABLE 345 INDONESIA hydroponic component Vertical farming Market, By Component 2019-2028 (USD Million)
TABLE 346 INDONESIA Climate control Vertical farming Market, By Component 2019-2028 (USD Million)
TABLE 347 INDONESIA Sensors Vertical farming Market, By Component 2019-2028 (USD Million)
TABLE 348 MALAYSIA Vertical farming Market, By growth mechanism 2019-2028 (USD Million)
TABLE 349 MALAYSIA Vertical farming Market, By structure 2019-2028 (USD Million)
TABLE 350 MALAYSIA Vertical farming Market, By type 2019-2028 (USD Million)
TABLE 351 MALAYSIA biopesticides Vertical farming Market, By type 2019-2028 (USD Million)
TABLE 352 MALAYSIA biofertilizer Vertical farming Market, By type 2019-2028 (USD Million)
TABLE 353 MALAYSIA biostimulants Vertical farming Market, By type 2019-2028 (USD Million)
TABLE 354 MALAYSIA Vertical farming Market, By crop type 2019-2028 (USD Million)
TABLE 355 MALAYSIA Vertical farming Market, By Application 2019-2028 (USD Million)
TABLE 356 MALAYSIA Vertical farming Market, By component 2019-2028 (USD Million)
TABLE 357 MALAYSIA Lighting Vertical farming Market, By component 2019-2028 (USD Million)
TABLE 358 MALAYSIA hydroponic component Vertical farming Market, By Component 2019-2028 (USD Million)
TABLE 359 MALAYSIA Climate control Vertical farming Market, By Component 2019-2028 (USD Million)
TABLE 360 MALAYSIA Sensors Vertical farming Market, By Component 2019-2028 (USD Million)
TABLE 361 PHILIPPINES Vertical farming Market, By growth mechanism 2019-2028 (USD Million)
TABLE 362 PHILIPPINES Vertical farming Market, By structure 2019-2028 (USD Million)
TABLE 363 PHILIPPINES Vertical farming Market, By type 2019-2028 (USD Million)
TABLE 364 PHILIPPINES biopesticides Vertical farming Market, By type 2019-2028 (USD Million)
TABLE 365 PHILIPPINES biofertilizer Vertical farming Market, By type 2019-2028 (USD Million)
TABLE 366 PHILIPPINES biostimulants Vertical farming Market, By type 2019-2028 (USD Million)
TABLE 367 PHILIPPINES Vertical farming Market, By crop type 2019-2028 (USD Million)
TABLE 368 PHILIPPINES Vertical farming Market, By Application 2019-2028 (USD Million)
TABLE 369 PHILIPPINES Vertical farming Market, By component 2019-2028 (USD Million)
TABLE 370 PHILIPPINES Lighting Vertical farming Market, By component 2019-2028 (USD Million)
TABLE 371 PHILIPPINES hydroponic component Vertical farming Market, By Component 2019-2028 (USD Million)
TABLE 372 PHILIPPINES Climate control Vertical farming Market, By Component 2019-2028 (USD Million)
TABLE 373 PHILIPPINES Sensors Vertical farming Market, By Component 2019-2028 (USD Million)
TABLE 374 ASIA-PACIFIC Vertical farming Market, By growth mechanism 2019-2028 (USD Million)
TABLE 375 South America vertical farming market, By Country, 2019-2028 (USD Million)
TABLE 376 SOUTH AMERICA Vertical farming Market, By growth mechanism 2019-2028 (USD Million)
TABLE 377 SOUTH AMERICA Vertical farming Market, By structure 2019-2028 (USD Million)
TABLE 378 SOUTH AMERICA Vertical farming Market, By type 2019-2028 (USD Million)
TABLE 379 SOUTH AMERICA biopesticides Vertical farming Market, By type 2019-2028 (USD Million)
TABLE 380 SOUTH AMERICA biofertilizer Vertical farming Market, By type 2019-2028 (USD Million)
TABLE 381 SOUTH AMERICA biostimulants Vertical farming Market, By type 2019-2028 (USD Million)
TABLE 382 SOUTH AMERICA Vertical farming Market, By crop type 2019-2028 (USD Million)
TABLE 383 SOUTH AMERICA Vertical farming Market, By Application 2019-2028 (USD Million)
TABLE 384 SOUTH AMERICA Vertical farming Market, By component 2019-2028 (USD Million)
TABLE 385 SOUTH AMERICA Lighting Vertical farming Market, By component 2019-2028 (USD Million)
TABLE 386 SOUTH AMERICA hydroponic component Vertical farming Market, By Component 2019-2028 (USD Million)
TABLE 387 SOUTH AMERICA Climate control Vertical farming Market, By Component 2019-2028 (USD Million)
TABLE 388 SOUTH AMERICA Sensors Vertical farming Market, By Component 2019-2028 (USD Million)
TABLE 389 BRAZIL Vertical farming Market, By growth mechanism 2019-2028 (USD Million)
TABLE 390 BRAZIL Vertical farming Market, By structure 2019-2028 (USD Million)
TABLE 391 BRAZIL Vertical farming Market, By type 2019-2028 (USD Million)
TABLE 392 BRAZIL biopesticides Vertical farming Market, By type 2019-2028 (USD Million)
TABLE 393 BRAZIL biofertilizer Vertical farming Market, By type 2019-2028 (USD Million)
TABLE 394 BRAZIL biostimulants Vertical farming Market, By type 2019-2028 (USD Million)
TABLE 395 BRAZIL Vertical farming Market, By crop type 2019-2028 (USD Million)
TABLE 396 BRAZIL Vertical farming Market, By Application 2019-2028 (USD Million)
TABLE 397 BRAZIL Vertical farming Market, By component 2019-2028 (USD Million)
TABLE 398 BRAZIL Lighting Vertical farming Market, By component 2019-2028 (USD Million)
TABLE 399 BRAZIL hydroponic component Vertical farming Market, By Component 2019-2028 (USD Million)
TABLE 400 BRAZIL Climate control Vertical farming Market, By Component 2019-2028 (USD Million)
TABLE 401 BRAZIL Sensors Vertical farming Market, By Component 2019-2028 (USD Million)
TABLE 402 ARGENTINA Vertical farming Market, By growth mechanism 2019-2028 (USD Million)
TABLE 403 ARGENTINA Vertical farming Market, By structure 2019-2028 (USD Million)
TABLE 404 ARGENTINA Vertical farming Market, By type 2019-2028 (USD Million)
TABLE 405 ARGENTINA biopesticides Vertical farming Market, By type 2019-2028 (USD Million)
TABLE 406 ARGENTINA biofertilizer Vertical farming Market, By type 2019-2028 (USD Million)
TABLE 407 ARGENTINA biostimulants Vertical farming Market, By type 2019-2028 (USD Million)
TABLE 408 ARGENTINA Vertical farming Market, By crop type 2019-2028 (USD Million)
TABLE 409 ARGENTINA Vertical farming Market, By Application 2019-2028 (USD Million)
TABLE 410 ARGENTINA Vertical farming Market, By component 2019-2028 (USD Million)
TABLE 411 ARGENTINA Lighting Vertical farming Market, By component 2019-2028 (USD Million)
TABLE 412 ARGENTINA hydroponic component Vertical farming Market, By Component 2019-2028 (USD Million)
TABLE 413 ARGENTINA Climate control Vertical farming Market, By Component 2019-2028 (USD Million)
TABLE 414 ARGENTINA Sensors Vertical farming Market, By Component 2019-2028 (USD Million)
TABLE 415 rest of SOUTH AMERICA Vertical farming Market, By growth mechanism 2019-2028 (USD Million)
TABLE 416 Middle East and Africa vertical farming market, By Country, 2019-2028 (USD million)
TABLE 417 MIDDLE EAST AND AFRICA Vertical farming Market, By growth mechanism 2019-2028 (USD Million)
TABLE 418 MIDDLE EAST AND AFRICA Vertical farming Market, By structure 2019-2028 (USD Million)
TABLE 419 MIDDLE EAST AND AFRICA Vertical farming Market, By type 2019-2028 (USD Million)
TABLE 420 MIDDLE EAST AND AFRICA biopesticides Vertical farming Market, By type 2019-2028 (USD Million)
TABLE 421 MIDDLE EAST AND AFRICA biofertilizer Vertical farming Market, By type 2019-2028 (USD Million)
TABLE 422 MIDDLE EAST AND AFRICA biostimulants Vertical farming Market, By type 2019-2028 (USD Million)
TABLE 423 MIDDLE EAST AND AFRICA Vertical farming Market, By crop type 2019-2028 (USD Million)
TABLE 424 MIDDLE EAST AND AFRICA Vertical farming Market, By Application 2019-2028 (USD Million)
TABLE 425 MIDDLE EAST AND AFRICA Vertical farming Market, By component 2019-2028 (USD Million)
TABLE 426 MIDDLE EAST AND AFRICA Lighting Vertical farming Market, By component 2019-2028 (USD Million)
TABLE 427 MIDDLE EAST AND AFRICA hydroponic component Vertical farming Market, By Component 2019-2028 (USD Million)
TABLE 428 MIDDLE EAST AND AFRICA Climate control Vertical farming Market, By Component 2019-2028 (USD Million)
TABLE 429 MIDDLE EAST AND AFRICA Sensors Vertical farming Market, By Component 2019-2028 (USD Million)
TABLE 430 SOUTH AFRICA Vertical farming Market, By growth mechanism 2019-2028 (USD Million)
TABLE 431 SOUTH AFRICA Vertical farming Market, By structure 2019-2028 (USD Million)
TABLE 432 SOUTH AFRICA Vertical farming Market, By type 2019-2028 (USD Million)
TABLE 433 SOUTH AFRICA biopesticides Vertical farming Market, By type 2019-2028 (USD Million)
TABLE 434 SOUTH AFRICA biofertilizer Vertical farming Market, By type 2019-2028 (USD Million)
TABLE 435 SOUTH AFRICA biostimulants Vertical farming Market, By type 2019-2028 (USD Million)
TABLE 436 SOUTH AFRICA Vertical farming Market, By crop type 2019-2028 (USD Million)
TABLE 437 SOUTH AFRICA Vertical farming Market, By Application 2019-2028 (USD Million)
TABLE 438 SOUTH AFRICA Vertical farming Market, By component 2019-2028 (USD Million)
TABLE 439 SOUTH AFRICA Lighting Vertical farming Market, By component 2019-2028 (USD Million)
TABLE 440 SOUTH AFRICA hydroponic component Vertical farming Market, By Component 2019-2028 (USD Million)
TABLE 441 SOUTH AFRICA Climate control Vertical farming Market, By Component 2019-2028 (USD Million)
TABLE 442 SOUTH AFRICA Sensors Vertical farming Market, By Component 2019-2028 (USD Million)
TABLE 443 SAUDI ARABIA Vertical farming Market, By growth mechanism 2019-2028 (USD Million)
TABLE 444 SAUDI ARABIA Vertical farming Market, By structure 2019-2028 (USD Million)
TABLE 445 SAUDI ARABIA Vertical farming Market, By type 2019-2028 (USD Million)
TABLE 446 SAUDI ARABIA biopesticides Vertical farming Market, By type 2019-2028 (USD Million)
TABLE 447 SAUDI ARABIA biofertilizer Vertical farming Market, By type 2019-2028 (USD Million)
TABLE 448 SAUDI ARABIA biostimulants Vertical farming Market, By type 2019-2028 (USD Million)
TABLE 449 SAUDI ARABIA Vertical farming Market, By crop type 2019-2028 (USD Million)
TABLE 450 SAUDI ARABIA Vertical farming Market, By Application 2019-2028 (USD Million)
TABLE 451 SAUDI ARABIA Vertical farming Market, By component 2019-2028 (USD Million)
TABLE 452 SAUDI ARABIA Lighting Vertical farming Market, By component 2019-2028 (USD Million)
TABLE 453 SAUDI ARABIA hydroponic component Vertical farming Market, By Component 2019-2028 (USD Million)
TABLE 454 SAUDI ARABIA Climate control Vertical farming Market, By Component 2019-2028 (USD Million)
TABLE 455 SAUDI ARABIA Sensors Vertical farming Market, By Component 2019-2028 (USD Million)
TABLE 456 U.A.E. Vertical farming Market, By growth mechanism 2019-2028 (USD Million)
TABLE 457 U.A.E. Vertical farming Market, By structure 2019-2028 (USD Million)
TABLE 458 U.A.E. Vertical farming Market, By type 2019-2028 (USD Million)
TABLE 459 U.A.E. biopesticides Vertical farming Market, By type 2019-2028 (USD Million)
TABLE 460 U.A.E. biofertilizer Vertical farming Market, By type 2019-2028 (USD Million)
TABLE 461 U.A.E. biostimulants Vertical farming Market, By type 2019-2028 (USD Million)
TABLE 462 U.A.E. Vertical farming Market, By crop type 2019-2028 (USD Million)
TABLE 463 U.A.E. Vertical farming Market, By Application 2019-2028 (USD Million)
TABLE 464 U.A.E. Vertical farming Market, By component 2019-2028 (USD Million)
TABLE 465 U.A.E. Lighting Vertical farming Market, By component 2019-2028 (USD Million)
TABLE 466 U.A.E. hydroponic component Vertical farming Market, By Component 2019-2028 (USD Million)
TABLE 467 U.A.E. Climate control Vertical farming Market, By Component 2019-2028 (USD Million)
TABLE 468 U.A.E. Sensors Vertical farming Market, By Component 2019-2028 (USD Million)
TABLE 469 EGYPT Vertical farming Market, By growth mechanism 2019-2028 (USD Million)
TABLE 470 EGYPT Vertical farming Market, By structure 2019-2028 (USD Million)
TABLE 471 EGYPT Vertical farming Market, By type 2019-2028 (USD Million)
TABLE 472 EGYPT biopesticides Vertical farming Market, By type 2019-2028 (USD Million)
TABLE 473 EGYPT biofertilizer Vertical farming Market, By type 2019-2028 (USD Million)
TABLE 474 EGYPT biostimulants Vertical farming Market, By type 2019-2028 (USD Million)
TABLE 475 EGYPT Vertical farming Market, By crop type 2019-2028 (USD Million)
TABLE 476 EGYPT Vertical farming Market, By Application 2019-2028 (USD Million)
TABLE 477 EGYPT Vertical farming Market, By component 2019-2028 (USD Million)
TABLE 478 EGYPT Lighting Vertical farming Market, By component 2019-2028 (USD Million)
TABLE 479 EGYPT hydroponic component Vertical farming Market, By Component 2019-2028 (USD Million)
TABLE 480 EGYPT Climate control Vertical farming Market, By Component 2019-2028 (USD Million)
TABLE 481 EGYPT Sensors Vertical farming Market, By Component 2019-2028 (USD Million)
TABLE 482 ISRAEL Vertical farming Market, By growth mechanism 2019-2028 (USD Million)
TABLE 483 ISRAEL Vertical farming Market, By structure 2019-2028 (USD Million)
TABLE 484 ISRAEL Vertical farming Market, By type 2019-2028 (USD Million)
TABLE 485 ISRAEL biopesticides Vertical farming Market, By type 2019-2028 (USD Million)
TABLE 486 ISRAEL biofertilizer Vertical farming Market, By type 2019-2028 (USD Million)
TABLE 487 ISRAEL biostimulants Vertical farming Market, By type 2019-2028 (USD Million)
TABLE 488 ISRAEL Vertical farming Market, By crop type 2019-2028 (USD Million)
TABLE 489 ISRAEL Vertical farming Market, By Application 2019-2028 (USD Million)
TABLE 490 ISRAEL Vertical farming Market, By component 2019-2028 (USD Million)
TABLE 491 ISRAEL Lighting Vertical farming Market, By component 2019-2028 (USD Million)
TABLE 492 ISRAEL hydroponic component Vertical farming Market, By Component 2019-2028 (USD Million)
TABLE 493 ISRAEL Climate control Vertical farming Market, By Component 2019-2028 (USD Million)
TABLE 494 ISRAEL Sensors Vertical farming Market, By Component 2019-2028 (USD Million)
TABLE 495 ASIA-PACIFIC Vertical farming Market, By growth mechanism 2019-2028 (USD Million)
List of Figure
FIGURE 1 GLOBAL VERTICAL FARMING MARKET: segmentation
FIGURE 2 Global vertical farming market: data triangulation
FIGURE 3 Global vertical farming market: DROC ANALYSIS
FIGURE 4 Global vertical farming market: GLOBAL VS REGIONAL MARKET ANALYSIS
FIGURE 5 Global vertical farming market: COMPANY RESEARCH ANALYSIS
FIGURE 6 Global vertical farming market: INTERVIEW DEMOGRAPHICS
FIGURE 7 Global vertical farming market: DBMR MARKET POSITION GRID
FIGURE 8 Global vertical farming market: vendor share analysis
FIGURE 9 Global vertical farming market: MARKET APPLICATION COVERAGE GRID
FIGURE 10 Global vertical farming market: SEGMENTATION
FIGURE 11 Growing adoption of organic farming in clean environmental friendly is EXPECTED TO DRIVE GLOBAL VERTICAL FARMING MARKET IN THE FORECAST PERIOD OF 2021 TO 2028
FIGURE 12 HYDROPONICS segment is expected to account for the largest share of Global vertical farming market in 2021 & 2028
FIGURE 13 ASIA-PACIFIC is expected to DOMINATE and is the fastest growing region in THE global vertical farming market IN the forecast period of 2021 to 2028
FIGURE 14 NORTH AMERICA is the fastest growing market for vertical farming manufacturers in the forecast period of 2021 to 2028
FIGURE 15 DRIVERS, RESTRAINTS, OPPORTUNITIES AND CHALLENGES OF GLOBAL VERTICAL FARMING MARKET
FIGURE 16 Global Vertical farming MARKET: BY Growth mechanism 2020
FIGURE 17 Global Vertical farming MARKET: BY structure 2020
FIGURE 18 Global Vertical farming MARKET: BY type 2020
FIGURE 19 Global Vertical farming MARKET: BY crop type 2020
FIGURE 20 Global Vertical farming MARKET: BY application 2020
FIGURE 21 Global Vertical farming MARKET: By component 2020
FIGURE 22 Global vertical FARMING MARKET: SNAPSHOT (2020)
FIGURE 23 Global vertical FARMING MARKET: by geography (2020)
FIGURE 24 Global vertical FARMING MARKET: by Geography (2021 & 2028)
FIGURE 25 Global vertical FARMING MARKET: by Geography (2020 & 2028)
FIGURE 26 Global vertical FARMING MARKET: by growth mechanism (2021-2028)
FIGURE 27 NORTH AMERICA VERTICAL FARMING MARKET: SNAPSHOT (2020)
FIGURE 28 NORTH AMERICA VERTICAL FARMING MARKET: BY COUNTRY (2020)
FIGURE 29 NORTH AMERICA VERTICAL FARMING MARKET: BY COUNTRY (2021& 2028)
FIGURE 30 NORTH AMERICA VERTICAL FARMING MARKET: BY COUNTRY (2021& 2028)
FIGURE 31 NORTH AMERICA VERTICAL FARMING MARKET: BY growth mechanism (2021-2028)
FIGURE 32 EUROPE VERTICAL FARMING MARKET: SNAPSHOT (2020)
FIGURE 33 EUROPE VERTICAL FARMING MARKET: BY COUNTRY (2020)
FIGURE 34 EUROPE VERTICAL FARMING MARKET: BY COUNTRY (2021& 2028)
FIGURE 35 EUROPE VERTICAL FARMING MARKET: BY COUNTRY (2021& 2028)
FIGURE 36 EUROPE VERTICAL FARMING MARKET: BY growth mechanism (2021-2028)
FIGURE 37 ASIA-PACIFIC VERTICAL FARMING MARKET: SNAPSHOT (2020)
FIGURE 38 ASIA-PACIFIC VERTICAL FARMING MARKET: BY COUNTRY (2020)
FIGURE 39 ASIA-PACIFIC VERTICAL FARMING MARKET: BY COUNTRY (2021& 2028)
FIGURE 40 ASIA-PACIFIC VERTICAL FARMING MARKET: BY COUNTRY (2021& 2028)
FIGURE 41 ASIA-PACIFIC VERTICAL FARMING MARKET: BY growth mechanism (2021-2028)
FIGURE 42 SOUTH AMERICA VERTICAL FARMING MARKET: SNAPSHOT (2020)
FIGURE 43 SOUTH AMERICA VERTICAL FARMING MARKET: BY COUNTRY (2020)
FIGURE 44 SOUTH AMERICA VERTICAL FARMING MARKET: BY COUNTRY (2021& 2028)
FIGURE 45 SOUTH AMERICA VERTICAL FARMING MARKET: BY COUNTRY (2021& 2028)
FIGURE 46 SOUTH AMERICA VERTICAL FARMING MARKET: BY growth mechanism (2021-2028)
FIGURE 47 MIDDLE EAST AND AFRICA VERTICAL FARMING MARKET: SNAPSHOT (2020)
FIGURE 48 MIDDLE EAST AND AFRICA VERTICAL FARMING MARKET: BY COUNTRY (2020)
FIGURE 49 MIDDLE EAST AND AFRICA VERTICAL FARMING MARKET: BY COUNTRY (2021& 2028)
FIGURE 50 MIDDLE EAST AND AFRICA VERTICAL FARMING MARKET: BY COUNTRY (2021& 2028)
FIGURE 51 MIDDLE EAST AND AFRICA VERTICAL FARMING MARKET: BY growth mechanism (2021-2028)
FIGURE 52 global Vertical Farming Market: company share 2020 (%)
FIGURE 53 north America VERTICAL FARMING Market: company share 2020 (%)
FIGURE 54 Europe Vertical Farming Market: company share 2020 (%)
FIGURE 55 Asia-Pacific Vertical Farming Market: company share 2020 (%)
Data collection and base year analysis are done using data collection modules with large sample sizes. The stage includes obtaining market information or related data through various sources and strategies. It includes examining and planning all the data acquired from the past in advance. It likewise envelops the examination of information inconsistencies seen across different information sources. The market data is analysed and estimated using market statistical and coherent models. Also, market share analysis and key trend analysis are the major success factors in the market report. To know more, please request an analyst call or drop down your inquiry.
The key research methodology used by DBMR research team is data triangulation which involves data mining, analysis of the impact of data variables on the market and primary (industry expert) validation. Data models include Vendor Positioning Grid, Market Time Line Analysis, Market Overview and Guide, Company Positioning Grid, Patent Analysis, Pricing Analysis, Company Market Share Analysis, Standards of Measurement, Global versus Regional and Vendor Share Analysis. To know more about the research methodology, drop in an inquiry to speak to our industry experts.
Data Bridge Market Research is a leader in advanced formative research. We take pride in servicing our existing and new customers with data and analysis that match and suits their goal. The report can be customized to include price trend analysis of target brands understanding the market for additional countries (ask for the list of countries), clinical trial results data, literature review, refurbished market and product base analysis. Market analysis of target competitors can be analyzed from technology-based analysis to market portfolio strategies. We can add as many competitors that you require data about in the format and data style you are looking for. Our team of analysts can also provide you data in crude raw excel files pivot tables (Fact book) or can assist you in creating presentations from the data sets available in the report.


