
India Passive Fire Protection Market
Market Size in USD Million
 USD
140.89 Million
USD
266.00 Million
2025
2033
USD
140.89 Million
USD
266.00 Million
2025
2033
| 2026 - 2033 | |
| USD 140.89 Million | |
| USD 266.00 Million | |
| % | |
|
India Passive Fire Protection Market Size
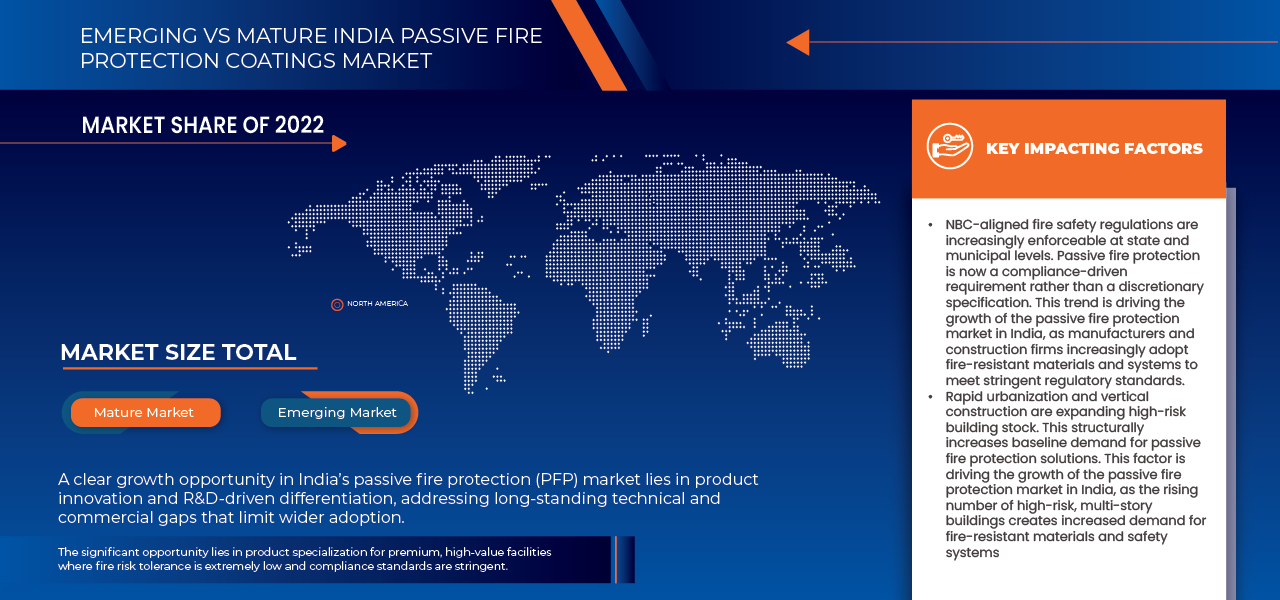
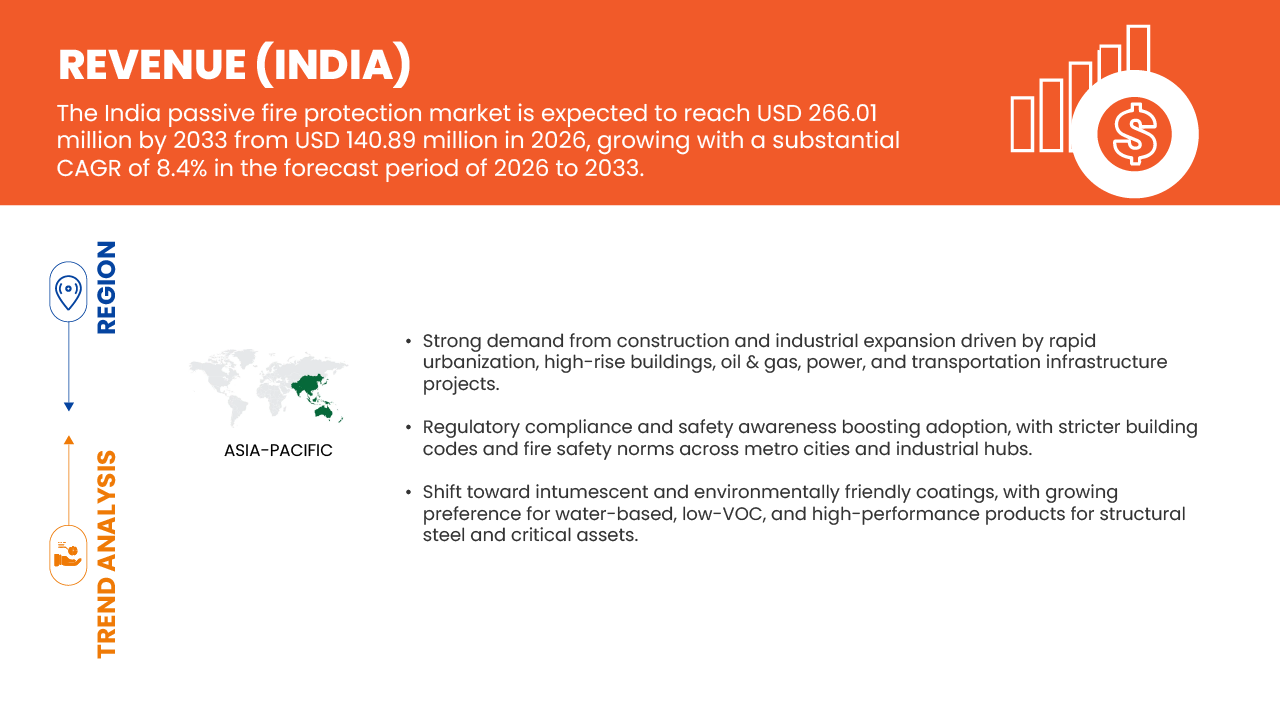
- The India Passive Fire Protection market size was valued at USD 140.89 Million in 2025 and is expected to reach USD 266.00 Million by 2033, at a CAGR of 8.4% during the forecast period.
- Passive fire protection (PFP) are components of a building or structure that slows or impedes the fire or smoke without system activation, and usually without movement. The instances of passive systems include floor-ceilings and roofs, fire doors, windows, and wall assemblies, fire-resistant coatings, and other fire and smoke control assemblies. Passive fire protection systems can include active components such as fire dampers.
India Passive Fire Protection Market Analysis
- PFP systems are designed to "prevent" the spread of fire and smoke, or heating of structural members, for an intended limited period as determined by the local building code and fire codes. Passive fire protection measures such as firestops, fire walls, and fire doors, are tested to determine the fire-resistance rating of the final assembly, which is usually expressed in terms of hours of fire resistance (e.g., ⅓, ¾, 1, 1½, 2, 3, 4 hour).
- India's passive protection landscape, particularly in defense and vehicle armor sectors, shows robust growth driven by escalating security needs. Key trends include the rapid expansion of passive protection systems within the broader active and passive protection market.
- The market in India is projected to grow with the CAGR of 8.4% due to rapid urbanization, stringent government regulations, and surging infrastructure development. Initiatives like Smart Cities Mission and rising high-rise constructions in metros such as Mumbai and Delhi mandate advanced fire detection, suppression, and alarm systems for compliance with NBC 2016 standards. Escalating fire incidents in industrial hubs, driven by manufacturing expansion under Make in India and chemical sector growth, heighten demand for automated sprinklers and clean-agent systems.
Report Scope and India Passive Fire Protection Market Segmentation
|
Attributes |
India Passive Fire Protection Key Market Insights |
|
Segments Covered |
|
|
Countries Covered |
|
|
Key Market Players |
|
|
Market Opportunities |
|
|
Value Added Data Infosets |
In addition to the insights on market scenarios such as market value, growth rate, segmentation, geographical coverage, and major players, the market reports curated by the Data Bridge Market Research also include in-depth expert analysis, geographically represented company-wise production and capacity, network layouts of distributors and partners, detailed and updated price trend analysis and deficit analysis of supply chain and demand. |
India Passive Fire Protection Market Trends
“Rapid Expansion Of Passive Protection Systems Within The Broader Active And Passive Protection Market”
- Stringent fire safety codes and national standards mandate PFP integration in residential, commercial, and industrial buildings, boosting demand for compliant materials amid rising infrastructure projects.
- Shift toward advanced materials like intumescent coatings and cementitious sprays, which offer superior fire resistance and lightweight designs, alongside smart sensors for real-time monitoring.
- Rapid commercial and residential construction, including government initiatives like Central Vista, accelerates the adoption of fireproof cladding and barriers to mitigate risks in high-density areas.
- Emphasis on eco-friendly, durable PFP solutions aligns with green building practices, enhancing market appeal in a sector prioritizing long-term resilience.
India Passive Fire Protection Market Dynamics
Driver
“Strengthening Regulatory Mandates for Fire Safety and Passive Fire Protection Compliance”
- The India passive fire protection market is fundamentally driven by the strengthening and institutionalisation of fire safety regulations at the national, state, and municipal levels. At the core of this regulatory framework lies the National Building Code (NBC) of India 2016, Part IV – Fire & Life Safety, which prescribes minimum fire-resistance ratings, compartmentation norms, structural fire protection requirements, and separation standards for buildings across occupancies.
- While originally positioned as a model code, NBC provisions are increasingly being embedded into state fire acts, municipal building bye-laws, and approval processes for construction permits and occupancy certificates.
- This shift has transformed passive fire protection from a “best practice” into a de facto compliance requirement, particularly for multi-storey, commercial, institutional, and assembly buildings.
- As regulatory scrutiny tightens and approval authorities rely more heavily on NBC benchmarks, developers and asset owners are compelled to specify certified passive fire protection systems, including intumescent coatings, fire-rated walls, shafts, and firestop solutions at both design and execution stages, directly supporting sustained market demand.
Restraint
“High Upfront Cost and Life-Cycle Budgeting Pressures”
- Despite growing regulatory emphasis, the adoption of passive fire protection (PFP) systems in India continues to face resistance due to high upfront costs and competing capital expenditure priorities.
- Intumescent coatings, certified fire-rated boards, and tested firestop assemblies often represent a non-revenue-generating cost line, particularly from the perspective of private developers and facility owners.
- In cost-sensitive projects, especially speculative commercial real estate and mid-income residential developments, PFP is frequently viewed as an area where specifications can be minimized without immediate functional impact.
- Additionally, life-cycle benefits of passive fire protection, such as structural integrity retention and reduced post-fire losses, are not always factored into budgeting decisions, which tend to prioritise short-term construction costs over long-term risk mitigation. This cost perception creates friction between regulatory intent and on-ground implementation, slowing conversion rates and leading to partial or lower-grade PFP adoption.

India Passive Fire Protection Market Scope
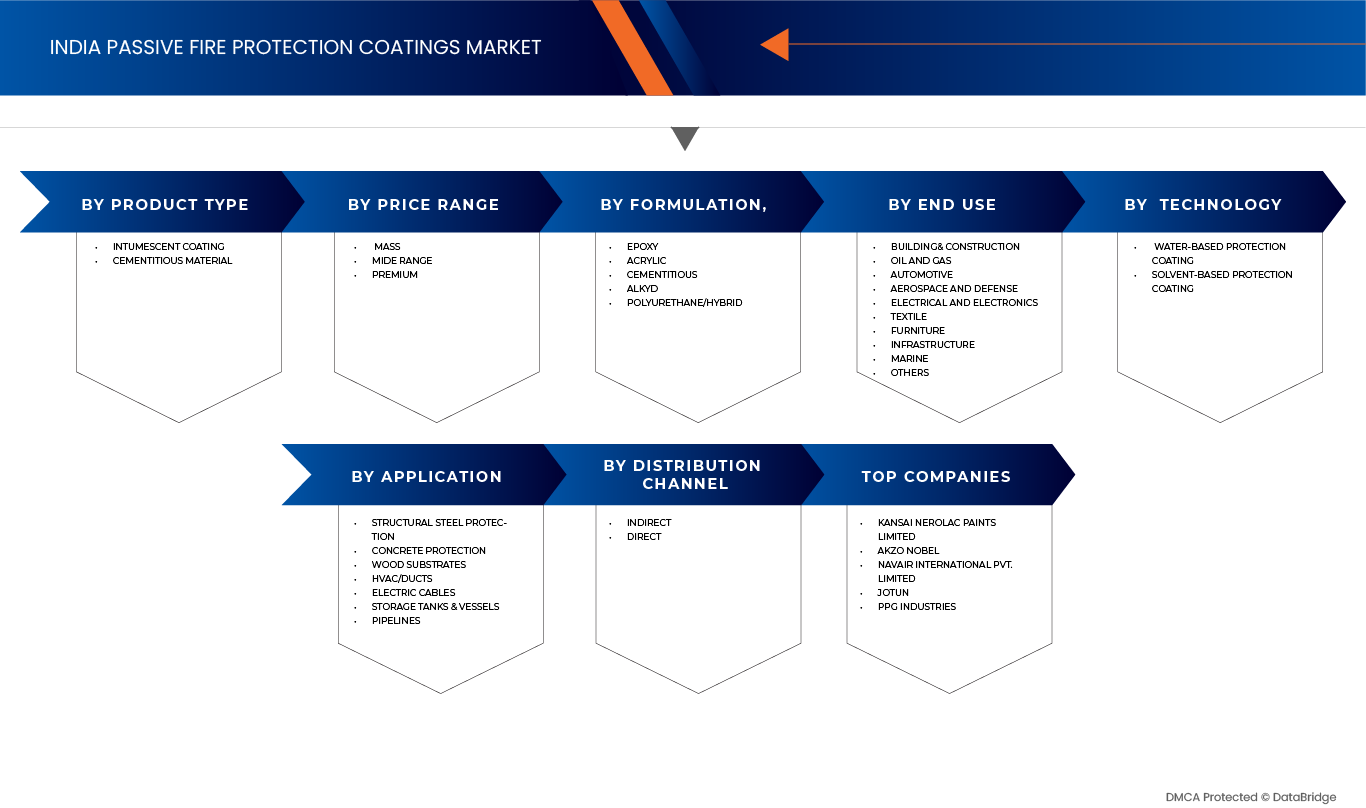
The India Passive Fire Protection market is segmented into six notable segments based on the product type, technology, application, formulation, end user, distribution channel, and price range.
• By Product Type
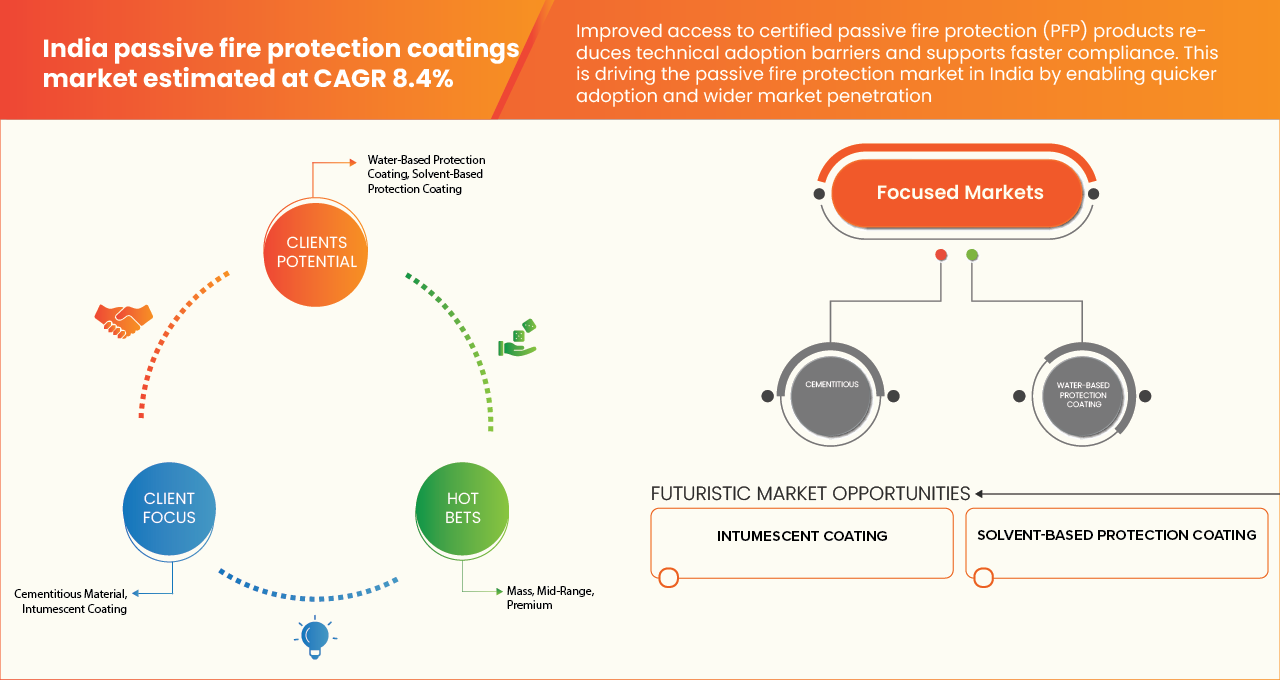
On the basis of product type, the India passive fire protection market is segmented into cementitious material and intumescent coating. In 2026, intumescent coating is expected to dominate the market with 59.64% market share due to their superior fire resistance, rapidly expanding into a thick insulating char layer upon heat exposure that protects steel structures for up to four hours, outperforming heavier cementitious materials in high-risk hydrocarbon fire scenarios prevalent in oil & gas and petrochemical sectors.
The intumescent coating segment is estimated to grow with the highest CAGR of 9.1% due to rapid urbanization and infrastructure development in India, including Smart Cities and high-rise projects that demand lightweight, aesthetically pleasing fire protection for steel structures over traditional cementitious materials.
• By Technology
On the basis of technology, the India passive fire protection market is segmented into water-based protection coating and solvent-based protection coating. In 2026, water-based protection coating is expected to dominate the market with 61.24% market share owing to their eco-friendly profile, featuring low or zero volatile organic compound (VOC) emissions that align with stringent environmental regulations and green building certifications.
The water-based protection coating segment is estimated to grow with the highest CAGR of 9.0% due to increasing regulatory emphasis on environmental sustainability and low-VOC emissions, aligning with India's green building norms like IGBC and GRIHA that prioritize eco-friendly materials in booming infrastructure projects such as Smart Cities and high-rise developments.
• By Application
On the basis of application, the India passive fire protection market is segmented Steel Protection, Concrete Protection, Wood Substrates, HVAC/Ducts, Electric Cables, Storage Tanks & Vessels, Pipelines. In 2026 Structural Steel Protection is expected to dominate the market with 49.51% market share due to the explosive growth in high-rise commercial buildings, metro rail networks, and industrial warehouses.
HVAC/Ducts segment is estimated to grow with the highest CAGR of 8.9% in the forecast period due to due to surging demand from rapid urbanization and infrastructure projects like Smart Cities Mission, PM GatiShakti, and commercial high-rises, where ducts form critical pathways for fire/smoke spread requiring mandatory fire-rated coatings and encasements per NBC 2016 Part 4 standards.
• By Formulation
On the basis of formulation, the India passive fire protection market is segmented into Epoxy, Acrylic, Cementitious, Alkyd and Polyurethane/Hybrid. In 2026 Epoxy is expected to dominate the market with 39.46% market share due to their exceptional durability and chemical resistance, making them ideal for hydrocarbon fire exposure in oil & gas refineries, petrochemical plants, and offshore platforms.
Epoxy segment is estimated to grow with the highest CAGR of 9.4% in the forecast period due to its superior hydrocarbon fire resistance, forming a dense cellular char that withstands extreme temperatures (1,100°C+) for 3-4 hours, essential for India's expanding oil & gas infrastructure like new refineries and LNG projects under the National Infrastructure Pipeline.
• By End User
On the basis of end user, the India passive fire protection market is segmented into Building & Construction, Oil and Gas, Automotive, Aerospace and Defense, Electrical and Electronics, Textile, Furniture, Infrastructure, Marine, Others. In 2026, building and construction is expected to dominate the market with 42.32% market share due to explosive urbanization and infrastructure spending under initiatives like Smart Cities Mission, PM GatiShakti, and National Infrastructure Pipeline.
Building and construction segment is estimated to grow with the highest CAGR of 8.6% in the forecast period due to surging demand for passive fire protection in high-rise towers, metro expansions, airports, and commercial hubs where steel frameworks need 2-4 hour fire resistance per NBC 2016 standards.
• By Distribution Channel
On the basis of distribution channels, the India passive fire protection market is segmented into Indirect and Direct. In 2026 Indirect is expected to dominate the market with 60.50% market share owing to its extensive network of regional distributors, dealers, and specialized contractors who provide localized inventory, technical support, and customized solutions for diverse projects across tier-1/2/3 cities.
Indirect segment is estimated to grow with the highest CAGR of 8.6% in the forecast period due to due to its expansive network of regional distributors, sub-dealers, and specialty contractors that ensure rapid availability of passive fire protection materials across India's tier-2/3 cities and remote industrial zones.
• By Price Range
On the basis of Price Range, the India Passive Fire Protection Market is segmented into Mass, Mid Range, Premium. In 2026, mid-range is expected to dominate the market with 50.39% market share owing to its optimal balance of cost-effectiveness and performance, appealing to mid-tier builders, SMEs, and regional developers.
Mid-range segment is estimated to grow with the highest CAGR of 9.4% in the forecast period due to its compelling value proposition, delivering 2-3 hour fire resistance via epoxy/acrylic intumescent coatings and cementitious materials.
The Major Market Leaders Operating in the Market Are:
The India Passive Fire Protection market is primarily led by well-established companies, including:
- Kansai Nerolac Paints Limited (India)
- Akzo Nobel (Netherlands)
- NAVAIR International Pvt Limited (India)
- Jotun (Norway)
- PPG Industries (U.S.)
- Hempel (Denmark)
- Carboline (U.S.)
- SafeCoat Fire Solutions (India)
- The Sherwin-Williams Company (U.S.)
- Etex Group (Belgium)
- Feukem India Pvt. Ltd (India)
- Isolatek International (Newkem) (U.S.)
- Ugam Chemicals (India)
- Tremco CPG India (Nullifire) (U.S.)
- CharCoat (India)
Latest Developments in India Passive Fire Protection Market
- In December 2024, Sherwin-Williams strengthens oversight of political engagement. It actively engages in public policy to support the Company’s interests, with all lobbying and political activities overseen by senior management and the Board of Directors. Government Affairs and, where required, the Chief Legal Officer must approve any contributions or lobbying efforts, while employees are prohibited from linking personal political activities to the Company. Sherwin-Williams currently does not operate a Political Action Committee (PAC). Thus, this will ensure compliance, transparency, and ethical advocacy in alignment with corporate governance standards.
- In December 2024, Nullifire launched "A Guide to Specification and Design for Firestopping" to simplify passive fire protection processes amid evolving building regulations. This helps architects and contractors apply passive fire protection correctly, reducing errors and safety risks. This strengthens the company’s reputation, boosts customer confidence, and promotes wider adoption of its certified fire‑stopping products.
- In December 2025, Ugam Chemicals announced that they had been honored with the “𝑩𝒆𝒔𝒕 𝑪𝒐𝒎𝒑𝒂𝒏𝒚 𝒊𝒏 𝑷𝒂𝒊𝒏𝒕𝒔 & 𝑺𝒑𝒆𝒄𝒊𝒂𝒍𝒕𝒚 𝑪𝒐𝒂𝒕𝒊𝒏𝒈𝒔” 𝒂𝒘𝒂𝒓𝒅 at the 11th CIA World Construction and Infra Awards, hosted by Epic Media at the prestigious Nehru Centre, Mumbai. The award enhances credibility with customers and partners, supporting market expansion and customer confidence in Ugam’s performance and sustainability claims.
- In August 2025, Hempel formally entered a strategic partnership with CVC, which brings complementary competencies and resources to support the acceleration of Hempel’s growth and value creation plan. The partnership strengthens Hempel’s growth trajectory by pairing its existing strengths with CVC’s experience in scaling businesses and executing transformational acquisitions, enabling faster expansion into new segments and geographies while expanding capabilities in sustainable technologies.
- In December 2023, Feukem India exhibited its Passive Fire Protection Systems, including solutions for fire-rated ductworks, steel structures, and fire stop products, at the Steel Construction Expo 2023. This has helped to create awareness amongst customers.
SKU-

- Interactive Data Analysis Dashboard
- Company Analysis Dashboard for high growth potential opportunities
- Research Analyst Access for customization & queries
- Competitor Analysis with Interactive dashboard
- Latest News, Updates & Trend analysis
- Harness the Power of Benchmark Analysis for Comprehensive Competitor Tracking
Table of Content
1 INTRODUCTION
1.1 OBJECTIVES OF THE STUDY
1.2 MARKET DEFINITION
1.3 OVERVIEW OF INDIA PASSIVE FIRE PROTECTION MARKET
1.4 LIMITATIONS
1.5 MARKETS COVERED
2 MARKET SEGMENTATION
2.1 MARKETS COVERED
2.2 GEOGRAPHICAL SCOPE
2.3 YEARS CONSIDERED FOR THE STUDY
2.4 CURRENCY AND PRICING
2.5 DBMR TRIPOD DATA VALIDATION MODEL
2.6 PRODUCT TYPE LIFE LINE CURVE
2.7 MULTIVARIATE MODELING
2.8 PRIMARY INTERVIEWS WITH KEY OPINION LEADERS
2.9 DBMR MARKET POSITION GRID
2.1 MARKET APPLICATION COVERAGE GRID
2.11 DBMR MARKET CHALLENGE MATRIX
2.12 DBMR VENDOR SHARE ANALYSIS
2.13 SECONDARY SOURCES
2.14 ASSUMPTIONS
3 EXECUTIVE SUMMARY
4 PREMIUM INSIGHTS
4.1 PORTER’S FIVE FORCES
4.1.1 THREAT OF NEW ENTRANTS — MEDIUM
4.1.2 BARGAINING POWER OF SUPPLIERS — MEDIUM
4.1.3 BARGAINING POWER OF BUYERS — HIGH
4.1.4 THREAT OF SUBSTITUTES — MEDIUM
4.1.5 COMPETITIVE RIVALRY — HIGH
4.1.6 STRATEGIC IMPLICATIONS
4.2 PRICING ANALYSIS
4.3 CLIMATE CHANGE SCENARIO – GLOBAL PALLETS PACKAGING MARKET
4.3.1 ENVIRONMENTAL CONCERNS
4.3.2 INDUSTRY RESPONSE
4.3.3 GOVERNMENT’S ROLE
4.3.4 ANALYST RECOMMENDATIONS
4.4 RAW MATERIAL COVERAGE
4.5 INDUSTRY ECOSYSTEM ANALYSIS
4.5.1 PROMINENT COMPANIES
4.5.2 SMALL & MEDIUM SIZE COMPANIES
4.5.3 END USERS
4.6 SUPPLY CHAIN ANALYSIS – INDIA PASSIVE FIRE PROTECTION MARKET
4.6.1 OVERVIEW
4.6.2 LOGISTIC COST SCENARIO
4.6.3 INBOUND LOGISTICS FOR RAW MATERIALS AND ADDITIVES
4.6.4 DOMESTIC DISTRIBUTION AND SYSTEM DEPLOYMENT
4.6.5 EXPORT LOGISTICS AND GLOBAL DEPLOYMENT
4.6.6 IMPORTANCE OF LOGISTIC SERVICE PROVIDERS
4.6.7 CONCLUSION
4.7 TECHNOLOGICAL ADVANCEMENTS
4.7.1 REGULATORY-DRIVEN TECHNOLOGICAL MATURITY IN PASSIVE FIRE PROTECTION
4.7.2 EVOLUTION FROM GENERIC MATERIALS TO SYSTEM-TESTED ASSEMBLIES
4.7.3 ADVANCEMENTS IN INTUMESCENT COATING FORMULATIONS
4.7.4 FIRESTOPPING TECHNOLOGY ADDRESSING HIGH SERVICE DENSITY
4.7.5 FIRE-RATED GLAZING AND COMPARTMENTATION PERFORMANCE
4.7.6 STRUCTURAL FIRE PROTECTION BEYOND STEEL MEMBERS
4.7.7 DIGITALISATION AND BIM-BASED COORDINATION
4.7.8 FACTORY-CONTROLLED AND PREFABRICATED PASSIVE FIRE PROTECTION
4.7.9 ENHANCED INSPECTION, VERIFICATION, AND MAINTENANCE TECHNOLOGIES
4.7.10 MATERIAL SCIENCE AND DURABILITY IMPROVEMENTS
4.7.11 SUSTAINABILITY-ORIENTED TECHNOLOGICAL DEVELOPMENT
4.7.12 CONSTRAINTS ON TECHNOLOGY PENETRATION
4.7.13 OUTLOOK
4.7.14 CONCLUSION
4.8 VALUE CHAIN ANALYSIS
4.8.1 OVERVIEW OF THE PASSIVE FIRE PROTECTION VALUE CHAIN IN INDIA
4.8.2 RAW MATERIAL SOURCING AND CHEMICAL INPUT SUPPLIERS
4.8.3 PRODUCT FORMULATION, R&D, AND SYSTEM-LEVEL FIRE TESTING
4.8.4 MANUFACTURING AND LOCALISATION IN INDIA
4.8.5 DISTRIBUTION, CHANNEL PARTNERS, AND TECHNICAL SALES
4.8.6 SPECIFIERS, CONSULTANTS, AND DESIGN INFLUENCERS
4.8.7 APPLICATORS AND INSTALLATION CONTRACTORS
4.8.8 EPC CONTRACTORS AND PROJECT INTEGRATORS
4.8.9 REGULATORY AUTHORITIES AND INSPECTION ECOSYSTEM
4.8.10 END USERS AND ASSET OWNERS
4.8.11 AFTERMARKET SERVICES AND LIFECYCLE MANAGEMENT
4.8.12 VALUE DISTRIBUTION AND STRATEGIC CONTROL
4.8.13 CONCLUSION
4.9 VENDOR SELECTION CRITERIA
4.9.1 REGULATORY COMPLIANCE AS THE PRIMARY QUALIFICATION THRESHOLD
4.9.2 COMPLIANCE WITH INDIAN STANDARDS AND ACCEPTED FIRE TEST PROTOCOLS
4.9.3 PROVEN PERFORMANCE UNDER INDIAN CONSTRUCTION AND CLIMATIC CONDITIONS
4.9.4 SYSTEM-BASED CAPABILITY AND INTERFACE MANAGEMENT
4.9.5 SEGMENT-DRIVEN DIFFERENTIATION IN VENDOR SELECTION
4.9.5.1 Commercial real estate
4.9.5.2 Infrastructure projects
4.9.5.3 Industrial facilities
4.9.5.4 Residential developments
4.9.6 LOCAL TECHNICAL PRESENCE AND ENGINEERING SUPPORT
4.9.7 APPLICATOR CONTROL AND INSTALLATION QUALITY ASSURANCE
4.9.8 SUPPLY CHAIN RESILIENCE AND DOMESTIC AVAILABILITY
4.9.9 COMMERCIAL TRANSPARENCY AND COST PREDICTABILITY
4.9.10 WARRANTY, LIABILITY, AND LONG-TERM ACCOUNTABILITY
4.9.11 POST-INSTALLATION INSPECTION AND LIFECYCLE SUPPORT
4.9.12 FINANCIAL STABILITY AND SUSTAINED INDIAN MARKET PRESENCE
4.9.13 CONCLUSION
4.1 INNOVATION TRACKER AND STRATEGIC ANALYSIS
4.10.1 MAJOR DEALS AND STRATEGIC ALLIANCES ANALYSIS
4.10.2 ACTIVE DEVELOPMENT
4.10.3 STAGE OF DEVELOPMENT
4.10.4 TIMELINES AND MILESTONES
4.10.5 INNOVATION STRATEGIES AND METHODOLOGIES
4.10.6 RISK ASSESSMENT AND MITIGATION
4.10.7 FUTURE OUTLOOK
4.10.8 YEARLY NO. OF DEALS, COMPANIES
4.11 BRAND OUTLOOK
4.11.1 QUALITY AND CERTIFICATION AS DIFFERENTIATORS:
4.11.2 TECHNOLOGICAL INNOVATION:
4.11.3 STRATEGIC PARTNERSHIPS AND DISTRIBUTION:
4.11.4 MARKETING AND AWARENESS CAMPAIGNS:
4.11.5 EMERGING PLAYERS:
5 TARIFFS & IMPACT ON THE MARKET
5.1 CURRENT TARIFF RATE
5.1.1 BASIC CUSTOMS DUTY (BCD) ON COATINGS & PAINT CHEMICALS:
5.1.2 ADDITIONAL CESSES AND CHARGES:
5.1.3 GST (GOODS & SERVICES TAX) ON IMPORTED CHEMICAL GOODS:
5.2 OUTLOOK: LOCAL PRODUCTION VS IMPORT RELIANCE
5.3 VENDOR SELECTION CRITERIA DYNAMICS
5.4 IMPACT ON SUPPLY CHAIN
5.5 RAW MATERIAL PROCUREMENT:
5.6 MANUFACTURING AND PRODUCTION:
5.7 LOGISTICS AND DISTRIBUTION:
5.8 PRICE PITCHING AND POSITION IN MARKET:
5.9 INDUSTRY PARTICIPANTS: PROACTIVE MOVES
5.1 SUPPLY CHAIN OPTIMIZATION
5.11 JOINT VENTURE ESTABLISHMENTS
5.12 IMPACT ON PRICES
5.12.1 REGULATORY INCLINATION
5.12.1.1 GEOPOLITICAL SITUATION
5.12.1.2 TRADE PARTNERSHIPS BETWEEN COUNTRIES
5.12.1.3 FREE TRADE AGREEMENTS
5.12.1.4 ALLIANCES ESTABLISHMENTS
5.12.2 STATUS ACCREDITATION (INCLUDING MFTN)
5.12.3 DOMESTIC COURSE OF CORRECTION
5.12.3.1 INCENTIVE SCHEMES TO BOOST PRODUCTION OUTPUTS
5.12.3.2 ESTABLISHMENT OF SEZs
6 REGULATION COVERAGE
6.1 PRODUCT CODES
6.2 CERTIFIED STANDARDS
6.3 INDIAN (DOMESTIC) STANDARDS & REGULATORY FRAMEWORK
6.4 INTERNATIONAL & RECOGNIZED TESTING STANDARDS
6.4.1 CERTIFICATION & ACCREDITATION BODIES
6.4.2 PRODUCT TESTING & LAB ACCREDITATION:
6.4.3 MARKET & ADOPTION IMPLICATIONS
6.4.4 SAFETY STANDARDS
6.4.4.1 MATERIAL HANDLING & STORAGE
6.4.4.2 TRANSPORT & PRECAUTIONS
6.4.4.3 HAZARD IDENTIFICATION
7 MARKET OVERVIEW
7.1 DRIVERS
7.1.1 STRENGTHENING REGULATORY MANDATES FOR FIRE SAFETY AND PASSIVE FIRE PROTECTION COMPLIANCE
7.1.2 INCIDENT-TRIGGERED ENFORCEMENT DRIVES AND MANDATORY FIRE SAFETY AUDITS
7.1.3 RAPID URBANISATION AND GROWTH OF HIGH-RISE AND COMPLEX BUILDING STOCK
7.1.4 INCREASING AVAILABILITY OF CERTIFIED PASSIVE FIRE PROTECTION PRODUCTS
7.2 RESTRAINTS
7.2.1 HIGH UPFRONT COST AND LIFE-CYCLE BUDGETING PRESSURES.
7.2.2 RAW MATERIAL PRICE VOLATILITY AND SUPPLY-CHAIN CONSTRAINTS IMPACTING PFP MANUFACTURING AND PRICING
7.3 OPPORTUNITIES
7.3.1 PRODUCT INNOVATION AND R&D-LED DIFFERENTIATION IN PASSIVE FIRE PROTECTION SYSTEMS
7.3.2 PRODUCT SPECIALISATION FOR HIGH-VALUE, MISSION-CRITICAL AND REGULATED FACILITIES
7.4 CHALLENGES
7.4.1 LIMITED CONTROL OVER INSTALLATION QUALITY AND APPLICATOR CAPABILITY
7.4.2 FRAGMENTED REGULATORY INTERPRETATION INCREASING APPROVAL AND MARKET ENTRY COMPLEXITY
8 INDIA PASSIVE FIRE PROTECTION COATINGS MARKET, BY PRODUCT TYPE
8.1 OVERVIEW
8.2 INDIA PASSIVE FIRE PROTECTION COATINGS MARKET, BY PRODUCT TYPE, 2018-2033 (USD THOUSAND)
8.2.1 INTUMESCENT COATING
8.2.2 CEMENTITIOUS MATERIAL
8.3 INDIA INTUMESCENT COATING IN PASSIVE FIRE PROTECTION COATINGS MARKET, BY TYPE, 2018-2033 (USD THOUSAND)
8.3.1 CELLULOSIC FIRE PROTECTION
8.3.2 HYDROCARBON FIRE PROTECTION
8.3.3 FIREPROOFING CLADDING
8.3.4 OTHERS
8.4 INDIA CEMENTITIOUS MATERIAL IN PASSIVE FIRE PROTECTION COATINGS MARKET, BY TYPE, 2018-2033 (USD THOUSAND)
8.4.1 HYDRAULIC CEMENT
8.4.2 SUPPLEMENTARY CEMENTITIOUS MATERIALS (SCM)
9 INDIA PASSIVE FIRE PROTECTION COATINGS MARKET, BY TECHNOLOGY
9.1 OVERVIEW
9.2 INDIA PASSIVE FIRE PROTECTION COATINGS MARKET, BY TECHNOLOGY, 2018-2032 (USD THOUSAND)
9.2.1 WATER-BASED PROTECTION COATING
9.2.2 SOLVENT-BASED PROTECTION COATING
10 INDIA PASSIVE FIRE PROTECTION COATINGS MARKET, BY PRICE RANGE
10.1 OVERVIEW
10.2 INDIA PASSIVE FIRE PROTECTION COATINGS MARKET, BY PRICE RANGE, 2018-2033 (USD THOUSAND)
10.2.1 MASS
10.2.2 MID RANGE
10.2.3 PREMIUM
11 INDIA PASSIVE FIRE PROTECTION COATINGS MARKET, BY APPLICATION
11.1 OVERVIEW
11.2 INDIA PASSIVE FIRE PROTECTION COATINGS MARKET, BY APPLICATION, 2018-2033 (USD THOUSAND)
11.2.1 STRUCTURAL STEEL PROTECTION
11.2.2 CONCRETE PROTECTION
11.2.3 WOOD SUBSTRATES
11.2.4 HVAC/DUCTS
11.2.5 ELECTRIC CABLES
11.2.6 STORAGE TANKS & VESSELS
11.2.7 PIPELINES
12 INDIA PASSIVE FIRE PROTECTION COATINGS MARKET, BY FORMULATION
12.1 OVERVIEW
12.2 INDIA PASSIVE FIRE PROTECTION COATINGS MARKET, BY FORMULATION, 2018-2033 (USD THOUSAND)
12.2.1 EPOXY
12.2.2 ACRYLIC
12.2.3 CEMENTITIOUS
12.2.4 ALKYD
12.2.5 POLYURETHANE/HYBRID
13 INDIA PASSIVE FIRE PROTECTION COATINGS MARKET, BY END USE
13.1 OVERVIEW
13.2 INDIA PASSIVE FIRE PROTECTION COATINGS MARKET, BY END USE, 2018-2033 (USD THOUSAND)
13.2.1 BUILDING& CONSTRUCTION
13.2.2 OIL AND GAS
13.2.3 AUTOMOTIVE
13.2.4 AEROSPACE AND DEFENSE
13.2.5 ELECTRICAL AND ELECTRONICS
13.2.6 TEXTILE
13.2.7 FURNITURE
13.2.8 INFRASTRUCTURE
13.2.9 MARINE
13.2.10 OTHERS
13.3 INDIA BUILDING & CONSTRUCTION IN PASSIVE FIRE PROTECTION COATINGS MARKET, BY TYPE, 2018-2033 (USD THOUSAND)
13.3.1 HOSPITALS
13.3.2 SKYSCRAPERS
13.3.3 EDUCATIONAL INSTITUTES
13.3.4 RESTAURANTS
13.3.5 RESIDENTIAL BUILDINGS
13.3.6 COMMERCIAL BUILDINGS
13.3.7 OFFICES
13.3.8 OTHERS
13.4 INDIA BUILDING AND CONSTRUCTION IN PASSIVE FIRE PROTECTION COATINGS MARKET, BY PRODUCT TYPE, 2018-2033 (USD THOUSAND)
13.4.1 INTUMESCENT COATING
13.4.2 CEMENTITIOUS MATERIAL
13.5 INDIA OIL AND GAS IN PASSIVE FIRE PROTECTION COATINGS MARKET, BY CATEGORY, 2018-2033 (USD THOUSAND)
13.5.1 OFFSHORE
13.5.2 ONSHORE
13.6 INDIA OIL AND GAS IN PASSIVE FIRE PROTECTION COATINGS MARKET, BY PRODUCT TYPE, 2018-2033 (USD THOUSAND)
13.6.1 INTUMESCENT COATING
13.6.2 CEMENTITIOUS MATERIAL
13.7 INDIA AUTOMOTIVE IN PASSIVE FIRE PROTECTION COATINGS MARKET, BY PRODUCT TYPE, 2018-2033 (USD THOUSAND)
13.7.1 INTUMESCENT COATING
13.7.2 CEMENTITIOUS MATERIAL
13.8 INDIA AEROSPACE AND DEFENSE IN PASSIVE FIRE PROTECTION COATINGS MARKET, BY PRODUCT TYPE, 2018-2033 (USD THOUSAND)
13.8.1 INTUMESCENT COATING
13.8.2 CEMENTITIOUS MATERIAL
13.9 INDIA ELECTRICAL AND ELECTRONICS IN PASSIVE FIRE PROTECTION COATINGS MARKET, BY PRODUCT TYPE, 2018-2033 (USD THOUSAND)
13.9.1 INTUMESCENT COATING
13.9.2 CEMENTITIOUS MATERIAL
13.1 INDIA TEXTILES IN PASSIVE FIRE PROTECTION COATINGS MARKET, BY PRODUCT TYPE, 2018-2033 (USD THOUSAND)
13.10.1 INTUMESCENT COATING
13.10.2 CEMENTITIOUS MATERIAL
13.11 INDIA FURNITURE IN PASSIVE FIRE PROTECTION COATINGS MARKET, BY PRODUCT TYPE, 2018-2033 (USD THOUSAND)
13.11.1 INTUMESCENT COATING
13.11.2 CEMENTITIOUS MATERIAL
13.12 INDIA INFRASTRUCTURE IN PASSIVE FIRE PROTECTION COATINGS MARKET, BY TYPE, 2018-2033 (USD THOUSAND)
13.12.1 TUNNEL
13.12.2 AIRPORT
13.12.3 RAILWAY
13.12.4 OTHERS
13.13 INDIA MARINE IN PASSIVE FIRE PROTECTION COATINGS MARKET, BY TYPE, 2018-2033 (USD THOUSAND)
13.13.1 FERRIES
13.13.2 OTHER VESSEL
14 INDIA PASSIVE FIRE PROTECTION COATINGS MARKET, BY DISTRIBUTION CHANNEL
14.1 OVERVIEW
14.2 INDIA PASSIVE FIRE PROTECTION COATINGS MARKET, BY DISTRIBUTION CHANNEL, 2018-2033 (USD THOUSAND)
14.2.1 INDIRECT
14.2.2 DIRECT
14.3 INDIA INDIRECT IN PASSIVE FIRE PROTECTION COATINGS MARKET, BY TYPE, 2018-2033 (USD THOUSAND)
14.3.1 EPC/ CONTRACTORS/ SYSTEM INTEGRATORS
14.3.2 DISTRIBUTORS
14.3.3 RETAILERS/ DEALERS
15 INDIA PASSIVE FIRE PROTECTION COATINGS MARKET: COMPANY LANDSCAPE
15.1 COMPANY SHARE ANALYSIS: INDIA
16 SWOT ANALYSIS
17 COMPANY PROFILE
17.1 KANSAI NEROLAC PAINTS LIMITED
17.1.1 COMPANY SNAPSHOT
17.1.2 REVENUE ANALYSIS
17.1.3 PRODUCT PORTFOLIO
17.1.4 RECENT DEVELOPMENT
17.2 AKZO NOBEL
17.2.1 COMPANY SNAPSHOT
17.2.2 REVENUE ANALYSIS
17.2.3 PRODUCT PORTFOLIO
17.2.4 RECENT DEVELOPMENT
17.3 NAVAIR INTERNATIONAL PVT LIMITED
17.3.1 COMPANY SNAPSHOT
17.3.2 PRODUCT PORTFOLIO
17.3.3 RECENT DEVEOPMENT
17.4 JOTUN
17.4.1 COMPANY SNAPSHOT
17.4.2 PRODUCT PORTFOLIO
17.4.3 RECENT DEVELOPMENT
17.5 PPG INDUSTRIES
17.5.1 COMPANY SNAPSHOT
17.5.2 REVENUE ANALYSIS
17.5.3 PRODUCT PORTFOLIO
17.5.4 RECENT DEVELOPMENT
17.6 CARBOLINE
17.6.1 COMPANY SNAPSHOT
17.6.2 PRODUCT PORTFOLIO
17.6.3 RECENT DEVELOPMENT
17.7 CHARCOAT
17.7.1 COMPANY SNAPSHOT
17.7.2 PRODUCT PORTFOLIO
17.7.3 RECENT DEVELOPMENT
17.8 ETEX GROUP
17.8.1 COMPANY SNAPSHOT
17.8.2 PRODUCT PORTFOLIO
17.8.3 RECENT DEVELOPMENT
17.9 FEUKEM INDIA PRIVATE LIMITED
17.9.1 COMPANY SNAPSHOT
17.9.2 PRODUCT PORTFOLIO
17.9.3 RECENT DEVEOPMENT
17.1 HEMPEL A/S
17.10.1 COMPANY SNAPSHOT
17.10.2 PRODUCT PORTFOLIO
17.10.3 RECENT DEVELOPMENT
17.11 NEWKEM
17.11.1 COMPANY SNAPSHOT
17.11.2 PRODUCT PORTFOLIO
17.11.3 RECENT DEVELOPMENT
17.12 SAFECOAT FIRE SOLUTIONS
17.12.1 COMPANY SNAPSHOT
17.12.2 PRODUCT PORTFOLIO
17.12.3 RECENT DEVELOPMENT
17.13 THE SHERWIN-WILLIAMS COMPANY
17.13.1 COMPANY SNAPSHOT
17.13.2 REVENUE ANALYSIS
17.13.3 PRODUCT PORTFOLIO
17.13.4 RECENT DEVELOPMENT
17.14 TREMCO INCORPORATED
17.14.1 COMPANY SNAPSHOT
17.14.2 PRODUCT PORTFOLIO
17.14.3 RECENT DEVEOPMENT
17.15 UGAM CHEMICALS
17.15.1 COMPANY SNAPSHOT
17.15.2 PRODUCT PORTFOLIO
17.15.3 RECENT DEVELOPMENT
18 QUESTIONNAIRE
19 RELATED REPORT
List of Table
TABLE 1 RAW MATERIALS AND TYPICAL COATING APPLICATIONS IN FIRE PROTECTION:
TABLE 2 VALUE DISTRIBUTION AND MARGIN DYNAMICS
TABLE 3 COMPARATIVE OVERVIEW OF END USER-SPECIFIC PRIORITIES
TABLE 4 KEY RISKS AND MITIGATION MEASURES IN PFP COATINGS MARKET
TABLE 5 YEARLY OVERVIEW OF COMPANY STRATEGIES AND TRANSACTIONS
TABLE 6 COMPARATIVE OVERVIEW OF FIRE PROTECTION COATINGS BY BRAND:
TABLE 7 COUNTRY-WISE ANTI-DUMPING TARIFFS ON EPOXY RESIN IMPORTS TO INDIA
TABLE 8 INDIA PASSIVE FIRE PROTECTION COATINGS MARKET, BY PRODUCT TYPE, 2018-2033 (USD THOUSAND)
TABLE 9 INDIA INTUMESCENT COATING IN PASSIVE FIRE PROTECTION COATINGS MARKET, BY TYPE, 2018-2033 (USD THOUSAND)
TABLE 10 INDIA CEMENTITIOUS MATERIAL IN PASSIVE FIRE PROTECTION COATINGS MARKET, BY TYPE, 2018-2033 (USD THOUSAND)
TABLE 11 INDIA PASSIVE FIRE PROTECTION COATINGS MARKET, BY TECHNOLOGY,, 2018-2033 (USD THOUSAND)
TABLE 12 INDIA PASSIVE FIRE PROTECTION COATINGS MARKET, BY PRICE RANGE, 2018-2033 (USD THOUSAND)
TABLE 13 INDIA PASSIVE FIRE PROTECTION COATINGS MARKET, BY APPLICATION, 2018-2033 (USD THOUSAND)
TABLE 14 INDIA PASSIVE FIRE PROTECTION COATINGS MARKET, BY FORMULATION, 2018-2033 (USD THOUSAND)
TABLE 15 INDIA PASSIVE FIRE PROTECTION COATINGS MARKET, BY END USE, 2018-2033 (USD THOUSAND)
TABLE 16 INDIA BUILDING & CONSTRUCTION IN PASSIVE FIRE PROTECTION COATINGS MARKET, BY TYPE, 2018-2033 (USD THOUSAND)
TABLE 17 INDIA BUILDING AND CONSTRUCTION IN PASSIVE FIRE PROTECTION COATINGS MARKET, BY PRODUCT TYPE, 2018-2033 (USD THOUSAND)
TABLE 18 INDIA OIL AND GAS IN PASSIVE FIRE PROTECTION COATINGS MARKET, BY CATEGORY,, 2018-2033 (USD THOUSAND)
TABLE 19 INDIA OIL AND GAS IN PASSIVE FIRE PROTECTION COATINGS MARKET, BY PRODUCT TYPE, 2018-2033 (USD THOUSAND)
TABLE 20 INDIA AUTOMOTIVE IN PASSIVE FIRE PROTECTION COATINGS MARKET, BY PRODUCT TYPE, 2018-2033 (USD THOUSAND)
TABLE 21 INDIA AEROSPACE AND DEFENSE IN PASSIVE FIRE PROTECTION COATINGS MARKET, BY PRODUCT TYPE, 2018-2033 (USD THOUSAND)
TABLE 22 INDIA ELECTRICAL AND ELECTRONICS IN PASSIVE FIRE PROTECTION COATINGS MARKET, BY PRODUCT TYPE, 2018-2033 (USD THOUSAND)
TABLE 23 INDIA TEXTILES IN PASSIVE FIRE PROTECTION COATINGS MARKET, BY PRODUCT TYPE, 2018-2033 (USD THOUSAND)
TABLE 24 INDIA FURNITURE IN PASSIVE FIRE PROTECTION COATINGS MARKET, BY PRODUCT TYPE 2018-2033 (USD THOUSAND)
TABLE 25 INDIA INFRASTRUCTURE IN PASSIVE FIRE PROTECTION COATINGS MARKET, BY TYPE 2018-2033 (USD THOUSAND)
TABLE 26 INDIA MARINE IN PASSIVE FIRE PROTECTION COATINGS MARKET, BY TYPE 2018-2033 (USD THOUSAND)
TABLE 27 INDIA PASSIVE FIRE PROTECTION COATINGS MARKET, BY DISTRIBUTION CHANNEL 2018-2033 (USD THOUSAND)
TABLE 28 INDIA INDIRECT IN PASSIVE FIRE PROTECTION COATINGS MARKET, BY TYPE 2018-2033 (USD THOUSAND)
List of Figure
FIGURE 1 INDIA PASSIVE FIRE PROTECTION MARKET: SEGMENTATION
FIGURE 2 INDIA PASSIVE FIRE PROTECTION MARKET: DATA TRIANGULATION
FIGURE 3 INDIA PASSIVE FIRE PROTECTION MARKET: DROC ANALYSIS
FIGURE 4 INDIA PASSIVE FIRE PROTECTION MARKET: GLOBAL VS REGIONAL MARKET ANALYSIS
FIGURE 5 INDIA PASSIVE FIRE PROTECTION MARKET: COMPANY RESEARCH ANALYSIS
FIGURE 6 INDIA PASSIVE FIRE PROTECTION MARKET: PRODUCT LIFE LINE CURVE
FIGURE 7 INDIA PASSIVE FIRE PROTECTION MARKET: MULTIVARIATE MODELLING
FIGURE 8 INDIA PASSIVE FIRE PROTECTION MARKET: INTERVIEW DEMOGRAPHICS
FIGURE 9 INDIA PASSIVE FIRE PROTECTION MARKET: DBMR MARKET POSITION GRID
FIGURE 10 INDIA PASSIVE FIRE PROTECTION MARKET: MARKET APPLICATION COVERAGE GRID
FIGURE 11 INDIA PASSIVE FIRE PROTECTION MARKET: THE MARKET CHALLENGE MATRIX
FIGURE 12 INDIA PASSIVE FIRE PROTECTION MARKET: VENDOR SHARE ANALYSIS
FIGURE 13 INDIA PASSIVE FIRE PROTECTION MARKET: SEGMENTATION
FIGURE 14 EXECUTIVE SUMMARY
FIGURE 15 TWO SEGMENTS COMPRISE THE INDIA PASSIVE FIRE PROTECTION MARKET, BY PRODUCT TYPE (2025)
FIGURE 16 STRATEGIC DECISIONS
FIGURE 17 GROWING CONSTRUCTION INDUSTRY IS DRIVING THE INDIA PASSIVE FIRE PROTECTION MARKET IN THE FORECAST PERIOD OF 2026 TO 2033
FIGURE 18 INTUMESCENT COATING SEGMENT IS EXPECTED TO ACCOUNT FOR THE LARGEST SHARE OF THE INDIA PASSIVE FIRE PROTECTION MARKET IN 2026 & 2033
FIGURE 19 PORTER’S FIVE FORCES
FIGURE 20 INDIA PASSIVE FIRE PROTECTION COATINGS MARKET, 2018-2033, AVERAGE PRICE (USD/KG)
FIGURE 21 SUPPLY CHAIN ANALYSIS
FIGURE 22 DRIVERS, RESTRAINTS, OPPORTUNITIES, AND CHALLENGES OF THE INDIA PASSIVE FIRE PROTECTION MARKET
FIGURE 23 INDIA PASSIVE FIRE PROTECTION COATINGS MARKET, BY PRODUCT TYPE, 2025
FIGURE 24 INDIA PASSIVE FIRE PROTECTION COATINGS MARKET, BY PRODUCT TYPE, 2025
FIGURE 25 INDIA PASSIVE FIRE PROTECTION COATINGS MARKET, BY PRICE RANGE, 2025
FIGURE 26 INDIA PASSIVE FIRE PROTECTION COATINGS MARKET, BY APPLICATION, 2025
FIGURE 27 INDIA PASSIVE FIRE PROTECTION COATINGS MARKET, BY FORMULATION, 2025
FIGURE 28 INDIA PASSIVE FIRE PROTECTION COATINGS MARKET, BY END USE, 2025
FIGURE 29 INDIA PASSIVE FIRE PROTECTION COATINGS MARKET, BY DISTRIBUTION CHANNEL, 2025
FIGURE 30 INDIA PASSIVE FIRE PROTECTION COATINGS MARKET: COMPANY SHARE 2025 (%)
India Passive Fire Protection Market, Supply Chain Analysis and Ecosystem Framework
To support market growth and help clients navigate the impact of geopolitical shifts, DBMR has integrated in-depth supply chain analysis into its India Passive Fire Protection Market research reports. This addition empowers clients to respond effectively to global changes affecting their industries. The supply chain analysis section includes detailed insights such as India Passive Fire Protection Market consumption and production by country, price trend analysis, the impact of tariffs and geopolitical developments, and import and export trends by country and HSN code. It also highlights major suppliers with data on production capacity and company profiles, as well as key importers and exporters. In addition to research, DBMR offers specialized supply chain consulting services backed by over a decade of experience, providing solutions like supplier discovery, supplier risk assessment, price trend analysis, impact evaluation of inflation and trade route changes, and comprehensive market trend analysis.
Data collection and base year analysis are done using data collection modules with large sample sizes. The stage includes obtaining market information or related data through various sources and strategies. It includes examining and planning all the data acquired from the past in advance. It likewise envelops the examination of information inconsistencies seen across different information sources. The market data is analysed and estimated using market statistical and coherent models. Also, market share analysis and key trend analysis are the major success factors in the market report. To know more, please request an analyst call or drop down your inquiry.
The key research methodology used by DBMR research team is data triangulation which involves data mining, analysis of the impact of data variables on the market and primary (industry expert) validation. Data models include Vendor Positioning Grid, Market Time Line Analysis, Market Overview and Guide, Company Positioning Grid, Patent Analysis, Pricing Analysis, Company Market Share Analysis, Standards of Measurement, Global versus Regional and Vendor Share Analysis. To know more about the research methodology, drop in an inquiry to speak to our industry experts.
Data Bridge Market Research is a leader in advanced formative research. We take pride in servicing our existing and new customers with data and analysis that match and suits their goal. The report can be customized to include price trend analysis of target brands understanding the market for additional countries (ask for the list of countries), clinical trial results data, literature review, refurbished market and product base analysis. Market analysis of target competitors can be analyzed from technology-based analysis to market portfolio strategies. We can add as many competitors that you require data about in the format and data style you are looking for. Our team of analysts can also provide you data in crude raw excel files pivot tables (Fact book) or can assist you in creating presentations from the data sets available in the report.


