
Middle East And Africa Anthrax Treatment Market
Market Size in USD Million
 USD
43.50 Million
USD
125.94 Million
2025
2033
USD
43.50 Million
USD
125.94 Million
2025
2033
| 2026 - 2033 | |
| USD 43.50 Million | |
| USD 125.94 Million | |
| % | |
|
Middle East and Africa Anthrax Treatment Market Overview
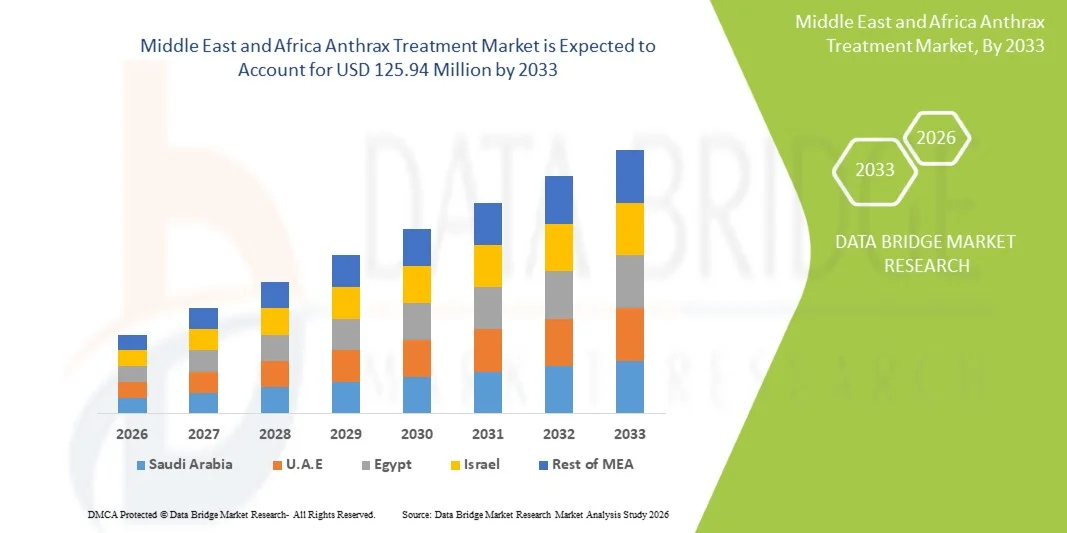
The Middle East and Africa Anthrax Treatment market was valued at USD 43.50 Million in 2025 and is projected to reach USD 125.94 Million by 2033, growing at a CAGR of 5.43% from 2026 to 2033. The Middle East and Africa Anthrax Treatment Market is experiencing steady growth driven by increasing awareness of zoonotic diseases, rising incidence of anthrax outbreaks in livestock-reliant regions, and expanding government initiatives for infectious disease surveillance and preparedness. Growing investments in public health infrastructure and biodefense programs across emerging economies are further supporting market expansion.
The rising risk of anthrax exposure among agricultural workers, veterinarians, and populations in rural livestock-farming areas, combined with strengthening regulatory frameworks for disease control and vaccination programs, is driving demand for effective treatment options including antibiotics, immunoglobulins, and supportive care therapies. In addition, improvements in diagnostic capabilities and faster outbreak response mechanisms are encouraging early detection and timely treatment, thereby reducing mortality rates and supporting sustained adoption of anthrax therapeutics across the Middle East and Africa region.
Key Market Trends & Insights
- Saudi Arabia dominated the Middle East and Africa Anthrax Treatment market with the largest revenue share of 35.3% in 2025, supported by strong healthcare infrastructure, increasing government focus on infectious disease preparedness, advanced public health surveillance systems, and investments in emergency response and biodefense programs.
- The Cutaneous Anthrax segment dominated the market with a 58.42% share in 2025, owing to its higher prevalence compared with other anthrax forms and relatively easier diagnosis and treatment management.
- A.E. emerged as the fastest-growing country in the region, projected to register a CAGR of 7.8% from 2026 to 2033, driven by rising healthcare investments, expansion of advanced diagnostic facilities, increasing focus on biological threat preparedness, and strengthening of infectious disease monitoring and emergency response capabilities.
- Pulmonary Anthrax is expected to be the fastest-growing type segment over the forecast period, owing to increasing focus on early detection, critical care readiness, and biodefense threat preparedness.
- Parenteral route of administration dominated the market in 2025, supported by its rapid therapeutic action and widespread use in hospital emergency treatment protocols for severe anthrax infections.
- Hospitals represented the largest end-user segment in 2025, driven by the availability of intensive care facilities and standardized treatment guidelines for anthrax management.
Market Size & Forecast
- Middle East and Africa Market Value (2025): USD 43.50 Million
- Expected Market Value (2033): USD 125.94 Million
- Forecast CAGR (2026–2033): 5.43%
- Leading Region in 2025: Saudi Arabia
- Fastest Growing Region: U.A.E.
Report Scope and Middle East and Africa Anthrax Treatment Market Segmentation
|
Attributes |
Anthrax Treatment Key Market Insights |
|
Segments Covered |
|
|
Countries Covered |
Middle East and Africa · Saudi Arabia · U.A.E. · South Africa · Egypt · Israel · Rest of Middle East and Africa |
|
Key Market Players |
• Pfizer Inc. (U.S.) |
|
Market Opportunities |
· Increasing Government Investments in Infectious Disease Surveillance and Biodefense Programs · Rising Demand for Effective Anthrax Therapeutics in Livestock-Dependent Regions · Advancements in Diagnostic Technologies and Targeted Treatment Approaches |
|
Value Added Data Infosets |
In addition to the insights on market scenarios such as market value, growth rate, segmentation, geographical coverage, and major players, the market reports curated by the Data Bridge Market Research also include in-depth expert analysis, geographically represented company-wise production and capacity, network layouts of distributors and partners, detailed and updated price trend analysis and deficit analysis of supply chain and demand. |
Middle East and Africa Anthrax Treatment Market Trends
Trend: Rising Focus on Anthrax Preparedness and Advanced Treatment Strategies
Governments, healthcare organizations, and research institutions are increasingly strengthening anthrax preparedness programs due to the potential impact of Bacillus anthracis infections on public health, livestock management, and biodefense. The growing emphasis on rapid diagnosis, availability of effective antibiotics, and development of anthrax antitoxin therapies is shaping treatment market growth. Advanced healthcare systems are adopting improved diagnostic workflows and treatment protocols to reduce mortality associated with severe forms such as inhalational anthrax. In addition, increased investments in biodefense research, vaccine development, and emergency response infrastructure are supporting demand for anthrax treatment solutions globally.
Middle East and Africa Anthrax Treatment Market Dynamics
Key Market Driver: Increasing Government Investments in Biodefense and Infectious Disease Preparedness
Rising government focus on biological threat preparedness is a major driver of the global anthrax treatment market. Countries are expanding strategic stockpiles of antibiotics, vaccines, and anthrax antitoxins to ensure rapid response during potential outbreaks or bioterrorism events. Organizations such as the U.S. Department of Health and Human Services and national public health agencies have supported procurement initiatives for medical countermeasures against biological threats.
For instance, in March 2023, the PharmaEssentia and other biotechnology companies continued advancements in infectious disease and biologic therapy research, reflecting broader industry interest in developing targeted treatment approaches. Similarly, the U.S. Strategic National Stockpile maintains critical medical countermeasures, including antibiotics and vaccines, to support emergency preparedness against biological threats. Increasing government funding for public health security, particularly after global infectious disease challenges, is encouraging continued investment in anthrax treatment development and supply readiness.
Key Restraint/Challenge: Limited Disease Incidence and High Development Complexity
A major challenge for the global anthrax treatment market is the relatively low number of naturally occurring human anthrax cases compared with other infectious diseases, which can limit commercial incentives for extensive drug development. Anthrax treatment products often require specialized research, regulatory approval pathways, and biodefense-focused investments, increasing development complexity and costs.
In addition, maintaining readiness through stockpiling creates challenges related to product shelf life, replacement cycles, and inventory management. Pharmaceutical companies must balance the need for continuous availability of anthrax countermeasures with uncertain demand patterns, making market expansion dependent largely on government procurement programs rather than routine clinical demand.
Key Market Opportunity: Development of Advanced Antitoxins, Vaccines, and Targeted Therapies
The development of next-generation anthrax therapies presents significant growth opportunities for market participants. Advances in monoclonal antibody technology, recombinant vaccines, and targeted antimicrobial approaches are improving treatment effectiveness, particularly for severe infections involving toxin-mediated complications.
For instance, in December 2020, the Elusys Therapeutics anthrax antitoxin Anthim (obiltoxaximab) continued to be recognized as an important medical countermeasure for inhalational anthrax treatment, supporting the role of antitoxin therapies alongside antibiotics. Furthermore, increasing collaboration between governments, biotechnology companies, and research organizations is accelerating innovation in biodefense therapeutics. Emerging markets, including countries across Middle East and Africa and the Middle East, are investing in healthcare infrastructure and emergency preparedness programs, creating additional opportunities for anthrax treatment manufacturers.
Middle East and Africa Anthrax Treatment Market Scope
The Middle East and Africa Anthrax Treatment market is segmented on the basis of Type, Route of Administration, and End User.
- By Type
On the basis of type, the Middle East and Africa Anthrax Treatment market is segmented into Cutaneous Anthrax, Pulmonary Anthrax, and Intestinal Anthrax. The Cutaneous Anthrax segment dominated the market with a 58.42% share in 2025, owing to its higher prevalence compared with other anthrax forms and relatively easier diagnosis and treatment management. Cutaneous anthrax accounts for the majority of reported infections, particularly in regions with significant livestock exposure, agricultural activities, and occupational risks among farmers, veterinarians, and animal handlers. The segment benefits from widespread availability of antibiotic therapies, including oral and injectable treatment options, along with increasing awareness regarding early diagnosis and infection management. Government disease surveillance programs and improved healthcare access across Middle East and Africa countries are further supporting segment growth.
The Pulmonary Anthrax segment is projected to register the fastest growth at a CAGR of 6.8% from 2026 to 2033, driven by increasing focus on advanced diagnostic capabilities, biodefense preparedness, and rapid treatment approaches for severe anthrax infections. Pulmonary anthrax is considered one of the most serious forms due to its high mortality risk and potential association with biological threats, creating demand for specialized therapeutic solutions. Rising investments in infectious disease preparedness, emergency healthcare infrastructure, and research activities are expected to accelerate adoption of advanced treatment options for this segment.
- By Route of Administration
On the basis of route of administration, the Middle East and Africa Anthrax Treatment market is segmented into Oral, Parenteral, and Others. The Parenteral segment dominated the market with a 52.67% share in 2025, supported by the extensive use of injectable antibiotics and therapies for severe anthrax cases requiring rapid drug action and controlled treatment delivery. Parenteral administration is widely preferred in hospitals and emergency healthcare settings, particularly for patients with systemic infections or advanced disease conditions. Increasing hospitalization rates associated with severe anthrax infections, improved healthcare infrastructure, and availability of injectable antimicrobial therapies are contributing to the strong market position of this segment.
The Oral segment is expected to witness the fastest CAGR of 6.5% from 2026 to 2033, driven by growing adoption of convenient outpatient treatment options and increasing use of oral antibiotics for early-stage and less severe anthrax infections. Expansion of healthcare access in rural and developing regions, along with rising awareness among healthcare providers regarding timely treatment initiation, is supporting segment growth. In addition, oral therapies offer advantages such as ease of administration, lower treatment complexity, and improved patient compliance, further boosting demand across Middle East and Africa markets.
- By End User
On the basis of end user, the Middle East and Africa Anthrax Treatment market is segmented into Government Organizations, Hospitals, Academic & Research Institutes, and Others. The Hospitals segment dominated the market with a 46.35% share in 2025, due to their central role in diagnosis, patient management, emergency treatment, and administration of advanced anthrax therapies. Hospitals are increasingly adopting improved diagnostic tools, antimicrobial treatments, and infection control protocols to manage anthrax cases effectively. In addition, the growing burden of zoonotic diseases, rising healthcare expenditure, and strengthening medical infrastructure across Middle East and Africa countries are supporting the dominance of hospitals in the market.
The Government Organizations segment is expected to witness the fastest CAGR of 7.1% from 2026 to 2033, driven by increasing investments in public health surveillance, outbreak prevention programs, and biodefense initiatives. Government agencies are focusing on strengthening disease monitoring systems, improving emergency preparedness, and ensuring availability of anthrax treatment resources during outbreaks. Furthermore, collaborations between government bodies, healthcare institutions, and research organizations for infectious disease control are expected to create significant growth opportunities for this segment.
Middle East and Africa Anthrax Treatment Market Regional Analysis
The Middle East and Africa Anthrax Treatment market is expected to witness significant growth, driven by increasing government focus on infectious disease preparedness, strengthening healthcare infrastructure, and rising investments in public health surveillance and emergency response capabilities. Countries across the region are enhancing their capacity for early detection, diagnosis, and treatment of anthrax through improved healthcare systems, laboratory networks, and medical countermeasure initiatives. The growing need for effective antibiotics, antitoxin therapies, and outbreak management solutions is supporting regional market expansion. In addition, rising investments in hospital infrastructure, biotechnology research, and government-led preparedness programs are contributing to increased adoption of anthrax treatment solutions across the Middle East and Africa region.
China Anthrax Treatment Market Insight
The Saudi Arabia Anthrax Treatment market dominated the Middle East and Africa region with the largest revenue share of 35.3% in 2025, supported by strong healthcare infrastructure, increasing government focus on infectious disease preparedness, advanced public health surveillance systems, and investments in emergency response and biodefense programs. The country’s growing emphasis on strengthening biological threat preparedness and improving healthcare resilience is increasing demand for anthrax treatment solutions, including antibiotics, vaccines, and antitoxin therapies. Saudi Arabia’s expanding healthcare network, modernization of medical facilities, and government initiatives focused on disease prevention and emergency preparedness are further supporting market growth. In addition, increasing collaboration between healthcare organizations, research institutions, and government agencies for infectious disease monitoring and response planning is expected to strengthen anthrax treatment adoption across the country.
India Anthrax Treatment Market Insight
The U.A.E. Anthrax Treatment market is projected to be the fastest-growing market in the Middle East and Africa region, registering a CAGR of 7.8% from 2026 to 2033, driven by rising healthcare investments, expansion of advanced diagnostic facilities, increasing focus on biological threat preparedness, and strengthening of infectious disease monitoring and emergency response capabilities. The country’s focus on developing advanced healthcare infrastructure, improving laboratory capabilities, and adopting modern disease surveillance technologies is supporting the growth of anthrax treatment solutions. In addition, increasing investments in emergency healthcare systems, biotechnology research, and public health preparedness initiatives are enhancing the availability and adoption of advanced treatment options. The growing involvement of government organizations in healthcare security programs, outbreak response planning, and medical preparedness initiatives is positioning the U.A.E. as a key growth market for anthrax treatment in the region.
Middle East and Africa Anthrax Treatment Market Share
The Anthrax Treatment industry is primarily led by well-established companies, including:
- Pfizer Inc. (U.S.)
- Bayer AG (Germany)
- GlaxoSmithKline plc (U.K.)
- Sanofi (France)
- Merck & Co., Inc. (U.S.)
- Johnson & Johnson (U.S.)
- AstraZeneca plc (U.K.)
- Novartis AG (Switzerland)
- F. Hoffmann-La Roche Ltd. (Switzerland)
- Cipla Limited (India)
- Sun Pharmaceutical Industries Ltd. (India)
- Dr. Reddy’s Laboratories Ltd. (India)
- Lupin Limited (India)
- Mylan N.V. (Viatris Inc.) (U.S.)
- Teva Pharmaceutical Industries Ltd. (Israel)
- Eli Lilly and Company (U.S.)
- Takeda Pharmaceutical Company Limited (Japan)
- CSL Limited (Australia)
- Biogen Inc. (U.S.)
- Serum Institute of India Pvt. Ltd. (India)
- Bharat Biotech International Limited (India)
- Aurobindo Pharma Limited (India)
- Hetero Labs Limited (India)
- Intas Pharmaceuticals Ltd. (India)
- Zydus Lifesciences Limited (India)
- Alembic Pharmaceuticals Limited (India)
- Nicholas Piramal India Limited (India)
- Wockhardt Limited (India)
- Shanghai Pharmaceuticals Holding Co., Ltd. (China)
- Sinopharm Group Co., Ltd. (China)
- Takara Bio Inc. (Japan)
- Mitsubishi Tanabe Pharma Corporation (Japan)
- Otsuka Pharmaceutical Co., Ltd. (Japan)
- Kaken Pharmaceutical Co., Ltd. (Japan)
- Sandoz International GmbH (Switzerland)
- Pfizer Australia Pty Ltd (Australia)
- Korea Pharma Co., Ltd. (South Korea)
- Hanmi Pharmaceutical Co., Ltd. (South Korea)
- Celltrion Inc. (South Korea)
Latest Developments in Middle East and Africa Anthrax Treatment Market
- In January 2021, the U.S. Food and Drug Administration (FDA) approved the labeling update for Anthim (obiltoxaximab), an anthrax antitoxin developed by Elusys Therapeutics, to include additional information supporting its use as part of the treatment approach for inhalational anthrax. Anthim is a monoclonal antibody therapy designed to neutralize Bacillus anthracis protective antigen and is used in combination with appropriate antibacterial drugs. The continued regulatory support for Anthim strengthened the availability of targeted antitoxin therapies for biodefense preparedness programs
- In October 2021, the Biomedical Advanced Research and Development Authority (BARDA) continued collaboration with biotechnology companies to advance medical countermeasures against biological threats, including anthrax. These initiatives focused on maintaining national preparedness through the development, procurement, and stockpiling of vaccines, antibiotics, and antitoxin therapies to address potential anthrax exposure scenarios
- In March 2022, the U.S. government expanded efforts under its Project BioShield and Strategic National Stockpile programs to maintain access to critical medical countermeasures, including anthrax-related treatments and vaccines. The initiative supported continued demand for anthrax treatment products by ensuring availability of emergency therapeutics and strengthening biodefense readiness against biological threats
- In September 2022, Emergent BioSolutions continued supplying BioThrax (Anthrax Vaccine Adsorbed), the first FDA-approved anthrax vaccine, for U.S. government biodefense preparedness programs. The vaccine remained a key component of anthrax prevention strategies, supporting government procurement activities and reinforcing the importance of anthrax countermeasures in national security healthcare planning
- In April 2023, the U.S. Department of Health and Human Services (HHS) announced continued investment in medical countermeasures through BARDA to strengthen preparedness against biological threats, including anthrax. These investments supported research, development, manufacturing capacity, and availability of critical therapies required for rapid response to potential outbreaks or intentional biological incidents
- In November 2023, researchers continued advancing next-generation anthrax therapeutic approaches, including monoclonal antibody-based treatments and improved antimicrobial strategies aimed at addressing toxin-mediated disease progression. These developments highlighted the growing focus on targeted therapies that can complement traditional antibiotic treatment, particularly for severe forms such as inhalational anthrax
- In February 2024, Emergent BioSolutions announced continued support for U.S. government biodefense initiatives through supply agreements involving medical countermeasures, including anthrax vaccine solutions. The company’s ongoing involvement emphasized the importance of reliable manufacturing capacity and long-term availability of anthrax prevention products for national preparedness programs
- In July 2024, the U.S. government continued procurement activities for anthrax-related medical countermeasures through the Strategic National Stockpile, supporting sustained demand for anthrax vaccines, antibiotics, and antitoxin therapies. These procurement initiatives reflected increasing emphasis on maintaining readiness for biological emergencies and improving response capabilities
- In March 2025, biotechnology and public health organizations continued research efforts focused on improving anthrax diagnosis, treatment response, and biodefense preparedness through advanced biological research platforms. Ongoing innovation in monoclonal antibodies, vaccine technologies, and rapid diagnostic methods supported the long-term development of the global anthrax treatment ecosystem
- In August 2025, global biodefense programs continued emphasizing integrated anthrax preparedness strategies combining vaccination, antibiotic therapy, antitoxin availability, and emergency response planning. The increasing focus on biological threat management supported continued investment in anthrax treatment solutions and strengthened market opportunities for pharmaceutical and biotechnology companies involved in infectious disease countermeasures
SKU-

- Interactive Data Analysis Dashboard
- Company Analysis Dashboard for high growth potential opportunities
- Research Analyst Access for customization & queries
- Competitor Analysis with Interactive dashboard
- Latest News, Updates & Trend analysis
- Harness the Power of Benchmark Analysis for Comprehensive Competitor Tracking
Data collection and base year analysis are done using data collection modules with large sample sizes. The stage includes obtaining market information or related data through various sources and strategies. It includes examining and planning all the data acquired from the past in advance. It likewise envelops the examination of information inconsistencies seen across different information sources. The market data is analysed and estimated using market statistical and coherent models. Also, market share analysis and key trend analysis are the major success factors in the market report. To know more, please request an analyst call or drop down your inquiry.
The key research methodology used by DBMR research team is data triangulation which involves data mining, analysis of the impact of data variables on the market and primary (industry expert) validation. Data models include Vendor Positioning Grid, Market Time Line Analysis, Market Overview and Guide, Company Positioning Grid, Patent Analysis, Pricing Analysis, Company Market Share Analysis, Standards of Measurement, Global versus Regional and Vendor Share Analysis. To know more about the research methodology, drop in an inquiry to speak to our industry experts.
Data Bridge Market Research is a leader in advanced formative research. We take pride in servicing our existing and new customers with data and analysis that match and suits their goal. The report can be customized to include price trend analysis of target brands understanding the market for additional countries (ask for the list of countries), clinical trial results data, literature review, refurbished market and product base analysis. Market analysis of target competitors can be analyzed from technology-based analysis to market portfolio strategies. We can add as many competitors that you require data about in the format and data style you are looking for. Our team of analysts can also provide you data in crude raw excel files pivot tables (Fact book) or can assist you in creating presentations from the data sets available in the report.


