
Middle East And Africa Cancer Supportive Care Products Market
Market Size in USD Million
 USD
866.40 Million
USD
1,023.11 Million
2024
2032
USD
866.40 Million
USD
1,023.11 Million
2024
2032
| 2025 - 2032 | |
| USD 866.40 Million | |
| USD 1,023.11 Million | |
| % | |
|
MEA Cancer Supportive Care Products Market Size
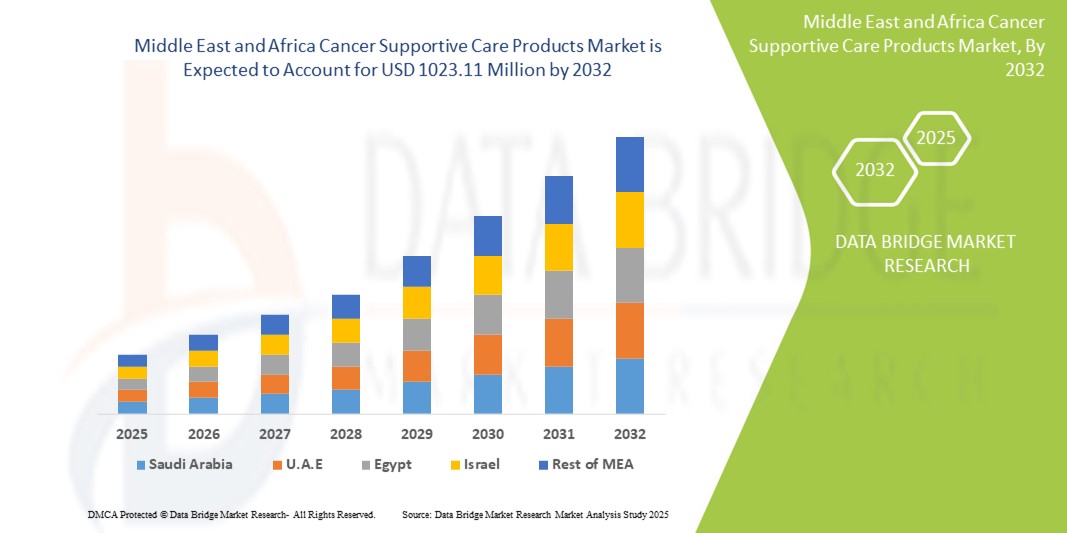
- The MEA cancer supportive care products market size was valued at USD 866.4 Million in 2024 and is expected to reach USD 1023.11 Million by 2032, at a CAGR of 2.1% during the forecast period.
- The market trend is primarily influenced by the rising incidence of cancer in the region and the increasing focus on improving the quality of life for cancer patients, despite the growing availability of generic and biosimilar drugs which can impact revenue.
- Furthermore, ongoing advancements in oncology treatments and increasing awareness about managing treatment-related side effects are driving the demand for supportive care solutions, establishing them as an integral part of comprehensive cancer management. These factors, alongside efforts to improve healthcare infrastructure, are shaping the trajectory of the industry.
MEA Cancer Supportive Care Products Market Analysis
- Cancer supportive care products, offering essential relief and management for side effects arising from cancer treatments like chemotherapy and radiotherapy, are increasingly vital components of comprehensive oncology care in the MEA region due to their crucial role in enhancing patient well-being, treatment adherence, and overall quality of life.
- The fluctuating demand for these products is primarily driven by the continuous rise in cancer cases, the persistent need to mitigate severe treatment side effects, and a growing emphasis on holistic patient care that extends beyond tumor-directed therapy.
- While specific regional dominance data for MEA within the global market is not consistently available, the region is characterized by varying levels of healthcare development, with countries like Saudi Arabia, UAE, and Qatar showing advancements in healthcare systems, which are expected to increase demand for supportive care products. However, some African countries face challenges with adequate healthcare infrastructure, though initiatives with WHO and other organizations are working to improve this.
- The Antiemetics segment dominates the MEA cancer supportive care products market with a market share of 27.1% in 2024, driven by the high prevalence of chemotherapy-induced nausea and vomiting (CINV) and their critical role in patient comfort and treatment completion.
Report Scope and Segmentation of MEA Cancer Supportive Care Products Market
|
Attributes |
MEA Cancer Supportive Care Products Market Key Market Insights |
|
Segments Covered |
|
|
Countries Covered |
Middle East and Africa
|
|
Key Market Players |
|
|
Market Opportunities |
|
|
Value Added Data Infosets |
In addition to the insights on market scenarios such as market value, growth rate, segmentation, geographical coverage, and major players, the market reports curated by Data Bridge Market Research also include in-depth expert analysis, pricing analysis, brand share analysis, consumer survey, demography analysis, supply chain analysis, value chain analysis, raw material/consumables overview, vendor selection criteria, PESTLE Analysis, Porter Analysis, and regulatory framework. |
MEA Cancer Supportive Care Products Market Trends
"Expanding Treatment Modalities and Holistic Patient Care"
- A significant and accelerating trend in the MEA cancer supportive care products market is the broadening of treatment modalities to encompass a more holistic approach to patient care, moving beyond just disease management to improving overall well-being during and after cancer therapy. This comprehensive approach is significantly enhancing patient outcomes and quality of life.
- For instance, the increased focus on managing chemotherapy-induced peripheral neuropathy with novel pain management strategies, or the growing emphasis on nutritional support and psychological counseling alongside conventional treatments. Similarly, the integration of palliative care early in the cancer journey highlights a shift towards a more complete patient experience.
- The evolution of supportive care enables features such as proactive management of treatment side effects, leading to better patient adherence to demanding protocols and providing more intelligent interventions based on individual patient needs. For instance, some advanced antiemetic regimens utilize a multi-drug approach to improve control over nausea and vomiting. Furthermore, enhanced patient education and empowerment offer patients the understanding to better manage their symptoms and participate actively in their recovery.
- The seamless integration of supportive care products with overall cancer treatment plans facilitates centralized management of patient symptoms alongside tumor response and other clinical parameters, creating a unified and optimized care experience.
- This trend towards more integrated, patient-centric, and proactive supportive care systems is fundamentally reshaping patient expectations for cancer treatment. Consequently, healthcare providers and pharmaceutical companies are developing new products and protocols aimed at addressing a wider spectrum of cancer-related complications.
- The demand for cancer supportive care products that offer comprehensive symptom management and enhance patient well-being is growing steadily across various healthcare settings, as oncologists and patients increasingly prioritize holistic care and improved treatment tolerability.
MEA Cancer Supportive Care Products Market Dynamics
Driver:
"Rising Cancer Incidence and Evolving Treatment Landscapes"
- The increasing prevalence of various cancer types across the Middle East and Africa, coupled with the continuous evolution of cancer treatment protocols, is a significant driver for the heightened demand for supportive care products.
- For instance, the expansion of access to chemotherapy and radiation therapies in the region means a larger patient pool experiencing related side effects, thereby increasing the need for supportive care. Such advancements in cancer care are expected to drive the supportive care products industry growth in the forecast period.
- As healthcare systems become more sophisticated in diagnosing and treating cancer, and as patients undergo more intensive and prolonged therapies, supportive care products offer essential relief from adverse effects such as nausea, fatigue, pain, and neutropenia, providing a compelling necessity for managing these complications effectively.
- Furthermore, the growing adoption of novel cancer therapies, including targeted therapies and immunotherapies, which also have their own distinct side effect profiles, is making supportive care an integral component of these advanced treatment paradigms, offering seamless management alongside specific anti-cancer agents.
- The convenience of symptom control, improved patient adherence to treatment regimens, and the ability to enhance overall quality of life during and after cancer therapy are key factors propelling the adoption of supportive care products across hospitals, clinics, and homecare settings. The increasing focus on patient-reported outcomes and the rising awareness among healthcare professionals about the importance of supportive care further contribute to market growth.
Restraint/Challenge:
"Pricing Pressures and Limited Reimbursement Frameworks"
- Concerns surrounding the pricing pressures on generic and biosimilar drugs, alongside the limitations of reimbursement frameworks for supportive care products in some MEA countries, pose a significant challenge to broader market penetration. As many supportive care medications have generic equivalents or biosimilars entering the market, this leads to price erosion, raising anxieties among manufacturers about revenue sustainability.
- For instance, high-profile reports of budget constraints within healthcare systems and varying insurance coverage for supportive care treatments have made some patients and providers hesitant to fully utilize the spectrum of available products, including novel or higher-priced options.
- Addressing these pricing and reimbursement concerns through robust economic evaluations, advocacy for broader insurance coverage, and the development of value-based care models is crucial for building sustainable market access. Companies such as local pharmaceutical manufacturers emphasize their efforts to provide affordable options and work with governments to secure favorable reimbursement. Additionally, the relatively high cost of some advanced supportive care therapies compared to traditional treatments can be a barrier to adoption for price-sensitive healthcare systems or for patients with limited out-of-pocket capacity, particularly in developing regions or for less affluent populations. While basic supportive care products have become more accessible, specialized or novel therapies often come with a higher price tag.
- While efforts are being made to reduce costs and expand access, the perceived financial burden for certain supportive care technologies can still hinder widespread adoption, especially for those who do not have comprehensive insurance coverage or government support.
- Overcoming these challenges through enhanced market access strategies, consumer education on the long-term benefits of supportive care, and the development of more affordable and accessible product options will be vital for sustained market growth.
MEA Cancer Supportive Care Products Market Scope
The market is segmented on the basis of type, indication, distribution channel, and application.
- By Type:
On the basis of type, the MEA cancer supportive care products market is segmented into Granulocyte Colony Stimulating Factors (G-CSFs), Erythropoiesis Stimulating Agents (ESAs), Antiemetics, Bisphosphonates, Opioid Analgesics, Nonsteroidal Anti-Inflammatory Drugs (NSAIDs), Anti-Infectives, Monoclonal Antibodies, and Others. The Antiemetics segment dominates the largest market revenue share of 27.1% in 2024, driven by the high prevalence of chemotherapy-induced nausea and vomiting (CINV) and their critical role in patient comfort and treatment completion. Oncologists often prioritize antiemetic supportive care for their immediate impact on patient well-being and the straightforward management of a common and distressing side effect. The market also sees strong demand for antiemetic types due to their compatibility with various chemotherapy regimens and the availability of diverse formulations enhancing patient adherence.
The Granulocyte Colony Stimulating Factors (G-CSFs) segment is anticipated to witness significant growth rate from 2024 to 2032, fueled by increasing adoption in managing chemotherapy-induced neutropenia and their critical role in enabling patients to complete their planned chemotherapy cycles. G-CSFs offer vital support in preventing severe infections, making them suitable for patients undergoing myelosuppressive treatments, and their integration into standard oncology guidelines provides healthcare providers with essential tools for managing treatment complications. The growing incidence of cancers requiring intensive chemotherapy also contributes to their growing popularity.
- By Indication:
On the basis of indication, the MEA cancer supportive care products market is segmented into Chemotherapy-Induced Nausea and Vomiting (CINV), Chemotherapy-Induced Anemia, Chemotherapy-Induced Neutropenia, Cancer Pain, Oral Mucositis and Dry Mouth, Bone Metastases, Fatigue, and Others. The Chemotherapy-Induced Nausea and Vomiting (CINV) segment held the largest market revenue share in 2024, driven by the high incidence and significant impact of CINV on patient quality of life and treatment adherence. Management of CINV is a top priority for oncology care, and the widespread availability of effective antiemetics contributes to this segment's dominance.
The Chemotherapy-Induced Neutropenia segment is expected to witness significant growth of 6.4% from 2025 to 2032, driven by its critical importance in preventing life-threatening infections in immunocompromised cancer patients and its direct link to enabling the completion of chemotherapy cycles. Proactive management of neutropenia is a standard practice in oncology, making G-CSFs and related products highly sought after.
- By Distribution Channel:
On the basis of distribution channel, the MEA cancer supportive care products market is segmented into Hospital Pharmacies, Retail Pharmacies, Compounding Pharmacies, and Online Pharmacies. The Hospital Pharmacies segment held the largest market revenue share in 2024, driven by the direct administration of many supportive care products during or immediately after chemotherapy cycles in hospital settings. Hospital pharmacies serve as the primary point of dispense for specialized oncology drugs and related supportive care.
The Retail Pharmacies segment is expected to witness significant growth from 2025 to 2032, driven by the increasing shift towards outpatient cancer care and the growing convenience for patients to access supportive care medications closer to their homes. Retail pharmacies play a crucial role in providing ongoing symptom management solutions to patients outside of hospital visits.
- By Application:
On the basis of application, the MEA cancer supportive care products market is segmented into Hospitals & Clinics, Homecare Settings, Specialty Centers, and Others. The Hospitals & Clinics segment accounted for the largest market revenue share in 2024, driven by the fact that the majority of cancer treatments, including chemotherapy and radiation, are administered in these facilities, thus requiring immediate access to supportive care products. Hospitals and clinics also manage acute side effects and provide comprehensive patient monitoring.
The Homecare Settings segment is expected to witness the fastest CAGR from 2025 to 2032, driven by the growing trend towards value-based care, increased patient preference for receiving care in their own homes, and advancements in drug delivery systems that enable self-administration of certain supportive care products. Homecare offers enhanced comfort and convenience for patients undergoing prolonged treatments.
MEA Cancer Supportive Care Products Market Regional Analysis
- The Middle East and Africa (MEA) region is experiencing significant growth in the cancer supportive care products market, driven by the rising burden of cancer, increasing healthcare expenditure, and a growing emphasis on improving patient quality of life.
- Healthcare providers and patients in the region increasingly value the comprehensive management of treatment-related side effects and the enhanced well-being offered by supportive care products.
- This expanding adoption is further supported by improving healthcare infrastructure, a growing awareness of the importance of holistic cancer care, and the increasing availability of specialized oncology services, establishing supportive care products as a crucial component of cancer management across the MEA region.
MEA Cancer Supportive Care Products Market Insight
- South Africa Cancer Supportive Care Products Market Insight
The South Africa cancer supportive care products market is experiencing substantial growth, fueled by a rising cancer incidence and the expanding access to oncology treatments. Consumers and healthcare providers are increasingly prioritizing the effective management of treatment side effects through comprehensive supportive care solutions. The growing preference for patient-centric care models, combined with increasing awareness of the benefits of supportive care in improving treatment outcomes, further propels the supportive care products industry. Moreover, the increasing investment in healthcare infrastructure and the availability of a wider range of supportive care products are significantly contributing to the market's expansion.
- Saudi Arabia Cancer Supportive Care Products Market Insight
The Saudi Arabia cancer supportive care products market is projected to expand at a substantial CAGR throughout the forecast period, primarily driven by significant government investments in healthcare, a rising cancer burden, and the escalating demand for advanced medical treatments. The increase in specialized oncology centers, coupled with the demand for comprehensive patient care, is fostering the adoption of supportive care products. Saudi Arabian healthcare professionals are also drawn to the efficacy and patient comfort these products offer. The region is experiencing significant growth across hospital, clinic, and homecare applications, with supportive care products being incorporated into both established treatment protocols and emerging personalized medicine approaches.
- U.A.E. Cancer Supportive Care Products Market Insight
The U.A.E. cancer supportive care products market is expected to grow at a notable CAGR 6.5% during the forecast period, driven by the escalating trend of medical tourism, high disposable incomes, and a desire for heightened healthcare standards and patient well-being. Additionally, concerns regarding treatment-related side effects and patient comfort are encouraging both healthcare providers and patients to choose comprehensive supportive care solutions. The U.A.E.'s embrace of advanced medical technologies, alongside its robust healthcare infrastructure and insurance coverage, is expected to continue to stimulate market growth.
- Egypt Cancer Supportive Care Products Market Insight
The Egypt cancer supportive care products market is expected to expand at a substantial CAGR of 5.8% during the forecast period, fueled by increasing awareness of cancer and its associated treatment complications, and the demand for accessible and affordable supportive care solutions. Egypt's improving healthcare infrastructure, combined with its large patient population, promotes the adoption of supportive care products, particularly in public and private hospitals. The integration of supportive care into standard oncology protocols is also becoming increasingly prevalent, with a strong preference for cost-effective, yet efficacious, solutions aligning with local healthcare priorities.
- Israel Cancer Supportive Care Products Market Insight
The Israel cancer supportive care products market is gaining traction,supported by the country's advanced medical research capabilities, high standard of healthcare, and demand for innovative therapeutic solutions. The Israeli market places a significant emphasis on cutting-edge oncology treatments, and the adoption of supportive care products is driven by the increasing number of cancer diagnoses and a strong focus on patient quality of life during treatment. The integration of supportive care products with other advanced medical technologies and personalized medicine approaches is fueling growth. Moreover, Israel's robust pharmaceutical sector and active research and development initiatives are likely to spur demand for novel and improved supportive care solutions in both hospital and outpatient settings.
MEA Cancer Supportive Care Products Market Share
The MEA cancer supportive care products industry is primarily led by well-established global pharmaceutical companies with a strong presence in oncology and a growing focus on the MEA region. These include:
- Amgen Inc. (U.S.)
- Novartis AG (Switzerland)
- Merck & Co. Inc. (U.S.)
- F. Hoffmann-La Roche AG (Switzerland)
- Johnson & Johnson (U.S.)
- Helsinn Healthcare SA (Switzerland)
- Heron Therapeutics (U.S.)
- GSK plc (U.K.)
- Teva Pharmaceutical Industries Ltd. (Israel)
- Baxter International Inc. (U.S.)
- Sanofi (France)
- Sun Pharmaceutical Industries Ltd. (India)
Latest Developments in MEA Cancer Supportive Care Products Market
- In October 2024, OncoZenge AB announced its intention to partner with Pharmanovia for the commercialization of BupiZenge in Europe, the Middle East, and Northern Africa (the “EMENA region”). This intended agreement focuses on addressing oral mucositis pain, a common and debilitating side effect of cancer treatments, highlighting a commitment to improving patient quality of life in the region.
- In May 2024, Barkat Pharmaceutical Group Through its subsidiary Sobhan Oncology introduced five new anticancer and antifungal drugs, helping meet domestic demand and expand exports—marking them as the first oncology drug manufacturer in the Middle East region
SKU-

- Interactive Data Analysis Dashboard
- Company Analysis Dashboard for high growth potential opportunities
- Research Analyst Access for customization & queries
- Competitor Analysis with Interactive dashboard
- Latest News, Updates & Trend analysis
- Harness the Power of Benchmark Analysis for Comprehensive Competitor Tracking
Table of Content
1 INTRODUCTION
1.1 OBJECTIVES OF THE STUDY
1.2 MARKET DEFINITION
1.3 OVERVIEW OF MIDDLE EAST AND AFRICA CANCER SUPPORTIVE CARE PRODUCTS MARKET
1.4 CURRENCY AND PRICING
1.5 LIMITATIONS
1.6 MARKETS COVERED
2 MARKET SEGMENTATION
2.1 MARKETS COVERED
2.2 GEOGRAPHICAL SCOPE
2.3 YEARS CONSIDERED FOR THE STUDY
2.4 DBMR TRIPOD DATA VALIDATION MODEL
2.5 PRIMARY INTERVIEWS WITH KEY OPINION LEADERS
2.6 MULTIVARIATE MODELLING
2.7 DRUG TYPE LIFELINE CURVE
2.8 DBMR MARKET POSITION GRID
2.9 VENDOR SHARE ANALYSIS
2.1 SECONDARY SOURCES
2.11 ASSUMPTIONS
3 EXECUTIVE SUMMARY
4 EGULATORY
5 MARKET OVERVIEW
5.1 DRIVERS
5.1.1 GROWING CANCER BURDEN WORLDWIDE
5.1.2 INCREASING INITIATIVES BY GOVERNMENT AND OTHER HEALTHCARE ORGANIZATIONS
5.1.3 GROWING GERIATRIC POPULATION
5.1.4 RISING NUMBER OF PRODUCT APPROVAL
5.1.5 RISING EXPENDITURE ON HEALTHCARE
5.2 RESTRAINTS
5.2.1 ADVERSE EFFECTS AND RISKS ASSOCIATED WITH CANCER SUPPORTIVE DRUGS
5.2.2 LACK OF EARLY DETECTION
5.3 OPPORTUNITIES
5.3.1 ACQUISITION AND AGREEMENT BY MAJOR PLAYERS
5.3.2 RISING PRODUCT LAUNCHES
5.3.3 GROWING R&D ACTIVITIES
5.4 CHALLENGES
5.4.1 STRINGENT REGULATION POLICY
5.4.2 PATENT EXPIRY OF DRUGS
6 COVID-19 IMPACT ON MIDDLE EAST AND AFRICA CANCER SUPPORTIVE CARE PRODUCTS MARKET
6.1 PRICE IMPACT
6.2 IMPACT ON SUPPLY CHAIN
6.3 IMPACT ON DEMAND
6.4 STRATEGIC DECISIONS FOR MANUFACTURERS
6.5 CONCLUSION
7 MIDDLE EAST AND AFRICA CANCER SUPPORTIVE CARE PRODUCTS MARKET, BY DRUG TYPE
7.1 OVERVIEW
7.2 GRANULOCYTE COLONY STIMULATING FACTOR (GCSFS)
7.2.1 LONG ACTING FILGRASTIM
7.2.2 FILGRASTIM
7.2.3 LENOGRASTIM
7.3 ERYTHROPOIETIN STIMULATING AGENTS (ESA’S)
7.3.1 EPO-Α/Β
7.3.2 DPO
7.3.3 CERA
7.3.4 EPO-Κ
7.4 OPIOID ANALGESICS
7.4.1 FENTANYL
7.4.2 METHADONE
7.4.3 TRAMADOL
7.4.4 OTHERS
7.5 MONOCLONAL ANTIBODIES
7.6 NONSTEROIDAL ANTI-INFLAMMATORY DRUGS (NSAIDS)
7.6.1 OTC NSAIDS
7.6.1.1 ASPIRIN
7.6.1.2 IBUPROFEN
7.6.1.3 NAPROXEN SODIUM
7.6.2 PRESCRIPTION NSAIDS
7.6.2.1 CELECOXIB
7.6.2.2 DICLOFENAC
7.6.2.3 INDOMETHACIN
7.6.2.4 KETOROLAC
7.6.2.5 MELOXICAM
7.6.2.6 NABUMETONE
7.6.2.7 NAPROXEN
7.6.2.8 OXAPROZIN
7.6.2.9 PIROXICAM
7.6.2.10 SULINDAC
7.6.2.11 OTHERS
7.7 BISPHOSPHONATES
7.7.1 ZOLEDRONIC ACID OR ZOLEDRONATE
7.7.2 DISODIUM PAMIDRONATE
7.7.3 IBANDRONIC ACID OR IBANDRONATE
7.7.4 SODIUM CLODRONATE
7.8 ANTI-EMETICS
7.8.1 APREPITANT
7.8.2 DEXAMETHASONE
7.8.3 DOLASETRON
7.8.4 GRANISETRON
7.8.5 ONDANSETRON
7.8.6 PALONOSETRON
7.8.7 PROCHLORPERAZINE
7.8.8 ROLAPITANT
7.8.9 OTHERS
7.9 ANTIHISTAMINES
7.9.1 HYDROXYZINE
7.9.2 DIPHENHYDRAMINE
7.9.3 OTHERS
7.1 OTHERS
8 MIDDLE EAST AND AFRICA CANCER SUPPORTIVE CARE PRODUCTS MARKET, BY TYPE
8.1 OVERVIEW
8.2 BRANDED
8.2.1 NEULASTA
8.2.2 ARANESP
8.2.3 PROLIA
8.2.4 XGEVA
8.2.5 EPOGEN
8.2.6 EPREX
8.2.7 NEUPOGEN
8.2.8 OTHERS
8.3 GENERICS
9 MIDDLE EAST AND AFRICA CANCER SUPPORTIVE CARE PRODUCTS MARKET, BY CANCER TYPE
9.1 OVERVIEW
9.2 LUNG CANCER
9.3 BREAST CANCER
9.4 PROSTATE CANCER
9.5 LIVER CANCER
9.6 BLADDER CANCER
9.7 LEUKAEMIA
9.8 MELANOMA
9.9 OVARIAN CANCER
9.1 OTHER CANCERS
10 MIDDLE EAST AND AFRICA CANCER SUPPORTIVE CARE PRODUCTS MARKET, BY END USER
10.1 OVERVIEW
10.2 HOSPITALS
10.2.1 ACUTE CARE HOSPITALS
10.2.2 LONG-TERM CARE HOSPITALS
10.2.3 NURSING FACILITIES
10.3 CLINICS
10.4 HOSPITALS & ACADEMIC INSTITUTIONS
10.5 OTHERS
11 MIDDLE EAST AND AFRICA CANCER SUPPORTIVE CARE PRODUCTS MARKET, BY DISTRIBUTION CHANNEL
11.1 OVERVIEW
11.2 HOSPITAL PHARMACIES
11.3 RETAIL PHARMACIES
11.4 COMPOUNDING PHARMACIES
12 MIDDLE EAST AND AFRICA CANCER SUPPORTIVE CARE PRODUCTS MARKET, BY GEOGRAPHY
12.1 MIDDLE EAST & AFRICA
12.1.1 SOUTH AFRICA
12.1.2 SAUDI ARABIA
12.1.3 UAE
12.1.4 ISRAEL
12.1.5 EGYPT
12.1.6 REST OF MIDDLE EAST AND AFRICA
13 MIDDLE EAST AND AFRICA CANCER SUPPORTIVE CARE PRODUCTS MARKET: COMPANY LANDSCAPE
13.1 COMPANY SHARE ANALYSIS: MIDDLE EAST AND AFRICA
14 SWOT
15 COMPANY PROFILES
15.1 AMGEN INC.
15.1.1 COMPANY SNAPSHOT
15.1.2 REVENUE ANALYSIS
15.1.3 COMPANY SHARE ANALYSIS
15.1.4 PRODUCT PORTFOLIO
15.1.5 RECENT DEVELOPMENTS
15.2 PFIZER INC.
15.2.1 COMPANY SNAPSHOT
15.2.2 REVENUE ANALYSIS
15.2.3 COMPANY SHARE ANALYSIS
15.2.4 PRODUCT PORTFOLIO
15.2.5 RECENT DEVELOPMENTS
15.3 JANSSEN PHARMACEUTICALS, INC. (A SUBSIDIARY OF JOHNSON & JOHNSON SERVICES, INC.)
15.3.1 COMPANY SNAPSHOT
15.3.2 REVENUE ANALYSIS
15.3.3 COMPANY SHARE ANALYSIS
15.3.4 PRODUCT PORTFOLIO
15.3.5 RECENT DEVELOPMENTS
15.4 NOVARTIS AG
15.4.1 COMPANY SNAPSHOT
15.4.2 REVENUE ANALYSIS
15.4.3 COMPANY SHARE ANALYSIS
15.4.4 PRODUCT PORTFOLIO
15.4.5 RECENT DEVELOPMENTS
15.5 ACACIA PHARMA GROUP PLC
15.5.1 COMPANY SNAPSHOT
15.5.2 PRODUCT PORTFOLIO
15.5.3 RECENT DEVELOPMENTS
15.6 ACROTECH BIOPHARMA
15.6.1 COMPANY SNAPSHOT
15.6.2 PRODUCT PORTFOLIO
15.6.3 RECENT DEVELOPMENT
15.7 APR
15.7.1 COMPANY SNAPSHOT
15.7.2 PRODUCT PORTFOLIO
15.7.3 RECENT DEVELOPMENTS
15.8 BAXTER
15.8.1 COMPANY SNAPSHOT
15.8.2 REVENUE ANALYSIS
15.8.3 PRODUCT PORTFOLIO
15.8.4 RECENT DEVELOPMENT
15.9 BAYER AG
15.9.1 COMPANY SNAPSHOT
15.9.2 REVENUE ANALYSIS
15.9.3 PRODUCT PORTFOLIO
15.9.4 RECENT DEVELOPMENTS
15.1 F. HOFFMANN-LA ROCHE LTD
15.10.1 COMPANY SNAPSHOT
15.10.2 REVENUE ANALYSIS
15.10.3 PRODUCT PORTFOLIO
15.10.4 RECENT DEVELOPMENTS
15.11 HELSINN HEALTHCARE SA
15.11.1 COMPANY SNAPSHOT
15.11.2 PRODUCT PORTFOLIO
15.11.3 RECENT DEVELOPMENTS
15.12 HERON THERAPEUTICS, INC.
15.12.1 COMPANY SNAPSHOT
15.12.2 REVENUE ANALYSIS
15.12.3 PRODUCT PORTFOLIO
15.12.4 RECENT DEVELOPMENTS
15.13 KYOWA KIRIN CO., LTD.
15.13.1 COMPANY SNAPSHOT
15.13.2 REVENUE ANALYSIS
15.13.3 PRODUCT PORTFOLIO
15.13.4 RECENT DEVELOPMENTS
15.14 MERCK SHARP & DOHME CORP. (A SUBSIDIARY OF MERCK & CO., INC.)
15.14.1 COMPANY SNAPSHOT
15.14.2 REVENUE ANALYSIS
15.14.3 PRODUCT PORTFOLIO
15.14.4 RECENT DEVELOPMENTS
15.15 MYLAN N.V.
15.15.1 COMPANY SNAPSHOT
15.15.2 REVENUE ANALYSIS
15.15.3 PRODUCT PORTFOLIO
15.15.4 RECENT DEVELOPMENTS
15.16 OXFORD PHARMASCIENCE LTD
15.16.1 COMPANY SNAPSHOT
15.16.2 TECHNOLOGY PORTFOLIO
15.16.3 RECENT DEVELOPMENT
15.17 SPECTRUM PHARMACEUTICALS, INC.
15.17.1 COMPANY SNAPSHOT
15.17.2 REVENUE ANALYSIS
15.17.3 PRODUCT PORTFOLIO
15.17.4 RECENT DEVELOPMENT
15.18 SUN PHARMACEUTICAL INDUSTRIES LTD.
15.18.1 COMPANY SNAPSHOT
15.18.2 REVENUE ANALYSIS
15.18.3 PRODUCT PORTFOLIO
15.18.4 RECENT DEVELOPMENTS
15.19 TERSERA THERAPEUTICS LLC
15.19.1 COMPANY SNAPSHOT
15.19.2 PRODUCT PORTFOLIO
15.19.3 RECENT DEVELOPMENT
15.2 TEVA PHARMACEUTICALS USA, INC. (A SUBSIDIARY OF TEVA PHARMACEUTICAL INDUSTRIES LTD.)
15.20.1 COMPANY SNAPSHOT
15.20.2 REVENUE ANALYSIS
15.20.3 PRODUCT PORTFOLIO
15.20.4 RECENT DEVELOPMENTS
16 QUESTIONNAIRE
17 RELATED REPORTS
Data collection and base year analysis are done using data collection modules with large sample sizes. The stage includes obtaining market information or related data through various sources and strategies. It includes examining and planning all the data acquired from the past in advance. It likewise envelops the examination of information inconsistencies seen across different information sources. The market data is analysed and estimated using market statistical and coherent models. Also, market share analysis and key trend analysis are the major success factors in the market report. To know more, please request an analyst call or drop down your inquiry.
The key research methodology used by DBMR research team is data triangulation which involves data mining, analysis of the impact of data variables on the market and primary (industry expert) validation. Data models include Vendor Positioning Grid, Market Time Line Analysis, Market Overview and Guide, Company Positioning Grid, Patent Analysis, Pricing Analysis, Company Market Share Analysis, Standards of Measurement, Global versus Regional and Vendor Share Analysis. To know more about the research methodology, drop in an inquiry to speak to our industry experts.
Data Bridge Market Research is a leader in advanced formative research. We take pride in servicing our existing and new customers with data and analysis that match and suits their goal. The report can be customized to include price trend analysis of target brands understanding the market for additional countries (ask for the list of countries), clinical trial results data, literature review, refurbished market and product base analysis. Market analysis of target competitors can be analyzed from technology-based analysis to market portfolio strategies. We can add as many competitors that you require data about in the format and data style you are looking for. Our team of analysts can also provide you data in crude raw excel files pivot tables (Fact book) or can assist you in creating presentations from the data sets available in the report.


