
Middle East And Africa Hot Fill Packaging Market
Market Size in USD Billion
 USD
2.83 Billion
USD
3.69 Billion
2025
2033
USD
2.83 Billion
USD
3.69 Billion
2025
2033
| 2026 - 2033 | |
| USD 2.83 Billion | |
| USD 3.69 Billion | |
| % | |
|
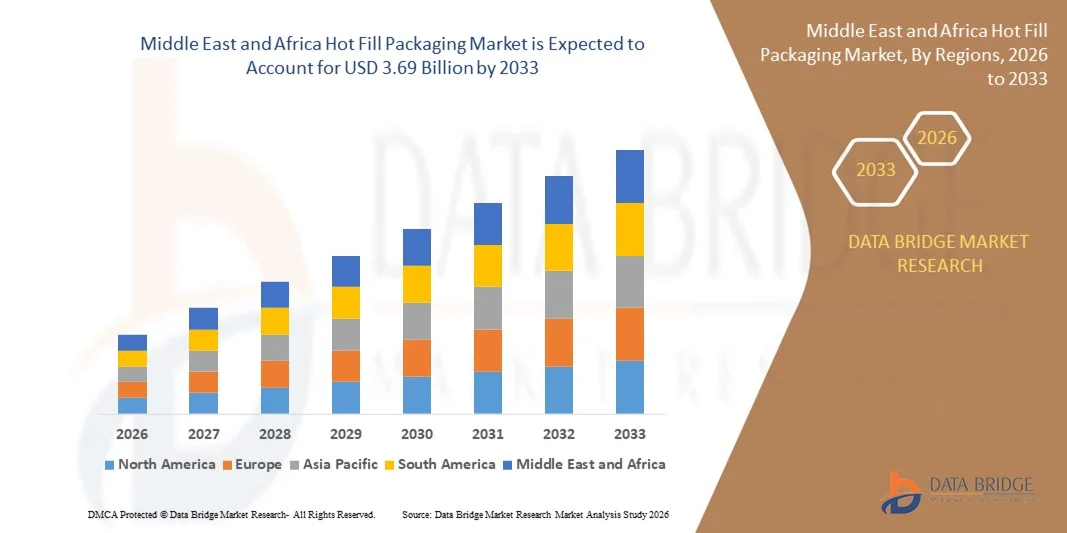
Middle East and Africa Hot Fill Packaging Market Size
- The Middle East and Africa hot fill packaging market size was valued at USD 2.83 billion in 2025 and is expected to reach USD 3.69 billion by 2033, at a CAGR of 3.40% during the forecast period
- The market growth is largely fuelled by increasing demand for shelf-stable beverages, sauces, and liquid food products with extended shelf life
- Rising preference for preservative-free and minimally processed food and beverage products is supporting the adoption of hot fill packaging solutions
Middle East and Africa Hot Fill Packaging Market Analysis
- The market is driven by the ability of hot fill packaging to ensure product safety, microbial stability, and longer shelf life without the need for chemical preservatives
- In addition, continuous advancements in packaging materials and lightweight, heat-resistant containers are enhancing performance, sustainability, and cost efficiency across the hot fill packaging value chain
- South Africa dominated the hot fill packaging market in 2025, supported by its established food and beverage processing sector. Increasing consumption of packaged juices, sauces, and ready-to-eat products is driving demand
- Saudi Arabia is expected to witness the highest compound annual growth rate (CAGR) in the Middle East and Africa hot fill packaging market due to rising demand for packaged beverages and processed foods, rapid urbanization, increasing domestic food production, and growing focus on food safety and quality standards
- The bottles segment held the largest market revenue share in 2025 driven by extensive use in fruit juices, flavored water, sauces, and ready-to-drink beverages. Bottles provide strong sealing performance, ease of handling, and compatibility with high-temperature filling processes. Their transparency and labeling flexibility also support branding and product visibility. In addition, widespread availability and recyclability of bottle formats continue to support their dominance
Report Scope and Middle East and Africa Hot Fill Packaging Market Segmentation
|
Attributes |
Middle East and Africa Hot Fill Packaging Key Market Insights |
|
Segments Covered |
|
|
Countries Covered |
Middle East and Africa
|
|
Key Market Players |
|
|
Market Opportunities |
|
|
Value Added Data Infosets |
In addition to the insights on market scenarios such as market value, growth rate, segmentation, geographical coverage, and major players, the market reports curated by the Data Bridge Market Research also include import export analysis, production capacity overview, production consumption analysis, price trend analysis, climate change scenario, supply chain analysis, value chain analysis, raw material/consumables overview, vendor selection criteria, PESTLE Analysis, Porter Analysis, and regulatory framework. |
Middle East and Africa Hot Fill Packaging Market Trends
Rising Demand For Shelf-Stable And Preservative-Free Products
- The increasing focus on food safety, extended shelf life, and preservative-free formulations is significantly shaping the hot fill packaging market. Manufacturers are adopting hot fill packaging to ensure microbial stability and product integrity without relying on chemical preservatives. This trend supports its growing use across beverages, sauces, dairy-based drinks, and liquid food products, encouraging packaging innovation that balances safety, performance, and sustainability
- Growing consumer preference for ready-to-drink beverages, functional drinks, and convenience foods is accelerating the adoption of hot fill packaging solutions. Hot fill technology enables products to maintain freshness and quality over longer periods, aligning with busy lifestyles and increasing demand for packaged foods. This has prompted food and beverage companies to expand their hot fill product portfolios and invest in advanced packaging materials
- Sustainability and clean-label trends are influencing packaging choices, with manufacturers focusing on recyclable, lightweight, and heat-resistant packaging materials suitable for hot fill processes. These factors help brands meet regulatory requirements and consumer expectations while improving operational efficiency. Packaging suppliers are emphasizing eco-friendly designs and certifications to strengthen brand differentiation in a competitive market
- For instance, in 2024, several global beverage and food manufacturers expanded their hot fill packaging lines for juices, sauces, and functional beverages to meet rising demand for shelf-stable and preservative-free products. These launches focused on improved barrier properties, lightweight containers, and enhanced recyclability, supporting brand positioning around safety and sustainability
- While demand for hot fill packaging continues to rise, sustained market growth depends on advancements in material science, cost-effective production, and maintaining packaging performance at high temperatures. Manufacturers are investing in R&D to improve heat resistance, reduce material usage, and enhance compatibility with automated filling lines to support long-term adoption
Middle East and Africa Hot Fill Packaging Market Dynamics
Driver
Growing Demand For Shelf-Stable And Convenient Food And Beverage Products
- Rising consumption of shelf-stable beverages and liquid foods is a key driver for the hot fill packaging market. Manufacturers increasingly rely on hot fill packaging to extend product shelf life, ensure food safety, and reduce dependency on preservatives. This trend supports wider adoption across juices, dairy alternatives, sauces, and ready-to-consume products
- Expanding applications in beverages, condiments, soups, and functional drinks are contributing to market growth. Hot fill packaging helps preserve taste, texture, and nutritional quality while meeting clean-label expectations. The growing popularity of on-the-go consumption further reinforces demand for reliable and durable packaging solutions
- Food and beverage companies are promoting hot fill packaged products through innovation, branding, and packaging upgrades focused on safety and convenience. These efforts are supported by consumer demand for high-quality packaged foods and beverages, encouraging collaboration between packaging suppliers and product manufacturers to improve efficiency and reduce environmental impact
- For instance, in 2023, several global food and beverage brands increased the use of hot fill packaging for shelf-stable juices and sauces following higher consumer demand for preservative-free and long-life products. Companies highlighted packaging safety, extended shelf life, and sustainability in marketing campaigns to enhance consumer trust and product differentiation
- Despite strong demand drivers, continued market expansion depends on optimizing production costs, improving material availability, and scaling hot fill-compatible packaging solutions. Investments in advanced manufacturing technologies and sustainable material sourcing are critical for meeting growing global demand
Restraint/Challenge
High Production Costs And Material Limitations
- Higher production and material costs associated with hot fill packaging remain a key challenge, particularly due to the need for heat-resistant materials and specialized manufacturing processes. These factors can increase packaging costs compared to alternative filling technologies, limiting adoption among cost-sensitive manufacturers
- Material performance constraints also affect market growth, as packaging must withstand high temperatures without deformation while maintaining barrier properties. Limited availability of cost-effective, recyclable materials suitable for hot fill applications can slow innovation and adoption across certain product categories
- Operational challenges, such as energy consumption, equipment investment, and process complexity, further impact market expansion. Hot fill systems require precise temperature control and specialized machinery, increasing capital expenditure and maintenance requirements for manufacturers
- For instance, in 2024, several packaged food producers reported challenges in adopting hot fill packaging due to higher material costs and equipment upgrades required to meet safety and performance standards. These factors led some manufacturers to delay packaging transitions or limit product launches using hot fill technology
- Addressing these challenges will require advancements in material engineering, energy-efficient filling systems, and cost-optimized production processes. Collaboration between packaging manufacturers, material suppliers, and food producers will be essential to improve affordability, scalability, and long-term market growth
Middle East and Africa Hot Fill Packaging Market Scope
The Middle East and Africa hot fill packaging market is segmented on the basis of product type, material type, packaging layer, capacity, machine type, end-user, and distribution channel.
- By Product Type
On the basis of product type, the Middle East and Africa hot fill packaging market is segmented into bottles, jars, containers, pouches, cans, caps and closures, and others. The bottles segment held the largest market revenue share in 2025 driven by extensive use in fruit juices, flavored water, sauces, and ready-to-drink beverages. Bottles provide strong sealing performance, ease of handling, and compatibility with high-temperature filling processes. Their transparency and labeling flexibility also support branding and product visibility. In addition, widespread availability and recyclability of bottle formats continue to support their dominance.
The pouches segment is expected to witness the fastest growth rate from 2026 to 2033, driven by rising demand for lightweight and flexible packaging. Hot fill pouches reduce material usage and transportation costs compared to rigid formats. Their convenience, portability, and shelf efficiency make them attractive for single-serve and on-the-go consumption. Growing preference for sustainable and space-saving packaging further accelerates adoption.
- By Material Type
On the basis of material type, the Middle East and Africa hot fill packaging market is segmented into polyethylene terephthalate (PET), glass, polypropylene, and others. The PET segment dominated the market in 2025 due to its lightweight nature, durability, and ability to withstand hot fill temperatures. PET packaging offers cost advantages and supports high-speed filling operations. Its recyclability aligns with sustainability initiatives among food and beverage manufacturers. These benefits make PET a widely preferred material across multiple applications.
The glass segment is expected to witness the fastest growth rate from 2026 to 2033, supported by its excellent barrier properties and premium appearance. Glass is widely used for sauces, jams, and dairy-based products where product integrity and flavor preservation are critical. Its reusability and recyclability appeal to environmentally conscious consumers. However, higher weight and breakage risk slightly limit its broader adoption.
- By Packaging Layer
On the basis of packaging layer, the Middle East and Africa hot fill packaging market is segmented into primary, secondary, and tertiary packaging. The primary packaging segment accounted for the largest revenue share in 2025 as it directly comes in contact with food and beverages. It plays a critical role in maintaining hygiene, shelf life, and product quality. Hot fill primary packaging must withstand high temperatures without deformation. Continuous innovation in materials and designs is enhancing performance and safety.
The secondary packaging segment is projected to grow at a notable rate from 2026 to 2033, driven by rising demand for improved protection and branding. Secondary packaging supports handling, storage, and transportation efficiency. It also provides additional space for labeling and regulatory information. Increasing focus on retail-ready and shelf-friendly packaging designs is boosting segment growth.
- By Capacity
On the basis of capacity, the Middle East and Africa hot fill packaging market is segmented into up to 12 oz, 13 oz–32 oz, 33 oz–64 oz, and above 64 oz. The 13 oz–32 oz segment held the largest market share in 2025 due to its widespread use in juices, sauces, and ready-to-drink beverages. This size range offers a balance between convenience and value for consumers. It is suitable for both household and individual consumption. Manufacturers prefer this capacity due to strong consumer demand and efficient production.
The above 64 oz segment is expected to witness the fastest growth rate from 2026 to 2033, driven by demand from foodservice operators and bulk buyers. Larger pack sizes offer cost efficiency and reduced packaging waste per unit. They are commonly used in restaurants, catering services, and institutional settings. Rising consumption of family-size and bulk products supports segment growth.
- By Machine Type
On the basis of machine type, the Middle East and Africa hot fill packaging market is segmented into manual and automatic. The automatic segment dominated the market in 2025 owing to higher production efficiency and consistency. Automatic machines support large-scale manufacturing with minimal labor involvement. They also reduce error rates and improve hygiene standards. Increasing automation in food and beverage processing continues to drive demand.
The manual segment is anticipated to grow steadily from 2026 to 2033, supported by adoption among small- and medium-scale producers. Manual machines require lower capital investment and are suitable for limited production volumes. They offer flexibility for niche and specialty product manufacturers. Growth of small food brands and startups supports this segment.
- By End-User
On the basis of end-user, the Middle East and Africa hot fill packaging market is segmented into sauces and spreads, fruit juices, vegetable juices, jams, mayonnaise, flavored water, ready-to-drink beverages, soups, dairy, nectars, and others. The fruit juices segment accounted for the largest revenue share in 2025 due to high consumption of shelf-stable beverages. Hot fill packaging ensures safety and extended shelf life for juice products. Strong demand from retail and foodservice channels supports segment dominance. Consumer preference for preservative-free juices further drives adoption.
The ready-to-drink beverages segment is expected to witness the fastest growth rate from 2026 to 2033. Rising consumption of functional and convenience beverages is boosting demand. Hot fill packaging supports flavor retention and long shelf life. Product innovation and expanding distribution channels are further contributing to growth.
- By Distribution Channel
On the basis of distribution channel, the Middle East and Africa hot fill packaging market is segmented into offline and online. The offline segment dominated the market in 2025 supported by strong relationships between manufacturers, distributors, and packaging suppliers. Bulk procurement and customized solutions are more accessible through offline channels. Physical distribution networks ensure reliable supply and after-sales support. This channel remains preferred for large-volume orders.
The online segment is projected to grow at the fastest rate from 2026 to 2033, driven by increasing digitalization of procurement processes. Online platforms offer ease of comparison, transparent pricing, and quick ordering. Small and mid-sized manufacturers increasingly prefer online sourcing for flexibility. Expansion of B2B e-commerce platforms is further supporting growth.
Middle East and Africa Hot Fill Packaging Market Regional Analysis
- South Africa dominated the hot fill packaging market in 2025, supported by its established food and beverage processing sector. Increasing consumption of packaged juices, sauces, and ready-to-eat products is driving demand
- Manufacturers rely on hot fill packaging to improve shelf life and reduce the use of preservatives
- Expanding retail penetration and urban population growth further reinforce market dominance
Saudi Arabia Hot Fill Packaging Market Insight
The Saudi Arabia hot fill packaging market is projected to grow at the fastest rate from 2026 to 2033, driven by rising demand for packaged beverages and processed foods. Changing consumer lifestyles and increasing preference for shelf-stable products support market expansion. Growth in domestic food manufacturing and government initiatives to strengthen local production further stimulate adoption. In addition, heightened focus on food quality and safety standards is boosting market growth
Middle East and Africa Hot Fill Packaging Market Share
The Middle East and Africa hot fill packaging industry is primarily led by well-established companies, including:
- Hotpack Global (U.A.E.)
- Falcon Pack (U.A.E.)
- Gulf Packaging Industries Co. (Saudi Arabia)
- Napco National (Saudi Arabia)
- Takween Advanced Industries (Saudi Arabia)
- United Printing & Publishing (Egypt)
- Al Bayader International (U.A.E.)
- Agthia Group PJSC (U.A.E.)
- FlexPack (South Africa)
- Mpact Limited (South Africa)
- Nampak Ltd. (South Africa)
- Detpak Middle East (U.A.E.)
- Golden Paper Company (Saudi Arabia)
- Taghleef Industries (U.A.E.)
- INDEVCO Group (Lebanon)
SKU-

- Interactive Data Analysis Dashboard
- Company Analysis Dashboard for high growth potential opportunities
- Research Analyst Access for customization & queries
- Competitor Analysis with Interactive dashboard
- Latest News, Updates & Trend analysis
- Harness the Power of Benchmark Analysis for Comprehensive Competitor Tracking
Middle East And Africa Hot Fill Packaging Market, Supply Chain Analysis and Ecosystem Framework
To support market growth and help clients navigate the impact of geopolitical shifts, DBMR has integrated in-depth supply chain analysis into its Middle East And Africa Hot Fill Packaging Market research reports. This addition empowers clients to respond effectively to global changes affecting their industries. The supply chain analysis section includes detailed insights such as Middle East And Africa Hot Fill Packaging Market consumption and production by country, price trend analysis, the impact of tariffs and geopolitical developments, and import and export trends by country and HSN code. It also highlights major suppliers with data on production capacity and company profiles, as well as key importers and exporters. In addition to research, DBMR offers specialized supply chain consulting services backed by over a decade of experience, providing solutions like supplier discovery, supplier risk assessment, price trend analysis, impact evaluation of inflation and trade route changes, and comprehensive market trend analysis.
Data collection and base year analysis are done using data collection modules with large sample sizes. The stage includes obtaining market information or related data through various sources and strategies. It includes examining and planning all the data acquired from the past in advance. It likewise envelops the examination of information inconsistencies seen across different information sources. The market data is analysed and estimated using market statistical and coherent models. Also, market share analysis and key trend analysis are the major success factors in the market report. To know more, please request an analyst call or drop down your inquiry.
The key research methodology used by DBMR research team is data triangulation which involves data mining, analysis of the impact of data variables on the market and primary (industry expert) validation. Data models include Vendor Positioning Grid, Market Time Line Analysis, Market Overview and Guide, Company Positioning Grid, Patent Analysis, Pricing Analysis, Company Market Share Analysis, Standards of Measurement, Global versus Regional and Vendor Share Analysis. To know more about the research methodology, drop in an inquiry to speak to our industry experts.
Data Bridge Market Research is a leader in advanced formative research. We take pride in servicing our existing and new customers with data and analysis that match and suits their goal. The report can be customized to include price trend analysis of target brands understanding the market for additional countries (ask for the list of countries), clinical trial results data, literature review, refurbished market and product base analysis. Market analysis of target competitors can be analyzed from technology-based analysis to market portfolio strategies. We can add as many competitors that you require data about in the format and data style you are looking for. Our team of analysts can also provide you data in crude raw excel files pivot tables (Fact book) or can assist you in creating presentations from the data sets available in the report.


