
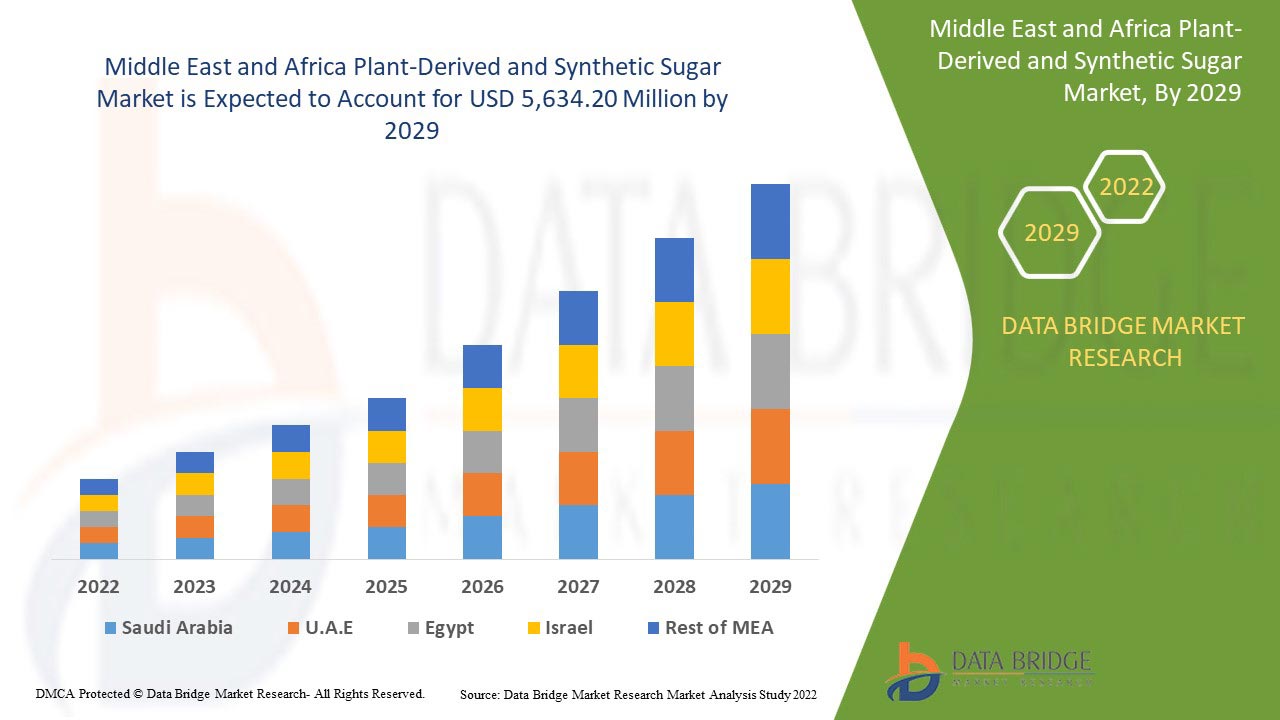
Middle East and Africa Plant-Derived and Synthetic Sugar Market Analysis and Size
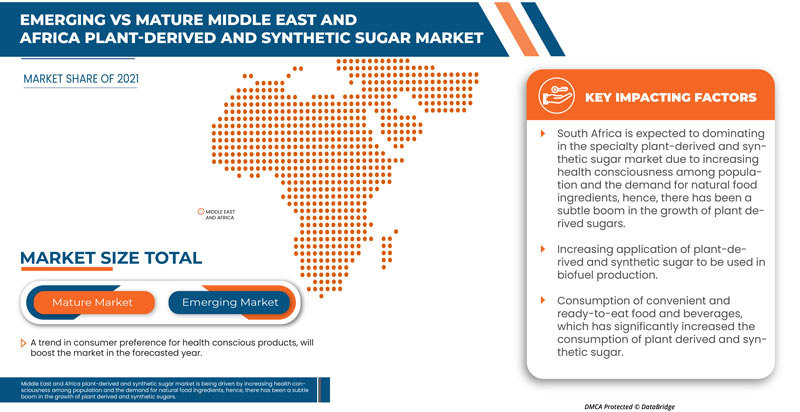
The Middle East and Africa market is driven by the numerous benefits they offer consumers. Increasing health consciousness is also driving the population's market for plant-derived and synthetic sugar and the demand for natural food ingredients. Hence, there has been a subtle boom in the growth of plant-derived sugar over the last few years. The primary factors limiting the Middle East and Africa plant-derived and sugar synthetic market are the high prices of plant sugar and adverse health consequences such as diabetes and obesity. As a result of the rising demand for healthy food ingredients in the food and beverage industry is expected to drive the plant-derived sugar and synthetic sugar market. Growers are putting more effort into producing new low sugar drinks and products. These choices ultimately aid the market's expansion.
Data Bridge Market Research analyses that the Middle East and Africa plant-derived and synthetic sugar market is expected to reach a value of USD 5,634.20 million by 2029, at a CAGR of 2.8% during the forecast period.
|
Report Metric |
Details |
|
Forecast Period |
2022 to 2029 |
|
Base Year |
2021 |
|
Historic Year |
2020 (Customizable to 2019 - 2015) |
|
Quantitative Units |
Revenue in USD Million, Pricing in USD |
|
Segments Covered |
By Type (Plant-Derived Sugar and Synthetic Sugar), Form (Dry and Liquid), Application (Food and Beverages, Dietary Supplements, Pharmaceutical, Sports Nutrition, and Others) |
|
Countries Covered |
South Africa, UAE. Saudi Arabia, Kuwait, Oman, Qatar, Rest of Middle East and Africa. |
|
Market Players Covered |
ADM, Cargill, Incorporated, Ingredion, Ajinomoto Co., Inc., DuPont, NOW Foods, Tate & Lyle, Hermes Sweeteners Ltd., Südzucker AG, Layn Corp. |
Market Definition
Plant-derived and synthetic sugar are products used for sweetening. Plant-derived sugar is defined as sugar that is taken straight from a plant source and sold to consumers unaltered. Synthetic sugars, on the other hand, are made indirectly from a separate source of sugar. Some plant-derived sugar, including stevia, Xylitol, Erythritol, Yacon Syrup, and others, is a suitable replacement for sugar to reduce the risk of having different diseases from sugar. Additionally, consumers worldwide are favoring a healthy diet and avoiding sugary goods that are rich in calories and linked to cardiac disease. Due to the growing popularity of plant-based products, plant-based sugar is receiving more and more attention. However, the high pricing of both sugars compared to regular sugar is among the restraining factors for the plant-derived and synthetic sugar market.
Plant-Derived and Synthetic Sugar Market Dynamics
This section deals with understanding the market drivers, advantages, opportunities, restraints, and challenges. All of this is discussed in detail below:
Driver:
- Rise in the demand for healthy food ingredients in the food and beverage sector
Many people prefer to include natural ingredients in daily diets. Natural ingredients are becoming increasingly important in the food and beverage business, and consumers and producers are turning to them. Consequently, using natural ingredients in the food and beverage business is increasing the demand for sugar from plants. Customers are looking for a healthy alternative to sugar. Several plant-derived sugar alternatives are on the market, including stevia, Yacon Syrup, Xylitol, Erythritol, Coconut Sugar, and Maple Syrup. A stevia is a good option for diabetic patients who prefer sugar substitutes with no calories. Since stevia contains no calories and has no adverse health consequences, its demand is rising. Xylitol, derived from corn and also present in many fruits and vegetables, is another plant-based sugar.
RESTRAINT
- HIGH COSTS OF PLANT-DERIVED SUGAR AND SYNTHETIC SUGAR
Compared to ordinary sugar, the cost of plant-derived and synthetic sugars is exceptionally high. This high-cost results from the high cost of the raw materials and production methods used to create natural and artificial sugars. Plant-derived and synthetic sugars are greatly affected by changes in raw material costs; therefore, businesses continue to charge prices that maximize their profits.
Therefore, it is anticipated that the enormous price difference between plant-derived and synthetic sugar products and traditional sugar products is expected to hinder the market's expansion.
OPPORTUNITY
- EXPANSION AND NEW PRODUCT LAUNCHES IN THIS INDUSTRY
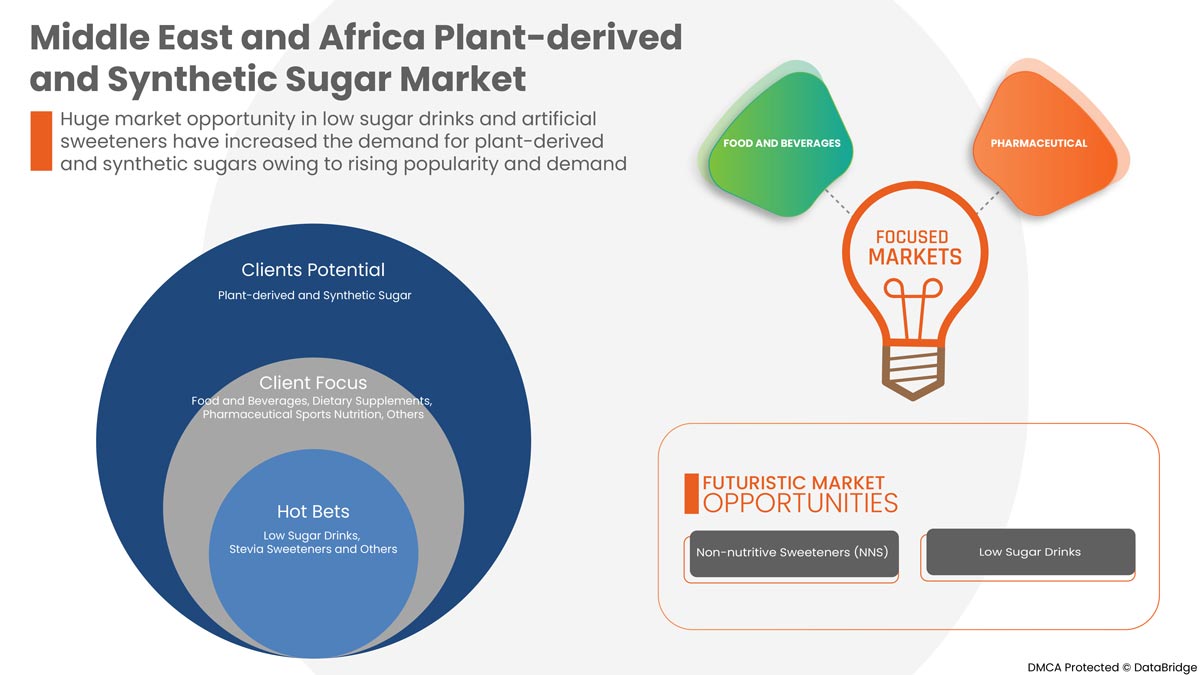
As an alternative to sugar, artificial sweeteners are becoming more and more common. The prevalence of obesity, diabetes, and metabolic syndrome has increased. This, combined with increased consumer knowledge, has resulted in a continuous paradigm change favoring artificial sweeteners with few calories. These artificial sweeteners, non-nutritive sweeteners (NNS), low-calorie sweeteners, and intense sweeteners deliver more sweetness per gram while having zero or a few calories. They are used in beverages, nutritional supplements, medications, and mouthwashes. These are used by both obese and lean people, diabetics and non-diabetics, adults, and children, and their general use is a result of intensive marketing and raised health awareness. They give those who want to reduce their calorie intake and increase the palatability of their diet more food options. Due to the increasing applicability of these artificial sweeteners, companies are releasing many more new product launches and developing or expanding the company.
CHALLENGE
- Government- imposed strict restrictions and regulations
Consumers are increasingly inclined towards healthy food, and health-conscious nature has significantly increased the use of products with no added sugar and sweetener. The government set up specific rules and actions to reduce sugar intake through selective taxation, reformulations, and packaging label. The government has been continuously monitoring the situation in the sugar sector, including sugar production, consumption, export, and price trends in wholesale and retail markets all over the country.
Though food and drug administration (FDA) approved products are considered safe, there are questionable health downsides associated with artificial and non-nutritive sweeteners. In the case of natural sweeteners, overconsumption can lead to health problems like tooth decay and poor nutrition.
Post-COVID-19 Impact on Middle East and Africa Plant-Derived and Synthetic Sugar Market
The COVID-19 pandemic has significantly affected the Middle East and Africa plant-derived sugar and synthetic sugar market. The persistence of COVID-19 for a more extended period has affected the supply chain as it got disrupted, and it became difficult to supply the products to the consumers, initially decreasing the demand for products. However, post-COVID, the demand for the products has increased significantly.
Thus, the recovery from the COVID-19 pandemic in all regions is increasing the demand for a product in the market.
Recent Developments
- In February 2022, IFF is acquiring Health Wright products. HWP is a Middle East and Africa leader in consumer Health and nutrition, providing the highest-quality nutritional supplements. The acquisition will bring formulation and finished format capabilities to IFF's Health & Biosciences probiotics, natural extracts, and botanicals businesses, allowing for innovation in custom formulation and combination products through joint capabilities.
- In May 2022, Suduzeker subsidiary Beneo acquired a company named meatless B.V. With the acquisition, BENEO is expanding its existing product portfolio to offer an even more comprehensive range of texturizing solutions for meat and fish alternatives and leading to the growth of the market in the food region.
Middle East and Africa Plant-Derived and Synthetic Sugar Market Scope
Middle East and Africa plant-derived and synthetic sugar market is segmented into three notable segments based on type, application, and form. The growth amongst these segments will help you analyze major growth segments in the industries and provide the users with a valuable market overview and market insights to help them make strategic decisions for identifying core market applications.
Type
- Plant-derived sugar
- Synthetic sugar
On the basis of type, Middle East and Africa plant-derived and synthetic sugar market is segmented into plant-derived sugar and synthetic sugar.
Application
- Food & Beverages
- Dietary Supplements
- Pharmaceutical
- Sports Nutrition
- Others
On the basis of application, Middle East and Africa plant-derived and synthetic sugar market is segmented into food & beverages, dietary supplements, pharmaceutical, sports nutrition, and others.
Form
- Dry
- Liquid
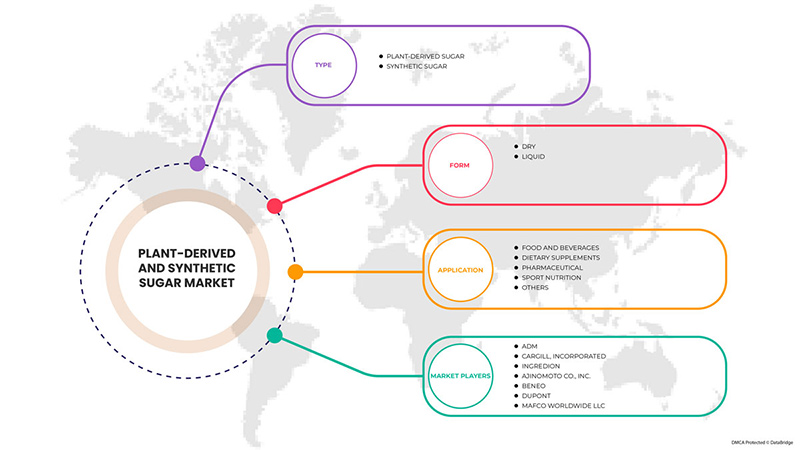
On the basis of form, Middle East and Africa plant-derived and synthetic sugar market is segmented into dry and liquid.
Plant-Derived and Synthetic Sugar Market Regional Analysis/Insights
The plant-derived and synthetic sugar market is analyzed, and the country provides market size insights and trends on type, application, and form, as referenced above.
The countries covered in the Middle East and Africa plant-derived and synthetic sugar market report are South Africa, UAE, Saudi Arabia, Kuwait, Oman, Qatar, and the rest of Middle East and Africa.
South Africa dominates the Middle East and Africa plant-derived and synthetic sugar markets. South Africa is the largest market for the plant-derived and synthetic sugar market. Expiations in online retail and distribution channels will help to get high demand worldwide, which is the major reason for the growth of plant-derived and synthetic sugar markets in South Africa. However, the high cost of excellent raw materials likely restricts the market growth.
The country section of the report also provides individual market-impacting factors and market regulation changes that impact the market's current and future trends. Data points like downstream and upstream value chain analysis, technical trends, porter's five forces analysis, and case studies are some pointers used to forecast the market scenario for individual countries. Also, the presence and availability of Middle East and Africa brands and their challenges faced due to significant or scarce competition from local and domestic brands, the impact of domestic tariffs, and trade routes are considered while providing forecast analysis of the country data.
Competitive Landscape and Plant-Derived and Synthetic Sugar Market Share Analysis
The plant-derived and synthetic sugar market competitive landscape provides details of competitors. Details included are company overview, company financials, revenue generated, market potential, investment in research and development, new market initiatives, Middle East and Africa presence, production sites and facilities, production capacities, company strengths and weaknesses, product launch, product width and breadth, and application dominance. The above data points are only related to the companies focusing on the plant-derived and synthetic sugar market.
Some major players operating in the plant-derived and synthetic sugar market are ADM, Cargill, Incorporated, Ingredion, Ajinomoto Co., Inc., DuPont, NOW Foods, Tate & Lyle, Hermes Sweeteners Ltd., Südzucker AG, and Layn Corp.
Research Methodology: Middle East and Africa Plant-Derived and Synthetic Sugar Market
Data collection and base year analysis are done using data collection modules with large sample sizes. The stage includes obtaining market information or related data through various sources and strategies. It includes examining and planning all the data acquired from the past advance. It likewise envelops the examination of information inconsistencies seen across different information sources. The market data is analyzed and estimated using market statistical and coherent models. Also, market share analysis and critical trend analysis are the major success factors in the market report. Please request an analyst call or drop down your inquiry to know more.
The fundamental research methodology used by the DBMR research team is data triangulation which involves data mining, analysis of the impact of data variables on the market, and primary (industry expert) validation. Data models include Vendor Positioning Grid, Market Time Line Analysis, Market Overview and Guide, Company Positioning Grid, Patent Analysis, Pricing Analysis, Company Market Share Analysis, Standards of Measurement, Middle East and Africa versus Regional, and Vendor Share Analysis. To know more about the research methodology, drop in an inquiry to speak to our industry experts.
Customization Available
Data Bridge Market Research is a leader in advanced formative research. We take pride in servicing our existing and new customers with data and analysis that match and suits their goal. The report can be customized to include price trend analysis of target brands understanding the market for additional countries (ask for the list of countries), clinical trial results data, literature review, refurbished market, and product base analysis. Market analysis of target competitors can be analyzed from technology-based analysis to market portfolio strategies. We can add as many competitors as you require data about in the format and data style you are looking for. Our team of analysts can also provide you with data in crude raw excel files pivot tables (Factbook) or can assist you in creating presentations from the data sets available in the report.
SKU-

- Interactive Data Analysis Dashboard
- Company Analysis Dashboard for high growth potential opportunities
- Research Analyst Access for customization & queries
- Competitor Analysis with Interactive dashboard
- Latest News, Updates & Trend analysis
- Harness the Power of Benchmark Analysis for Comprehensive Competitor Tracking
Table of Content
1 INTRODUCTION
1.1 OBJECTIVES OF THE STUDY
1.2 MARKET DEFINITION
1.3 OVERVIEW OF THE MIDDLE EAST & AFRICA PLANT-DERIVED AND SYNTHETIC SUGAR MARKET
1.4 LIMITATIONS
1.5 MARKETS COVERED
2 MARKET SEGMENTATION
2.1 MARKETS COVERED
2.2 GEOGRAPHICAL SCOPE
2.3 YEARS CONSIDERED FOR THE STUDY
2.4 CURRENCY AND PRICING
2.5 DBMR TRIPOD DATA VALIDATION MODEL
2.6 MULTIVARIATE MODELLING
2.7 TYPE LIFELINE CURVE
2.8 PRIMARY INTERVIEWS WITH KEY OPINION LEADERS
2.9 DBMR MARKET POSITION GRID
2.1 VENDOR SHARE ANALYSIS
2.11 SECONDARY SOURCES
2.12 ASSUMPTIONS
3 EXECUTIVE SUMMARY
4 PREMIUM INSIGHTS
4.1 FACTORS INFLUENCING THE PURCHASE DECISION
4.2 GROWTH STRATEGIES ADOPTED BY KEY MARKET PLAYERS
4.3 IMPORT-EXPORT ANALYSIS
4.3.1 IMPORT-EXPORT ANALYSIS- MIDDLE EAST & AFRICA PLANT BASED SUGAR MARKET
4.3.2 IMPORT-EXPORT ANALYSIS- MIDDLE EAST & AFRICA SYNTHETIC SUGAR MARKET
4.4 INDUSTRY TRENDS FOR MIDDLE EAST & AFRICA PLANT-DERIVED AND SYNTHETIC SUGAR MARKET
4.4.1 INDUSTRY TRENDS
4.4.1.1 DEMAND FOR SYNTHETIC SUGAR
4.4.1.2 GROWING POPULARITY OF PLANT DERIVED SUGAR
4.4.2 FUTURE PERSPECTIVE
4.5 NEW PRODUCT LAUNCH STRATEGY
4.5.1 PROMOTING BY EMPHASIZING THEIR HEALTH BENEFITS
4.5.2 WEIGHT MANAGEMENT
4.5.3 LAUNCHING ORGANIC PRODUCTS
4.5.4 CONCLUSION
4.6 PRODUCTION AND CONSUMPTION
4.7 TECHNOLOGICAL ADVANCEMENT IN THE PLANT-DERIVED AND SYNTHETIC SUGAR MARKET
5 POST-COVID IMPACT
5.1 AFTERMATH OF COVID-19
5.2 IMPACT ON DEMAND AND SUPPLY CHAIN
5.3 IMPACT ON PRICE
5.4 CONCLUSION
6 VALUE CHAIN ANALYSIS: MIDDLE EAST & AFRICA PLANT DERIVED SUGAR AND SYNTHETIC SUGAR MARKET
7 REGULATORY FRAMEWORK AND GUIDELINES
7.1 ASIAN REGION
7.2 NORTH AMERICA
7.3 EUROPE
8 SUPPLY CHAIN OF MIDDLE EAST & AFRICA PLANT-DERIVED AND SYNTHETIC SUGAR MARKET
8.1 SUPPLY CHAIN OF PLANT-DERIVED SUGAR
8.1.1 RAW MATERIAL PROCUREMENT
8.1.2 PREPARATION OF SUGAR IN SUGAR MILLS
8.1.3 MARKETING AND DISTRIBUTION
8.1.4 END USERS
8.2 SUPPLY CHAIN OF SYNTHETIC SUGAR
8.2.1 RAW MATERIAL PROCUREMENT
8.2.2 PREPARATION OF SYNTHETIC SUGAR IN THE LAB
8.2.3 MARKETING AND DISTRIBUTION
8.2.4 END USERS
9 MARKET OVERVIEW
9.1 DRIVERS
9.1.1 RISE IN THE DEMAND FOR HEALTHY FOOD INGREDIENTS IN THE FOOD AND BEVERAGE SECTOR
9.1.2 WIDE APPLICATION OF PLANT-DERIVED AND SYNTHETIC SUGAR IN VARIOUS MIDDLE EAST & AFRICA INDUSTRIES
9.1.3 GROWTH IN THE DEMAND FOR NATURAL SWEETENERS AS A SAFER ALTERNATIVE TO ARTIFICIAL SWEETENERS
9.1.4 GROWTH IN THE CONSUMER DEMAND FOR IN CONFECTIONERY PRODUCTS
9.1.5 RISE IN THE HEALTH BENEFITS ASSOCIATED WITH SYNTHETIC SUGAR
9.2 RESTRAINTS
9.2.1 HIGH COSTS OF PLANT-DERIVED AND SYNTHETIC SUGAR
9.2.2 ARTIFICIAL SWEETENERS' ADOPTION IS BEING HAMPERED BY THE GROWING UNCERTAINTY AROUND THEIR SAFETY IN NUMEROUS FOOD PRODUCTS.
9.2.3 GROWTH HEALTH PROBLEMS DUE TO HIGH SUGAR INTAKE
9.2.4 AVAILABILITY OF SUBSTITUTE FOR PLANT-DERIVED AND SYNTHETIC SUGARS
9.3 OPPORTUNITIES
9.3.1 EXPANSION AND NEW PRODUCT LAUNCHES IN THIS INDUSTRY
9.3.2 INCREASE IN THE HEALTH-CONSCIOUSNESS AMONG MIDDLE EAST & AFRICA CONSUMERS
9.3.3 CHANGES IN LIFESTYLE AND DEMOGRAPHICS TO ENCOURAGE VARIOUS EATING HABITS
9.3.4 CONSUMERS SHIFTING PREFERENCE TOWARD LOW-SUGAR DRINKS
9.4 CHALLENGES
9.4.1 IMPACT OF COVID-19 ON THE SUPPLY CHAIN OF FINAL PRODUCTS AND RAW MATERIAL
9.4.2 GOVERNMENT- IMPOSED STRICT RESTRICTIONS AND REGULATIONS
9.4.3 PRODUCT LABELING AND TRADE ISSUES
9.4.4 INADEQUATE RAW MATERIAL AVAILABILITY
10 MIDDLE EAST & AFRICA PLANT-DERIVED AND SYNTHETIC SUGAR MARKET, BY TYPE
10.1 OVERVIEW
10.2 PLANT-DERIVED SUGAR
10.2.1 PLANT DERIVED SUGAR, BY TYPE
10.2.1.1 CANE SUGAR
10.2.1.2 SUGAR BEET SUGAR
10.2.1.3 STEVIA
10.2.1.4 MONK FRUIT SWEETENER
10.2.1.5 COCONUT SUGAR
10.2.1.6 MAPLE SUGAR
10.2.1.7 MOLASSES SUGAR
10.2.1.8 BROWN RICE SUGAR
10.2.1.9 MALTITOL
10.2.1.10 ALLULOSE
10.2.1.11 ERYTHRITOL
10.2.1.12 XYLITOL
10.2.1.13 OTHERS
10.2.2 PLANT DERIVED SUGAR, BY CATEGORY
10.2.2.1 CONVENTIONAL SUGAR
10.2.2.2 ORGANIC SUGAR
10.3 SYNTHETIC SUGAR
10.3.1 SYNTHETIC SUGAR, BY TYPE
10.3.1.1 ASPARTAME
10.3.1.2 SACCHARINE
10.3.1.3 ACE-K
10.3.1.4 CYCLAMATE
10.3.1.5 SUCROLOSE
10.3.1.6 GLYCYRRHIZIN
10.3.1.7 ALITAME
10.3.1.8 ADVANTAME
10.3.1.9 NEOTAME
10.3.1.10 OTHERS
11 MIDDLE EAST & AFRICA PLANT-DERIVED AND SYNTHETIC SUGAR MARKET, BY FORM
11.1 OVERVIEW
11.2 DRY
11.2.1 DRY, BY TYPE
11.2.1.1 POWDER
11.2.1.2 CRYSTAL
11.2.1.3 CRYSTALIZED POWDER
11.3 LIQUID
12 MIDDLE EAST & AFRICA PLANT-DERIVED AND SYNTHETIC SUGAR MARKET, BY APPLICATION
12.1 OVERVIEW
12.2 FOOD AND BEVERAGE
12.2.1 FOOD & BEVERAGE, BY TYPE
12.2.1.1 TABLE TOP SUGAR
12.2.1.2 BEVERAGES
12.2.1.2.1 DAIRY BASED DRINKS
12.2.1.2.1.1 REGULAR
12.2.1.2.1.2 PROCESSED MILK
12.2.1.2.1.3 MILK SHAKES
12.2.1.2.1.4 FLAVORED MILK
12.2.1.2.2 JUICES
12.2.1.2.3 SMOOTHIES
12.2.1.2.4 PLANT BASED MILK
12.2.1.2.5 ENERGY DRINKS
12.2.1.2.6 SPORTS DRINKS
12.2.1.2.7 OTHERS
12.2.1.3 FROZEN DESSERTS
12.2.1.3.1 GELATO
12.2.1.3.2 CUSTARD
12.2.1.3.3 OTHERS
12.2.1.4 PROCESSED FOOD
12.2.1.4.1 READY MEALS
12.2.1.4.2 JAMS, PRESERVES & MARMALADES
12.2.1.4.3 SAUCES, DRESSINGS & CONDIMENTS
12.2.1.4.4 SOUPS
12.2.1.4.5 OTHERS
12.2.1.5 CONVENIENCE FOOD
12.2.1.5.1 INSTANT NOODLES
12.2.1.5.2 PIZZA & PASTA
12.2.1.5.3 SNACKS & EXTRUDED SNACKS
12.2.1.5.4 OTHERS
12.2.1.6 CONFECTIONERY
12.2.1.6.1 HARD-BOILED SWEETS
12.2.1.6.2 MINTS
12.2.1.6.3 GUMS & JELLIES
12.2.1.6.4 CHOCOLATE
12.2.1.6.5 CHOCOLATE SYRUPS
12.2.1.6.6 CARAMELS & TOFFEES
12.2.1.6.7 OTHERS
12.2.1.7 BAKERY
12.2.1.7.1 BREAD & ROLLS
12.2.1.7.2 CAKES, PASTRIES & TRUFFLE
12.2.1.7.3 BISCUIT, COOKIES & CRACKERS
12.2.1.7.4 BROWNIES
12.2.1.7.5 TART & PIES
12.2.1.7.6 OTHERS
12.2.1.8 DAIRY PRODUCTS
12.2.1.8.1 YOGURT
12.2.1.8.2 ICE CREAM
12.2.1.8.3 CHEESE
12.2.1.8.4 OTHERS
12.2.1.9 BREAKFAST CEREAL
12.2.1.10 INFANT FORMULA
12.2.1.10.1 FIRST INFANT FORMULA
12.2.1.10.2 ANTI-REFLUX (STAY DOWN) FORMULA
12.2.1.10.3 COMFORT FORMULA
12.2.1.10.4 HYPOALLERGENIC FORMULA
12.2.1.10.5 FOLLOW-ON FORMULA
12.2.1.10.6 OTHERS
12.2.1.11 NUTRITIONAL BARS
12.2.1.12 FUNCTIONAL FOOD
12.2.2 FOOD & BEVERAGE, BY SWEETENER TYPE
12.2.2.1 PLANT-DERIVED SUGAR
12.2.2.2 SYNTHETIC SUGAR
12.3 DIETARY SUPPLEMENTS
12.3.1 DIETARY SUPPLEMENTS, BY TYPE
12.3.1.1 IMMUNITY SUPPLEMENTS
12.3.1.2 OVERALL WELLBEING SUPPLEMENTS
12.3.1.3 SKIN HEALTH SUPPLEMENTS
12.3.1.4 BONE AND JOINT HEALTH SUPPLEMENTS
12.3.1.5 BRAIN HEALTH SUPPLEMENTS
12.3.1.6 OTHERS
12.3.2 DIETARY SUPPLEMENTS, BY SWEETENER TYPE
12.3.2.1 PLANT-DERIVED SUGAR
12.3.2.2 SYNTHETIC SUGAR
12.4 PHARMACEUTICAL
12.4.1 PHARMACEUTICAL, BY TYPE
12.4.1.1 TABLETS
12.4.1.2 CAPSULES
12.4.1.3 OTHERS
12.4.2 PHARMACEUTICAL, BY SWEETENER TYPE
12.4.2.1 PLANT-DERIVED SUGAR
12.4.2.2 SYNTHETIC SUGAR
12.5 SPORTS NUTRITION
12.5.1 SPORTS NUTRITION, BY TYPE
12.5.1.1 PROTEIN POWDERS
12.5.1.2 SPORTS NUTRITION BARS
12.5.1.3 SPORT DRINK MIXES
12.5.1.4 ENERGY GELS
12.5.1.5 OTHERS
12.5.2 SPORTS NUTRITION, BY SWEETENER TYPE
12.5.2.1 PLANT-DERIVED SUGAR
12.5.2.2 SYNTHETIC SUGAR
12.6 OTHERS
12.6.1 OTHERS, BY SWEETENER TYPE
12.6.1.1 PLANT-DERIVED SUGAR
12.6.1.2 SYNTHETIC SUGAR
13 MIDDLE EAST & AFRICA PLANT-DERIVED AND SYNTHETIC SUGAR MARKET, BY REGION
13.1 MIDDLE EAST AND AFRICA
13.1.1 SOUTH AFRICA
13.1.2 UNITED ARAB EMIRATES
13.1.3 SAUDI ARABIA
13.1.4 KUWAIT
13.1.5 OMAN
13.1.6 QATAR
13.1.7 REST OF MIDDLE EAST & AFRICA
14 COMPANY LANDSCAPE
14.1 COMPANY SHARE ANALYSIS: MIDDLE EAST & AFRICA
15 SWOT ANALYSIS
16 COMPANY PROFILES
16.1 ADM
16.1.1 COMPANY SNAPSHOT
16.1.2 REVENUE ANALYSIS
16.1.3 COMPANY SHARE ANALYSIS
16.1.4 PRODUCT PORTFOLIO
16.1.5 RECENT DEVELOPMENTS
16.2 SUDZUKER AG
16.2.1 COMPANY SNAPSHOT
16.2.2 RECENT FINANCIALS
16.2.3 COMPANY SHARE ANALYSIS
16.2.4 PRODUCT PORTFOLIO
16.2.5 RECENT DEVELOPMENTS
16.3 CARGILL, INCORPORATED
16.3.1 COMPANY SNAPSHOT
16.3.2 COMPANY SHARE ANALYSIS
16.3.3 PRODUCT PORTFOLIO
16.3.4 RECENT DEVELOPMENTS
16.4 INGREDION INCORPORATED
16.4.1 COMPANY SNAPSHOT
16.4.2 REVENUE ANALYSIS
16.4.3 COMPANY SHARE ANALYSIS
16.4.4 PRODUCT PORTFOLIO
16.4.5 RECENT DEVELOPMENTS
16.5 WILMAR INTERNATIONAL LTD
16.5.1 COMPANY SNAPSHOT
16.5.2 REVENUE ANALYSIS
16.5.3 COMPANY SHARE ANALYSIS
16.5.4 PRODUCT PORTFOLIO
16.5.5 RECENT DEVELOPMENTS
16.6 AJINOMOTO CO., INC
16.6.1 COMPANY SNAPSHOT
16.6.2 RECENT FINANCIALS
16.6.3 COMPANY SHARE ANALYSIS
16.6.4 PRODUCT PORTFOLIO
16.6.5 RECENT DEVELOPMENTS
16.7 BENEO
16.7.1 COMPANY SNAPSHOT
16.7.2 PRODUCT PORTFOLIO
16.7.3 RECENT DEVELOPMENTS
16.8 CELANESE CORPORATION
16.8.1 COMPANY SNAPSHOT
16.8.2 REVENUE ANALYSIS
16.8.3 PRODUCT PORTFOLIO
16.8.4 RECENT DEVELOPMENT
16.9 DUPONT
16.9.1 COMPANY SNAPSHOT
16.9.2 RECENT FINANCIALS
16.9.3 PRODUCT PORTFOLIO
16.9.4 RECENT DEVELOPMENTS
16.1 GRUPO PSA
16.10.1 COMPANY SNAPSHOT
16.10.2 PRODUCT PORTFOLIO
16.10.3 RECENT DEVELOPMENT
16.11 HERMES SWEETENERS LTD.
16.11.1 COMPANY SNAPSHOT
16.11.2 PRODUCT PORTFOLIO
16.11.3 RECENT DEVELOPMENT
16.12 HSWT
16.12.1 COMPANY SNAPSHOT
16.12.2 PRODUCT PORTFOLIO
16.12.3 RECENT DEVELOPMENT
16.13 JK SUCRALOSE INC.
16.13.1 COMPANY SNAPSHOT
16.13.2 PRODUCT PORTFOLIO
16.13.3 RECENT DEVELOPMENTS
16.14 LAYN CORP
16.14.1 COMPANY SNAPSHOT
16.14.2 PRODUCT PORTFOLIO
16.14.3 RECENT DEVELOPMENT
16.15 MAFCO WORLDWIDE LLC.
16.15.1 COMPANY SNAPSHOT
16.15.2 PRODUCT PORTFOLIO
16.15.3 RECENT DEVELOPMENTS
16.16 NOW FOODS
16.16.1 COMPANY SNAPSHOT
16.16.2 PRODUCT PORTFOLIO
16.16.3 RECENT DEVELOPMENTS
16.17 NUTRASWEETM CO
16.17.1 COMPANY SNAPSHOT
16.17.2 PRODUCT PORTFOLIO
16.17.3 RECENT DEVELOPMENTS
16.18 PYURE BRANDS LLC.
16.18.1 COMPANY SNAPSHOT
16.18.2 PRODUCT PORTFOLIO
16.18.3 RECENT DEVELOPMENTS
16.19 ROQUETTE FRÈRES.
16.19.1 COMPANY SNAPSHOT
16.19.2 PRODUCT PORTFOLIO
16.19.3 RECENT DEVELOPMENTS
16.2 TATE&LYLE
16.20.1 COMPANY SNAPSHOT
16.20.2 RECENT FINANCIALS
16.20.3 PRODUCT PORTFOLIO
16.20.4 RECENT DEVELOPMENTS
17 QUESTIONNAIRE
18 RELATED REPORTS
List of Table
TABLE 1 TOP IMPORT OF PLANT BASED SUGAR, 2020-2021, IN TONS
TABLE 2 TOP EXPORT OF PLANT BASED SUGAR, 2020-2021, IN TONS
TABLE 3 TOP IMPORT OF SYNTHETIC SUGAR, 2020-2021, IN TONS
TABLE 4 TOP EXPORT OF SYNTHETIC SUGAR, 2020-2021, IN TONS
TABLE 5 PRODUCTION OF SUGAR IN 2021/2022
TABLE 6 CONSUMPTION OF SUGAR IN 2021/2022
TABLE 7 PRICES OF PLANT-DERIVED SUGAR:
TABLE 8 PRICES OF SYNTHETIC SUGAR:
TABLE 9 PRICES OF REGULAR SUGAR:
TABLE 10 MIDDLE EAST & AFRICA PLANT-DERIVED AND SYNTHETIC SUGAR MARKET, BY TYPE, 2020-2029 (USD MILLION)
TABLE 11 MIDDLE EAST & AFRICA PLANT-DERIVED SUGAR IN PLANT-DERIVED AND SYNTHETIC SUGAR MARKET, BY REGION, 2020-2029 (USD MILLION)
TABLE 12 MIDDLE EAST & AFRICA PLANT-DERIVED SUGAR IN PLANT-DERIVED AND SYNTHETIC SUGAR MARKET, BY TYPE, 2020-2029 (USD MILLION)
TABLE 13 MIDDLE EAST & AFRICA PLANT-DERIVED SUGAR IN PLANT-DERIVED AND SYNTHETIC SUGAR MARKET, BY CATEGORY, 2020-2029 (USD MILLION)
TABLE 14 MIDDLE EAST & AFRICA SYNTHETIC SUGAR IN PLANT-DERIVED AND SYNTHETIC SUGAR MARKET, BY REGION, 2020-2029 (USD MILLION)
TABLE 15 MIDDLE EAST & AFRICA SYNTHETIC SUGAR IN PLANT-DERIVED AND SYNTHETIC SUGAR MARKET, BY TYPE, 2020-2029 (USD MILLION)
TABLE 16 MIDDLE EAST & AFRICA PLANT-DERIVED AND SYNTHETIC SUGAR MARKET, BY TYPE, 2020-2029 (USD MILLION)
TABLE 17 MIDDLE EAST & AFRICA DRY IN PLANT-DERIVED AND SYNTHETIC SUGAR MARKET, BY REGION, 2020-2029 (USD MILLION)
TABLE 18 MIDDLE EAST & AFRICA DRY IN PLANT-DERIVED AND SYNTHETIC SUGAR MARKET, BY TYPE , 2020-2029 (USD MILLION)
TABLE 19 MIDDLE EAST & AFRICA LIQUID IN PLANT-DERIVED AND SYNTHETIC SUGAR MARKET, BY REGION, 2020-2029 (USD MILLION)
TABLE 20 MIDDLE EAST & AFRICA PLANT-DERIVED AND SYNTHETIC SUGAR MARKET, BY APPLICATION, 2020-2029 (USD MILLION)
TABLE 21 MIDDLE EAST & AFRICA FOOD & BEVERAGES IN PLANT-DERIVED AND SYNTHETIC SUGAR MARKET, BY REGION, 2020-2029 (USD MILLION)
TABLE 22 MIDDLE EAST & AFRICA FOOD & BEVERAGES IN PLANT-DERIVED AND SYNTHETIC SUGAR MARKET, BY TYPE 2020-2029 (USD MILLION)
TABLE 23 MIDDLE EAST & AFRICA BEVERAGES PLANT-DERIVED AND SYNTHETIC SUGAR MARKET, BY TYPE, 2020-2029 (USD MILLION)
TABLE 24 MIDDLE EAST & AFRICA DAIRY BASED DRINKS IN PLANT-DERIVED AND SYNTHETIC SUGAR MARKET, BY TYPE, 2020-2029 (USD MILLION)
TABLE 25 MIDDLE EAST & AFRICA FROZEN DESSERTS IN PLANT-DERIVED AND SYNTHETIC SUGAR MARKET, BY TYPE, 2020-2029 (USD MILLION)
TABLE 26 MIDDLE EAST & AFRICA PROCESSED FOOD IN PLANT-DERIVED AND SYNTHETIC SUGAR MARKET, BY TYPE, 2020-2029 (USD MILLION)
TABLE 27 MIDDLE EAST & AFRICA CONVENIENCE FOOD IN PLANT-DERIVED AND SYNTHETIC SUGAR MARKET, BY TYPE, 2020-2029 (USD MILLION)
TABLE 28 MIDDLE EAST & AFRICA CONFECTIONERY IN PLANT-DERIVED AND SYNTHETIC SUGAR MARKET, BY TYPE, 2020-2029 (USD MILLION)
TABLE 29 MIDDLE EAST & AFRICA BAKERY IN PLANT-DERIVED AND SYNTHETIC SUGAR MARKET, BY TYPE, 2020-2029 (USD MILLION)
TABLE 30 MIDDLE EAST & AFRICA DAIRY PRODUCTS IN PLANT-DERIVED AND SYNTHETIC SUGAR MARKET, BY TYPE, 2020-2029 (USD MILLION)
TABLE 31 MIDDLE EAST & AFRICA INFANT FORMULA IN PLANT-DERIVED AND SYNTHETIC SUGAR MARKET, BY TYPE 2020-2029 (USD MILLION)
TABLE 32 MIDDLE EAST & AFRICA FOOD & BEVERAGES IN PLANT-DERIVED AND SYNTHETIC SUGAR MARKET, BY SWEETENER TYPE 2020-2029 (USD MILLION)
TABLE 33 MIDDLE EAST & AFRICA DIETARY SUPPLEMENTS IN PLANT-DERIVED AND SYNTHETIC SUGAR MARKET, BY REGION, 2020-2029 (USD MILLION)
TABLE 34 MIDDLE EAST & AFRICA DIETARY SUPPLEMENTS IN PLANT-DERIVED AND SYNTHETIC SUGAR MARKET, BY TYPE 2020-2029 (USD MILLION)
TABLE 35 MIDDLE EAST & AFRICA DIETARY SUPPLEMENTS IN PLANT-DERIVED AND SYNTHETIC SUGAR MARKET, BY SWEETENER TYPE 2020-2029 (USD MILLION)
TABLE 36 MIDDLE EAST & AFRICA PHARMACEUTICAL IN PLANT-DERIVED AND SYNTHETIC SUGAR MARKET, BY REGION, 2020-2029 (USD MILLION)
TABLE 37 MIDDLE EAST & AFRICA PHARMACEUTICAL IN PLANT-DERIVED AND SYNTHETIC SUGAR MARKET, BY TYPE 2020-2029 (USD MILLION)
TABLE 38 MIDDLE EAST & AFRICA PHARMACEUTICAL IN PLANT-DERIVED AND SYNTHETIC SUGAR MARKET, BY SWEETENER TYPE 2020-2029 (USD MILLION)
TABLE 39 MIDDLE EAST & AFRICA SPORTS NUTRITION IN PLANT-DERIVED AND SYNTHETIC SUGAR MARKET, BY REGION, 2020-2029 (USD MILLION)
TABLE 40 MIDDLE EAST & AFRICA SPORTS NUTRITION IN PLANT-DERIVED AND SYNTHETIC SUGAR MARKET, BY TYPE 2020-2029 (USD MILLION)
TABLE 41 MIDDLE EAST & AFRICA SPORTS NUTRITION IN PLANT-DERIVED AND SYNTHETIC SUGAR MARKET, BY SWEETENER TYPE 2020-2029 (USD MILLION)
TABLE 42 MIDDLE EAST & AFRICA OTHERS NUTRITION IN PLANT-DERIVED AND SYNTHETIC SUGAR MARKET, BY REGION, 2020-2029 (USD MILLION)
TABLE 43 MIDDLE EAST & AFRICA OTHERS IN PLANT-DERIVED AND SYNTHETIC SUGAR MARKET, BY SWEETENER TYPE 2020-2029 (USD MILLION)
TABLE 44 MIDDLE EAST AND AFRICA PLANT-DERIVED AND SYNTHETIC SUGAR MARKET, 2020-2029
TABLE 45 MIDDLE EAST AND AFRICA PLANT-DERIVED AND SYNTHETIC SUGAR MARKET, BY COUNTRY, 2020-2029 (USD MILLION)
TABLE 46 MIDDLE EAST AND AFRICA PLANT-DERIVED AND SYNTHETIC SUGAR MARKET, BY TYPE, 2020-2029 (USD MILLION)
TABLE 47 MIDDLE EAST AND AFRICA PLANT-DERIVED SUGAR IN PLANT-DERIVED AND SYNTHETIC SUGAR MARKET, BY TYPE 2020-2029 (USD MILLION)
TABLE 48 MIDDLE EAST AND AFRICA PLANT-DERIVED SUGAR IN PLANT-DERIVED AND SYNTHETIC SUGAR MARKET, BY CATEGORY, 2020-2029 (USD MILLION)
TABLE 49 MIDDLE EAST AND AFRICA SYNTHETIC SUGAR IN PLANT-DERIVED AND SYNTHETIC SUGAR MARKET, BY TYPE 2020-2029 (USD MILLION)
TABLE 50 MIDDLE EAST AND AFRICA PLANT-DERIVED AND SYNTHETIC SUGAR MARKET, BY FORM, 2020-2029 (USD MILLION)
TABLE 51 MIDDLE EAST AND AFRICA DRY IN PLANT-DERIVED AND SYNTHETIC SUGAR MARKET, BY TYPE, 2020-2029 (USD MILLION)
TABLE 52 MIDDLE EAST AND AFRICA PLANT-DERIVED AND SYNTHETIC SUGAR MARKET, BY APPLICATION, 2020-2029 (USD MILLION)
TABLE 53 MIDDLE EAST AND AFRICA FOOD & BEVERAGES IN PLANT-DERIVED AND SYNTHETIC SUGAR MARKET, BY TYPE 2020-2029 (USD MILLION)
TABLE 54 MIDDLE EAST AND AFRICA BAKERY IN PLANT-DERIVED AND SYNTHETIC SUGAR MARKET, BY TYPE 2020-2029 (USD MILLION)
TABLE 55 MIDDLE EAST AND AFRICA DAIRY PRODUCTS IN PLANT-DERIVED AND SYNTHETIC SUGAR MARKET, BY TYPE, 2020-2029 (USD MILLION)
TABLE 56 MIDDLE EAST AND AFRICA PROCESSED FOOD IN PLANT-DERIVED AND SYNTHETIC SUGAR MARKET, BY TYPE, 2020-2029 (USD MILLION)
TABLE 57 MIDDLE EAST AND AFRICA CONFECTIONERY IN PLANT-DERIVED AND SYNTHETIC SUGAR MARKET, BY TYPE, 2020-2029 (USD MILLION)
TABLE 58 MIDDLE EAST AND AFRICA FROZEN DESSERTS IN PLANT-DERIVED AND SYNTHETIC SUGAR MARKET, BY TYPE 2020-2029 (USD MILLION)
TABLE 59 MIDDLE EAST AND AFRICA INFANT FORMULA IN PLANT-DERIVED AND SYNTHETIC SUGAR MARKET, BY TYPE 2020-2029 (USD MILLION)
TABLE 60 MIDDLE EAST AND AFRICA CONVENIENCE FOOD IN PLANT-DERIVED AND SYNTHETIC SUGAR MARKET, BY TYPE, 2020-2029 (USD MILLION)
TABLE 61 MIDDLE EAST AND AFRICA BEVERAGES PLANT-DERIVED AND SYNTHETIC SUGAR MARKET, BY TYPE, 2020-2029 (USD MILLION)
TABLE 62 MIDDLE EAST AND AFRICA DAIRY BASED DRINKS IN PLANT-DERIVED AND SYNTHETIC SUGAR MARKET, BY TYPE, 2020-2029 (USD MILLION)
TABLE 63 MIDDLE EAST AND AFRICA FOOD AND BEVERAGES IN PLANT-DERIVED AND SYNTHETIC SUGAR MARKET, BY SWEETENER TYPE, 2020-2029 (USD MILLION)
TABLE 64 MIDDLE EAST AND AFRICA DIETARY SUPPLEMENTS IN PLANT-DERIVED AND SYNTHETIC SUGAR MARKET, BY TYPE 2020-2029 (USD MILLION)
TABLE 65 MIDDLE EAST AND AFRICA DIETARY SUPPLEMENTS IN PLANT-DERIVED AND SYNTHETIC SUGAR MARKET, BY SWEETENER TYPE 2020-2029 (USD MILLION)
TABLE 66 MIDDLE EAST AND AFRICA PHARMACEUTICAL IN PLANT-DERIVED AND SYNTHETIC SUGAR MARKET, BY TYPE 2020-2029 (USD MILLION)
TABLE 67 MIDDLE EAST AND AFRICA PHARMACEUTICAL IN PLANT-DERIVED AND SYNTHETIC SUGAR MARKET, BY SWEETENER TYPE 2020-2029 (USD MILLION)
TABLE 68 MIDDLE EAST AND AFRICA SPORTS NUTRITION IN PLANT-DERIVED AND SYNTHETIC SUGAR MARKET, BY TYPE 2020-2029 (USD MILLION)
TABLE 69 MIDDLE EAST AND AFRICA SPORTS NUTRITION IN PLANT-DERIVED AND SYNTHETIC SUGAR MARKET, BY SWEETENER TYPE 2020-2029 (USD MILLION)
TABLE 70 MIDDLE EAST AND AFRICA OTHERS IN PLANT-DERIVED AND SYNTHETIC SUGAR MARKET, BY SWEETENER TYPE 2020-2029 (USD MILLION)
TABLE 71 SOUTH AFRICA PLANT-DERIVED AND SYNTHETIC SUGAR MARKET, 2020-2029
TABLE 72 SOUTH AFRICA PLANT-DERIVED AND SYNTHETIC SUGAR MARKET, BY TYPE, 2020-2029 (USD MILLION)
TABLE 73 SOUTH AFRICA PLANT-DERIVED SUGAR IN PLANT-DERIVED AND SYNTHETIC SUGAR MARKET, BY TYPE 2020-2029 (USD MILLION)
TABLE 74 SOUTH AFRICA PLANT-DERIVED SUGAR IN PLANT-DERIVED AND SYNTHETIC SUGAR MARKET, BY CATEGORY, 2020-2029 (USD MILLION)
TABLE 75 SOUTH AFRICA SYNTHETIC SUGAR IN PLANT-DERIVED AND SYNTHETIC SUGAR MARKET, BY TYPE 2020-2029 (USD MILLION)
TABLE 76 SOUTH AFRICA PLANT-DERIVED AND SYNTHETIC SUGAR MARKET, BY FORM, 2020-2029 (USD MILLION)
TABLE 77 SOUTH AFRICA DRY IN PLANT-DERIVED AND SYNTHETIC SUGAR MARKET, BY TYPE, 2020-2029 (USD MILLION)
TABLE 78 SOUTH AFRICA PLANT-DERIVED AND SYNTHETIC SUGAR MARKET, BY APPLICATION, 2020-2029 (USD MILLION)
TABLE 79 SOUTH AFRICA FOOD & BEVERAGES IN PLANT-DERIVED AND SYNTHETIC SUGAR MARKET, BY TYPE 2020-2029 (USD MILLION)
TABLE 80 SOUTH AFRICA BAKERY IN PLANT-DERIVED AND SYNTHETIC SUGAR MARKET, BY TYPE 2020-2029 (USD MILLION)
TABLE 81 SOUTH AFRICA DAIRY PRODUCTS IN PLANT-DERIVED AND SYNTHETIC SUGAR MARKET, BY TYPE, 2020-2029 (USD MILLION)
TABLE 82 SOUTH AFRICA PROCESSED FOOD IN PLANT-DERIVED AND SYNTHETIC SUGAR MARKET, BY TYPE, 2020-2029 (USD MILLION)
TABLE 83 SOUTH AFRICA CONFECTIONERY IN PLANT-DERIVED AND SYNTHETIC SUGAR MARKET, BY TYPE, 2020-2029 (USD MILLION)
TABLE 84 SOUTH AFRICA FROZEN DESSERTS IN PLANT-DERIVED AND SYNTHETIC SUGAR MARKET, BY TYPE 2020-2029 (USD MILLION)
TABLE 85 SOUTH AFRICA INFANT FORMULA IN PLANT-DERIVED AND SYNTHETIC SUGAR MARKET, BY TYPE 2020-2029 (USD MILLION)
TABLE 86 SOUTH AFRICA CONVENIENCE FOOD IN PLANT-DERIVED AND SYNTHETIC SUGAR MARKET, BY TYPE, 2020-2029 (USD MILLION)
TABLE 87 SOUTH AFRICA BEVERAGES PLANT-DERIVED AND SYNTHETIC SUGAR MARKET, BY TYPE, 2020-2029 (USD MILLION)
TABLE 88 SOUTH AFRICA DAIRY BASED DRINKS IN PLANT-DERIVED AND SYNTHETIC SUGAR MARKET, BY TYPE, 2020-2029 (USD MILLION)
TABLE 89 SOUTH AFRICA FOOD AND BEVERAGES IN PLANT-DERIVED AND SYNTHETIC SUGAR MARKET, BY SWEETENER TYPE, 2020-2029 (USD MILLION)
TABLE 90 SOUTH AFRICA DIETARY SUPPLEMENTS IN PLANT-DERIVED AND SYNTHETIC SUGAR MARKET, BY TYPE 2020-2029 (USD MILLION)
TABLE 91 SOUTH AFRICA DIETARY SUPPLEMENTS IN PLANT-DERIVED AND SYNTHETIC SUGAR MARKET, BY SWEETENER TYPE 2020-2029 (USD MILLION)
TABLE 92 SOUTH AFRICA PHARMACEUTICAL IN PLANT-DERIVED AND SYNTHETIC SUGAR MARKET, BY TYPE 2020-2029 (USD MILLION)
TABLE 93 SOUTH AFRICA PHARMACEUTICAL IN PLANT-DERIVED AND SYNTHETIC SUGAR MARKET, BY SWEETENER TYPE 2020-2029 (USD MILLION)
TABLE 94 SOUTH AFRICA SPORTS NUTRITION IN PLANT-DERIVED AND SYNTHETIC SUGAR MARKET, BY TYPE 2020-2029 (USD MILLION)
TABLE 95 SOUTH AFRICA SPORTS NUTRITION IN PLANT-DERIVED AND SYNTHETIC SUGAR MARKET, BY SWEETENER TYPE 2020-2029 (USD MILLION)
TABLE 96 SOUTH AFRICA OTHERS IN PLANT-DERIVED AND SYNTHETIC SUGAR MARKET, BY SWEETENER TYPE 2020-2029 (USD MILLION)
TABLE 97 UNITED ARAB EMIRATES PLANT-DERIVED AND SYNTHETIC SUGAR MARKET, 2020-2029
TABLE 98 UNITED ARAB EMIRATES PLANT-DERIVED AND SYNTHETIC SUGAR MARKET, BY TYPE, 2020-2029 (USD MILLION)
TABLE 99 UNITED ARAB EMIRATES PLANT-DERIVED SUGAR IN PLANT-DERIVED AND SYNTHETIC SUGAR MARKET, BY TYPE 2020-2029 (USD MILLION)
TABLE 100 UNITED ARAB EMIRATES PLANT-DERIVED SUGAR IN PLANT-DERIVED AND SYNTHETIC SUGAR MARKET, BY CATEGORY, 2020-2029 (USD MILLION)
TABLE 101 UNITED ARAB EMIRATES SYNTHETIC SUGAR IN PLANT-DERIVED AND SYNTHETIC SUGAR MARKET, BY TYPE 2020-2029 (USD MILLION)
TABLE 102 UNITED ARAB EMIRATES PLANT-DERIVED AND SYNTHETIC SUGAR MARKET, BY FORM, 2020-2029 (USD MILLION)
TABLE 103 UNITED ARAB EMIRATES DRY IN PLANT-DERIVED AND SYNTHETIC SUGAR MARKET, BY TYPE, 2020-2029 (USD MILLION)
TABLE 104 UNITED ARAB EMIRATES PLANT-DERIVED AND SYNTHETIC SUGAR MARKET, BY APPLICATION, 2020-2029 (USD MILLION)
TABLE 105 UNITED ARAB EMIRATES FOOD & BEVERAGES IN PLANT-DERIVED AND SYNTHETIC SUGAR MARKET, BY TYPE 2020-2029 (USD MILLION)
TABLE 106 UNITED ARAB EMIRATES BAKERY IN PLANT-DERIVED AND SYNTHETIC SUGAR MARKET, BY TYPE 2020-2029 (USD MILLION)
TABLE 107 UNITED ARAB EMIRATES DAIRY PRODUCTS IN PLANT-DERIVED AND SYNTHETIC SUGAR MARKET, BY TYPE, 2020-2029 (USD MILLION)
TABLE 108 UNITED ARAB EMIRATES PROCESSED FOOD IN PLANT-DERIVED AND SYNTHETIC SUGAR MARKET, BY TYPE, 2020-2029 (USD MILLION)
TABLE 109 UNITED ARAB EMIRATES CONFECTIONERY IN PLANT-DERIVED AND SYNTHETIC SUGAR MARKET, BY TYPE, 2020-2029 (USD MILLION)
TABLE 110 UNITED ARAB EMIRATES FROZEN DESSERTS IN PLANT-DERIVED AND SYNTHETIC SUGAR MARKET, BY TYPE 2020-2029 (USD MILLION)
TABLE 111 UNITED ARAB EMIRATES INFANT FORMULA IN PLANT-DERIVED AND SYNTHETIC SUGAR MARKET, BY TYPE 2020-2029 (USD MILLION)
TABLE 112 UNITED ARAB EMIRATES CONVENIENCE FOOD IN PLANT-DERIVED AND SYNTHETIC SUGAR MARKET, BY TYPE, 2020-2029 (USD MILLION)
TABLE 113 UNITED ARAB EMIRATES BEVERAGES PLANT-DERIVED AND SYNTHETIC SUGAR MARKET, BY TYPE, 2020-2029 (USD MILLION)
TABLE 114 UNITED ARAB EMIRATES DAIRY BASED DRINKS IN PLANT-DERIVED AND SYNTHETIC SUGAR MARKET, BY TYPE, 2020-2029 (USD MILLION)
TABLE 115 UNITED ARAB EMIRATES FOOD AND BEVERAGES IN PLANT-DERIVED AND SYNTHETIC SUGAR MARKET, BY SWEETENER TYPE, 2020-2029 (USD MILLION)
TABLE 116 UNITED ARAB EMIRATES DIETARY SUPPLEMENTS IN PLANT-DERIVED AND SYNTHETIC SUGAR MARKET, BY TYPE 2020-2029 (USD MILLION)
TABLE 117 UNITED ARAB EMIRATES DIETARY SUPPLEMENTS IN PLANT-DERIVED AND SYNTHETIC SUGAR MARKET, BY SWEETENER TYPE 2020-2029 (USD MILLION)
TABLE 118 UNITED ARAB EMIRATES PHARMACEUTICAL IN PLANT-DERIVED AND SYNTHETIC SUGAR MARKET, BY TYPE 2020-2029 (USD MILLION)
TABLE 119 UNITED ARAB EMIRATES PHARMACEUTICAL IN PLANT-DERIVED AND SYNTHETIC SUGAR MARKET, BY SWEETENER TYPE 2020-2029 (USD MILLION)
TABLE 120 UNITED ARAB EMIRATES SPORTS NUTRITION IN PLANT-DERIVED AND SYNTHETIC SUGAR MARKET, BY TYPE 2020-2029 (USD MILLION)
TABLE 121 UNITED ARAB EMIRATES SPORTS NUTRITION IN PLANT-DERIVED AND SYNTHETIC SUGAR MARKET, BY SWEETENER TYPE 2020-2029 (USD MILLION)
TABLE 122 UNITED ARAB EMIRATES OTHERS IN PLANT-DERIVED AND SYNTHETIC SUGAR MARKET, BY SWEETENER TYPE 2020-2029 (USD MILLION)
TABLE 123 SAUDI ARABIA PLANT-DERIVED AND SYNTHETIC SUGAR MARKET, 2020-2029
TABLE 124 SAUDI ARABIA PLANT-DERIVED AND SYNTHETIC SUGAR MARKET, BY TYPE, 2020-2029 (USD MILLION)
TABLE 125 SAUDI ARABIA PLANT-DERIVED SUGAR IN PLANT-DERIVED AND SYNTHETIC SUGAR MARKET, BY TYPE 2020-2029 (USD MILLION)
TABLE 126 SAUDI ARABIA PLANT-DERIVED SUGAR IN PLANT-DERIVED AND SYNTHETIC SUGAR MARKET, BY CATEGORY, 2020-2029 (USD MILLION)
TABLE 127 SAUDI ARABIA SYNTHETIC SUGAR IN PLANT-DERIVED AND SYNTHETIC SUGAR MARKET, BY TYPE 2020-2029 (USD MILLION)
TABLE 128 SAUDI ARABIA PLANT-DERIVED AND SYNTHETIC SUGAR MARKET, BY FORM, 2020-2029 (USD MILLION)
TABLE 129 SAUDI ARABIA DRY IN PLANT-DERIVED AND SYNTHETIC SUGAR MARKET, BY TYPE, 2020-2029 (USD MILLION)
TABLE 130 SAUDI ARABIA PLANT-DERIVED AND SYNTHETIC SUGAR MARKET, BY APPLICATION, 2020-2029 (USD MILLION)
TABLE 131 SAUDI ARABIA FOOD & BEVERAGES IN PLANT-DERIVED AND SYNTHETIC SUGAR MARKET, BY TYPE 2020-2029 (USD MILLION)
TABLE 132 SAUDI ARABIA BAKERY IN PLANT-DERIVED AND SYNTHETIC SUGAR MARKET, BY TYPE 2020-2029 (USD MILLION)
TABLE 133 SAUDI ARABIA DAIRY PRODUCTS IN PLANT-DERIVED AND SYNTHETIC SUGAR MARKET, BY TYPE, 2020-2029 (USD MILLION)
TABLE 134 SAUDI ARABIA PROCESSED FOOD IN PLANT-DERIVED AND SYNTHETIC SUGAR MARKET, BY TYPE, 2020-2029 (USD MILLION)
TABLE 135 SAUDI ARABIA CONFECTIONERY IN PLANT-DERIVED AND SYNTHETIC SUGAR MARKET, BY TYPE, 2020-2029 (USD MILLION)
TABLE 136 SAUDI ARABIA FROZEN DESSERTS IN PLANT-DERIVED AND SYNTHETIC SUGAR MARKET, BY TYPE 2020-2029 (USD MILLION)
TABLE 137 SAUDI ARABIA INFANT FORMULA IN PLANT-DERIVED AND SYNTHETIC SUGAR MARKET, BY TYPE 2020-2029 (USD MILLION)
TABLE 138 SAUDI ARABIA CONVENIENCE FOOD IN PLANT-DERIVED AND SYNTHETIC SUGAR MARKET, BY TYPE, 2020-2029 (USD MILLION)
TABLE 139 SAUDI ARABIA BEVERAGES PLANT-DERIVED AND SYNTHETIC SUGAR MARKET, BY TYPE, 2020-2029 (USD MILLION)
TABLE 140 SAUDI ARABIA DAIRY BASED DRINKS IN PLANT-DERIVED AND SYNTHETIC SUGAR MARKET, BY TYPE, 2020-2029 (USD MILLION)
TABLE 141 SAUDI ARABIA FOOD AND BEVERAGES IN PLANT-DERIVED AND SYNTHETIC SUGAR MARKET, BY SWEETENER TYPE, 2020-2029 (USD MILLION)
TABLE 142 SAUDI ARABIA DIETARY SUPPLEMENTS IN PLANT-DERIVED AND SYNTHETIC SUGAR MARKET, BY TYPE 2020-2029 (USD MILLION)
TABLE 143 SAUDI ARABIA DIETARY SUPPLEMENTS IN PLANT-DERIVED AND SYNTHETIC SUGAR MARKET, BY SWEETENER TYPE 2020-2029 (USD MILLION)
TABLE 144 SAUDI ARABIA PHARMACEUTICAL IN PLANT-DERIVED AND SYNTHETIC SUGAR MARKET, BY TYPE 2020-2029 (USD MILLION)
TABLE 145 SAUDI ARABIA PHARMACEUTICAL IN PLANT-DERIVED AND SYNTHETIC SUGAR MARKET, BY SWEETENER TYPE 2020-2029 (USD MILLION)
TABLE 146 SAUDI ARABIA SPORTS NUTRITION IN PLANT-DERIVED AND SYNTHETIC SUGAR MARKET, BY TYPE 2020-2029 (USD MILLION)
TABLE 147 SAUDI ARABIA SPORTS NUTRITION IN PLANT-DERIVED AND SYNTHETIC SUGAR MARKET, BY SWEETENER TYPE 2020-2029 (USD MILLION)
TABLE 148 SAUDI ARABIA OTHERS IN PLANT-DERIVED AND SYNTHETIC SUGAR MARKET, BY SWEETENER TYPE 2020-2029 (USD MILLION)
TABLE 149 KUWAIT PLANT-DERIVED AND SYNTHETIC SUGAR MARKET, 2020-2029
TABLE 150 KUWAIT PLANT-DERIVED AND SYNTHETIC SUGAR MARKET, BY TYPE, 2020-2029 (USD MILLION)
TABLE 151 KUWAIT PLANT-DERIVED SUGAR IN PLANT-DERIVED AND SYNTHETIC SUGAR MARKET, BY TYPE 2020-2029 (USD MILLION)
TABLE 152 KUWAIT PLANT-DERIVED SUGAR IN PLANT-DERIVED AND SYNTHETIC SUGAR MARKET, BY CATEGORY, 2020-2029 (USD MILLION)
TABLE 153 KUWAIT SYNTHETIC SUGAR IN PLANT-DERIVED AND SYNTHETIC SUGAR MARKET, BY TYPE 2020-2029 (USD MILLION)
TABLE 154 KUWAIT PLANT-DERIVED AND SYNTHETIC SUGAR MARKET, BY FORM, 2020-2029 (USD MILLION)
TABLE 155 KUWAIT DRY IN PLANT-DERIVED AND SYNTHETIC SUGAR MARKET, BY TYPE, 2020-2029 (USD MILLION)
TABLE 156 KUWAIT PLANT-DERIVED AND SYNTHETIC SUGAR MARKET, BY APPLICATION, 2020-2029 (USD MILLION)
TABLE 157 KUWAIT FOOD & BEVERAGES IN PLANT-DERIVED AND SYNTHETIC SUGAR MARKET, BY TYPE 2020-2029 (USD MILLION)
TABLE 158 KUWAIT BAKERY IN PLANT-DERIVED AND SYNTHETIC SUGAR MARKET, BY TYPE 2020-2029 (USD MILLION)
TABLE 159 KUWAIT DAIRY PRODUCTS IN PLANT-DERIVED AND SYNTHETIC SUGAR MARKET, BY TYPE, 2020-2029 (USD MILLION)
TABLE 160 KUWAIT PROCESSED FOOD IN PLANT-DERIVED AND SYNTHETIC SUGAR MARKET, BY TYPE, 2020-2029 (USD MILLION)
TABLE 161 KUWAIT CONFECTIONERY IN PLANT-DERIVED AND SYNTHETIC SUGAR MARKET, BY TYPE, 2020-2029 (USD MILLION)
TABLE 162 KUWAIT FROZEN DESSERTS IN PLANT-DERIVED AND SYNTHETIC SUGAR MARKET, BY TYPE 2020-2029 (USD MILLION)
TABLE 163 KUWAIT INFANT FORMULA IN PLANT-DERIVED AND SYNTHETIC SUGAR MARKET, BY TYPE 2020-2029 (USD MILLION)
TABLE 164 KUWAIT CONVENIENCE FOOD IN PLANT-DERIVED AND SYNTHETIC SUGAR MARKET, BY TYPE, 2020-2029 (USD MILLION)
TABLE 165 KUWAIT BEVERAGES PLANT-DERIVED AND SYNTHETIC SUGAR MARKET, BY TYPE, 2020-2029 (USD MILLION)
TABLE 166 KUWAIT DAIRY BASED DRINKS IN PLANT-DERIVED AND SYNTHETIC SUGAR MARKET, BY TYPE, 2020-2029 (USD MILLION)
TABLE 167 KUWAIT FOOD AND BEVERAGES IN PLANT-DERIVED AND SYNTHETIC SUGAR MARKET, BY SWEETENER TYPE, 2020-2029 (USD MILLION)
TABLE 168 KUWAIT DIETARY SUPPLEMENTS IN PLANT-DERIVED AND SYNTHETIC SUGAR MARKET, BY TYPE 2020-2029 (USD MILLION)
TABLE 169 KUWAIT DIETARY SUPPLEMENTS IN PLANT-DERIVED AND SYNTHETIC SUGAR MARKET, BY SWEETENER TYPE 2020-2029 (USD MILLION)
TABLE 170 KUWAIT PHARMACEUTICAL IN PLANT-DERIVED AND SYNTHETIC SUGAR MARKET, BY TYPE 2020-2029 (USD MILLION)
TABLE 171 KUWAIT PHARMACEUTICAL IN PLANT-DERIVED AND SYNTHETIC SUGAR MARKET, BY SWEETENER TYPE 2020-2029 (USD MILLION)
TABLE 172 KUWAIT SPORTS NUTRITION IN PLANT-DERIVED AND SYNTHETIC SUGAR MARKET, BY TYPE 2020-2029 (USD MILLION)
TABLE 173 KUWAIT SPORTS NUTRITION IN PLANT-DERIVED AND SYNTHETIC SUGAR MARKET, BY SWEETENER TYPE 2020-2029 (USD MILLION)
TABLE 174 KUWAIT OTHERS IN PLANT-DERIVED AND SYNTHETIC SUGAR MARKET, BY SWEETENER TYPE 2020-2029 (USD MILLION)
TABLE 175 OMAN PLANT-DERIVED AND SYNTHETIC SUGAR MARKET, 2020-2029
TABLE 176 OMAN PLANT-DERIVED AND SYNTHETIC SUGAR MARKET, BY TYPE, 2020-2029 (USD MILLION)
TABLE 177 OMAN PLANT-DERIVED SUGAR IN PLANT-DERIVED AND SYNTHETIC SUGAR MARKET, BY TYPE 2020-2029 (USD MILLION)
TABLE 178 OMAN PLANT-DERIVED SUGAR IN PLANT-DERIVED AND SYNTHETIC SUGAR MARKET, BY CATEGORY, 2020-2029 (USD MILLION)
TABLE 179 OMAN SYNTHETIC SUGAR IN PLANT-DERIVED AND SYNTHETIC SUGAR MARKET, BY TYPE 2020-2029 (USD MILLION)
TABLE 180 OMAN PLANT-DERIVED AND SYNTHETIC SUGAR MARKET, BY FORM, 2020-2029 (USD MILLION)
TABLE 181 OMAN DRY IN PLANT-DERIVED AND SYNTHETIC SUGAR MARKET, BY TYPE, 2020-2029 (USD MILLION)
TABLE 182 OMAN PLANT-DERIVED AND SYNTHETIC SUGAR MARKET, BY APPLICATION, 2020-2029 (USD MILLION)
TABLE 183 OMAN FOOD & BEVERAGES IN PLANT-DERIVED AND SYNTHETIC SUGAR MARKET, BY TYPE 2020-2029 (USD MILLION)
TABLE 184 OMAN BAKERY IN PLANT-DERIVED AND SYNTHETIC SUGAR MARKET, BY TYPE 2020-2029 (USD MILLION)
TABLE 185 OMAN DAIRY PRODUCTS IN PLANT-DERIVED AND SYNTHETIC SUGAR MARKET, BY TYPE, 2020-2029 (USD MILLION)
TABLE 186 OMAN PROCESSED FOOD IN PLANT-DERIVED AND SYNTHETIC SUGAR MARKET, BY TYPE, 2020-2029 (USD MILLION)
TABLE 187 OMAN CONFECTIONERY IN PLANT-DERIVED AND SYNTHETIC SUGAR MARKET, BY TYPE, 2020-2029 (USD MILLION)
TABLE 188 OMAN FROZEN DESSERTS IN PLANT-DERIVED AND SYNTHETIC SUGAR MARKET, BY TYPE 2020-2029 (USD MILLION)
TABLE 189 OMAN INFANT FORMULA IN PLANT-DERIVED AND SYNTHETIC SUGAR MARKET, BY TYPE 2020-2029 (USD MILLION)
TABLE 190 OMAN CONVENIENCE FOOD IN PLANT-DERIVED AND SYNTHETIC SUGAR MARKET, BY TYPE, 2020-2029 (USD MILLION)
TABLE 191 OMAN BEVERAGES PLANT-DERIVED AND SYNTHETIC SUGAR MARKET, BY TYPE, 2020-2029 (USD MILLION)
TABLE 192 OMAN DAIRY BASED DRINKS IN PLANT-DERIVED AND SYNTHETIC SUGAR MARKET, BY TYPE, 2020-2029 (USD MILLION)
TABLE 193 OMAN FOOD AND BEVERAGES IN PLANT-DERIVED AND SYNTHETIC SUGAR MARKET, BY SWEETENER TYPE, 2020-2029 (USD MILLION)
TABLE 194 OMAN DIETARY SUPPLEMENTS IN PLANT-DERIVED AND SYNTHETIC SUGAR MARKET, BY TYPE 2020-2029 (USD MILLION)
TABLE 195 OMAN DIETARY SUPPLEMENTS IN PLANT-DERIVED AND SYNTHETIC SUGAR MARKET, BY SWEETENER TYPE 2020-2029 (USD MILLION)
TABLE 196 OMAN PHARMACEUTICAL IN PLANT-DERIVED AND SYNTHETIC SUGAR MARKET, BY TYPE 2020-2029 (USD MILLION)
TABLE 197 OMAN PHARMACEUTICAL IN PLANT-DERIVED AND SYNTHETIC SUGAR MARKET, BY SWEETENER TYPE 2020-2029 (USD MILLION)
TABLE 198 OMAN SPORTS NUTRITION IN PLANT-DERIVED AND SYNTHETIC SUGAR MARKET, BY TYPE 2020-2029 (USD MILLION)
TABLE 199 OMAN SPORTS NUTRITION IN PLANT-DERIVED AND SYNTHETIC SUGAR MARKET, BY SWEETENER TYPE 2020-2029 (USD MILLION)
TABLE 200 OMAN OTHERS IN PLANT-DERIVED AND SYNTHETIC SUGAR MARKET, BY SWEETENER TYPE 2020-2029 (USD MILLION)
TABLE 201 QATAR PLANT-DERIVED AND SYNTHETIC SUGAR MARKET, 2020-2029
TABLE 202 QATAR PLANT-DERIVED AND SYNTHETIC SUGAR MARKET, BY TYPE, 2020-2029 (USD MILLION)
TABLE 203 QATAR PLANT-DERIVED SUGAR IN PLANT-DERIVED AND SYNTHETIC SUGAR MARKET, BY TYPE 2020-2029 (USD MILLION)
TABLE 204 QATAR PLANT-DERIVED SUGAR IN PLANT-DERIVED AND SYNTHETIC SUGAR MARKET, BY CATEGORY, 2020-2029 (USD MILLION)
TABLE 205 QATAR SYNTHETIC SUGAR IN PLANT-DERIVED AND SYNTHETIC SUGAR MARKET, BY TYPE 2020-2029 (USD MILLION)
TABLE 206 QATAR PLANT-DERIVED AND SYNTHETIC SUGAR MARKET, BY FORM, 2020-2029 (USD MILLION)
TABLE 207 QATAR DRY IN PLANT-DERIVED AND SYNTHETIC SUGAR MARKET, BY TYPE, 2020-2029 (USD MILLION)
TABLE 208 QATAR PLANT-DERIVED AND SYNTHETIC SUGAR MARKET, BY APPLICATION, 2020-2029 (USD MILLION)
TABLE 209 QATAR FOOD & BEVERAGES IN PLANT-DERIVED AND SYNTHETIC SUGAR MARKET, BY TYPE 2020-2029 (USD MILLION)
TABLE 210 QATAR BAKERY IN PLANT-DERIVED AND SYNTHETIC SUGAR MARKET, BY TYPE 2020-2029 (USD MILLION)
TABLE 211 QATAR DAIRY PRODUCTS IN PLANT-DERIVED AND SYNTHETIC SUGAR MARKET, BY TYPE, 2020-2029 (USD MILLION)
TABLE 212 QATAR PROCESSED FOOD IN PLANT-DERIVED AND SYNTHETIC SUGAR MARKET, BY TYPE, 2020-2029 (USD MILLION)
TABLE 213 QATAR CONFECTIONERY IN PLANT-DERIVED AND SYNTHETIC SUGAR MARKET, BY TYPE, 2020-2029 (USD MILLION)
TABLE 214 QATAR FROZEN DESSERTS IN PLANT-DERIVED AND SYNTHETIC SUGAR MARKET, BY TYPE 2020-2029 (USD MILLION)
TABLE 215 QATAR INFANT FORMULA IN PLANT-DERIVED AND SYNTHETIC SUGAR MARKET, BY TYPE 2020-2029 (USD MILLION)
TABLE 216 QATAR CONVENIENCE FOOD IN PLANT-DERIVED AND SYNTHETIC SUGAR MARKET, BY TYPE, 2020-2029 (USD MILLION)
TABLE 217 QATAR BEVERAGES PLANT-DERIVED AND SYNTHETIC SUGAR MARKET, BY TYPE, 2020-2029 (USD MILLION)
TABLE 218 QATAR DAIRY BASED DRINKS IN PLANT-DERIVED AND SYNTHETIC SUGAR MARKET, BY TYPE, 2020-2029 (USD MILLION)
TABLE 219 QATAR FOOD AND BEVERAGES IN PLANT-DERIVED AND SYNTHETIC SUGAR MARKET, BY SWEETENER TYPE, 2020-2029 (USD MILLION)
TABLE 220 QATAR DIETARY SUPPLEMENTS IN PLANT-DERIVED AND SYNTHETIC SUGAR MARKET, BY TYPE 2020-2029 (USD MILLION)
TABLE 221 QATAR DIETARY SUPPLEMENTS IN PLANT-DERIVED AND SYNTHETIC SUGAR MARKET, BY SWEETENER TYPE 2020-2029 (USD MILLION)
TABLE 222 QATAR PHARMACEUTICAL IN PLANT-DERIVED AND SYNTHETIC SUGAR MARKET, BY TYPE 2020-2029 (USD MILLION)
TABLE 223 QATAR PHARMACEUTICAL IN PLANT-DERIVED AND SYNTHETIC SUGAR MARKET, BY SWEETENER TYPE 2020-2029 (USD MILLION)
TABLE 224 QATAR SPORTS NUTRITION IN PLANT-DERIVED AND SYNTHETIC SUGAR MARKET, BY TYPE 2020-2029 (USD MILLION)
TABLE 225 QATAR SPORTS NUTRITION IN PLANT-DERIVED AND SYNTHETIC SUGAR MARKET, BY SWEETENER TYPE 2020-2029 (USD MILLION)
TABLE 226 QATAR OTHERS IN PLANT-DERIVED AND SYNTHETIC SUGAR MARKET, BY SWEETENER TYPE 2020-2029 (USD MILLION)
TABLE 227 REST OF MIDDLE EAST & AFRICA PLANT-DERIVED AND SYNTHETIC SUGAR MARKET, 2020-2029
TABLE 228 REST OF MIDDLE EAST & AFRICA PLANT-DERIVED AND SYNTHETIC SUGAR MARKET, BY TYPE, 2020-2029 (USD MILLION)
List of Figure
FIGURE 1 MIDDLE EAST & AFRICA PLANT-DERIVED AND SYNTHETIC SUGAR MARKET: SEGMENTATION
FIGURE 2 MIDDLE EAST & AFRICA PLANT-DERIVED AND SYNTHETIC SUGAR MARKET: DATA TRIANGULATION
FIGURE 3 MIDDLE EAST & AFRICA PLANT-DERIVED AND SYNTHETIC SUGAR MARKET: DROC ANALYSIS
FIGURE 4 MIDDLE EAST & AFRICA PLANT-DERIVED AND SYNTHETIC SUGAR MARKET: MIDDLE EAST & AFRICA VS REGIONAL ANALYSIS
FIGURE 5 MIDDLE EAST & AFRICA PLANT-DERIVED AND SYNTHETIC SUGAR MARKET: COMPANY RESEARCH ANALYSIS
FIGURE 6 MIDDLE EAST & AFRICA PLANT-DERIVED AND SYNTHETIC SUGAR MARKET: INTERVIEW DEMOGRAPHICS
FIGURE 7 MIDDLE EAST & AFRICA PLANT-DERIVED AND SYNTHETIC SUGAR MARKET: DBMR POSITION GRID
FIGURE 8 MIDDLE EAST & AFRICA PLANT-DERIVED AND SYNTHETIC SUGAR MARKET: VENDOR SHARE ANALYSIS
FIGURE 9 MIDDLE EAST & AFRICA PLANT-DERIVED AND SYNTHETIC SUGAR MARKET: SEGMENTATION
FIGURE 10 THE HIGH DEMAND FOR HEALTHY FOOD INGREDIENTS IN FOOD AND BEVERAGE SECTOR IS EXPECTED TO DRIVE THE MIDDLE EAST & AFRICA PLANT-DERIVED AND SYNTHETIC SUGAR MARKET IN THE FORECAST PERIOD OF 2022 TO 2029
FIGURE 11 THE PLANT DERIVED SUGAR SEGMENT IS EXPECTED TO ACCOUNT FOR THE LARGEST SHARE OF THE MIDDLE EAST & AFRICA PLANT-DERIVED AND SYNTHETIC SUGAR MARKET IN THE FORECAST PERIOD OF 2022 TO 2029
FIGURE 12 VALUE CHAIN OF PLANT DERIVED SUGAR AND SYNTHETIC SUGAR
FIGURE 13 SUPPLY CHAIN OF PLANT-DERIVED SUGAR
FIGURE 14 SUPPLY CHAIN OF SYNTHETIC SUGAR
FIGURE 15 DRIVERS, RESTRAINTS, OPPORTUNITIES, AND CHALLENGES OF THE MIDDLE EAST & AFRICA PLANT-DERIVED AND SYNTHETIC SUGAR MARKET
FIGURE 16 MIDDLE EAST & AFRICA PLANT-DERIVED AND SYNTHETIC SUGAR MARKET, BY TYPE, 2021
FIGURE 17 MIDDLE EAST & AFRICA PLANT-DERIVED AND SYNTHETIC SUGAR MARKET, BY FORM, 2021
FIGURE 18 MIDDLE EAST & AFRICA PLANT-DERIVED AND SYNTHETIC SUGAR MARKET : BY APPLICATION, 2021
FIGURE 19 MIDDLE EAST AND AFRICA PLANT-DERIVED AND SYNTHETIC SUGAR MARKET: SNAPSHOT (2021)
FIGURE 20 MIDDLE EAST AND AFRICA PLANT-DERIVED AND SYNTHETIC SUGAR MARKET: BY COUNTRY (2021)
FIGURE 21 MIDDLE EAST AND AFRICA PLANT-DERIVED AND SYNTHETIC SUGAR MARKET: BY COUNTRY (2022 & 2029)
FIGURE 22 MIDDLE EAST AND AFRICA PLANT-DERIVED AND SYNTHETIC SUGAR MARKET: BY COUNTRY (2021 & 2029)
FIGURE 23 MIDDLE EAST AND AFRICA PLANT-DERIVED AND SYNTHETIC SUGAR MARKET: BY PRODUCT TYPE (2021 - 2029)
FIGURE 24 MIDDLE EAST & AFRICA PLANT-DERIVED AND SYNTHETIC SUGAR MARKET: COMPANY SHARE 2021 (%)
Middle East And Africa Plant Derived Sugar And Synthetic Sugar Market, Supply Chain Analysis and Ecosystem Framework
To support market growth and help clients navigate the impact of geopolitical shifts, DBMR has integrated in-depth supply chain analysis into its Middle East And Africa Plant Derived Sugar And Synthetic Sugar Market research reports. This addition empowers clients to respond effectively to global changes affecting their industries. The supply chain analysis section includes detailed insights such as Middle East And Africa Plant Derived Sugar And Synthetic Sugar Market consumption and production by country, price trend analysis, the impact of tariffs and geopolitical developments, and import and export trends by country and HSN code. It also highlights major suppliers with data on production capacity and company profiles, as well as key importers and exporters. In addition to research, DBMR offers specialized supply chain consulting services backed by over a decade of experience, providing solutions like supplier discovery, supplier risk assessment, price trend analysis, impact evaluation of inflation and trade route changes, and comprehensive market trend analysis.
Data collection and base year analysis are done using data collection modules with large sample sizes. The stage includes obtaining market information or related data through various sources and strategies. It includes examining and planning all the data acquired from the past in advance. It likewise envelops the examination of information inconsistencies seen across different information sources. The market data is analysed and estimated using market statistical and coherent models. Also, market share analysis and key trend analysis are the major success factors in the market report. To know more, please request an analyst call or drop down your inquiry.
The key research methodology used by DBMR research team is data triangulation which involves data mining, analysis of the impact of data variables on the market and primary (industry expert) validation. Data models include Vendor Positioning Grid, Market Time Line Analysis, Market Overview and Guide, Company Positioning Grid, Patent Analysis, Pricing Analysis, Company Market Share Analysis, Standards of Measurement, Global versus Regional and Vendor Share Analysis. To know more about the research methodology, drop in an inquiry to speak to our industry experts.
Data Bridge Market Research is a leader in advanced formative research. We take pride in servicing our existing and new customers with data and analysis that match and suits their goal. The report can be customized to include price trend analysis of target brands understanding the market for additional countries (ask for the list of countries), clinical trial results data, literature review, refurbished market and product base analysis. Market analysis of target competitors can be analyzed from technology-based analysis to market portfolio strategies. We can add as many competitors that you require data about in the format and data style you are looking for. Our team of analysts can also provide you data in crude raw excel files pivot tables (Fact book) or can assist you in creating presentations from the data sets available in the report.


