
Middle East and Africa Polylactic Acid (PLA Market Analysis and Insights
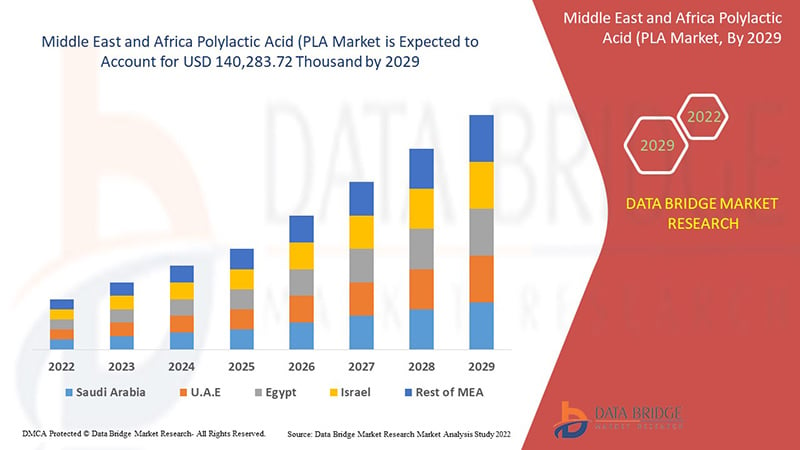
Middle East & Africa polylactic acid (PLA) market is expected to grow significantly in the forecast period of 2022 to 2029. Data Bridge Market Research analyses that the market is growing with a CAGR of 10.8% in the forecast period of 2022 to 2029 and is expected to reach USD 140,283.72 thousand by 2029. The major factor driving the growth of the polylactic acid (PLA) market is the increasing demand for a multi-layer packaging for preventing oxygen and water permeation, increasing demand for biodegradable packaging alternatives from the packaging industry, PLA can be an alternative to petroleum-based polymers, growing demand for bio-based plastics film in agriculture, imposition of strict regulations on environmental safety by various governments.
Polylactic acid (PLA) is a type of renewable plastic primarily derived from renewable materials like corn starch and sugarcane. Polylactic acid (PLA) possesses several beneficial mechanical properties over other biodegradable polymers. Polylactic acid (PLA) is a thermoplastic aliphatic polymer, and this bioplastic is produced from the crystallization of lactic acid. Having a chemical formula (C3H4O2) n, the polylactic acid (PLA) is a semi-crystalline and biodegradable hydrophobic polymer. Polylactic acid (PLA) can be broken down into a range of biodegradable components, which makes it ideal for application by a wide range of applications.
Middle East & Africa polylactic acid (PLA) market report provides details of market share, new developments, and the impact of domestic and localized market players, analyses opportunities in terms of emerging revenue pockets, changes in market regulations, products approvals, strategic decisions, product launches, geographic expansions, and technological innovations in the market. To understand the analysis and the market scenario, contact us for an Analyst Brief. Our team will help you create a revenue impact solution to achieve your desired goal.
|
Report Metric |
Details |
|
Forecast Period |
2022 to 2029 |
|
Base Year |
2021 |
|
Historic Years |
2020 (Customizable to 2019 - 2014) |
|
Quantitative Units |
Revenue in USD Thousand, Volume in Kilo Tons |
|
Segments Covered |
By Type (Racemic PLLA (Poly-L-Lactic Acid), Regular PLLA (Poly-L-Lactic Acid), PDLA (Poly-D-Lactic Acid), and PDLLA (Poly-Dl-Lactic Acid)), Raw Material (Corn, Cassava, Sugarcane, Sugar Beet, and Others), Form (Films And Sheets, Coatings, Fiber, Others), Application (Packaging, Transport, Agriculture, Medical, Electronics, Textile, Hygiene, Others), End User (Plastic Films, Bottles, Biodegradable Medical Devices) |
|
Countries Covered |
Egypt, Saudi Arabia, United Arab Emirates, South Africa, Israel and Rest of the Middle East and Africa |
|
Market Players Covered |
BASF SE, Futerro, NatureWorks LLC, TotalEnergies Corbion, Sulzer Ltd, Mitsubishi Chemical Corporation, TORAY INDUSTRIES, INC., Merck KGaA, Musashino Chemical Laboratory, Ltd., Evonik Industries AG, Polyvel Inc., UNITIKA LTD., Jiangxi Academy of Sciences Biological New Materials Co., Ltd., Shanghai Tong-jie-liang Biomaterials Co., Ltd., Zhejiang Hisun Biomaterials Co., Ltd., and Radici Partecipazioni SpA. |
Market Definition
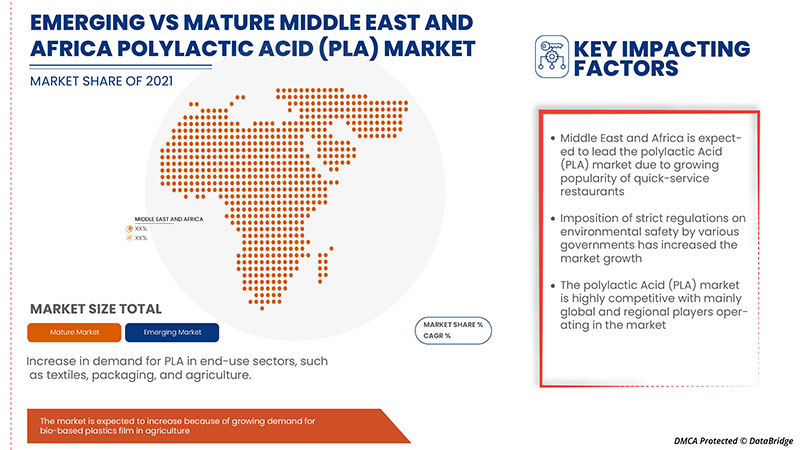
Increasing demand for biodegradable packaging alternatives from the packaging industry is an important driver for the Middle East & Africa polylactic acid (PLA) market. PLA can be an alternative to petroleum-based polymers. The growing demand for bio-based plastics film in agriculture is expected to boost the growth of the Middle East & Africa polylactic acid (PLA) market. The multi-functionalities of PLA and growing consumer inclination towards eco-friendly plastic products are accepted to bring opportunity to the Middle East & Africa polylactic acid (PLA) market. However, poor performance issues compared to conventional plastic challenge Middle East & Africa polylactic acid (PLA) market growth.
Middle East & Africa Polylactic Acid (PLA) Market Dynamics
Drivers
- Increasing demand for biodegradable packaging alternatives from the packaging industry
The pandemic has led to a positive impact on the growth of the packaging industry. It has resulted in high demand for plastic packaging, including eco-friendly substitutes of plastics such as packaging materials made from PLA. Food manufacturers, who initially opted for other types of packaging, had initiated using PLA-based packaging, as products are economical, safe, and enduring. Additionally, due to the increase in sustainability in the packaging industry for maintaining product quality, biopolymer packaging materials such as PLA-based materials are increasing as PLA decomposes into water and carbon dioxide in approximately 47 to 90 days. Four times faster than PET-based bags used in various packaging. Moreover, their low cost, renewable raw materials, and agro-industrial waste usage drive their demand, as polylactic acid is obtained from renewable sources.
- PLA can be an alternative to petroleum-based polymers
Apart from this, polylactic acid is used in manufacturing various components used in the automotive sector. Polylactic acids are used in applications such as the interior parts and hood under components. These products are known for reducing their carbon footprint owing to their high bio content. PLA offers numerous properties such as UV resistance, impact resistance, high gloss, dimensional stability, and coloring ability. These factors make it an alternative to most traditional plastics made up of petroleum products and raw materials such as polyethylene terephthalate, polycarbonate, polybutylene terephthalate, and acrylonitrile butadiene styrene, and polyamide, which are preferred for automotive engine compartments and interiors and other uses as well.
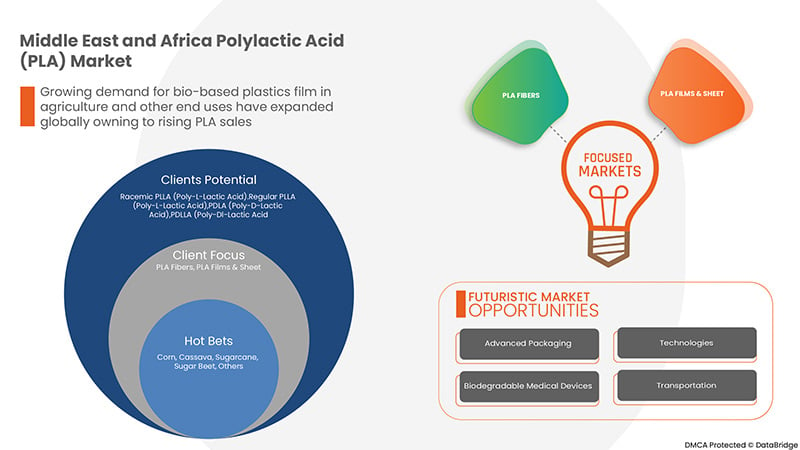
- Growing demand for bio-based plastics film in agriculture
With growing awareness regarding disposal problems of non-degradable films, applications of polylactic acid-based mulch films are expected to increase in agriculture. Mulch films are extensively used in the cultivation of fruits & vegetables. The mechanical properties of PLA are comparable to the existing mulch film products and have the advantage of being completely biodegradable through a single growing season. This will positively impact the market growth and act as a driver for the Middle East & Africa polylactic acid (PLA) market.
- Imposition of strict regulations on environmental safety by various governments
Due to environmental concerns and fast climate-changing factors, regulatory authorities, such as EPA, FDA, and many others, are increasingly opting for biodegradable plastics such as polylactic acid (PLA) and focusing on increasing consumer awareness regarding the need for the use of biodegradable products.
Opportunities
- Multi-functionalities of PLA
Multi-functionalities and extensive use of PLA in different industries and applications will provide lucrative opportunities for growth in the Middle East & Africa polylactic acid (PLA) market. Bas Polylactic acid is biodegradable and industrially compostable. Among the first renewable polymers, we can compete with the existing polymers, combining their functional characteristics, such as transparency, gloss, and stiffness. Polylactic acid is currently used in many industries and applications, including packaging, single-use tableware, textiles, oil & gas, electronics, automotive, and 3D printing. Due to the various and versatile uses of polylactic acid across multiple industries and the multi-functionalities of polylactic acids, the market is projected to witness significant growth opportunities in the near future.
- Growing consumer inclination towards eco-friendly plastic product
Furthermore, the richness of biomass, research-driven resources, strong downstream industry demand, material supply, and supporting government policy has created significant bioplastic business opportunities in these regions. The growth has also been supported by improving consumer awareness regarding sustainable plastic solutions and increasing efforts to eliminate the use of non-biodegradable conventional plastics PLA. Traditionally used petroleum-based plastics take decades to break down or degrade and lay in landfills for a long period. PLA breaks down faster when they are discarded and absorbed back into the natural system. In addition, the decomposition rate of biodegradable plastics such as PLA by the activities of microorganisms is much faster than that of traditional plastics.
Restraints/Challenges
- Concerns over cost and specific industrial composting system
The usage of polylactic acids in small and medium enterprises has been challenging due to the lack of resources or the technology and facilities required for extracting and fermentation high-quality lactic acid and polylactic acid. Moreover, the selection of the right composition of polylactic acid is a key aspect that many companies have not figured out accurately. This increases the production cost of polylactic acid due to a lack of appropriate technology and techniques. The selection of the right composition of lactic acid for the production of polylactic acid is a complex method that requires validation at a laboratory and factory-scale level.
- Unpredictable raw material prices
The production costs of polylactic acid and related products are witnessing a significant increase due to the higher costs of raw materials along with transportation, energy consumed, and chemicals, which reduces margins for manufacturers, distributors, and suppliers. Thus, resulting in high end-user application prices.
- Poor performance issues as compared to conventional plastic
Low barrier properties to air, water, and oxygen and low resistance to heat are some of the major performance issues related to PLA compared to conventional plastics. This restricts its penetration in various industries, including electronics and automotive. In addition, poor mechanical properties such as low impact & tensile strength and process capabilities restrict the penetration of PLA in various applications. These performance limitations of PLA are a major challenge for the market's growth. In addition, PLA is a bio-based and biodegradable polymer built from lactic acid molecules. Being a thermoplastic polyester, it softens when heated and hardens when cooled.
Recent Development
In June 2022, The Australian food packaging manufacturer Confoil and BASF partnered to develop a certified compostable and dual ovenable food tray based on paper. The paper tray is coated inside with BASF's ecovio PS 1606, a partly bio-based and certified compostable biopolymer especially developed for coating food packaging made of paper or board. This partnership will intensify the company's operations in the Middle East & Africa markets.
Middle East & Africa Polylactic acid (PLA) Market Scope
Middle East & Africa polylactic acid (PLA) market is categorized based on type, raw material, form, application, and end user. The growth amongst these segments will help you analyze major growth segments in the industries and provide the users with a valuable market overview and market insights to make strategic decisions to identify core market applications.
Type
- Racemic PLLA (Poly-l-lactic acid)
- PDLA (Poly-d-lactic acid)
- Regular PLLA (Poly-l-lactic acid)
- PDLLA (Poly-dl-lactic acid)
- PLA Blends
Based on type, the Middle East & Africa polylactic acid (PLA) market is classified into five segments, namely Racemic PLLA (Poly-l-lactic acid), PDLA (Poly-d-lactic acid), Regular PLLA (Poly-l-lactic acid), PDLLA (Poly-dl-lactic acid), and PLA Blends.
Raw Material
- Sugarcane
- Corn
- Cassava
- Sugar Beet
- Others
Based on raw material, the Middle East & Africa polylactic acid (PLA) market is classified into sugarcane, corn, cassava, sugar beet, and others.
Form
- Films and Sheets
- Coatings
- Fibre
- Others
Based on the form, the Middle East & Africa polylactic acid (PLA) market is classified into films and sheets, coatings, fibre, and others.
Application
- Packaging
- Transport
- Agriculture
- Medical
- Electronics
- Textile
- Hygiene
- Others
Based on application, the Middle East & Africa polylactic acid (PLA) market is segmented into packaging, transport, agriculture, medical, electronics, textile, and hygiene.
End User
- Plastic Films
- Bottles
- Biodegradable Medical Devices
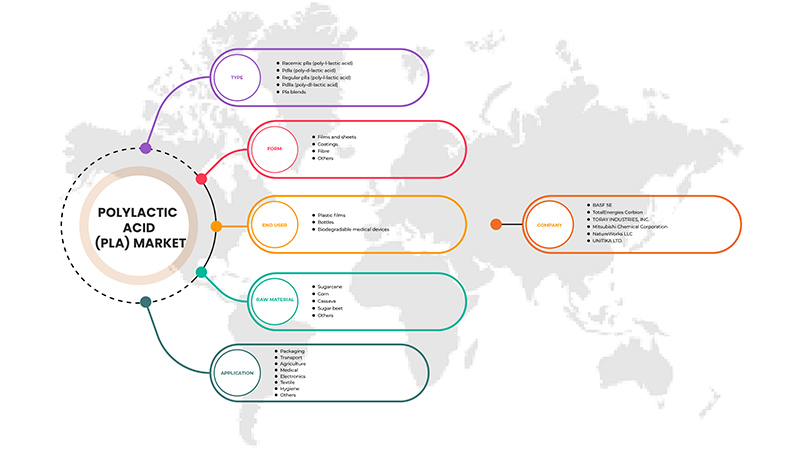
Based on the end user, the Middle East & Africa polylactic acid (PLA) market is classified into plastic films, bottles, and biodegradable medical devices.
Middle East & Africa Polylactic Acid (PLA) Market Regional Analysis/Insights
Middle East & Africa polylactic acid (PLA) market is segmented on the basis of type, raw material, form, application, and end user.
The countries in the Middle East & Africa polylactic acid (PLA) market are Egypt, Saudi Arabia, United Arab Emirates, South Africa, Israel and Rest of the Middle East and Africa. Saudi Arabia is dominating the Middle East & Africa polylactic acid (PLA) market in terms of market share and revenue because PLA can be an alternative to petroleum-based polymers.
The country section of the report also provides individual market impacting factors and changes in market regulation that impact the current and future trends of the market. Data points downstream and upstream value chain analysis, technical trends, porter's five forces analysis, and case studies are some of the pointers used to forecast the market scenario for individual countries. Also, the presence and availability of the Middle East & Africa brands and their challenges faced due to large or scarce competition from local and domestic brands, the impact of domestic tariffs, and trade routes are considered while providing forecast analysis of the country data.
Competitive Landscape and the Middle East & Africa Polylactic Acid (PLA) Market Share Analysis
Middle East & Africa polylactic acid (PLA) market competitive landscape provides details of competitors. Details included are company overview, company financials, revenue generated, market potential, investment in research and development, new market initiatives, production sites and facilities, company strengths and weaknesses, product launch, product trials pipelines, product approvals, patents, product width and breadth, application dominance, technology lifeline curve. The above data points provided are only related to the companies' focus related to the Middle East & Africa Polylactic acid (PLA) market.
Some of the prominent participants operating in the Middle East & Africa Polylactic acid (PLA) market are BASF SE, Futerro, NatureWorks LLC, TotalEnergies Corbion, Sulzer Ltd, Mitsubishi Chemical Corporation, TORAY INDUSTRIES, INC., Merck KGaA, Musashino Chemical Laboratory, Ltd., Evonik Industries AG, Polyvel Inc., UNITIKA LTD., Jiangxi Academy of Sciences Biological New Materials Co., Ltd., Shanghai Tong-jie-liang Biomaterials Co., Ltd., Zhejiang Hisun Biomaterials Co., Ltd., and Radici Partecipazioni SpA.
Research Methodology
Data collection and base year analysis are done using data collection modules with large sample sizes. The market data is analyzed and estimated using market statistical and coherent models. In addition, market share analysis and key trend analysis are the major success factors in the market report. The key research methodology used by the DBMR research team is data triangulation which involves data mining, analysis of the impact of data variables on the market, and primary (industry expert) validation. Data models include Vendor Positioning grids, Market Time Line Analysis, Market Overview and Guide, Company Positioning grids, Company Market Share Analysis, Standards of Measurement, Middle East & Africa vs. Regional and Vendor Share Analysis. Please request an analyst call in case of further inquiry.
SKU-

- Interactive Data Analysis Dashboard
- Company Analysis Dashboard for high growth potential opportunities
- Research Analyst Access for customization & queries
- Competitor Analysis with Interactive dashboard
- Latest News, Updates & Trend analysis
- Harness the Power of Benchmark Analysis for Comprehensive Competitor Tracking
Table of Content
1 INTRODUCTION
1.1 OBJECTIVES OF THE STUDY
1.2 MARKET DEFINITION
1.3 OVERVIEW OF MIDDLE EAST & AFRICA POLYLACTIC ACID (PLA) MARKET
1.4 LIMITATION
1.5 MARKETS COVERED
2 MARKET SEGMENTATION
2.1 MARKETS COVERED
2.2 GEOGRAPHICAL SCOPE
2.3 YEARS CONSIDERED FOR THE STUDY
2.4 CURRENCY AND PRICING
2.5 DBMR TRIPOD DATA VALIDATION MODEL
2.6 TYPE LIFE LINE CURVE
2.7 MULTIVARIATE MODELING
2.8 PRIMARY INTERVIEWS WITH KEY OPINION LEADERS
2.9 DBMR MARKET POSITION GRID
2.1 MARKET END-USER COVERAGE GRID
2.11 DBMR MARKET CHALLENGE MATRIX
2.12 DBMR VENDOR SHARE ANALYSIS
2.13 IMPORT-EXPORT DATA
2.14 SECONDARY SOURCES
2.15 ASSUMPTIONS
3 EXECUTIVE SUMMARY
4 PREMIUM INSIGHTS
4.1 CLIMATE CHANGE SCENARIO
4.1.1 ENVIRONMENTAL CONCERNS
4.1.2 INDUSTRY RESPONSE
4.1.3 GOVERNMENT'S ROLE
4.1.4 ANALYST RECOMMENDATION
4.2 LEGAL FRAMEWORK
4.3 PESTLE ANALYSIS
4.3.1 POLITICAL FACTORS
4.3.2 ECONOMIC FACTORS
4.3.3 SOCIAL FACTORS
4.3.4 TECHNOLOGICAL FACTORS
4.3.5 LEGAL FACTORS
4.3.6 ENVIRONMENTAL FACTORS
4.4 PORTER’S FIVE FORCES
4.4.1 THREAT OF NEW ENTRANTS
4.4.2 THREAT OF SUBSTITUTES
4.4.3 CUSTOMER BARGAINING POWER
4.4.4 SUPPLIER BARGAINING POWER
4.4.5 INTERNAL COMPETITION (RIVALRY)
4.5 RAW MATERIAL PRODUCTION COVERAGE
4.6 REGULATORY COVERAGE
4.7 RUSSIA AND UKRAINE CONFLICT ANALYSIS – MIDDLE EAST & AFRICA POLYLACTIC ACID (PLA) MARKET
4.8 TECHNOLOGY ADVANCEMENT
4.8.1 SORONA FIBERS FROM DUPONT:
4.8.2 DEVELOPMENT AND DEPLOYMENT OF NOVEL SEPARATIONS TECHNOLOGIES
4.8.3 SULZER TECHNOLOGY TURNKEY PROJECTS WITH SUGAR:
4.9 VENDOR SELECTION CRITERIA
4.1 SUPPLY CHAIN ANALYSIS
4.10.1 RAW MATERIAL PROCUREMENT
4.10.2 MANUFACTURING AND PACKING
4.10.3 MARKETING AND DISTRIBUTION
4.10.4 END USERS
5 MARKET OVERVIEW
5.1 DRIVERS
5.1.1 INCREASING DEMAND FOR BIODEGRADABLE PACKAGING ALTERNATIVES FROM THE PACKAGING INDUSTRY
5.1.2 PLA CAN BE AN ALTERNATIVE TO PETROLEUM-BASED POLYMERS
5.1.3 GROWING DEMAND FOR BIO-BASED PLASTICS FILM IN AGRICULTURE
5.1.4 IMPOSITION OF STRICT REGULATIONS ON ENVIRONMENTAL SAFETY BY VARIOUS GOVERNMENTS
5.2 RESTRAINTS
5.2.1 CONCERNS OVER COST AND SPECIFIC INDUSTRIAL COMPOSTING SYSTEM
5.2.2 UNPREDICTABLE RAW MATERIAL PRICES
5.3 OPPORTUNITIES
5.3.1 MULTI-FUNCTIONALITIES OF PLA
5.3.2 GROWING CONSUMER INCLINATION TOWARDS ECO-FRIENDLY PLASTIC PRODUCT
5.4 CHALLENGES
5.4.1 POOR PERFORMANCE ISSUES AS COMPARED TO CONVENTIONAL PLASTIC
6 MIDDLE EAST & AFRICA POLYLACTIC ACID (PLA) MARKET, TYPE
6.1 OVERVIEW
6.2 RACEMIC PLLA (POLY-L-LACTIC ACID)
6.3 PDLA (POLY-D-LACTIC ACID)
6.4 REGULAR PLLA (POLY-L-LACTIC ACID)
6.5 PDLLA (POLY-DL-LACTIC ACID)
6.6 PLA BLENDS
7 MIDDLE EAST & AFRICA POLYLACTIC ACID (PLA) MARKET, BY RAW MATERIAL
7.1 OVERVIEW
7.2 SUGARCANE
7.3 CORN
7.4 CASSAVA
7.5 SUGAR BEET
7.6 OTHERS
8 MIDDLE EAST & AFRICA POLYLACTIC ACID (PLA) MARKET, BY FORM
8.1 OVERVIEW
8.2 FILMS AND SHEETS
8.3 COATINGS
8.4 FIBER
8.5 OTHERS
9 MIDDLE EAST & AFRICA POLYLACTIC ACID (PLA) MARKET, APPLICATION
9.1 OVERVIEW
9.2 PACKAGING
9.2.1 FLEXIBLE FILMS FOR FOOD APPLICATIONS
9.2.2 LIGHT CARRIER BAGS/FRUITS & VEGETABLE BAGS/TRASH LINERS
9.2.3 CLING FILMS
9.2.4 INDUSTRIAL FILMS: STRETCH FILMS
9.2.5 RIGID APPLICATIONS
9.2.5.1 CUTLERY
9.2.5.2 TRAY
9.2.5.3 POTS
9.2.5.4 PODS
9.3 TRANSPORT
9.4 AGRICULTURE
9.4.1 MULCHING FILM
9.4.2 HORTICULTURAL POTS
9.4.3 CLIPS
9.5 MEDICAL
9.6 ELECTRONICS
9.7 TEXTILE
9.8 HYGIENE
9.8.1 NON-WOVEN FIBERS
9.8.2 DIAPERS
9.8.3 FILTERS
9.9 OTHERS
10 MIDDLE EAST & AFRICA POLYLACTIC ACID (PLA) MARKET, END USER
10.1 OVERVIEW
10.2 PLASTIC FILMS
10.3 BOTTLES
10.4 BIODEGRADABLE MEDICAL DEVICES
10.4.1 SCREWS
10.4.2 PINS
10.4.3 PLATES
10.4.4 RODS
11 MIDDLE EAST & AFRICA POLYLACTIC ACID (PLA) MARKET, BY GEOGRAPHY
11.1 MIDDLE EAST AND AFRICA
11.1.1 SAUDI ARABIA
11.1.2 UNITED ARAB EMIRATES
11.1.3 SOUTH AFRICA
11.1.4 EGYPT
11.1.5 ISRAEL
11.1.6 REST OF MIDDLE EAST AND AFRICA
12 MIDDLE EAST & AFRICA POLYLACTIC ACID (PLA) MARKET: COMPANY LANDSCAPE
12.1 COMPANY SHARE ANALYSIS: MIDDLE EAST & AFRICA
12.1.1 PARTNERSHIP
12.1.2 PRODUCT LAUNCHES
12.1.3 AWARD
12.1.4 FACILITY EXPANSION
13 SWOT ANALYSIS
14 COMPANY PROFILES
14.1 BASF SE
14.1.1 COMPANY SNAPSHOT
14.1.2 REVENUE ANALYSIS
14.1.3 COMPANY SHARE ANALYSIS
14.1.4 PRODUCT PORTFOLIO
14.1.5 RECENT UPDATES
14.2 TOTALENERGIES CORBION
14.2.1 COMPANY SNAPSHOT
14.2.2 COMPANY SHARE ANALYSIS
14.2.3 PRODUCT PORTFOLIO
14.2.4 RECENT UPDATES
14.3 TORAY INDUSTRIES, INC
14.3.1 COMPANY SNAPSHOT
14.3.2 REVENUE ANALYSIS
14.3.3 COMPANY SHARE ANALYSIS
14.3.4 PRODUCT PORTFOLIO
14.3.5 RECENT UPDATES
14.4 MITSUBISHI CHEMICAL CORPORATION
14.4.1 COMPANY SNAPSHOT
14.4.2 REVENUE ANALYSIS
14.4.3 COMPANY SHARE ANALYSIS
14.4.4 PRODUCT PORTFOLIO
14.4.5 RECENT UPDATES
14.5 NATUREWORKS LLC.
14.5.1 COMPANY SNAPSHOT
14.5.2 COMPANY SHARE ANALYSIS
14.5.3 PRODUCT PORTFOLIO
14.5.4 RECENT UPDATES
14.6 UNITIKA LTD
14.6.1 COMPANY SNAPSHOT
14.6.2 REVENUE ANALYSIS
14.6.3 PRODUCT PORTFOLIO
14.6.4 RECENT UPDATES
14.7 EVONIK INDUSTRIES AG
14.7.1 COMPANY SNAPSHOT
14.7.2 PRODUCT PORTFOLIO
14.7.3 RECENT UPDATES
14.8 ZHEJIANG HISUN BIOMATERIALS CO., LTD
14.8.1 COMPANY SNAPSHOT
14.8.2 PRODUCT PORTFOLIO
14.8.3 RECENT UPDATES
14.9 MERCK KGAA
14.9.1 COMPANY SNAPSHOT
14.9.2 REVENUE ANALYSIS
14.9.3 PRODUCT PORTFOLIO
14.9.4 RECENT UPDATES
14.1 SULZER LTD
14.10.1 COMPANY SNAPSHOT
14.10.2 REVENUE ANALYSIS
14.10.3 PRODUCT PORTFOLIO
14.10.4 RECENT UPDATES
14.11 MUSASHINO CHEMICAL LABORATORY, LTD.
14.11.1 COMPANY SNAPSHOT
14.11.2 PRODUCT PORTFOLIO
14.11.3 RECENT UPDATES
14.12 FUTERRO
14.12.1 COMPANY SNAPSHOT
14.12.2 PRODUCT PORTFOLIO
14.12.3 RECENT UPDATES
14.13 SHANGHAI TONG-JIE-LIANG BIOMATERIALS CO., LTD.
14.13.1 COMPANY SNAPSHOT
14.13.2 PRODUCT PORTFOLIO
14.13.3 RECENT UPDATES
14.14 POLYVEL INC.
14.14.1 COMPANY SNAPSHOT
14.14.2 PRODUCT PORTFOLIO
14.14.3 RECENT UPDATES
14.15 JIANGXI ACADEMY OF SCIENCES BIOLOGICAL NEW MATERIALS CO., LTD.
14.15.1 COMPANY SNAPSHOT
14.15.2 PRODUCT PORTFOLIO
14.15.3 RECENT UPDATES
14.16 RADICI PARTECIPAZIONI SPA
14.16.1 COMPANY SNAPSHOT
14.16.2 PRODUCT PORTFOLIO
14.16.3 RECENT UPDATES
15 QUESTIONNAIRE
16 RELATED REPORTS
List of Table
TABLE 1 IMPORT DATA OF POLYLACTIC ACID, IN PRIMARY FORMS; HS CODE - PRODUCT: 390770 (USD THOUSAND)
TABLE 2 EXPORT DATA OF POLYLACTIC ACID, IN PRIMARY FORMS; HS CODE - PRODUCT: 390770 (USD THOUSAND)
TABLE 3 REGULATORY FRAMEWORK
TABLE 4 TIME TAKEN FOR GARBAGE TO DECOMPOSE IN THE ENVIRONMENT (2015)
TABLE 5 MIDDLE EAST & AFRICA POLYLACTIC ACID (PLA) MARKET, BY TYPE, 2020-2029 (USD THOUSAND)
TABLE 6 MIDDLE EAST & AFRICA POLYLACTIC ACID (PLA) MARKET, BY TYPE, 2020-2029 (KILO TONS)
TABLE 7 MIDDLE EAST & AFRICA RACEMIC PLLA (POLY-L-LACTIC ACID) IN POLYLACTIC ACID (PLA) MARKET, BY REGION, 2020-2029 (USD THOUSAND)
TABLE 8 MIDDLE EAST & AFRICA RACEMIC PLLA (POLY-L-LACTIC ACID) IN POLYLACTIC ACID (PLA) MARKET, BY REGION, 2020-2029 (KILO TONS)
TABLE 9 MIDDLE EAST & AFRICA PDLA (POLY-D-LACTIC ACID) IN POLYLACTIC ACID (PLA) MARKET, BY REGION, 2020-2029 (USD THOUSAND)
TABLE 10 MIDDLE EAST & AFRICA PDLA (POLY-D-LACTIC ACID) IN POLYLACTIC ACID (PLA) MARKET, BY REGION, 2020-2029 (KILO TONS)
TABLE 11 MIDDLE EAST & AFRICA REGULAR PLLA (POLY-L-LACTIC ACID) IN POLYLACTIC ACID (PLA) MARKET, BY REGION, 2020-2029 (USD THOUSAND)
TABLE 12 MIDDLE EAST & AFRICA REGULAR PLLA (POLY-L-LACTIC ACID) IN POLYLACTIC ACID (PLA) MARKET, BY REGION, 2020-2029 (KILO TONS)
TABLE 13 MIDDLE EAST & AFRICA PDLLA (POLY-DL-LACTIC ACID) IN POLYLACTIC ACID (PLA) MARKET, BY REGION, 2020-2029 (USD THOUSAND)
TABLE 14 MIDDLE EAST & AFRICA PDLLA (POLY-DL-LACTIC ACID) IN POLYLACTIC ACID (PLA) MARKET, BY REGION, 2020-2029 (KILO TONS)
TABLE 15 MIDDLE EAST & AFRICA PLA BLENDS IN POLYLACTIC ACID (PLA) MARKET, BY REGION, 2020-2029 (USD THOUSAND)
TABLE 16 MIDDLE EAST & AFRICA PLA BLENDS IN POLYLACTIC ACID (PLA) MARKET, BY REGION, 2020-2029 (KILO TONS)
TABLE 17 MIDDLE EAST & AFRICA POLYLACTIC ACID (PLA) MARKET, BY RAW MATERIAL, 2020-2029 (USD THOUSAND)
TABLE 18 MIDDLE EAST & AFRICA SUGARCANE IN POLYLACTIC ACID (PLA) MARKET, BY REGION, 2020-2029 (USD THOUSAND)
TABLE 19 MIDDLE EAST & AFRICA CORN IN POLYLACTIC ACID (PLA) MARKET, BY REGION, 2020-2029 (USD THOUSAND)
TABLE 20 MIDDLE EAST & AFRICA CASSAVA IN POLYLACTIC ACID (PLA) MARKET, BY REGION, 2020-2029 (USD THOUSAND)
TABLE 21 MIDDLE EAST & AFRICA SUGAR BEET IN POLYLACTIC ACID (PLA) MARKET, BY REGION, 2020-2029 (USD THOUSAND)
TABLE 22 MIDDLE EAST & AFRICA OTHERS IN POLYLACTIC ACID (PLA) MARKET, BY REGION, 2020-2029 (USD THOUSAND)
TABLE 23 MIDDLE EAST & AFRICA POLYLACTIC ACID (PLA) MARKET, FORM, 2020-2029 (USD THOUSAND)
TABLE 24 MIDDLE EAST & AFRICA FILMS AND SHEETS IN POLYLACTIC ACID (PLA) MARKET, BY REGION, 2020-2029 (USD THOUSAND)
TABLE 25 MIDDLE EAST & AFRICA COATINGS IN POLYLACTIC ACID (PLA) MARKET, BY REGION, 2020-2029 (USD THOUSAND)
TABLE 26 MIDDLE EAST & AFRICA FIBER IN POLYLACTIC ACID (PLA) MARKET, BY REGION, 2020-2029 (USD THOUSAND)
TABLE 27 MIDDLE EAST & AFRICA OTHERS IN POLYLACTIC ACID (PLA) MARKET, BY REGION, 2020-2029 (USD THOUSAND)
TABLE 28 MIDDLE EAST & AFRICA POLYLACTIC ACID (PLA) MARKET, BY APPLICATION, 2020-2029 (USD THOUSAND)
TABLE 29 MIDDLE EAST & AFRICA PACKAGING IN POLYLACTIC ACID (PLA) MARKET, BY REGION, 2020-2029 (USD THOUSAND)
TABLE 30 MIDDLE EAST & AFRICA PACKAGING IN POLYLACTIC ACID (PLA) MARKET, BY APPLICATION, 2020-2029 (USD THOUSAND)
TABLE 31 MIDDLE EAST & AFRICA RIGID APPLICATION IN POLYLACTIC ACID (PLA) MARKET, BY APPLICATION, 2020-2029 (USD THOUSAND)
TABLE 32 MIDDLE EAST & AFRICA TRANSPORT IN POLYLACTIC ACID (PLA) MARKET, BY REGION, 2020-2029 (USD THOUSAND)
TABLE 33 MIDDLE EAST & AFRICA AGRICULTURE IN POLYLACTIC ACID (PLA) MARKET, BY REGION, 2020-2029 (USD THOUSAND)
TABLE 34 MIDDLE EAST & AFRICA AGRICULTURE IN POLYLACTIC ACID (PLA) MARKET, BY APPLICATION, 2020-2029 (USD THOUSAND)
TABLE 35 MIDDLE EAST & AFRICA MEDICAL IN POLYLACTIC ACID (PLA) MARKET, BY REGION, 2020-2029 (USD THOUSAND)
TABLE 36 MIDDLE EAST & AFRICA ELECTRONICS IN POLYLACTIC ACID (PLA) MARKET, BY REGION, 2020-2029 (USD THOUSAND)
TABLE 37 MIDDLE EAST & AFRICA TEXTILE IN POLYLACTIC ACID (PLA) MARKET, BY REGION, 2020-2029 (USD THOUSAND)
TABLE 38 MIDDLE EAST & AFRICA HYGIENE IN POLYLACTIC ACID (PLA) MARKET, BY REGION, 2020-2029 (USD THOUSAND)
TABLE 39 MIDDLE EAST & AFRICA HYGIENE IN POLYLACTIC ACID (PLA) MARKET, BY APPLICATION, 2020-2029 (USD THOUSAND)
TABLE 40 MIDDLE EAST & AFRICA OTHERS IN POLYLACTIC ACID (PLA) MARKET, BY REGION, 2020-2029 (USD THOUSAND)
TABLE 41 MIDDLE EAST & AFRICA POLYLACTIC ACID (PLA) MARKET, BY END USER, 2020-2029 (USD THOUSAND)
TABLE 42 MIDDLE EAST & AFRICA PLASTIC FILMS IN POLYLACTIC ACID (PLA) MARKET, BY REGION, 2020-2029 (USD THOUSAND)
TABLE 43 MIDDLE EAST & AFRICA BOTTLES IN POLYLACTIC ACID (PLA) MARKET, BY REGION, 2020-2029 (USD THOUSAND)
TABLE 44 MIDDLE EAST & AFRICA BIODEGRADABLE MEDICAL DEVICES IN POLYLACTIC ACID (PLA) MARKET, BY REGION, 2020-2029 (USD THOUSAND)
TABLE 45 MIDDLE EAST & AFRICA BIODEGRADABLE MEDICAL DEVICES IN POLYLACTIC ACID (PLA) MARKET, BY END USER, 2020-2029 (USD THOUSAND)
TABLE 46 MIDDLE EAST AND AFRICA POLYLACTIC ACID (PLA) MARKET, BY COUNTRY, 2020-2029 (USD THOUSAND)
TABLE 47 MIDDLE EAST AND AFRICA POLYLACTIC ACID (PLA) MARKET, BY COUNTRY, 2020-2029 (KILO TONS)
TABLE 48 MIDDLE EAST AND AFRICA POLYLACTIC ACID (PLA) MARKET, BY TYPE, 2020-2029 (USD THOUSAND)
TABLE 49 MIDDLE EAST AND AFRICA POLYLACTIC ACID (PLA) MARKET, BY TYPE, 2020-2029 (KILO TONS)
TABLE 50 MIDDLE EAST AND AFRICA POLYLACTIC ACID (PLA) MARKET, BY RAW MATERIAL, 2020-2029 (USD THOUSAND)
TABLE 51 MIDDLE EAST AND AFRICA POLYLACTIC ACID (PLA) MARKET, BY FORM, 2020-2029 (USD THOUSAND)
TABLE 52 MIDDLE EAST AND AFRICA POLYLACTIC ACID (PLA) MARKET, BY APPLICATION, 2020-2029 (USD THOUSAND)
TABLE 53 MIDDLE EAST AND AFRICA PACKAGING IN POLYLACTIC ACID (PLA) MARKET, BY APPLICATION, 2020-2029 (USD THOUSAND)
TABLE 54 MIDDLE EAST AND AFRICA RIGID APPLICATION IN POLYLACTIC ACID (PLA) MARKET, BY APPLICATION, 2020-2029 (USD THOUSAND)
TABLE 55 MIDDLE EAST AND AFRICA AGRICULTURE IN POLYLACTIC ACID (PLA) MARKET, BY APPLICATION, 2020-2029 (USD THOUSAND)
TABLE 56 MIDDLE EAST AND AFRICA HYGIENE IN POLYLACTIC ACID (PLA) MARKET, BY APPLICATION, 2020-2029 (USD THOUSAND)
TABLE 57 MIDDLE EAST AND AFRICA POLYLACTIC ACID (PLA) MARKET, BY END USER, 2020-2029 (USD THOUSAND)
TABLE 58 MIDDLE EAST AND AFRICA BIODEGRADABLE MEDICAL DEVICES IN POLYLACTIC ACID (PLA) MARKET, BY END USER, 2020-2029 (USD THOUSAND)
TABLE 59 SAUDI ARABIA POLYLACTIC ACID (PLA) MARKET, BY TYPE, 2020-2029 (USD THOUSAND)
TABLE 60 SAUDI ARABIA POLYLACTIC ACID (PLA) MARKET, BY TYPE, 2020-2029 (KILO TONS)
TABLE 61 SAUDI ARABIA POLYLACTIC ACID (PLA) MARKET, BY RAW MATERIAL, 2020-2029 (USD THOUSAND)
TABLE 62 SAUDI ARABIA POLYLACTIC ACID (PLA) MARKET, BY FORM, 2020-2029 (USD THOUSAND)
TABLE 63 SAUDI ARABIA POLYLACTIC ACID (PLA) MARKET, BY APPLICATION, 2020-2029 (USD THOUSAND)
TABLE 64 SAUDI ARABIA PACKAGING IN POLYLACTIC ACID (PLA) MARKET, BY APPLICATION, 2020-2029 (USD THOUSAND)
TABLE 65 SAUDI ARABIA RIGID APPLICATION IN POLYLACTIC ACID (PLA) MARKET, BY APPLICATION, 2020-2029 (USD THOUSAND)
TABLE 66 SAUDI ARABIA AGRICULTURE IN POLYLACTIC ACID (PLA) MARKET, BY APPLICATION, 2020-2029 (USD THOUSAND)
TABLE 67 SAUDI ARABIA HYGIENE IN POLYLACTIC ACID (PLA) MARKET, BY APPLICATION, 2020-2029 (USD THOUSAND)
TABLE 68 SAUDI ARABIA POLYLACTIC ACID (PLA) MARKET, BY END USER, 2020-2029 (USD THOUSAND)
TABLE 69 SAUDI ARABIA BIODEGRADABLE MEDICAL DEVICES IN POLYLACTIC ACID (PLA) MARKET, BY END USER, 2020-2029 (USD THOUSAND)
TABLE 70 UNITED ARAB EMIRATES POLYLACTIC ACID (PLA) MARKET, BY TYPE, 2020-2029 (USD THOUSAND)
TABLE 71 UNITED ARAB EMIRATES POLYLACTIC ACID (PLA) MARKET, BY TYPE, 2020-2029 (KILO TONS)
TABLE 72 UNITED ARAB EMIRATES POLYLACTIC ACID (PLA) MARKET, BY RAW MATERIAL, 2020-2029 (USD THOUSAND)
TABLE 73 UNITED ARAB EMIRATES POLYLACTIC ACID (PLA) MARKET, BY FORM, 2020-2029 (USD THOUSAND)
TABLE 74 UNITED ARAB EMIRATES POLYLACTIC ACID (PLA) MARKET, BY APPLICATION, 2020-2029 (USD THOUSAND)
TABLE 75 UNITED ARAB EMIRATES PACKAGING IN POLYLACTIC ACID (PLA) MARKET, BY APPLICATION, 2020-2029 (USD THOUSAND)
TABLE 76 UNITED ARAB EMIRATES RIGID APPLICATION IN POLYLACTIC ACID (PLA) MARKET, BY APPLICATION, 2020-2029 (USD THOUSAND)
TABLE 77 UNITED ARAB EMIRATES AGRICULTURE IN POLYLACTIC ACID (PLA) MARKET, BY APPLICATION, 2020-2029 (USD THOUSAND)
TABLE 78 UNITED ARAB EMIRATES HYGIENE IN POLYLACTIC ACID (PLA) MARKET, BY APPLICATION, 2020-2029 (USD THOUSAND)
TABLE 79 UNITED ARAB EMIRATES POLYLACTIC ACID (PLA) MARKET, BY END USER, 2020-2029 (USD THOUSAND)
TABLE 80 UNITED ARAB EMIRATES BIODEGRADABLE MEDICAL DEVICES IN POLYLACTIC ACID (PLA) MARKET, BY END USER, 2020-2029 (USD THOUSAND)
TABLE 81 SOUTH AFRICA POLYLACTIC ACID (PLA) MARKET, BY TYPE, 2020-2029 (USD THOUSAND)
TABLE 82 SOUTH AFRICA POLYLACTIC ACID (PLA) MARKET, BY TYPE, 2020-2029 (KILO TONS)
TABLE 83 SOUTH AFRICA POLYLACTIC ACID (PLA) MARKET, BY RAW MATERIAL, 2020-2029 (USD THOUSAND)
TABLE 84 SOUTH AFRICA POLYLACTIC ACID (PLA) MARKET, BY FORM, 2020-2029 (USD THOUSAND)
TABLE 85 SOUTH AFRICA POLYLACTIC ACID (PLA) MARKET, BY APPLICATION, 2020-2029 (USD THOUSAND)
TABLE 86 SOUTH AFRICA PACKAGING IN POLYLACTIC ACID (PLA) MARKET, BY APPLICATION, 2020-2029 (USD THOUSAND)
TABLE 87 SOUTH AFRICA RIGID APPLICATION IN POLYLACTIC ACID (PLA) MARKET, BY APPLICATION, 2020-2029 (USD THOUSAND)
TABLE 88 SOUTH AFRICA AGRICULTURE IN POLYLACTIC ACID (PLA) MARKET, BY APPLICATION, 2020-2029 (USD THOUSAND)
TABLE 89 SOUTH AFRICA HYGIENE IN POLYLACTIC ACID (PLA) MARKET, BY APPLICATION, 2020-2029 (USD THOUSAND)
TABLE 90 SOUTH AFRICA POLYLACTIC ACID (PLA) MARKET, BY END USER, 2020-2029 (USD THOUSAND)
TABLE 91 SOUTH AFRICA BIODEGRADABLE MEDICAL DEVICES IN POLYLACTIC ACID (PLA) MARKET, BY END USER, 2020-2029 (USD THOUSAND)
TABLE 92 EGYPT POLYLACTIC ACID (PLA) MARKET, BY TYPE, 2020-2029 (USD THOUSAND)
TABLE 93 EGYPT POLYLACTIC ACID (PLA) MARKET, BY TYPE, 2020-2029 (KILO TONS)
TABLE 94 EGYPT POLYLACTIC ACID (PLA) MARKET, BY RAW MATERIAL, 2020-2029 (USD THOUSAND)
TABLE 95 EGYPT POLYLACTIC ACID (PLA) MARKET, BY FORM, 2020-2029 (USD THOUSAND)
TABLE 96 EGYPT POLYLACTIC ACID (PLA) MARKET, BY APPLICATION, 2020-2029 (USD THOUSAND)
TABLE 97 EGYPT PACKAGING IN POLYLACTIC ACID (PLA) MARKET, BY APPLICATION, 2020-2029 (USD THOUSAND)
TABLE 98 EGYPT RIGID APPLICATION IN POLYLACTIC ACID (PLA) MARKET, BY APPLICATION, 2020-2029 (USD THOUSAND)
TABLE 99 EGYPT AGRICULTURE IN POLYLACTIC ACID (PLA) MARKET, BY APPLICATION, 2020-2029 (USD THOUSAND)
TABLE 100 EGYPT HYGIENE IN POLYLACTIC ACID (PLA) MARKET, BY APPLICATION, 2020-2029 (USD THOUSAND)
TABLE 101 EGYPT POLYLACTIC ACID (PLA) MARKET, BY END USER, 2020-2029 (USD THOUSAND)
TABLE 102 EGYPT BIODEGRADABLE MEDICAL DEVICES IN POLYLACTIC ACID (PLA) MARKET, BY END USER, 2020-2029 (USD THOUSAND)
TABLE 103 ISRAEL POLYLACTIC ACID (PLA) MARKET, BY TYPE, 2020-2029 (USD THOUSAND)
TABLE 104 ISRAEL POLYLACTIC ACID (PLA) MARKET, BY TYPE, 2020-2029 (KILO TONS)
TABLE 105 ISRAEL POLYLACTIC ACID (PLA) MARKET, BY RAW MATERIAL, 2020-2029 (USD THOUSAND)
TABLE 106 ISRAEL POLYLACTIC ACID (PLA) MARKET, BY FORM, 2020-2029 (USD THOUSAND)
TABLE 107 ISRAEL POLYLACTIC ACID (PLA) MARKET, BY APPLICATION, 2020-2029 (USD THOUSAND)
TABLE 108 ISRAEL PACKAGING IN POLYLACTIC ACID (PLA) MARKET, BY APPLICATION, 2020-2029 (USD THOUSAND)
TABLE 109 ISRAEL RIGID APPLICATION IN POLYLACTIC ACID (PLA) MARKET, BY APPLICATION, 2020-2029 (USD THOUSAND)
TABLE 110 ISRAEL AGRICULTURE IN POLYLACTIC ACID (PLA) MARKET, BY APPLICATION, 2020-2029 (USD THOUSAND)
TABLE 111 ISRAEL HYGIENE IN POLYLACTIC ACID (PLA) MARKET, BY APPLICATION, 2020-2029 (USD THOUSAND)
TABLE 112 ISRAEL POLYLACTIC ACID (PLA) MARKET, BY END USER, 2020-2029 (USD THOUSAND)
TABLE 113 ISRAEL BIODEGRADABLE MEDICAL DEVICES IN POLYLACTIC ACID (PLA) MARKET, BY END USER, 2020-2029 (USD THOUSAND)
TABLE 114 REST OF MIDDLE EAST AND AFRICA POLYLACTIC ACID (PLA) MARKET, BY TYPE, 2020-2029 (USD THOUSAND)
TABLE 115 REST OF MIDDLE EAST AND AFRICA POLYLACTIC ACID (PLA) MARKET, BY TYPE, 2020-2029 (KILO TONS)
List of Figure
FIGURE 1 MIDDLE EAST & AFRICA POLYLACTIC ACID (PLA) MARKET
FIGURE 2 MIDDLE EAST & AFRICA POLYLACTIC ACID (PLA) MARKET: DATA TRIANGULATION
FIGURE 3 MIDDLE EAST & AFRICA POLYLACTIC ACID (PLA) MARKET: DROC ANALYSIS
FIGURE 4 MIDDLE EAST & AFRICA POLYLACTIC ACID (PLA) MARKET: MIDDLE EAST & AFRICA VS REGIONAL MARKET ANALYSIS
FIGURE 5 MIDDLE EAST & AFRICA POLYLACTIC ACID (PLA) MARKET: COMPANY RESEARCH ANALYSIS
FIGURE 6 MIDDLE EAST & AFRICA POLYLACTIC ACID (PLA) MARKET: THE TYPE LIFELINE CURVE
FIGURE 7 MIDDLE EAST & AFRICA POLYLACTIC ACID (PLA) MARKET: MULTIVARIATE MODELLING
FIGURE 8 MIDDLE EAST & AFRICA POLYLACTIC ACID (PLA) MARKET: INTERVIEW DEMOGRAPHICS
FIGURE 9 MIDDLE EAST & AFRICA POLYLACTIC ACID (PLA) MARKET: DBMR MARKET POSITION GRID
FIGURE 10 MIDDLE EAST & AFRICA POLYLACTIC ACID (PLA) MARKET: MARKET END-USER COVERAGE GRID
FIGURE 11 MIDDLE EAST & AFRICA POLYLACTIC ACID (PLA) MARKET: THE MARKET CHALLENGE MATRIX
FIGURE 12 MIDDLE EAST & AFRICA POLYLACTIC ACID (PLA) MARKET: VENDOR SHARE ANALYSIS
FIGURE 13 MIDDLE EAST & AFRICA POLYLACTIC ACID (PLA) MARKET: SEGMENTATION
FIGURE 14 ASIA PACIFIC IS EXPECTED TO DOMINATE THE MIDDLE EAST & AFRICA POLYLACTIC ACID (PLA) MARKET AND IS EXPECTED TO GROW WITH THE HIGHEST CAGR IN THE FORECAST PERIOD OF 2022 TO 2029
FIGURE 15 GROWING DEMAND FOR BIO-BASED PLASTICS FILM IN AGRICULTURE IS DRIVING MIDDLE EAST & AFRICA POLYLACTIC ACID (PLA) MARKET IN THE FORECAST PERIOD OF 2022 TO 2029
FIGURE 16 RACEMIC PLLA (POLY-L-LACTIC ACID) SEGMENT IS EXPECTED TO ACCOUNT FOR THE LARGEST SHARE OF THE MIDDLE EAST & AFRICA POLYLACTIC ACID (PLA) MARKET IN 2022 & 2029
FIGURE 17 VENDOR SELECTION CRITERIA
FIGURE 18 SUPPLY CHAIN ANALYSIS- MIDDLE EAST & AFRICA POLYLACTIC ACID (PLA) MARKET
FIGURE 19 DRIVERS, RESTRAINTS, OPPORTUNITIES, AND CHALLENGES OF THE MIDDLE EAST & AFRICA POLYLACTIC ACID (PLA) MARKET
FIGURE 20 MIDDLE EAST & AFRICA POLYLACTIC ACID (PLA) MARKET, BY TYPE, 2021
FIGURE 21 MIDDLE EAST & AFRICA POLYLACTIC ACID (PLA) MARKET, BY RAW MATERIAL, 2021
FIGURE 22 MIDDLE EAST & AFRICA POLYLACTIC ACID (PLA) MARKET,BY FORM, 2021
FIGURE 23 MIDDLE EAST & AFRICA POLYLACTIC ACID (PLA) MARKET, APPLICATION, 2021
FIGURE 24 MIDDLE EAST & AFRICA POLYLACTIC ACID (PLA) MARKET, END USER, 2021
FIGURE 25 MIDDLE EAST AND AFRICA POLYLACTIC ACID (PLA) MARKET: SNAPSHOT (2021)
FIGURE 26 MIDDLE EAST AND AFRICA POLYLACTIC ACID (PLA) MARKET: BY COUNTRY (2021)
FIGURE 27 MIDDLE EAST AND AFRICA POLYLACTIC ACID (PLA) MARKET: BY COUNTRY (2022 & 2029)
FIGURE 28 MIDDLE EAST AND AFRICA POLYLACTIC ACID (PLA) MARKET: BY COUNTRY (2021 & 2029)
FIGURE 29 MIDDLE EAST AND AFRICA POLYLACTIC ACID (PLA) MARKET: BY TYPE (2022-2029)
FIGURE 30 MIDDLE EAST & AFRICA POLYLACTIC ACID (PLA) MARKET: COMPANY SHARE 2021 (%)
Middle East And Africa Polylactic Acid Pla Market, Supply Chain Analysis and Ecosystem Framework
To support market growth and help clients navigate the impact of geopolitical shifts, DBMR has integrated in-depth supply chain analysis into its Middle East And Africa Polylactic Acid Pla Market research reports. This addition empowers clients to respond effectively to global changes affecting their industries. The supply chain analysis section includes detailed insights such as Middle East And Africa Polylactic Acid Pla Market consumption and production by country, price trend analysis, the impact of tariffs and geopolitical developments, and import and export trends by country and HSN code. It also highlights major suppliers with data on production capacity and company profiles, as well as key importers and exporters. In addition to research, DBMR offers specialized supply chain consulting services backed by over a decade of experience, providing solutions like supplier discovery, supplier risk assessment, price trend analysis, impact evaluation of inflation and trade route changes, and comprehensive market trend analysis.
Data collection and base year analysis are done using data collection modules with large sample sizes. The stage includes obtaining market information or related data through various sources and strategies. It includes examining and planning all the data acquired from the past in advance. It likewise envelops the examination of information inconsistencies seen across different information sources. The market data is analysed and estimated using market statistical and coherent models. Also, market share analysis and key trend analysis are the major success factors in the market report. To know more, please request an analyst call or drop down your inquiry.
The key research methodology used by DBMR research team is data triangulation which involves data mining, analysis of the impact of data variables on the market and primary (industry expert) validation. Data models include Vendor Positioning Grid, Market Time Line Analysis, Market Overview and Guide, Company Positioning Grid, Patent Analysis, Pricing Analysis, Company Market Share Analysis, Standards of Measurement, Global versus Regional and Vendor Share Analysis. To know more about the research methodology, drop in an inquiry to speak to our industry experts.
Data Bridge Market Research is a leader in advanced formative research. We take pride in servicing our existing and new customers with data and analysis that match and suits their goal. The report can be customized to include price trend analysis of target brands understanding the market for additional countries (ask for the list of countries), clinical trial results data, literature review, refurbished market and product base analysis. Market analysis of target competitors can be analyzed from technology-based analysis to market portfolio strategies. We can add as many competitors that you require data about in the format and data style you are looking for. Our team of analysts can also provide you data in crude raw excel files pivot tables (Fact book) or can assist you in creating presentations from the data sets available in the report.


