
Middle East And Africa Trauma Devices Market
Market Size in USD Billion
 USD
13.66 Billion
USD
26.24 Billion
2022
2030
USD
13.66 Billion
USD
26.24 Billion
2022
2030
| 2023 - 2030 | |
| USD 13.66 Billion | |
| USD 26.24 Billion | |
| % | |
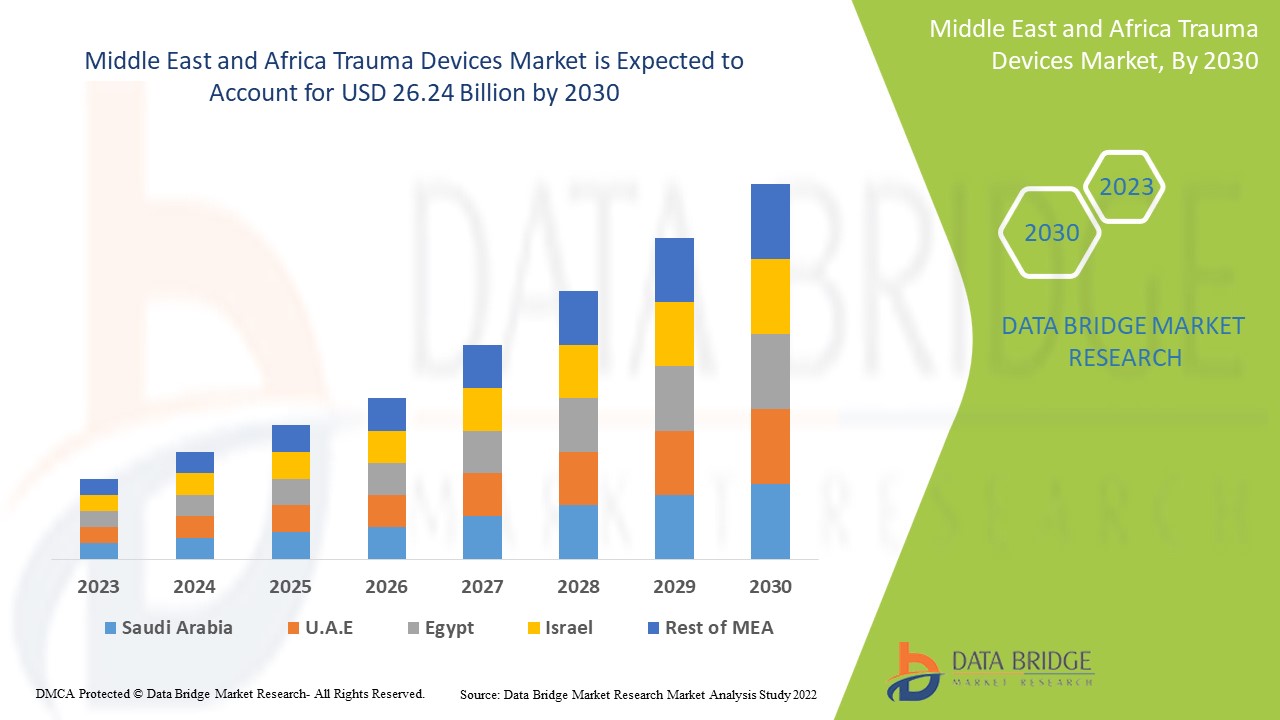
Middle East and Africa Trauma Devices Market Analysis and Size
As trauma devices have repeatedly demonstrated their high rates of effectiveness for treating fractures, dislocations, sprains, and strains, their market value is rising. Various research studies are currently underway, which are expected to provide manufacturers with a competitive advantage in developing new and innovative trauma devices and a variety of other opportunities in the trauma devices market.
Data Bridge Market Research analyses that the trauma devices market which was USD 13.66 billion in 2022, would rocket up to USD 26.24 billion by 2030, and is expected to undergo a CAGR of 8.50% during the forecast period 2022 to 2030. In addition to the insights on market scenarios such as market value, growth rate, segmentation, geographical coverage, and major players, the market reports curated by the Data Bridge Market Research also include depth expert analysis, patient epidemiology, pipeline analysis, pricing analysis, and regulatory framework.
Trauma Devices Market Scope and Segmentation
|
Report Metric |
Details |
|
Forecast Period |
2023 to 2030 |
|
Base Year |
2022 |
|
Historic Years |
2021 (Customizable to 2015 - 2020) |
|
Quantitative Units |
Revenue in USD Billion, Volumes in Units, Pricing in USD |
|
Segments Covered |
Product (Internal Fixators Devices, External Fixators Devices and Others), Surgical Site (Lower Extremities and Upper Extremities), Tissue Type (Hard Tissue and Soft Tissue), Material Type (Non-Absorbable and Bio-Absorbable), Patient Age (Adults and Paediatric), End User (Hospitals, Trauma Centres, Ambulatory Surgical Centres and Other), Distribution Channel (Direct Tender and Retail Sales) |
|
Countries Covered |
Saudi Arabia, U.A.E, South Africa, Egypt, Israel, Rest of Middle East and Africa (MEA) as a part of Middle East and Africa (MEA) |
|
Market Players Covered |
Shanghai Kinetic Medical Co. Ltd (China), Weigao group (China), MicroPort Scientific Corporation (China), Orthofix US LLC (U.S.), CONMED Corporation (U.S.), Wright Medical Group N.V. (U.S.), NuVasive, Inc (U.S.), Corin Group (U.S.), Enovis (U.S.), OsteoMed (U.S.), Invibio Ltd. (U.S.), gpcmedical.com (U.S.), Medtronic (Ireland), Smith & Nephew (U.S.), Integra LifeSciences (U.S.), B. Braun SE (Germany), Stryker (U.S.) |
|
Market Opportunities |
|
Market Definition
Trauma devices are a clinical procedure used in trauma care. Traumatic injuries caused by an external source include fractures, dislocations, sprains and strains, and burns. These tools are especially useful in cases involving long bones, such as fractures. The trauma devices also include upper and lower extremity components such as the knee, joint, leg, spine, and others.
Trauma Devices Market Dynamics
Drivers
- Dramatic rise in geriatric population across the globe
The primary driver is the increase in traffic accidents. The number of serious fractures among the elderly brought on by accidents and falls is expected to increase, requiring the usage of fracture fixators which will propel the market growth.
- Increase in the aging population
An ageing population that is more susceptible to osteoarthritic fractures, an increase in the prevalence of osteoporosis, and technological advancements like the use of orthobiologic products and biodegradable materials will all drive the market. Additionally, the sector will advance due to an increase in the incidence of traffic accidents, sports-related injuries, and people's changing lifestyles..
- Injuries caused by trauma
Trauma includes bone fractures or breakage as well as tissue injuries. These injuries are treated with trauma devices, which replace the damaged body part. Motor vehicle accidents cause a large number of trauma injuries. The market has been driven by an increase in the frequency of incidents in emerging countries.
Opportunities
- Increased government attention on new medication discovery and development
The factors that are most important for driving market revenue growth are the rapid spread of COVID-19 throughout the world, a rapidly expanding patient pool, significant alterations in the demand for and supply of healthcare solutions during the COVID-19 outbreak, rising telehealth and telemedicine trends, and a growing requirement for advanced point-of-care diagnostics. Increased government funding for COVID-19 vaccine development, increased government focus on new medication discovery and development, and increased government focus on improving the healthcare supply chain system all contribute to revenue growth in the market.
Restraints/Challenges
- High cost of trauma devices
The high cost of trauma devices, allergies associated with internal fixation devices, and the risk of infection, as well as price fluctuations and a scarcity of experienced experts, are expected to hamper the market expansion. Furthermore, due to patient compatibility and allergy concerns, government authorities do not quickly approve the materials used to manufacture trauma devices. These implants' materials are expected to be biocompatible and highly inert. As a result, obtaining approval for these devices is difficult for businesses.
This trauma devices market report provides details of new recent developments, trade regulations, import-export analysis, production analysis, value chain optimization, market share, impact of domestic and localized market players, analyses opportunities in terms of emerging revenue pockets, changes in market regulations, strategic market growth analysis, market size, category market growths, application niches and dominance, product approvals, product launches, geographic expansions, technological innovations in the market. To gain more info on the trauma devices market contact Data Bridge Market Research for an Analyst Brief, our team will help you take an informed market decision to achieve market growth.
COVID-19 Impact on Trauma Devices Market
The COVID-19 pandemic has had a significant impact on global economies, with all industries experiencing significant declines by 2020. The business has suffered significantly as a result of the pandemic's strain on healthcare institutions to contain illness transmission. Many treatments and surgical procedures were documented to be halted or postponed permanently throughout the pandemic due to the non-essential nature of trauma fixation operations. As a result, demand for trauma fixation devices was low during the first few months of the epidemic, limiting the industry's growth. Furthermore, the expansion of multispecialty hospitals to provide proper trauma care, particularly in emerging markets such as India, will increase industry income. Similarly, low-cost therapies provided by various government organizations will act as a significant market expansion stimulus in low-income countries.
Recent Developments
- In 2019, Colfax Corporation acquired DJO Global, Inc, a private equity firm with multiple divisions, including bracing and supports, surgical, footcare, healthcare solutions, recovery, and consumer. This acquisition will help the company earn more profit by increasing revenue.
- In 2019, Medtronic acquired Titan Spine. Medtronic's titanium spine interbody implant and surface technology portfolio was expanded as a result of this acquisition. This also aided the company's offering of trauma devices.
Middle East and Africa Trauma Devices Market Scope
The trauma devices market is segmented on the basis of type, surgical site and end-user. The growth amongst these segments will help you analyze meagre growth segments in the industries and provide the users with a valuable market overview and market insights to help them make strategic decisions for identifying core market applications.
Type
- Internal Fixators
- Plates and Screws
- Rods and Pins
- Others
- External Fixators
- Uniplanar and Biplanar Fixators
- Circular Fixators
- Hybrid Fixators
Surgical Site
- Upper Extremity
- Hand and Wrist
- Shoulder
- Arm
- Elbow
- Lower Extremity
- Hip and Pelvis
- Lower Leg
- Foot and Ankle
- Knee
- Thigh
End-user
- Hospitals
- Ambulatory Surgical Centres
Trauma Devices Market Regional Analysis/Insights
The trauma devices market is analyzed and market size insights and trends are provided by country, type, surgical site and end-user as referenced above.
The countries covered in the trauma devices market report are Saudi Arabia, U.A.E, South Africa, Egypt, Israel, Rest of Middle East and Africa (MEA) as a part of Middle East and Africa (MEA).
Saudi Arabia dominates the Middle East and Africa trauma devices market due to the large number of companies, R&D capabilities, and growing adoption of minimally invasive surgical procedures.
The country section of the report also provides individual market impacting factors and changes in regulation in the market domestically that impacts the current and future trends of the market. Data points like down-stream and upstream value chain analysis, technical trends and porter's five forces analysis, case studies are some of the pointers used to forecast the market scenario for individual countries. Also, the presence and availability of global brands and their challenges faced due to large or scarce competition from local and domestic brands, impact of domestic tariffs and trade routes are considered while providing forecast analysis of the country data.
Healthcare Infrastructure Growth Installed base and New Technology Penetration
The trauma devices market also provides you with detailed market analysis for every country growth in healthcare expenditure for capital equipment, installed base of different kind of products for trauma devices market, impact of technology using life line curves and changes in healthcare regulatory scenarios and their impact on the trauma devices market. The data is available for historic period 2011-2021.
Competitive Landscape and Trauma Devices Market Share Analysis
The trauma devices market competitive landscape provides details by competitor. Details included are company overview, company financials, revenue generated, market potential, investment in research and development, new market initiatives, global presence, production sites and facilities, production capacities, company strengths and weaknesses, product launch, product width and breadth, application dominance. The above data points provided are only related to the companies' focus related to trauma devices market.
Some of the major players operating in the trauma devices market are:
- Shanghai Kinetic Medical Co. Ltd (China)
- Weigao group (China)
- MicroPort Scientific Corporation (China)
- Orthofix US LLC (U.S.)
- CONMED Corporation (U.S.)
- Wright Medical Group N.V. (U.S.)
- NuVasive, Inc (U.S.)
- Corin Group (U.S.)
- Enovis (U.S.)
- OsteoMed (U.S.)
- Invibio Ltd. (U.S.)
- gpcmedical.com (U.S.)
- Medtronic (Ireland)
- Smith & Nephew (U.S.)
- Integra LifeSciences (U.S.)
- B. Braun SE (Germany)
- Stryker (U.S.)
SKU-

- Interactive Data Analysis Dashboard
- Company Analysis Dashboard for high growth potential opportunities
- Research Analyst Access for customization & queries
- Competitor Analysis with Interactive dashboard
- Latest News, Updates & Trend analysis
- Harness the Power of Benchmark Analysis for Comprehensive Competitor Tracking
Table of Content
1 INTRODUCTION
1.1 OBJECTIVES OF THE STUDY
1.2 MARKET DEFINITION
1.3 OVERVIEW OF MIDDLE EAST AND AFRICA (MEA) TRAUMA DEVICES MARKET
1.4 CURRENCY AND PRICING
1.5 LIMITATION
1.6 MARKETS COVERED
2 MARKET SEGMENTATION
2.1 KEY TAKEAWAYS
2.2 ARRIVING AT THE MIDDLE EAST AND AFRICA (MEA)TRAUMA DEVICES MARKET SIZE
2.2.1 VENDOR POSITIONING GRID
2.2.2 TECHNOLOGY LIFE LINE CURVE
2.2.3 TRIPOD DATA VALIDATION MODEL
2.2.4 MARKET GUIDE
2.2.5 MULTIVARIATE MODELLING
2.2.6 TOP TO BOTTOM ANALYSIS
2.2.7 CHALLENGE MATRIX
2.2.8 APPLICATION COVERAGE GRID
2.2.9 STANDARDS OF MEASUREMENT
2.2.10 VENDOR SHARE ANALYSIS
2.2.11 DATA POINTS FROM KEY PRIMARY INTERVIEWS
2.2.12 DATA POINTS FROM KEY SECONDARY DATABASES
2.3 MIDDLE EAST AND AFRICA (MEA)TRAUMA DEVICES MARKET: RESEARCH SNAPSHOT
2.4 ASSUMPTIONS
3 MARKET OVERVIEW
3.1 DRIVERS
3.2 RESTRAINTS
3.3 OPPORTUNITIES
3.4 CHALLENGES
4 EXECUTIVE SUMMARY
5 PREMIUM INSIGHTS
5.1 PESTEL ANALYSIS
5.2 PORTER’S FIVE FORCES MODEL
6 INDUSTRY INSIGHTS
6.1 MICRO AND MACRO ECONOMIC FACTORS
6.2 PENETRATION AND GROWTH PROSPECT MAPPING
6.3 KEY PRICING STRATEGIES
6.4 INTERVIEWS WITH SPECIALIST
6.5 ANALYIS AND RECOMMENDATION
7 COST ANALYSIS BREAKDOWN
8 TECHNONLOGY ROADMAP
9 INNOVATION TRACKER AND STRATEGIC ANALYSIS
9.1 MAJOR DEALS AND STRATEGIC ALLIANCES ANALYSIS
9.1.1 JOINT VENTURES
9.1.2 MERGERS AND ACQUISITIONS
9.1.3 LICENSING AND PARTNERSHIP
9.1.4 TECHNOLOGY COLLABORATIONS
9.1.5 STRATEGIC DIVESTMENTS
9.2 NUMBER OF PRODUCTS IN DEVELOPMENT
9.3 STAGE OF DEVELOPMENT
9.4 TIMELINES AND MILESTONES
9.5 INNOVATION STRATEGIES AND METHODOLOGIES
9.6 RISK ASSESSMENT AND MITIGATION
9.7 FUTURE OUTLOOK
10 REGULATORY COMPLIANCE
10.1 REGULATORY AUTHORITIES
10.2 REGULATORY CLASSIFICATIONS
10.3 REGULATORY SUBMISSIONS
10.4 INTERNATIONAL HARMONIZATION
10.5 COMPLIANCE AND QUALITY MANAGEMENT SYSTEMS
10.6 REGULATORY CHALLENGES AND STRATEGIES
11 REIMBURSEMENT FRAMEWORK
12 VALUE CHAIN ANALYSIS
13 HEALTHCARE ECONOMY
13.1 HEALTHCARE EXPENDITURE
13.2 CAPITAL EXPENDITURE
13.3 CAPEX TRENDS
13.4 CAPEX ALLOCATION
13.5 FUNDING SOURCES
13.6 INDUSTRY BENCHMARKS
13.7 GDP RATION IN OVERALL GDP
13.8 HEALTHCARE SYSTEM STRUCTURE
13.9 GOVERNMENT POLICIES
13.1 ECONOMIC DEVELOPMENT
14 MIDDLE EAST AND AFRICA (MEA)TRAUMA DEVICES MARKET, BY PRODUCT TYPE
14.1 OVERVIEW
NOTE: MARKET VALUE, VOLUME AND ASP ANALYSIS WOULD BE PROVIDED FOR ALL SEGMENTS AND SUB-SEGMENTS OF PRODUCT)
14.2 CORE TRAUMA DEVICES
14.2.1 INTERNAL FIXATOR DEVICES
14.2.1.1. SCREW
14.2.1.1.1. BY TYPE
14.2.1.1.1.1 COMPRESSION BONE SCREWS
14.2.1.1.1.1.1. MARKET VALUE (USD MILLION)
14.2.1.1.1.1.2. MARKET VOLUME (UNITS)
14.2.1.1.1.1.3. AVERAGE SELLING PRICE (USD)
14.2.1.1.1.2 ARTHRODESIS SCREWS
14.2.1.1.1.2.1. MARKET VALUE (USD MILLION)
14.2.1.1.1.2.2. MARKET VOLUME (UNITS)
14.2.1.1.1.2.3. AVERAGE SELLING PRICE (USD)
14.2.1.1.1.3 BONE SCREW WASHERS
14.2.1.1.1.3.1. MARKET VALUE (USD MILLION)
14.2.1.1.1.3.2. MARKET VOLUME (UNITS)
14.2.1.1.1.3.3. AVERAGE SELLING PRICE (USD)
14.2.1.1.2. BY LENGTH
14.2.1.1.2.1 1.5 MM
14.2.1.1.2.2 2 MM
14.2.1.1.2.3 2.7 MM
14.2.1.1.2.4 3.5 MM
14.2.1.1.2.5 OTHERS
14.2.1.1.3. BY MATERIAL
14.2.1.1.3.1 BIOABSORBABLE SCREWS
14.2.1.1.3.2 NON- BIOABSORBABLE SCREWS
14.2.1.1.4. OTHERS
14.2.1.2. NAILING
14.2.1.2.1. TIBIA NAILING SYSTEM
14.2.1.2.1.1 MARKET VALUE (USD MILLION)
14.2.1.2.1.2 MARKET VOLUME (UNITS)
14.2.1.2.1.3 AVERAGE SELLING PRICE (USD)
14.2.1.2.2. FEMUR NAILING SYSTEM
14.2.1.2.2.1 MARKET VALUE (USD MILLION)
14.2.1.2.2.2 MARKET VOLUME (UNITS)
14.2.1.2.2.3 AVERAGE SELLING PRICE (USD)
14.2.1.2.3. OTHERS
14.2.1.2.3.1 MARKET VALUE (USD MILLION)
14.2.1.2.3.2 MARKET VOLUME (UNITS)
14.2.1.2.3.3 AVERAGE SELLING PRICE (USD)
14.2.1.3. PLATES
14.2.1.3.1. COMPRESSION PLATES
14.2.1.3.1.1 MARKET VALUE (USD MILLION)
14.2.1.3.1.2 MARKET VOLUME (UNITS)
14.2.1.3.1.3 AVERAGE SELLING PRICE (USD)
14.2.1.3.2. OSTEOTOMY PLATES
14.2.1.3.2.1 MARKET VALUE (USD MILLION)
14.2.1.3.2.2 MARKET VOLUME (UNITS)
14.2.1.3.2.3 AVERAGE SELLING PRICE (USD)
14.2.1.3.3. ARTHRODESIS PLATES
14.2.1.3.3.1 MARKET VALUE (USD MILLION)
14.2.1.3.3.2 MARKET VOLUME (UNITS)
14.2.1.3.3.3 AVERAGE SELLING PRICE (USD)
14.2.1.3.4. OTHERS
14.2.1.4. STAPLES
14.2.1.4.1. MARKET VALUE (USD MILLION)
14.2.1.4.2. MARKET VOLUME (UNITS)
14.2.1.4.3. AVERAGE SELLING PRICE (USD)
14.2.1.5. WIRES
14.2.1.5.1. MARKET VALUE (USD MILLION)
14.2.1.5.2. MARKET VOLUME (UNITS)
14.2.1.5.3. AVERAGE SELLING PRICE (USD)
14.2.1.6. RODS & PINS
14.2.1.6.1. MARKET VALUE (USD MILLION)
14.2.1.6.2. MARKET VOLUME (UNITS)
14.2.1.6.3. AVERAGE SELLING PRICE (USD)
14.2.1.7. OTHERS
14.2.2 EXTERNAL FIXATOR DEVICES
14.2.2.1. UNILATERAL & BILATERAL EXTERNAL FIXATORS
14.2.2.1.1. MARKET VALUE (USD MILLION)
14.2.2.1.2. MARKET VOLUME (UNITS)
14.2.2.1.3. AVERAGE SELLING PRICE (USD)
14.2.2.2. CIRCULAR FIXATORS
14.2.2.2.1. MARKET VALUE (USD MILLION)
14.2.2.2.2. MARKET VOLUME (UNITS)
14.2.2.2.3. AVERAGE SELLING PRICE (USD)
14.2.2.3. HYBRID FIXATORS
14.2.2.3.1. MARKET VALUE (USD MILLION)
14.2.2.3.2. MARKET VOLUME (UNITS)
14.2.2.3.3. AVERAGE SELLING PRICE (USD)
14.2.2.3.4. OTHERS
14.2.3 INTRAOSSEOUS DEVICES
14.2.3.1. MANUAL
14.2.3.1.1. MARKET VALUE (USD MILLION)
14.2.3.1.2. MARKET VOLUME (UNITS)
14.2.3.1.3. AVERAGE SELLING PRICE (USD)
14.2.3.2. SEMI-AUTOMATED
14.2.3.2.1. MARKET VALUE (USD MILLION)
14.2.3.2.2. MARKET VOLUME (UNITS)
14.2.3.2.3. AVERAGE SELLING PRICE (USD)
14.2.3.3. AUTOMATED
14.2.3.3.1. MARKET VALUE (USD MILLION)
14.2.3.3.2. MARKET VOLUME (UNITS)
14.2.3.3.3. AVERAGE SELLING PRICE (USD)
14.3 SHOULDER ARTHROPLASTY DEVICES
14.3.1 BY TYPE
14.3.1.1. SHOULDER ARTHROPLASTY RESURFACING IMPLANTS
14.3.1.1.1. RESURFACING HEAD
14.3.1.1.1.1 MARKET VALUE (USD MILLION)
14.3.1.1.1.2 MARKET VOLUME (UNITS)
14.3.1.1.1.3 AVERAGE SELLING PRICE (USD)
14.3.1.1.2. SHOULDER CUP
14.3.1.1.2.1 MARKET VALUE (USD MILLION)
14.3.1.1.2.2 MARKET VOLUME (UNITS)
14.3.1.1.2.3 AVERAGE SELLING PRICE (USD)
14.3.1.1.3. HUMERAL STEM
14.3.1.1.3.1 MARKET VALUE (USD MILLION)
14.3.1.1.3.2 MARKET VOLUME (UNITS)
14.3.1.1.3.3 AVERAGE SELLING PRICE (USD)
14.3.1.1.4. ECCENTER
14.3.1.1.4.1 MARKET VALUE (USD MILLION)
14.3.1.1.4.2 MARKET VOLUME (UNITS)
14.3.1.1.4.3 AVERAGE SELLING PRICE (USD)
14.3.1.1.5. GLENOID
14.3.1.1.5.1 MARKET VALUE (USD MILLION)
14.3.1.1.5.2 MARKET VOLUME (UNITS)
14.3.1.1.5.3 AVERAGE SELLING PRICE (USD)
14.3.1.1.6. SHELL SCREWS
14.3.1.1.6.1 MARKET VALUE (USD MILLION)
14.3.1.1.6.2 MARKET VOLUME (UNITS)
14.3.1.1.6.3 AVERAGE SELLING PRICE (USD)
14.3.1.1.7. OTHER
14.3.1.2. SHOULDER ARTHROPLASTY TRAUMA DEVICES
14.3.1.2.1. STEM INSTRUMENTS
14.3.1.2.1.1 MARKET VALUE (USD MILLION)
14.3.1.2.1.2 MARKET VOLUME (UNITS)
14.3.1.2.1.3 AVERAGE SELLING PRICE (USD)
14.3.1.2.2. PRESS INSTRUMENTS
14.3.1.2.2.1 MARKET VALUE (USD MILLION)
14.3.1.2.2.2 MARKET VOLUME (UNITS)
14.3.1.2.2.3 AVERAGE SELLING PRICE (USD)
14.3.1.2.3. GLENOID INSERTION INSTRUMENTS
14.3.1.2.3.1 MARKET VALUE (USD MILLION)
14.3.1.2.3.2 MARKET VOLUME (UNITS)
14.3.1.2.3.3 AVERAGE SELLING PRICE (USD)
14.3.1.2.4. OTHER
14.3.1.3. SHOULDER ARTHROPLASTY PLATFORM SYSTEMS
14.3.2 BY PROCEDURE
14.3.2.1. PARTIAL SHOULDER ARTHROPLASTY
14.3.2.1.1. PARTIAL RESURFACING
14.3.2.1.2. HEMI RESURFACING
14.3.2.1.3. PARTIAL-MID HEAD
14.3.2.1.4. STEMMED HEMI
14.3.2.2. TOTAL SHOULDER ARTHROPLASTY
14.3.2.2.1. TOTAL-MID HEAD
14.3.2.2.2. TOTAL CONVENTIONAL
14.3.2.2.3. TOTAL REVERSE
14.3.2.3. REVIION SHOULDER ARTHROPLASTY
14.4 FOOT AND ANKLE ARTHROPLASTY DEVICES
14.4.1 INTERANL FIXATION DEVICES
14.4.1.1. PLATES
14.4.1.1.1. MARKET VALUE (USD MILLION)
14.4.1.1.2. MARKET VOLUME (UNITS)
14.4.1.1.3. AVERAGE SELLING PRICE (USD)
14.4.1.2. SCREW
14.4.1.2.1. MARKET VALUE (USD MILLION)
14.4.1.2.2. MARKET VOLUME (UNITS)
14.4.1.2.3. AVERAGE SELLING PRICE (USD)
14.4.1.3. FUSION NAILS
14.4.1.3.1. MARKET VALUE (USD MILLION)
14.4.1.3.2. MARKET VOLUME (UNITS)
14.4.1.3.3. AVERAGE SELLING PRICE (USD)
14.4.1.4. WIRE & PINS
14.4.1.4.1. MARKET VALUE (USD MILLION)
14.4.1.4.2. MARKET VOLUME (UNITS)
14.4.1.4.3. AVERAGE SELLING PRICE (USD)
14.4.1.5. INTRAMEDULLARY IMPLANT
14.4.1.5.1. MARKET VALUE (USD MILLION)
14.4.1.5.2. MARKET VOLUME (UNITS)
14.4.1.5.3. AVERAGE SELLING PRICE (USD)
14.4.1.6. HAMMERTOE FIXATION SYSTEM
14.4.1.6.1. MARKET VALUE (USD MILLION)
14.4.1.6.2. MARKET VOLUME (UNITS)
14.4.1.6.3. AVERAGE SELLING PRICE (USD)
14.4.1.7. STAPLE FIXATION SYSTEM
14.4.1.7.1. MARKET VALUE (USD MILLION)
14.4.1.7.2. MARKET VOLUME (UNITS)
14.4.1.7.3. AVERAGE SELLING PRICE (USD)
14.4.1.8. OTHER
14.4.2 EXTERNAL FIXATION DEVICES
14.4.2.1. RING ANKLE FIXATORS
14.4.2.1.1. MARKET VALUE (USD MILLION)
14.4.2.1.2. MARKET VOLUME (UNITS)
14.4.2.1.3. AVERAGE SELLING PRICE (USD)
14.4.2.2. UNILATERAL FIXATORS
14.4.2.2.1. MARKET VALUE (USD MILLION)
14.4.2.2.2. MARKET VOLUME (UNITS)
14.4.2.2.3. AVERAGE SELLING PRICE (USD)
14.4.2.3. HYBRID FIXATORS
14.4.2.3.1. MARKET VALUE (USD MILLION)
14.4.2.3.2. MARKET VOLUME (UNITS)
14.4.2.3.3. AVERAGE SELLING PRICE (USD)
14.4.2.4. OTEHR
14.4.3 JOINT IMPLANT
14.4.3.1. ANKLE IMPLANT
14.4.3.1.1. MARKET VALUE (USD MILLION)
14.4.3.1.2. MARKET VOLUME (UNITS)
14.4.3.1.3. AVERAGE SELLING PRICE (USD)
14.4.3.2. SUBTALAR JOINT IMPLANT
14.4.3.2.1. MARKET VALUE (USD MILLION)
14.4.3.2.2. MARKET VOLUME (UNITS)
14.4.3.2.3. AVERAGE SELLING PRICE (USD)
14.4.3.3. PHALANGEAL IMPLANTS
14.4.3.3.1. MARKET VALUE (USD MILLION)
14.4.3.3.2. MARKET VOLUME (UNITS)
14.4.3.3.3. AVERAGE SELLING PRICE (USD)
14.4.3.4. OTHER
14.4.4 PROSTHESES
14.4.4.1. SOLID ANKLE CUSHION HEEL PROSTHESES
14.4.4.1.1. MARKET VALUE (USD MILLION)
14.4.4.1.2. MARKET VOLUME (UNITS)
14.4.4.1.3. AVERAGE SELLING PRICE (USD)
14.4.4.2. SINGLE ANKLE PROSTHESES
14.4.4.2.1. MARKET VALUE (USD MILLION)
14.4.4.2.2. MARKET VOLUME (UNITS)
14.4.4.2.3. AVERAGE SELLING PRICE (USD)
14.4.4.3. MULTIAXIAL PROSTHESES
14.4.4.3.1. MARKET VALUE (USD MILLION)
14.4.4.3.2. MARKET VOLUME (UNITS)
14.4.4.3.3. AVERAGE SELLING PRICE (USD)
14.4.4.4. DYNAMIC RESPONSE ENERGY STORING PROSTHESES
14.4.4.4.1. MARKET VALUE (USD MILLION)
14.4.4.4.2. MARKET VOLUME (UNITS)
14.4.4.4.3. AVERAGE SELLING PRICE (USD)
14.4.4.5. MICROPROCESSOR CONTROLLED PROSTHESES
14.5 BIOLOGICS
14.5.1 BONE GRFTS
14.5.1.1. ALLOGRAFT
14.5.1.1.1. DEMINERALIZED BONE MATRIX
14.5.1.1.1.1 MARKET VALUE (USD MILLION)
14.5.1.1.1.2 MARKET VOLUME (UNITS)
14.5.1.1.1.3 AVERAGE SELLING PRICE (USD)
14.5.1.1.2. VIABLE BONE MATRIX
14.5.1.1.2.1 MARKET VALUE (USD MILLION)
14.5.1.1.2.2 MARKET VOLUME (UNITS)
14.5.1.1.2.3 AVERAGE SELLING PRICE (USD)
14.5.1.1.3. OTHER
14.5.1.2. SYNTHETIC
14.5.1.2.1. CERAMICS
14.5.1.2.1.1 HAP
14.5.1.2.1.1.1. MARKET VALUE (USD MILLION)
14.5.1.2.1.1.2. MARKET VOLUME (UNITS)
14.5.1.2.1.1.3. AVERAGE SELLING PRICE (USD)
14.5.1.2.1.2 Β-TCP
14.5.1.2.1.2.1. MARKET VALUE (USD MILLION)
14.5.1.2.1.2.2. MARKET VOLUME (UNITS)
14.5.1.2.1.2.3. AVERAGE SELLING PRICE (USD)
14.5.1.2.1.3 Α-TCP
14.5.1.2.1.3.1. MARKET VALUE (USD MILLION)
14.5.1.2.1.3.2. MARKET VOLUME (UNITS)
14.5.1.2.1.3.3. AVERAGE SELLING PRICE (USD)
14.5.1.2.1.4 BI-PHASIC CALCIUM PHOSPHATES (BCP)
14.5.1.2.1.4.1. MARKET VALUE (USD MILLION)
14.5.1.2.1.4.2. MARKET VOLUME (UNITS)
14.5.1.2.1.4.3. AVERAGE SELLING PRICE (USD)
14.5.1.2.1.5 OTHERS
14.5.1.2.2. COMPOSITES
14.5.1.2.2.1 MARKET VALUE (USD MILLION)
14.5.1.2.2.2 MARKET VOLUME (UNITS)
14.5.1.2.2.3 AVERAGE SELLING PRICE (USD)
14.5.1.2.3. POLYMERS
14.5.1.2.3.1 MARKET VALUE (USD MILLION)
14.5.1.2.3.2 MARKET VOLUME (UNITS)
14.5.1.2.3.3 AVERAGE SELLING PRICE (USD)
14.5.1.2.4. BONE MORPHOGENIC PROTEINS (BMP)
14.5.1.2.4.1 MARKET VALUE (USD MILLION)
14.5.1.2.4.2 MARKET VOLUME (UNITS)
14.5.1.2.4.3 AVERAGE SELLING PRICE (USD)
14.5.1.2.5. OTHER
14.5.2 ACELLULAR DERMAL MATRIX
14.5.2.1. MARKET VALUE (USD MILLION)
14.5.2.2. MARKET VOLUME (UNITS)
14.5.2.3. AVERAGE SELLING PRICE (USD)
14.5.3 ALLOGRAFT BONE WEDGE
14.5.3.1. UNICORTAL
14.5.3.1.1. MARKET VALUE (USD MILLION)
14.5.3.1.2. MARKET VOLUME (UNITS)
14.5.3.1.3. AVERAGE SELLING PRICE (USD)
14.5.3.2. TRICORTAL
14.5.3.2.1. MARKET VALUE (USD MILLION)
14.5.3.2.2. MARKET VOLUME (UNITS)
14.5.3.2.3. AVERAGE SELLING PRICE (USD)
14.5.4 NERVE CONDUIT & WRAPS
14.5.4.1. MARKET VALUE (USD MILLION)
14.5.4.2. MARKET VOLUME (UNITS)
14.5.4.3. AVERAGE SELLING PRICE (USD)
14.5.5 SHAFT
14.5.5.1. MARKET VALUE (USD MILLION)
14.5.5.2. MARKET VOLUME (UNITS)
14.5.5.3. AVERAGE SELLING PRICE (USD)
14.5.6 CHIPS
14.5.6.1. MARKET VALUE (USD MILLION)
14.5.6.2. MARKET VOLUME (UNITS)
14.5.6.3. AVERAGE SELLING PRICE (USD)
14.5.7 OTHER
14.6 OTHER
14.6.1 BONE ADHESIVES
14.6.1.1. BONE CEMENT
14.6.1.1.1. BY TYPE
14.6.1.1.1.1 POLYMETHYL METHACRYLATE (PMMA) CEMENT
14.6.1.1.1.1.1. MARKET VALUE (USD MILLION)
14.6.1.1.1.1.2. MARKET VOLUME (UNITS)
14.6.1.1.1.1.3. AVERAGE SELLING PRICE (USD)
14.6.1.1.1.2 CALCIUM PHOSPHATE CEMENT (CPC)
14.6.1.1.1.2.1. MARKET VALUE (USD MILLION)
14.6.1.1.1.2.2. MARKET VOLUME (UNITS)
14.6.1.1.1.2.3. AVERAGE SELLING PRICE (USD)
14.6.1.1.1.3 GLASS POLYALKENOATE CEMENT (GPC)
14.6.1.1.1.3.1. MARKET VALUE (USD MILLION)
14.6.1.1.1.3.2. MARKET VOLUME (UNITS)
14.6.1.1.1.3.3. AVERAGE SELLING PRICE (USD)
14.6.1.1.1.4 OTHERS
14.6.1.1.2. BY LOADING
14.6.1.1.2.1 ANTIBIOTIC-LOADED BONE CEMENT
14.6.1.1.2.2 NON-ANTIBIOTIC-LOADED BONE CEMENT
14.6.1.2. BONE GLUE
14.6.1.2.1. NATURAL BONE GLUE
14.6.1.2.1.1 MARKET VALUE (USD MILLION)
14.6.1.2.1.2 MARKET VOLUME (UNITS)
14.6.1.2.1.3 AVERAGE SELLING PRICE (USD)
14.6.1.2.2. SYNTHETIC BONE GLUE
14.6.1.2.2.1 MARKET VALUE (USD MILLION)
14.6.1.2.2.2 MARKET VOLUME (UNITS)
14.6.1.2.2.3 AVERAGE SELLING PRICE (USD)
15 MIDDLE EAST AND AFRICA (MEA) TRAUMA DEVICES MARKET MARKET, BY MATERIAL
15.1 OVERVIEW
15.2 BIO-ABSORBABLE
15.2.1 OLYLACTIC ACID POLYMER
15.2.2 POLYGLYCOLIC ACID POLYMERS
15.2.3 OTHERS
15.3 NON- ABSORBABLE
15.3.1 TITANIUM
15.3.2 STAINLESS STEEL
15.3.3 OTHERS
16 MIDDLE EAST AND AFRICA (MEA) TRAUMA DEVICES MARKET MARKET, BY SURGICAL SITE
16.1 OVERVIEW
16.2 UPPER EXTRIMITIES
16.2.1 SHOULDER
16.2.2 HAND AND WRIST
16.2.3 MAXILLOFACIAL
16.2.4 ELBOW
16.2.5 ARM
16.2.6 OTHERS
16.3 LOWER EXTREMETIES
16.3.1 HIP
16.3.2 THIGH
16.3.3 KNEE
16.3.4 LEG
16.3.5 ANKLE
16.3.6 FOOT
16.3.7 OTHERS
17 MIDDLE EAST AND AFRICA (MEA) TRAUMA DEVICES MARKET MARKET, BY TRAUMA TYPE
17.1 OVERVIEW
17.2 DISLOCATIONS
17.3 JOINT REPLACEMENT AND FRACTURES
17.4 NERVE DISEASES AND SOFT TISSUE INJURIES
17.5 OTHERS
18 MIDDLE EAST AND AFRICA (MEA) TRAUMA DEVICES MARKET MARKET, BY PATIENT TYPE
18.1 OVERVIEW
18.2 PEDIATRIC
18.2.1 MALE
18.2.2 FEMALE
18.3 ADULT
18.3.1 MALE
18.3.2 FEMALE
18.4 GERIATRIC
18.4.1 MALE
18.4.2 FEMALE
19 MIDDLE EAST AND AFRICA (MEA) TRAUMA DEVICES MARKET MARKET, BY END USER
19.1 OVERVIEW
19.2 HOSPITALS
19.2.1 BY TYPE
19.2.1.1. PUBLIC
19.2.1.2. PRIVATE
19.2.2 BY TIER
19.2.2.1. TIER 1
19.2.2.2. TIER 2
19.2.2.3. TIER 3
19.3 TRAUMA CENTRES
19.4 AMBULATORY SURGICAL CENTRES
19.5 SPECIALITY CLINICS
19.6 OTHER
20 MIDDLE EAST AND AFRICA (MEA) TRAUMA DEVICES MARKET MARKET, BY DISTRIBUTION CHANNEL
20.1 OVERVIEW
20.2 DIRECT TENDERS
20.3 RETAIL SALES
20.3.1 ONLINE SALES
20.3.2 OFFLINE SALES
20.4 OTHERS
21 MIDDLE EAST AND AFRICA (MEA) TRAUMA DEVICES MARKET MARKET, SWOT AND DBMR ANALYSIS
22 MIDDLE EAST AND AFRICA (MEA) TRAUMA DEVICES MARKET MARKET, COMPANY LANDSCAPE
22.1 COMPANY SHARE ANALYSIS: MIDDLE EAST AND AFRICA (MEA)
22.2 MERGERS & ACQUISITIONS
22.3 NEW PRODUCT DEVELOPMENT & APPROVALS
22.4 EXPANSIONS
22.5 REGULATORY CHANGES
22.6 PARTNERSHIP AND OTHER STRATEGIC DEVELOPMENTS
23 MIDDLE EAST AND AFRICA (MEA) TRAUMA DEVICES MARKET MARKET, BY REGION
MIDDLE EAST AND AFRICA (MEA) TRAUMA DEVICES MARKET MARKET, (ALL SEGMENTATION PROVIDED ABOVE IS REPRESENTED IN THIS CHAPTER BY COUNTRY)
23.1 MIDDLE EAST AND AFRICA
23.1.1 SOUTH AFRICA
23.1.2 EGYPT
23.1.3 BAHRAIN
23.1.4 UNITED ARAB EMIRATES
23.1.5 KUWAIT
23.1.6 OMAN
23.1.7 QATAR
23.1.8 SAUDI ARABIA
23.1.9 REST OF MEA
23.2 KEY PRIMARY INSIGHTS: BY MAJOR COUNTRIES
24 MIDDLE EAST AND AFRICA (MEA) TRAUMA DEVICES MARKET MARKET, COMPANY PROFILE
24.1 GLOBAL COMPANIES
24.1.1 STRYKER
24.1.1.1. COMPANY OVERVIEW
24.1.1.2. REVENUE ANALYSIS
24.1.1.3. GEOGRAPHIC PRESENCE
24.1.1.4. PRODUCT PORTFOLIO
24.1.1.5. RECENT DEVELOPMENTS
24.1.2 DEPUY SYNTHES(JOHNSON & JOHNSON)
24.1.2.1. COMPANY OVERVIEW
24.1.2.2. REVENUE ANALYSIS
24.1.2.3. GEOGRAPHIC PRESENCE
24.1.2.4. PRODUCT PORTFOLIO
24.1.2.5. RECENT DEVELOPMENTS
24.1.3 ZIMMER BIOMET
24.1.3.1. COMPANY OVERVIEW
24.1.3.2. REVENUE ANALYSIS
24.1.3.3. GEOGRAPHIC PRESENCE
24.1.3.4. PRODUCT PORTFOLIO
24.1.3.5. RECENT DEVELOPMENTS
24.1.4 MEDTRONICS
24.1.4.1. COMPANY OVERVIEW
24.1.4.2. REVENUE ANALYSIS
24.1.4.3. GEOGRAPHIC PRESENCE
24.1.4.4. PRODUCT PORTFOLIO
24.1.4.5. RECENT DEVELOPMENTS
24.1.5 ARTHREX, INC
24.1.5.1. COMPANY OVERVIEW
24.1.5.2. REVENUE ANALYSIS
24.1.5.3. GEOGRAPHIC PRESENCE
24.1.5.4. PRODUCT PORTFOLIO
24.1.5.5. RECENT DEVELOPMENTS
24.1.6 SMITH+NEPHEW
24.1.6.1. COMPANY OVERVIEW
24.1.6.2. REVENUE ANALYSIS
24.1.6.3. GEOGRAPHIC PRESENCE
24.1.6.4. PRODUCT PORTFOLIO
24.1.6.5. RECENT DEVELOPMENTS
24.1.7 GLOBUS MEDICAL
24.1.7.1. COMPANY OVERVIEW
24.1.7.2. REVENUE ANALYSIS
24.1.7.3. GEOGRAPHIC PRESENCE
24.1.7.4. PRODUCT PORTFOLIO
24.1.7.5. RECENT DEVELOPMENTS
24.1.8 ORTHOMED
24.1.8.1. COMPANY OVERVIEW
24.1.8.2. REVENUE ANALYSIS
24.1.8.3. GEOGRAPHIC PRESENCE
24.1.8.4. PRODUCT PORTFOLIO
24.1.8.5. RECENT DEVELOPMENTS
24.1.9 DJO, LLC
24.1.9.1. COMPANY OVERVIEW
24.1.9.2. REVENUE ANALYSIS
24.1.9.3. GEOGRAPHIC PRESENCE
24.1.9.4. PRODUCT PORTFOLIO
24.1.9.5. RECENT DEVELOPMENTS
24.1.10 B. BRAUN SE
24.1.10.1. COMPANY OVERVIEW
24.1.10.2. REVENUE ANALYSIS
24.1.10.3. GEOGRAPHIC PRESENCE
24.1.10.4. PRODUCT PORTFOLIO
24.1.10.5. RECENT DEVELOPMENTS
24.1.11 ZIMED MEDIKAL
24.1.11.1. COMPANY OVERVIEW
24.1.11.2. REVENUE ANALYSIS
24.1.11.3. GEOGRAPHIC PRESENCE
24.1.11.4. PRODUCT PORTFOLIO
24.1.11.5. RECENT DEVELOPMENTS
24.1.12 INTEGRA LIFESCIENCES CORPORATION
24.1.12.1. COMPANY OVERVIEW
24.1.12.2. REVENUE ANALYSIS
24.1.12.3. GEOGRAPHIC PRESENCE
24.1.12.4. PRODUCT PORTFOLIO
24.1.12.5. RECENT DEVELOPMENTS
24.1.13 BIORETEC GMBH
24.1.13.1. COMPANY OVERVIEW
24.1.13.2. REVENUE ANALYSIS
24.1.13.3. GEOGRAPHIC PRESENCE
24.1.13.4. PRODUCT PORTFOLIO
24.1.13.5. RECENT DEVELOPMENTS
24.1.14 ORTHOFIX MEDICAL INC.
24.1.14.1. COMPANY OVERVIEW
24.1.14.2. REVENUE ANALYSIS
24.1.14.3. GEOGRAPHIC PRESENCE
24.1.14.4. PRODUCT PORTFOLIO
24.1.14.5. RECENT DEVELOPMENTS
24.2 LOCAL COMPANIES
24.2.1 RENISHAW PLC.
24.2.1.1. COMPANY OVERVIEW
24.2.1.2. REVENUE ANALYSIS
24.2.1.3. GEOGRAPHIC PRESENCE
24.2.1.4. PRODUCT PORTFOLIO
24.2.1.5. RECENT DEVELOPMENTS
24.2.2 TST
24.2.2.1. COMPANY OVERVIEW
24.2.2.2. REVENUE ANALYSIS
24.2.2.3. GEOGRAPHIC PRESENCE
24.2.2.4. PRODUCT PORTFOLIO
24.2.2.5. RECENT DEVELOPMENTS
24.2.3 SURGIPHARM LIMITED
24.2.3.1. COMPANY OVERVIEW
24.2.3.2. REVENUE ANALYSIS
24.2.3.3. GEOGRAPHIC PRESENCE
24.2.3.4. PRODUCT PORTFOLIO
24.2.3.5. RECENT DEVELOPMENTS
24.2.4 BAIRDMED
24.2.4.1. COMPANY OVERVIEW
24.2.4.2. REVENUE ANALYSIS
24.2.4.3. GEOGRAPHIC PRESENCE
24.2.4.4. PRODUCT PORTFOLIO
24.2.4.5. RECENT DEVELOPMENTS
24.2.5 ORTHO-SOL DEVELOPMENT (PTY) LTD
24.2.5.1. COMPANY OVERVIEW
24.2.5.2. REVENUE ANALYSIS
24.2.5.3. GEOGRAPHIC PRESENCE
24.2.5.4. PRODUCT PORTFOLIO
24.2.5.5. RECENT DEVELOPMENTS
25 REPORTS
26 CONCLUSION
27 QUESTIONNAIRE
28 ABOUT DATA BRIDGE MARKET RESEARCH
Data collection and base year analysis are done using data collection modules with large sample sizes. The stage includes obtaining market information or related data through various sources and strategies. It includes examining and planning all the data acquired from the past in advance. It likewise envelops the examination of information inconsistencies seen across different information sources. The market data is analysed and estimated using market statistical and coherent models. Also, market share analysis and key trend analysis are the major success factors in the market report. To know more, please request an analyst call or drop down your inquiry.
The key research methodology used by DBMR research team is data triangulation which involves data mining, analysis of the impact of data variables on the market and primary (industry expert) validation. Data models include Vendor Positioning Grid, Market Time Line Analysis, Market Overview and Guide, Company Positioning Grid, Patent Analysis, Pricing Analysis, Company Market Share Analysis, Standards of Measurement, Global versus Regional and Vendor Share Analysis. To know more about the research methodology, drop in an inquiry to speak to our industry experts.
Data Bridge Market Research is a leader in advanced formative research. We take pride in servicing our existing and new customers with data and analysis that match and suits their goal. The report can be customized to include price trend analysis of target brands understanding the market for additional countries (ask for the list of countries), clinical trial results data, literature review, refurbished market and product base analysis. Market analysis of target competitors can be analyzed from technology-based analysis to market portfolio strategies. We can add as many competitors that you require data about in the format and data style you are looking for. Our team of analysts can also provide you data in crude raw excel files pivot tables (Fact book) or can assist you in creating presentations from the data sets available in the report.


