
Middle East And Africa Viscosupplementation Market
Market Size in USD Million
 USD
78.50 Million
USD
127.01 Million
2025
2033
USD
78.50 Million
USD
127.01 Million
2025
2033
| 2026 - 2033 | |
| USD 78.50 Million | |
| USD 127.01 Million | |
| % | |
|
Middle East and Africa Viscosupplementation Market Overview
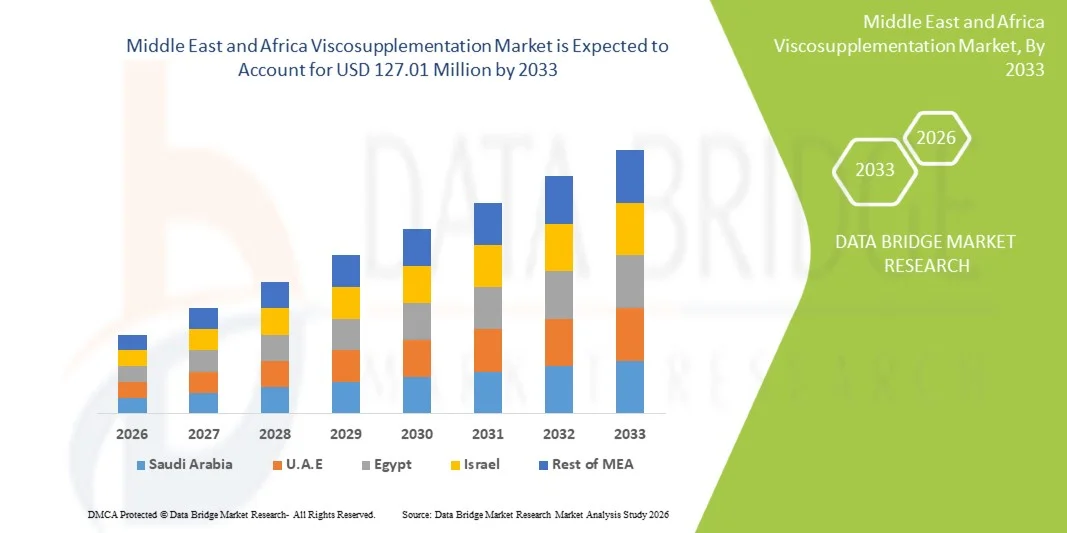
The Middle East and Africa viscosupplementation market was valued at USD 78.50 million in 2025 and is projected to reach USD 127.01 million by 2033, growing at a CAGR of 6.2% from 2026 to 2033. The market is experiencing steady growth driven by the rising prevalence of osteoarthritis, increasing geriatric population, and growing awareness of minimally invasive treatment options for joint pain management.
The expanding adoption of hyaluronic acid-based injections in orthopedic care, along with improving healthcare infrastructure across key MEA countries, is supporting market expansion. In addition, the increasing preference for non-surgical alternatives to knee replacement procedures, combined with rising sports injuries and obesity-related joint disorders, is encouraging hospitals and specialty clinics to integrate viscosupplementation therapies into routine orthopedic treatment protocols.
Key Market Trends & Insights
- Saudi Arabia dominated the Middle East and Africa viscosupplementation market with the largest revenue share of 32.6% in 2025, supported by advanced orthopedic care infrastructure, high healthcare spending, and growing adoption of hyaluronic acid injections.
- The Non-Animal Origin segment led the market with a 62.4% share in 2025, driven by higher biocompatibility, lower risk of allergic reactions, and increasing regulatory preference for biofermentation-derived hyaluronic acid products.
- South Africa is expected to be the fastest-growing country from 2026 to 2033, growing at a CAGR of 6.8%, fueled by rising osteoarthritis prevalence, expanding private healthcare access, and increasing awareness of non-surgical joint pain therapies.
- Animal Origin are the fastest-growing source type, projected to register a CAGR of 5.9%, reflecting the surge in demand for cost-effective viscosupplementation therapies in price-sensitive public healthcare systems and emerging orthopedic care markets across Africa,
- The Geriatric segment dominated the age group category with a 67.8% revenue share in 2025, led by high prevalence of osteoarthritis among elderly populations across Middle East and Africa.
- Three Injections accounted for 48.1% of the market, preferred by its established clinical efficacy, widespread physician preference, and balanced treatment cost-effectiveness.
- The Low Molecular Weight segment is the fastest-growing molecular weight category, with a CAGR of 6.5%, driven by lower cost and wider accessibility in emerging healthcare systems.
Market Size & Forecast
- Global Market Value (2025): USD 78.50 Million
- Expected Market Value (2033): USD 127.01 Million
- Forecast CAGR (2026–2033): 6.2%
- Leading Country in 2025: Saudi Arabia
- Fastest Growing Country: South Africa
Report Scope and Middle East and Africa Viscosupplementation Market Segmentation
|
Attributes |
Middle East and Africa Viscosupplementation Key Market Insights |
|
Segments Covered |
|
|
Countries Covered |
Middle East and Africa · Saudi Arabia · U.A.E. · South Africa · Egypt · Israel · Rest of Middle East and Africa |
|
Key Market Players |
· Sanofi (France) · Anika Therapeutics (U.S.) · Fidia Farmaceutici S.p.A. (Italy) · Bioventus Inc. (U.S.) · Seikagaku Corporation (Japan) · LG Chem (South Korea) · Hyaltech Ltd. (U.K.) · IBSA Institut Biochimique SA (Switzerland) · Teva Pharmaceutical Industries Ltd. (Israel) · Pharmaceutica Fidia (Italy) · Zimmer Biomet (U.S.) · Stryker (U.S.) · Smith & Nephew (U.K.) · Johnson & Johnson Services, Inc. (U.S.) · Viatris Inc. (U.S.) · Dr. Reddy’s Laboratories (India) · Sun Pharmaceutical Industries Ltd. (India) · Lupin Limited (India) · Hikma Pharmaceuticals (U.K.) · MS Pharma (Jordan) |
|
Market Opportunities |
· Rising adoption of hyaluronic acid injections in early-stage osteoarthritis patients · Expansion of private orthopedic chains and specialty clinics · Increasing clinical preference for single-injection and high–molecular weight formulations |
|
Value Added Data Infosets |
In addition to the insights on market scenarios such as market value, growth rate, segmentation, geographical coverage, and major players, the market reports curated by the Data Bridge Market Research also include in-depth expert analysis, patient epidemiology, pipeline analysis, pricing analysis, and regulatory framework. |
Middle East and Africa Viscosupplementation Market Trends
Trend: Rising Preference for Minimally Invasive Osteoarthritis Treatment
Patients and physicians across Middle East and Africa are increasingly shifting toward hyaluronic acid based viscosupplementation as a non-surgical option for knee osteoarthritis management, driven by faster recovery, reduced procedural risk, and lower hospitalization requirements compared to surgical alternatives. This shift is also supported by growing patient awareness of early intervention therapies that help delay or avoid knee replacement procedures. Healthcare providers are increasingly standardizing injection-based protocols in orthopedic care pathways, particularly in urban hospitals and specialty clinics. For instance, Saudi Arabia’s expanding orthopedic centers are increasingly integrating single injection viscosupplementation into routine osteoarthritis management, while South Africa’s private hospital networks are adopting structured non-surgical knee pain treatment programs to improve patient outcomes.
Middle East and Africa Viscosupplementation Market Dynamics
Key Market Driver: Rising Osteoarthritis Burden and Aging Population
The increasing prevalence of osteoarthritis, combined with a steadily growing elderly population across Middle East and Africa, is significantly driving demand for viscosupplementation therapies as a preferred joint preservation and pain management solution. Additional contributing factors include rising obesity rates, sedentary lifestyles, and a higher incidence of sports related knee injuries, all of which are accelerating cartilage degeneration cases requiring clinical intervention. As healthcare systems place greater emphasis on mobility preservation and quality of life improvement, viscosupplementation is gaining acceptance as an early line treatment before surgical procedures. For instance, hospitals in United Arab Emirates are increasingly reporting higher patient volumes for hyaluronic acid-based knee injections, especially among middle aged populations seeking non-invasive alternatives to surgery.
Key Restraint/Challenge: High Treatment Cost and Limited Reimbursement Coverage
A key challenge in the Middle East and Africa viscosupplementation market is the relatively high cost of hyaluronic acid injection therapies, particularly imported branded formulations, combined with inconsistent insurance reimbursement policies across the region. In many countries, patients are required to bear a significant portion of treatment expenses out of pocket, which limits adoption in public healthcare systems and rural medical facilities. In addition, lack of standardized reimbursement frameworks and limited awareness among general practitioners further slows widespread integration into primary care pathways. For instance, South Africa’s public healthcare sector demonstrates lower adoption rates compared to private hospitals, primarily due to budget constraints and limited insurance coverage for elective osteoarthritis injection therapies.
Key Market Opportunity: Expansion of Advanced Orthopedic Care Infrastructure
The ongoing expansion of specialized orthopedic hospitals, ambulatory surgical centers, and musculoskeletal care units across Middle East and Africa presents a strong growth opportunity for viscosupplementation adoption. Increasing healthcare investments, particularly in Gulf countries, are improving access to advanced joint preservation therapies and supporting the introduction of premium hyaluronic acid formulations. In addition, rising medical tourism activity in the region is encouraging hospitals to offer internationally standardized orthopedic treatment options. For instance, Saudi Arabia’s healthcare modernization initiatives under long term national development programs are significantly expanding access to advanced knee osteoarthritis treatment solutions in both public and private hospital networks.
Middle East and Africa Viscosupplementation Market Scope
The Middle East and Africa viscosupplementation market is segmented on the basis of source, age group, injection type, molecular weight, end user, and distribution channel.
- By Source
On the basis of source, the Middle East and Africa viscosupplementation market is segmented into animal origin and non-animal origin products. The Non-Animal Origin segment dominated the market with a 62.4% share in 2025, owing to higher biocompatibility, lower risk of allergic reactions, and increasing regulatory preference for biofermentation-derived hyaluronic acid products. These formulations are widely accepted in urban hospitals and orthopedic clinics due to improved safety profiles and consistent product quality. Growing patient awareness regarding safety and ethical concerns related to animal-derived components is further strengthening demand. Pharmaceutical companies are increasingly focusing on non-animal sourced innovations to meet import standards in Gulf countries. The segment also benefits from strong availability of premium branded injectable products in Saudi Arabia and United Arab Emirates. Continuous clinical adoption in knee osteoarthritis treatment is reinforcing its dominance across the region.
The Animal Origin segment is expected to witness the fastest growth at a CAGR of 5.9% from 2026 to 2033, driven by its comparatively lower cost and availability in cost-sensitive healthcare markets. These products are still widely used in public hospitals across developing African nations where affordability remains a key purchasing factor. Increasing demand for budget-friendly osteoarthritis treatments is supporting gradual uptake. Improvements in purification and extraction technologies are enhancing safety and acceptance levels. Local distribution networks in countries such as South Africa are expanding access to these formulations. Rising healthcare burden and limited reimbursement coverage are also contributing to sustained growth in this segment.
- By Age Group
On the basis of age group, the market is segmented into geriatric and adults. The Geriatric segment dominated the market with a 67.8% share in 2025, driven by the high prevalence of osteoarthritis among elderly populations across Middle East and Africa. Age-related cartilage degeneration and reduced joint mobility significantly increase demand for viscosupplementation therapies. Hospitals and orthopedic clinics prioritize elderly patients for hyaluronic acid injections as a non-surgical pain management solution. Rising life expectancy in countries such as Saudi Arabia and South Africa is further expanding this patient base. Increasing focus on improving quality of life and mobility in aging populations is strengthening demand. Regular follow-up treatment cycles also contribute to sustained revenue generation in this segment.
The Adults segment is expected to witness the fastest growth at a CAGR of 6.7% from 2026 to 2033, driven by rising cases of sports injuries, obesity-related joint disorders, and early-onset osteoarthritis. Younger patients are increasingly opting for minimally invasive treatments to avoid long-term joint damage. Growing participation in sports and physically demanding occupations is contributing to higher injury rates. Awareness campaigns promoting early intervention therapies are also supporting adoption. Private healthcare facilities in urban centers are increasingly targeting this demographic. Expanding access to orthopedic care is further accelerating segment growth.
- By Injection
On the basis of injection type, the market is segmented into single injection, three injections, and five injections. The Three Injections segment dominated the market with a 48.1% share in 2025, due to its established clinical efficacy, widespread physician preference, and balanced treatment cost-effectiveness. It is commonly used as a standard regimen in hospital-based osteoarthritis treatment protocols. Many orthopedic specialists prefer multi-dose therapy for moderate to severe knee osteoarthritis cases. Strong clinical familiarity and historical usage patterns further support its dominance. Hospitals across Saudi Arabia and South Africa continue to rely on this regimen for structured treatment cycles. Its predictable outcomes and insurance coverage in certain systems also reinforce adoption.
The Single Injection segment is expected to witness the fastest growth at a CAGR of 7.1% from 2026 to 2033, driven by improved patient convenience, reduced clinic visits, and faster treatment completion. Patients increasingly prefer single-dose therapy due to lower procedural burden and faster recovery timelines. Advancements in high molecular weight formulations are improving efficacy and durability of results. Private hospitals in United Arab Emirates and Saudi Arabia are actively promoting single-injection solutions. Rising healthcare efficiency demands are encouraging shift toward simplified treatment protocols. Increasing awareness of minimally invasive therapies is further accelerating growth.
- By Molecular Weight
On the basis of molecular weight, the market is segmented into intermediate molecular weight, low molecular weight, and high molecular weight. The High Molecular Weight segment dominated the market with a 52.6% share in 2025, due to superior viscoelastic properties, longer intra-articular retention, and improved clinical outcomes in knee osteoarthritis treatment. These formulations provide extended pain relief and reduced injection frequency. Orthopedic specialists prefer them for moderate to severe cases requiring sustained therapeutic effect. Strong adoption in private hospitals and specialty clinics supports dominance. Availability of premium imported products in Gulf countries further strengthens market position. Clinical evidence supporting improved joint lubrication is reinforcing usage trends.
The Low Molecular Weight segment is expected to witness the fastest growth at a CAGR of 6.5% from 2026 to 2033, driven by lower cost and wider accessibility in emerging healthcare systems. These formulations are more commonly used in public healthcare facilities with budget constraints. Increasing demand for affordable osteoarthritis treatments is supporting uptake. Improvements in formulation efficiency are enhancing clinical acceptance. Expanding distribution in African markets is further driving growth. Rising awareness of early-stage treatment options is also contributing to demand expansion.
- By End User
On the basis of end user, the market is segmented into hospitals, orthopedic clinics, ambulatory care centers, and others. The Hospitals segment dominated the market with a 55.3% share in 2025, owing to high patient inflow, availability of advanced orthopedic infrastructure, and strong physician specialization. Hospitals serve as the primary treatment center for moderate to severe osteoarthritis cases requiring injection-based therapy. Integration of diagnostic and treatment services enhances patient convenience and adoption rates. Government and private hospital networks across Saudi Arabia and South Africa drive significant demand. Availability of reimbursement and insurance support in hospital settings further strengthens dominance.
The Orthopedic Clinics segment is expected to witness the fastest growth at a CAGR of 7.0% from 2026 to 2033, driven by increasing preference for specialized musculoskeletal care centers. These clinics offer focused treatment pathways for joint disorders, improving patient outcomes. Rising number of private orthopedic practices in urban centers is expanding accessibility. Faster appointment cycles and personalized care models are attracting patients. Growth in sports injury cases is further boosting demand. Increasing investment in outpatient orthopedic services is supporting rapid expansion.
- By Distribution Channel
On the basis of distribution channel, the market is segmented into direct tender and retail sales. The Direct Tender segment dominated the market with a 58.9% share in 2025, driven by large-scale procurement by hospitals, government healthcare systems, and institutional buyers. Bulk purchasing contracts ensure cost efficiency and consistent product supply. Strong presence of public healthcare procurement systems in Saudi Arabia and South Africa supports dominance. Direct agreements with manufacturers reduce distribution complexity and improve pricing stability. Hospitals prefer tenders for long-term supply assurance of injectable therapies.
The Retail Sales segment is expected to witness the fastest growth at a CAGR of 6.8% from 2026 to 2033, driven by expanding private pharmacy networks and increasing outpatient treatment demand. Patients in urban areas are increasingly accessing viscosupplementation through specialty pharmacies. Growing private healthcare expenditure is supporting retail channel expansion. Improved availability of branded injectable products is enhancing accessibility. Rising awareness of joint health therapies is driving self-initiated treatment pathways. Expansion of pharmacy chains in Gulf and African countries is further accelerating growth.
Middle East and Africa Viscosupplementation Market Regional Analysis
Saudi Arabia dominated the Middle East and Africa viscosupplementation market with the largest revenue share of 32.6% in 2025, supported by advanced orthopedic care infrastructure, high healthcare spending, and growing adoption of hyaluronic acid injections. The country benefits from a well-established network of specialty orthopedic clinics and private hospitals, along with increasing awareness of minimally invasive joint pain treatments. Growing prevalence of osteoarthritis driven by aging population and obesity is further strengthening demand. Rising adoption of imported premium viscosupplementation products and continuous expansion of hospital-based orthopedic services continue to reinforce Saudi Arabia’s leadership position in the regional market.
The Saudi Arabia Viscosupplementation Market Insight
The Saudi Arabia viscosupplementation market is witnessing steady growth due to rising prevalence of osteoarthritis, increasing geriatric population, and strong adoption of hyaluronic acid based injection therapies in orthopedic care. The country’s well-developed private healthcare infrastructure, along with expanding specialty orthopedic clinics and hospitals, is driving demand for minimally invasive joint pain treatments. In addition, high healthcare spending and increasing awareness of non-surgical alternatives to knee replacement procedures are supporting market expansion. Growing availability of imported premium viscosupplementation products and continuous improvement in musculoskeletal care services are further strengthening Saudi Arabia’s position as the leading market in the Middle East and Africa region.
United Arab Emirates Viscosupplementation Market Insight
The United Arab Emirates viscosupplementation market is expanding due to strong healthcare infrastructure, rising medical tourism, and increasing adoption of advanced orthopedic treatments in private hospitals. High prevalence of lifestyle-related joint disorders and growing awareness of minimally invasive therapies are driving demand for hyaluronic acid injections. The country’s well-established insurance system in the private sector is improving patient access to treatment. In addition, the presence of internationally accredited hospitals and orthopedic specialists is supporting rapid adoption of premium viscosupplementation products. Continuous healthcare modernization initiatives are further strengthening market growth.
South Africa Viscosupplementation Market Insight
The South Africa viscosupplementation market is growing steadily due to rising osteoarthritis burden, increasing obesity rates, and expanding private healthcare penetration. The country has a dual healthcare system, where private hospitals are driving higher adoption of hyaluronic acid injection therapies compared to public facilities. Growing awareness of non-surgical knee pain management and increasing sports-related injuries are supporting demand. However, affordability constraints in the public sector limit widespread adoption. Despite this, expanding orthopedic clinics and improved access to specialty care are contributing to market growth.
Kuwait Viscosupplementation Market Insight
The Kuwait viscosupplementation market is witnessing moderate growth driven by high healthcare spending and increasing prevalence of lifestyle-related joint disorders. The country’s strong hospital infrastructure and reliance on imported medical products support availability of advanced hyaluronic acid injections. Rising geriatric population and growing awareness of early osteoarthritis treatment are boosting demand. Private healthcare providers are increasingly offering minimally invasive orthopedic procedures. Continuous improvement in specialty care services is supporting gradual market expansion.
Middle East and Africa Viscosupplementation Market Share
The Middle East and Africa viscosupplementation industry is primarily led by well-established companies, including:
- Sanofi (France)
- Anika Therapeutics (U.S.)
- Fidia Farmaceutici S.p.A. (Italy)
- Bioventus Inc. (U.S.)
- Seikagaku Corporation (Japan)
- LG Chem (South Korea)
- Hyaltech Ltd. (U.K.)
- IBSA Institut Biochimique SA (Switzerland)
- Teva Pharmaceutical Industries Ltd. (Israel)
- Pharmaceutica Fidia (Italy)
- Zimmer Biomet (U.S.)
- Stryker (U.S.)
- Smith & Nephew (U.K.)
- Johnson & Johnson Services, Inc. (U.S.)
- Viatris Inc. (U.S.)
- Reddy’s Laboratories (India)
- Sun Pharmaceutical Industries Ltd. (India)
- Lupin Limited (India)
- Hikma Pharmaceuticals (U.K.)
- MS Pharma (Jordan)
Latest Developments in Middle East and Africa Viscosupplementation Market
- In March 2025, IBSA Group expanded its presence across the Middle East through continued collaboration with regional distributor Lunatus, strengthening access to hyaluronic acid–based viscosupplementation therapies used for osteoarthritis management in countries such as Saudi Arabia and the United Arab Emirates. The partnership supports wider availability of intra-articular injectable treatments across orthopedic clinics and hospitals, where demand for minimally invasive joint pain therapies is increasing due to rising geriatric population and osteoarthritis burden. IBSA’s osteoarticular portfolio, including hyaluronic acid injections, is widely used in conservative knee osteoarthritis treatment pathways across private healthcare systems in the GCC
- In August 2024, MS Pharma continued to strengthen its role as a leading pharmaceutical manufacturer and distributor across the Middle East and North Africa by expanding its injectable and specialty pharmaceutical portfolio through multiple licensing and supply agreements with global partners. The company plays a key role in regional commercialization and distribution of injectable therapies across GCC and North African markets, supporting hospital procurement systems and specialty care providers
- In March 2023, Sanofi continued global commercialization and supply of its Synvisc and Synvisc-One hyaluronic acid injection portfolio, which is widely used in osteoarthritis treatment and distributed across international markets including the Middle East and Africa through authorized healthcare partners. Synvisc-One, a single-injection viscosupplementation therapy, is widely adopted in orthopedic care for knee osteoarthritis due to improved patient compliance and reduced treatment visits
- In October 2022, Fidia Farmaceutici continued strengthening its international presence for Hyalgan, a hyaluronic acid–based viscosupplementation product used in the treatment of knee osteoarthritis, through expanded distribution agreements across global and emerging healthcare markets, including regions in the Middle East and Africa. Hyalgan remains widely used in multi-injection treatment regimens for osteoarthritis management in orthopedic clinics. The company’s focus on expanding licensing and distribution partnerships supports broader access to viscosupplementation therapies in hospital and specialty care settings
- In June 2021, Bioventus continued expansion of its DUROLANE single-injection hyaluronic acid product through international commercialization channels and distribution partnerships, supporting its availability in multiple global markets including the Middle East and Africa. DUROLANE is widely used in osteoarthritis management for knee and hip joints due to its single-dose administration and long-lasting pain relief benefits
SKU-

- Interactive Data Analysis Dashboard
- Company Analysis Dashboard for high growth potential opportunities
- Research Analyst Access for customization & queries
- Competitor Analysis with Interactive dashboard
- Latest News, Updates & Trend analysis
- Harness the Power of Benchmark Analysis for Comprehensive Competitor Tracking
Data collection and base year analysis are done using data collection modules with large sample sizes. The stage includes obtaining market information or related data through various sources and strategies. It includes examining and planning all the data acquired from the past in advance. It likewise envelops the examination of information inconsistencies seen across different information sources. The market data is analysed and estimated using market statistical and coherent models. Also, market share analysis and key trend analysis are the major success factors in the market report. To know more, please request an analyst call or drop down your inquiry.
The key research methodology used by DBMR research team is data triangulation which involves data mining, analysis of the impact of data variables on the market and primary (industry expert) validation. Data models include Vendor Positioning Grid, Market Time Line Analysis, Market Overview and Guide, Company Positioning Grid, Patent Analysis, Pricing Analysis, Company Market Share Analysis, Standards of Measurement, Global versus Regional and Vendor Share Analysis. To know more about the research methodology, drop in an inquiry to speak to our industry experts.
Data Bridge Market Research is a leader in advanced formative research. We take pride in servicing our existing and new customers with data and analysis that match and suits their goal. The report can be customized to include price trend analysis of target brands understanding the market for additional countries (ask for the list of countries), clinical trial results data, literature review, refurbished market and product base analysis. Market analysis of target competitors can be analyzed from technology-based analysis to market portfolio strategies. We can add as many competitors that you require data about in the format and data style you are looking for. Our team of analysts can also provide you data in crude raw excel files pivot tables (Fact book) or can assist you in creating presentations from the data sets available in the report.


