
North America Employer Of Record Eor Market
Market Size in USD Billion
CAGR :
% 
 USD
2.26 Billion
USD
3.76 Billion
2025
2033
USD
2.26 Billion
USD
3.76 Billion
2025
2033
| 2026 –2033 | |
| USD 2.26 Billion | |
| USD 3.76 Billion | |
| % | |
|
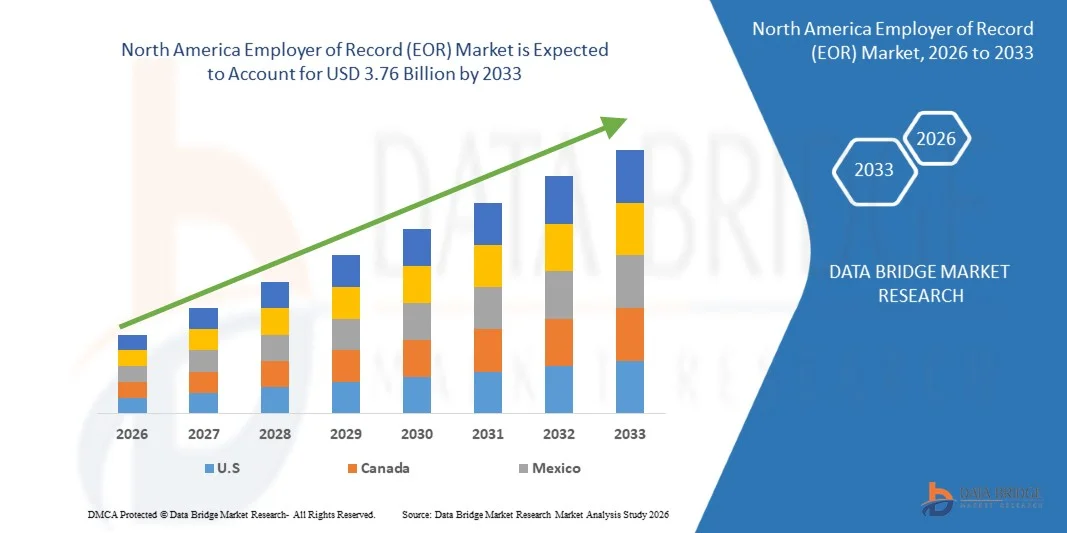
North America Employer of Record (EOR) Market Size
- The North America Employer of Record (EOR) Market is expected to reach USD 3.76 Billion by 2033 from USD 2.26 Billion in 2025, growing with a substantial CAGR of 3% in the forecast period of 2026 to 2033
- The North America Employer of Record (EOR) Market encompasses a broad portfolio of employment, compliance, payroll, tax administration, and workforce management solutions that enable organizations to hire and manage employees in foreign jurisdictions without establishing a local legal entity. In this model, the EOR provider becomes the legal employer on behalf of the client company, assuming responsibility for statutory employment obligations while the client retains control over day-to-day work activities and performance management.
- Employer of record services play a critical role in facilitating international expansion, North America talent acquisition, remote workforce enablement, and cross-border mobility. These services include locally compliant employment contract management, multi-country payroll processing, tax withholding and remittance, social security contributions, employee benefits administration, workers’ compensation coverage, professional liability insurance, and statutory reporting. In addition, EOR solutions often provide onboarding and offboarding management, visa and work permit support, labor law compliance monitoring, risk mitigation, and local HR advisory services to ensure seamless workforce operations.
North America Employer of Record (EOR) Market Analysis
- The North America Employer of Record (EOR) Market is witnessing strong and sustained growth, driven by accelerating, increasing cross-border workforce mobility, the widespread adoption of remote and hybrid work models, and growing regulatory complexity across international labor markets. Organizations are increasingly leveraging EOR solutions to legally hire, manage, and compensate employees in multiple jurisdictions without the cost, administrative burden, and legal risks associated with establishing local subsidiaries or legal entities.
- The expansion of multinational corporations, North America startups, digital enterprises, and project-based organizations has significantly increased demand for compliant employment and workforce administration services. EOR providers enable companies to adhere to country-specific labor laws, tax regulations, social security contributions, statutory benefits requirements, and employment standards while ensuring seamless payroll processing, compliant employment contracts, insurance coverage, and regulatory reporting. Key adopting industries include information technology, professional and business services, life sciences, healthcare, financial services, manufacturing, logistics, retail, and digital platforms due to their geographically distributed workforce structures.
- The U.S. leads the North America Employer of Record (EOR) Market, accounting for a significant share of 70.41% in 2025, driven by high adoption of remote workforce models, strong presence of multinational corporations, mature HR technology infrastructure, and heightened regulatory awareness. The region’s advanced compliance frameworks and growing demand for flexible North America hiring solutions further strengthen its market leadership.
- The Mexico represents the fastest-growing region in the North America EOR market, registering robust with the CAGR growth of 8.0%, supported by expanding multinational investments, increasing startup activity, rapid digital transformation, and a growing demand for compliant cross-border employment solutions. Favorable business environments, evolving labor regulations, and rising adoption of technology-enabled workforce management platforms contribute to the region’s accelerated market expansion.
- The payroll management segment dominated the largest market revenue share of 29.25% in 2025, driven by the growing need for accurate salary processing, tax compliance, and employee compensation management across organizations.
Report Scope and North America Employer of Record (EOR) Market Segmentation
|
Attributes |
Employer of Record (AOR) Key Market Insights |
|
Segments Covered |
· By Service Type: Payroll Management, Tax & Compliance Management, Risk & Liability Management, Human Resource (HR) Management, Employee Benefits Administration, Advanced & Value-Added Services and Others. · By Enterprise Size: Small and Medium Enterprises (SMES) and Large Enterprises. · By Deployment Model: Cloud-Based, On-Premises and Hybrid Deployment. · By Employment Type: Full-Time Employees, Independent Contractors, Fixed-Term / Contract Employees, Part-Time Employees and Project-Based / Temporary Workforce. · By Application: North America Hiring, Compliance & Risk Management, Payroll Outsourcing, Contractor Engagement, Seasonal & On-Demand Workforce Scaling, Insurance & Tax Handling, Business Continuity & Risk Mitigation, Mergers & Acquisitions Workforce Integration and Others. · By Pricing Model: Per-Employee-Per-Month (PEPM), Percentage of Payroll, Flat Fee / Subscription-Based and Custom / Enterprise Pricing · By End User: Banking, Financial Services & Insurance (BFSI), IT & Telecommunications, Manufacturing, Healthcare, Retail & E-Commerce, Government & Public Sector, Logistics & Supply-Chain Services, Energy, Utilities & Renewables, Oil & Gas, Education, Construction & Infrastructure and Others. · By Type: International EOR and Domestic EOR |
|
Countries Covered |
North America · U.S. · Canada · Mexico |
|
Key Market Players |
• Papaya Global (U.S.) • Oyster HR, Inc. (U.S.) • Safeguard Global • Remote Technology, Inc. (U.S.) • Deel Inc. (U.S.) • Globalization Partners LLC (U.S.) • Pebl (Velocity Global, LLC) (U.S.) • Sky Executive (China) • Agile HRO (Singapore) • Rippling (U.S.) • Multiplier (U.S.) • Skuad (Singapore) • RemoFirst, Inc. (U.S.) • RANDSTAD N.V. (Netherlands) • Aquent (U.S.) • INFOTREE GLOBAL (U.S.) • FOXHIRE (U.S.) • Aniday (Singapore) • Borderless AI (Canada) • Native Teams Limited (Macedonia) • GoGlobal (Japan) • 3C Global Group (Ireland) • INS Global (Singapore) • Atlas Technology Solutions, Inc. (U.S.) • SAFEGUARD GLOBAL (U.S.) • Briars Group (U.K.) • Express Global Employment (part of ACUMEN INTERNATIONAL) (U.K.) • UNIVERSAL HIRES (Germany) • LINKS INTERNATIONAL (Hong Kong) • Remote People (formally New Horizons Global Partners) (U.S.) · Procoms (Canada) |
|
Market Opportunities |
· Rapid economic growth in region · Growing focus on ethical labor practices and ESG reporting · Integration with HR Tech Platforms |
|
Value Added Data Infosets |
In addition to the insights on market scenarios such as market value, growth rate, segmentation, geographical coverage, and major players, the market reports curated by the Data Bridge Market Research also include import export analysis, production capacity overview, production consumption analysis and price trend analysis. |
North America Employer of Record (EOR) Market Trends
“North America Workforce Expansion Boosts Demand for EOR”
- In today’s interconnected economy, North America workforce expansion has become a strategic priority for organizations seeking access to specialized talent, new customer markets, and operational cost efficiencies. However, hiring employees across multiple jurisdictions introduces complex and constantly evolving employment regulations, tax frameworks, social security systems, and statutory benefit requirements. According to recent North America workforce and compliance industry surveys, a significant majority of executives report that managing cross-border employment compliance has become more challenging over the past few years. Multinational companies must continuously monitor labor law updates, worker classification standards, payroll regulations, and permanent establishment risks. This growing complexity creates operational strain, increases administrative costs, and exposes organizations to potential penalties, reputational risks, or restrictions on doing business in foreign markets.
- As North America hiring accelerates, organizations increasingly turn to Employer of Record (EOR) providers to simplify international workforce management. EORs act as the legal employer on behalf of client companies, managing employment contracts, payroll processing, tax withholding, social security contributions, statutory benefits, and regulatory reporting in each country of operation. By partnering with EOR providers, businesses can expand into new markets quickly without establishing a local legal entity, while ensuring full compliance with country-specific employment laws. This model significantly reduces legal exposure, administrative burden, and time-to-market, particularly for startups, SMEs, and fast-scaling multinational enterprises.
For instance,
- n 2025, a North America workforce compliance survey reported that a large majority of multinational executives identified cross-border employment regulations as significantly more complex compared to previous years, particularly in areas such as worker classification, payroll compliance, and tax transparency. In response, several mid-sized technology and consulting firms accelerated adoption of Employer of Record solutions to ensure compliant hiring across Europe, North America, and Asia-Pacific without expanding in-house legal teams.
- In June 2024, a North America business complexity assessment highlighted that multinational companies operating across the European Union, the United States, and Asia must comply with diverse employment frameworks, reporting standards, and statutory benefit structures unique to each jurisdiction. For example, employment termination rules in France differ substantially from at-will employment standards in the United States, while social security contribution structures in Japan and Singapore follow entirely different models. To navigate these divergences efficiently, organizations increasingly engaged EOR providers to standardize and centralize cross-border workforce compliance management.
- In 2025, several fast-scaling digital startups expanding into Latin America and Southeast Asia reported delays in market entry due to entity registration timelines and local payroll setup requirements. To overcome these barriers, many adopted EOR partnerships to onboard employees within weeks instead of months. By leveraging EOR services, these companies avoided permanent establishment risks, ensured proper tax withholding, and maintained compliance with local labor regulations while continuing aggressive international growth strategies.
North America Employer of Record (EOR) Market Dynamics
Driver
“North America Workforce Expansion”
- The rapid expansion of remote work and North America distributed teams is fundamentally reshaping how companies hire, manage, and support employees across borders. As organizations increasingly build international workforces, they encounter heightened complexity related to local labor laws, payroll compliance, tax regulations, statutory benefits, and worker classification standards. Managing employees in multiple jurisdictions without local expertise creates operational and legal risks, thereby accelerating demand for Employer of Record (EOR) services that provide compliant employment infrastructure across countries.
- As HR functions evolve to accommodate remote-first and hybrid workforce models, EOR providers have become essential in managing employment contracts, payroll processing, benefits administration, and regulatory compliance for geographically dispersed teams. Organizations must coordinate employment policies, statutory contributions, tax withholding, and employee lifecycle management across various legal systems. EOR partners offer localized expertise integrated into a centralized North America hiring strategy, enabling businesses to scale internationally without establishing foreign subsidiaries. This transformation in workforce dynamics is a significant driver of growth in the EOR market.
For instance,
- In 2024, Spotify expanded its remote work program to allow employees to work from multiple countries under its “Work From Anywhere” model. As the company hired talent across Europe, North America, and Asia-Pacific, it faced varying employment laws, social security systems, and tax structures. To manage these cross-border employment obligations efficiently and mitigate compliance risks, North America organizations with similar remote models increasingly partner with EOR providers to ensure locally compliant contracts and payroll management.
- In 2025, Airbnb continued supporting its “Live and Work Anywhere” policy, enabling employees to work remotely from numerous countries each year. Such flexibility introduces complexities in tax residency rules, employment classification, and statutory benefits compliance. Companies adopting comparable policies often utilize Employer of Record solutions to handle country-specific payroll, benefits alignment, and regulatory reporting without requiring entity setup in every employee location.
- In June 2025, Deel announced enhancements to its North America workforce management platform, focusing on automation tools for multi-country payroll, compliance monitoring, and contractor-to-employee conversion services. The update responded to rising demand from small and mid-sized enterprises hiring internationally. This reflects a broader market trend where organizations managing distributed teams seek EOR partnerships to streamline onboarding, reduce misclassification risks, and maintain compliance across rapidly expanding North America operations.
Restraint/Challenge
“High Service Fees for Large Enterprises”
- The rapid expansion of North America workforce strategies and cross-border hiring has significantly increased demand for Employer of Record (EOR) services. However, while EOR solutions offer speed, compliance assurance, and operational flexibility, large enterprises often face comparatively high service fees due to workforce scale, customization requirements, and complex multi-country employment structures. As multinational corporations expand into numerous jurisdictions simultaneously, per-employee service charges, onboarding costs, payroll administration fees, and compliance management expenses can accumulate substantially. This cost structure may reduce margin efficiencies for enterprises managing thousands of international employees, making pricing a key consideration in long-term EOR adoption strategies.
- Large enterprises typically require tailored employment contracts, localized executive benefits packages, equity compensation alignment, immigration support, and integration with enterprise HRIS and payroll systems. These customization requirements increase administrative complexity for EOR providers, which is reflected in premium pricing models. Additionally, enterprises operating in highly regulated industries such as financial services, healthcare, and technology often require enhanced compliance oversight, audits, and risk mitigation frameworks, further elevating service costs. As a result, while EOR solutions reduce the need to establish foreign entities, cost sensitivity remains a restraint for large-scale deployments
For instance,
- In 2022, North America digital services trade reached approximately USD 3.82 trillion, according to international trade organizations, reflecting rapid cross-border digital expansion. Large technology enterprises expanding into multiple emerging markets often used EOR services to accelerate hiring; however, managing hundreds of employees across 10–20 countries through EOR arrangements significantly increased recurring service fees compared to establishing regional subsidiaries once scale was achieved.
- In 2024, multinational retail and e-commerce corporations expanding supply chain and digital operations across Southeast Asia and Eastern Europe increasingly relied on EOR providers to onboard local compliance, logistics, and marketing teams. While this enabled rapid market entry, enterprise-level workforce volumes led to substantial cumulative service costs, prompting some firms to adopt hybrid models — using EOR for initial entry before transitioning to owned legal entities in high-growth markets.
- From June to August 2024, several cross-border commerce surveys indicated that a majority of companies anticipated revenue growth through international expansion. Large enterprises responding to this growth outlook accelerated overseas hiring through EOR partnerships to reduce setup timelines. However, as headcount scaled into the hundreds per region, executives reported evaluating long-term cost optimization strategies, including entity establishment or regional payroll consolidation, due to higher per-employee EOR service fees.
North America Employer of Record (EOR) Market Scope
The North America Employer of Record (EOR) Market is segmented into eight notable segments based on the service type, type, enterprise size, deployment model, application, employment type, pricing model and end-use industry.
- By service type
Based on service type, the North America Employer of Record (EOR) Market is segmented into payroll management, tax & compliance management, risk & liability management, human resource (HR) management, employee benefits administration, advanced & value-added services, others. In 2026, the payroll management segment is projected to lead the market with a 29.14% share, driven by the rising complexity of multi-country payroll processing, increasing cross-border hiring activities, and the growing need for accurate salary disbursement, statutory deductions, and real-time reporting.
The risk & liability management segment is projected to be the fastest-growing segment with a CAGR of 8.1%, driven by heightened regulatory scrutiny, stricter worker classification enforcement, and increasing concerns regarding permanent establishment risks and employment misclassification penalties. Organizations are prioritizing proactive risk mitigation strategies, including compliance audits, contractor-to-employee transitions, and legal exposure management.
- By type
Based on type, the North America Employer of Record (EOR) Market is segmented into International EOR, Domestic EOR. In 2026 International EOR is expected to dominate the market with 60.65% market share and is growing with the highest CAGR of 7.7% in the forecast period of 2026 to 2033, due to the rapid expansion of cross-border hiring, increasing North Americaization of businesses, and the growing need to manage employees across multiple jurisdictions without establishing local entities. Organizations operating internationally face complex labor laws, tax regulations, permanent establishment risks, and statutory compliance requirements, which significantly drive demand for comprehensive International EOR solutions
- By enterprise size
On the basis of enterprise size, the market is segmented into small and medium enterprises (SMEs) and large enterprise. In 2026, the small and medium enterprises (SMEs) segment is anticipated to dominate with 59.71% market share and growing with the highest CAGR of 7.6% in the forecast period of 2026 to 2033, due to its ability to enable real-time payroll processing, automated compliance management, secure data handling, and scalable multi-country workforce administration. Cloud platforms enhance operational transparency, streamline cross-border employment workflows, and support efficient North America workforce management
- By deployment model
On the basis of deployment model, the market is segmented into cloud-based, on-premises and hybrid deployment. In 2026, the cloud-based segment is anticipated to dominate with 65.76% market share and growing with the highest CAGR of 7.6% in the forecast period of 2026 to 2033, due to its ability to enable real-time payroll processing, automated compliance management, secure data handling, and scalable multi-country workforce administration. Cloud platforms enhance operational transparency, streamline cross-border employment workflows, and support efficient North America workforce management.
- By application
On the basis of application, the market is segmented into global hiring, compliance & risk management, payroll outsourcing, contractor engagement, seasonal & on-demand workforce scaling, insurance & tax handling, business continuity & risk mitigation, mergers & acquisitions workforce integration and others. In 2026, the global hiring segment is anticipated to dominate with 23.53% market share and Compliance & Risk Management growing with the highest CAGR of 8.3% in the forecast period of 2026 to 2033, due to increasing cross-border hiring, rising adoption of distributed workforce models, and the need for compliant long-term employment solutions without establishing local entities.
- By employment type
On the basis of employment type, the market is segmented into full-time employees, independent contractors, fixed-term / contract employees, part-time employees, project-based / temporary workforce. In 2026 the full-time employees segment is anticipated to dominate with 51.68% market share and Independent Contractors growing with the highest CAGR of 8.2% in the forecast period of 2026 to 2033, due to increasing cross-border hiring, rising adoption of distributed workforce models, and the need for compliant long-term employment solutions without establishing local entities.
- By pricing model
On the basis of pricing model, the market is segmented into per-employee-per-month (PEPM), percentage of payroll, flat fee / subscription-based, custom / enterprise pricing. In 2026 the per-employee-per-month (PEPM) segment is anticipated to dominate with 47.68% market share and Custom / Enterprise Pricing is growing with the highest CAGR of 8.2% in the forecast period of 2026 to 2033, due to its scalability, broad geographic reach, increasing enterprise adoption of distributed work models, and strong alignment with organizations’ needs for compliant, flexible, and cost-efficient North America talent engagement without local entity establishment.
- By end user
On the basis of end user, the market is segmented into banking, financial services & insurance (BFSI), IT & telecommunications, manufacturing, healthcare, retail & e-commerce, government & public sector, logistics & supply-chain services, energy, utilities & renewables, oil & gas, education, construction & infrastructure and others. In 2026, the IT & Telecommunications segment is anticipated to dominate with 22.78% market share and Healthcare is growing with the highest CAGR of 9.0% in the forecast period of 2026 to 2033, due to rapid cross-border hiring, strong adoption of remote work models, and the need for compliant North America talent engagement across multiple jurisdictions without establishing local entities.
North America Employer of Record (EOR) Market Regional Analysis
- In 2026, the North America is expected to hold 39.35% of the North America Employer of Record (EOR) Market, driven by the strong presence of multinational corporations, rapid adoption of remote and hybrid workforce models, and increasing cross-border hiring activities across the United States and Canada.
- The market growth is further supported by widespread adoption of advanced HR technology platforms, automated payroll systems, and compliance management solutions, along with a well-defined regulatory framework governing employment standard, tax compliance, and worker classification.
U.S. North America Employer of Record (EOR) Market Insight
U.S. is expected to dominate the North America Employer of Record (EOR) Market in 2026, accounting for a market share of 70.46%. The North America Employer of Record (EOR) Market is primarily driven by the strong presence of multinational corporations, technology giants, financial institutions, and rapidly scaling startups that actively engage in cross-border hiring and North America workforce expansion. The region’s mature corporate ecosystem and increasing adoption of remote and hybrid work models significantly contribute to sustained demand for EOR services
Canada is the dominating country in North America Employer of Record (EOR) Market
The Canada is the dominant country in the North America Employer of Record (EOR) Market, supported by its highly mature corporate ecosystem, strong presence of multinational enterprises, advanced HR technology infrastructure, and widespread adoption of remote and distributed workforce models. The country hosts a significant number of leading EOR providers and HR technology companies, enabling streamlined cross-border hiring, payroll compliance, and workforce management solutions. Additionally, the increasing demand for North America talent acquisition, flexible employment structures, and regulatory compliance solutions continues to strengthen the U.S. position in the market.
North America Employer of Record (EOR) Market Share
The Employer of Record (EOR) industry is primarily led by well-established companies, including:
- Papaya North America (U.S.)
- Oyster HR, Inc. (U.S.)
- Safeguard North America
- Remote Technology, Inc. (U.S.)
- Deel Inc. (U.S.)
- North Americaization Partners LLC (U.S.)
- Pebl (Velocity North America, LLC) (U.S.)
- Sky Executive (China)
- Agile HRO (Singapore)
- Rippling (U.S.)
- Multiplier (U.S.)
- Skuad (Singapore)
- RemoFirst, Inc. (U.S.)
- RANDSTAD N.V. (Netherlands)
- Aquent (U.S.)
- INFOTREE NORTH AMERICA (U.S.)
- FOXHIRE (U.S.)
- Aniday (Singapore)
- Borderless AI (Canada)
- Native Teams Limited (Macedonia)
- GoNorth America (Japan)
- 3C North America Group (Ireland)
- INS North America (Singapore)
- Atlas Technology Solutions, Inc. (U.S.)
- SAFEGUARD NORTH AMERICA (U.S.)
- Briars Group (U.K.)
- Express North America Employment (part of ACUMEN INTERNATIONAL) (U.K.)
- UNIVERSAL HIRES (Germany)
- LINKS INTERNATIONAL (Hong Kong)
- Remote People (formally New Horizons North America Partners) (U.S.)
- Procoms (Canada)
Latest Developments in North America Employer of Record (EOR) Market
- In December 2025, Global Partners (G-P) has announced it is joining the Workday Agent Partner Network, expanding its ability to integrate AI-powered North America employment solutions directly with Workday’s Agent System of Record (ASOR). This collaboration benefits companies by simplifying North America workforce operations, reducing compliance risk, and enabling faster, more efficient international hiring within a single, connected HR system.
- In December 2025, Safeguard global was awarded Gold for Best Employer of record service provider at the HRM Asia Readers’ Choice Awards, underscoring the company’s excellence in North America workforce enablement and leadership in EOR services. The accolade highlights its strong technology platform, local expertise, and commitment to helping organizations hire and manage international workforces with compliance and efficiency. This recognition reinforces Safeguard global reputation as a trusted partner for compliant, efficient global hiring and workforce management.
- In September 2025, Rebrand and AI-First Platform Launch: Pebl officially rebranded from Velocity North America and introduced its AI-first North America hiring platform, designed to make hiring, paying, and managing talent around the world faster, more intuitive, and more compliant. The platform leverages AI to accelerate onboarding, compliance guidance, and international workforce administration. This shift marks a strategic evolution in North America EOR and workforce management technology.
- In December 2025, Deel hosted its 2025 AI Summit, bringing together industry leaders to discuss how AI is transforming hiring, payroll, and workforce management. The summit emphasized practical AI adoption across HR, compliance, and recruiting and showcased real-world strategies for integrating AI into North America operations. This event reinforced Deel’s thought leadership on the future of work and HR tech innovation.
SKU-
Get online access to the report on the World's First Market Intelligence Cloud

- Interactive Data Analysis Dashboard
- Company Analysis Dashboard for high growth potential opportunities
- Research Analyst Access for customization & queries
- Competitor Analysis with Interactive dashboard
- Latest News, Updates & Trend analysis
- Harness the Power of Benchmark Analysis for Comprehensive Competitor Tracking
Table of Content
1 INTRODUCTION
1.1 OBJECTIVES OF THE STUDY
1.2 MARKET DEFINITION
1.3 OVERVIEW OF NORTH AMERICA EMPLOYER OF RECORD (EOR) MARKET
1.4 CURRENCY AND PRICING
1.5 LIMITATIONS
1.6 MARKETS COVERED
2 MARKET SEGMENTATION
2.1 MARKETS COVERED
2.2 GEOGRAPHICAL SCOPE
2.3 YEARS CONSIDERED FOR THE STUDY
2.4 DBMR TRIPOD DATA VALIDATION MODEL
2.5 PRIMARY INTERVIEWS WITH KEY OPINION LEADERS
2.6 DBMR MARKET POSITION GRID
2.7 VENDOR SHARE ANALYSIS
2.8 MULTIVARIATE MODELING
2.9 SERVICE TYPE TIMELINE CURVE
2.1 MARKET END-USER COVERAGE GRID
2.11 SECONDARY SOURCES
2.12 ASSUMPTIONS
3 EXECUTIVE SUMMARY
4 PREMIUM INSIGHTS
4.1 PORTERS FIVE FORCES ANALYSIS
4.2 NEW BUSINESS AND EMERGING BUSINESS'S REVENUE OPPORTUNITIES & FUTURE OUTLOOK
4.2.1 EMERGING TRENDS
4.2.2 FUTURE OUTLOOK
4.3 PATENT ANALYSIS
4.4 PENETRATION AND GROWTH POSPECT MAPPING
4.4.1 REGIONAL PENETRATION
4.4.2 GROWTH DRIVERS
4.4.3 FUTURE PROSPECTS
4.5 VALUE CHAIN ANALYSIS
4.5.1 UPSTREAM LAYER — MARKET ENABLEMENT & WORKFORCE SOURCING
4.5.2 LEGAL INFRASTRUCTURE LAYER — CORE EOR VALUE CREATION
4.5.3 PAYROLL & FINANCIAL OPERATIONS LAYER — TRANSACTION PROCESSING ENGINE
4.5.4 PLATFORM & SAAS LAYER — OPERATIONAL CONTROL INTERFACE
4.5.5 ONGOING COMPLIANCE & RISK MANAGEMENT LAYER — RETENTION DRIVER
4.5.6 DOWNSTREAM EXPANSION LAYER — REVENUE EXPANSION
4.5.7 INTEGRATED VALUE CHAIN STRUCTURE
4.5.8 STRATEGIC IMPLICATIONS
4.5.9 CONCLUSION
4.6 COMPANY EVALUATION QUADRANT, TECHNOLOGY MATRIX, COMPANY COMPARATIVE ANALYSIS, & COMPANY SERVICE PLATFORM MATRIX
4.7 TECHNOLOGY MATRIX
4.8 COMPANY COMPARATIVE ANALYSIS
4.8.1 COMPANY SERVICE PLATFORM MATRIX
5 TARIFFS & ITS ANALYSIS
5.1 OVERVIEW OF RELEVANT TARIFFS
5.2 TRADE POLICIES INFLUENCING THE MARKET
5.3 COST IMPACT ON STAKEHOLDERS
5.3.1 IMPACT ON CLIENT BUSINESSES
5.3.2 IMPACT ON EOR PROVIDERS
5.3.3 IMPACT ON EMPLOYEES
5.4 IMPACT ON SUPPLY CHAIN
5.5 STRATEGIC RESPONSE BY EOR PROVIDERS
5.5.1 GEOGRAPHIC DIVERSIFICATION
5.5.2 COMPLIANCE STRENGTHENING
5.5.3 FLEXIBLE PRICING MODELS
5.5.4 STRATEGIC ADVISORY ROLE
5.6 CONCLUSION
6 REGULATION COVERAGE
6.1 INTRODUCTION
6.2 EMPLOYMENT LAW & WORKER PROTECTION REGULATIONS
6.3 TAXATION AND PAYROLL COMPLIANCE
6.4 SOCIAL SECURITY AND STATUTORY BENEFITS
6.5 WORKER CLASSIFICATION REGULATIONS
6.6 IMMIGRATION AND RIGHT-TO-WORK COMPLIANCE
6.7 DATA PROTECTION AND EMPLOYEE PRIVACY
6.8 TERMINATION AND OFFBOARDING REGULATIONS
6.9 CONCLUSION
7 MARKET OVERVIEW
7.1 DRIVERS
7.1.1 NORTH AMERICA WORKFORCE EXPANSION
7.1.2 COMPLEX LABOR LAW COMPLIANCE REQUIREMENTS
7.1.3 REMOTE & HYBRID WORK ADOPTION
7.1.4 GROWING STARTUPS AND SMES WORLDWIDE
7.2 RESTRAINTS
7.2.1 HIGH SERVICE FEES FOR LARGE ENTERPRISES
7.2.2 LIMITED CONTROL OVER HR PROCESSES
7.3 OPPORTUNITIES
7.3.1 RAPID ECONOMIC GROWTH IN REGIONS SUCH AS SOUTHEAST ASIA, LATIN AMERICA, AND AFRICA
7.3.2 GROWING FOCUS ON ETHICAL LABOR PRACTICES AND ESG REPORTING
7.3.3 INTEGRATION WITH HR TECH PLATFORMS
7.4 CHALLENGES
7.4.1 RAPIDLY CHANGING NORTH AMERICA REGULATIONS
7.4.2 DATA PRIVACY & SECURITY CONCERNS
8 NORTH AMERICA EMPLOYER OF RECORD (EOR) MARKET, BY SERVICE TYPE
8.1 OVERVIEW
8.2 PAYROLL MANAGEMENT
8.3 TAX & COMPLIANCE MANAGEMENT
8.4 RISK & LIABILITY MANAGEMENT
8.5 HUMAN RESOURCE (HR) MANAGEMENT
8.6 EMPLOYEE BENEFITS ADMINISTRATION
8.7 ADVANCED & VALUE-ADDED SERVICES
8.8 OTHERS
8.9 NORTH AMERICA PAYROLL MANAGEMENT IN EMPLOYER OF RECORD (EOR) MARKET, BY REGION, 2018-2033 (USD THOUSAND)
8.9.1 NORTH AMERICA
8.9.2 EUROPE
8.9.3 ASIA-PACIFIC
8.9.4 SOUTH AMERICA
8.9.5 MIDDLE EAST AND AFRICA
8.1 NORTH AMERICA TAX & COMPLIANCE MANAGEMENT IN EMPLOYER OF RECORD (EOR) MARKET, BY REGION, 2018-2033 (USD THOUSAND)
8.10.1 NORTH AMERICA
8.10.2 EUROPE
8.10.3 ASIA-PACIFIC
8.10.4 SOUTH AMERICA
8.10.5 MIDDLE EAST AND AFRICA
8.11 NORTH AMERICA RISK & LIABILITY MANAGEMENT IN EMPLOYER OF RECORD (EOR) MARKET, BY REGION, 2018-2033 (USD THOUSAND)
8.11.1 NORTH AMERICA
8.11.2 EUROPE
8.11.3 ASIA-PACIFIC
8.11.4 SOUTH AMERICA
8.11.5 MIDDLE EAST AND AFRICA
8.12 NORTH AMERICA HUMAN RESOURCE (HR) MANAGEMENT IN EMPLOYER OF RECORD (EOR) MARKET, BY REGION, 2018-2033 (USD THOUSAND)
8.12.1 NORTH AMERICA
8.12.2 EUROPE
8.12.3 ASIA-PACIFIC
8.12.4 SOUTH AMERICA
8.12.5 MIDDLE EAST AND AFRICA
8.13 NORTH AMERICA EMPLOYEE BENEFITS ADMINISTRATION IN EMPLOYER OF RECORD (EOR) MARKET, BY REGION, 2018-2033 (USD THOUSAND)
8.13.1 NORTH AMERICA
8.13.2 EUROPE
8.13.3 ASIA-PACIFIC
8.13.4 SOUTH AMERICA
8.13.5 MIDDLE EAST AND AFRICA
8.14 NORTH AMERICA ADVANCED & VALUE-ADDED SERVICES IN EMPLOYER OF RECORD (EOR) MARKET, BY TYPE, 2018-2033 (USD THOUSAND)
8.14.1 EMPLOYEE ONBOARDING & OFFBOARDING SERVICES
8.14.2 IMMIGRATION & WORK PERMIT MANAGEMENT
8.14.3 EXPENSE & REIMBURSEMENT MANAGEMENT
8.14.4 OTHERS
8.15 NORTH AMERICA ADVANCED & VALUE-ADDED SERVICES IN EMPLOYER OF RECORD (EOR) MARKET, BY REGION, 2018-2033 (USD THOUSAND)
8.15.1 NORTH AMERICA
8.15.2 EUROPE
8.15.3 ASIA-PACIFIC
8.15.4 SOUTH AMERICA
8.15.5 MIDDLE EAST AND AFRICA
8.16 NORTH AMERICA OTHERS IN EMPLOYER OF RECORD (EOR) MARKET, BY REGION, 2018-2033 (USD THOUSAND)
8.16.1 NORTH AMERICA
8.16.2 EUROPE
8.16.3 ASIA-PACIFIC
8.16.4 SOUTH AMERICA
8.16.5 MIDDLE EAST AND AFRICA
9 NORTH AMERICA EMPLOYER OF RECORD (EOR) MARKET, BY TYPE
9.1 OVERVIEW
9.2 INTERNATIONAL EOR
9.3 DOMESTIC EOR
9.4 NORTH AMERICA INTERNATIONAL E0R IN EMPLOYER OF RECORD (EOR) MARKET, BY TYPE, 2018-2033 (USD THOUSAND)
9.4.1 MULTI-COUNTRY EMPLOYMENT COVERAGE
9.4.2 CROSS-BORDER PAYROLL COORDINATION
9.4.3 NORTH AMERICA COMPLIANCE RISK MANAGEMENT
9.4.4 IMMIGRATION & WORK PERMIT ASSISTANCE
9.4.5 NORTH AMERICA MOBILITY & RELOCATION SUPPORT
9.5 NORTH AMERICA INTERNATIONAL EOR IN EMPLOYER OF RECORD (EOR) MARKET, BY REGION, 2018-2033 (USD THOUSAND)
9.5.1 NORTH AMERICA
9.5.2 EUROPE
9.5.3 ASIA-PACIFIC
9.5.4 SOUTH AMERICA
9.5.5 MIDDLE EAST AND AFRICA
9.6 NORTH AMERICA DOMESTIC E0R IN EMPLOYER OF RECORD (EOR) MARKET, BY TYPE, 2018-2033 (USD THOUSAND)
9.6.1 SINGLE-COUNTRY PAYROLL & COMPLIANCE
9.6.2 IN-COUNTRY LEGAL ENTITY SUBSTITUTE
9.6.3 LOCAL WORKFORCE EXPANSION SUPPORT
9.6.4 REGION-SPECIFIC HR SUPPORT
9.7 NORTH AMERICA DOMESTIC E0R IN EMPLOYER OF RECORD (EOR) MARKET, BY REGION, 2018-2033 (USD THOUSAND)
9.7.1 NORTH AMERICA
9.7.2 EUROPE
9.7.3 ASIA-PACIFIC
9.7.4 SOUTH AMERICA
9.7.5 MIDDLE EAST AND AFRICA
10 NORTH AMERICA EMPLOYER OF RECORD (EOR) MARKET, BY ENTERPRISE SIZE
10.1 OVERVIEW
10.2 SMALL AND MEDIUM ENTERPRISES (SMES)
10.3 LARGE ENTERPRISES
10.4 NORTH AMERICA SMALL AND MEDIUM ENTERPRISES (SMES) IN EMPLOYER OF RECORD (EOR) MARKET, BY REGION, 2018-2033 (USD THOUSAND)
10.4.1 NORTH AMERICA
10.4.2 EUROPE
10.4.3 ASIA-PACIFIC
10.4.4 SOUTH AMERICA
10.4.5 MIDDLE EAST AND AFRICA
10.5 NORTH AMERICA LARGE ENTERPRISES IN EMPLOYER OF RECORD (EOR) MARKET, BY REGION, 2018-2033 (USD THOUSAND)
10.5.1 NORTH AMERICA
10.5.2 EUROPE
10.5.3 ASIA-PACIFIC
10.5.4 SOUTH AMERICA
10.5.5 MIDDLE EAST AND AFRICA
11 NORTH AMERICA EMPLOYER OF RECORD (EOR) MARKET, BY DEPLOYMENT MODEL
11.1 OVERVIEW
11.2 CLOUD-BASED
11.3 ON-PREMISES
11.4 HYBRID DEPLOYMENT
11.5 NORTH AMERICA CLOUD-BASED IN EMPLOYER OF RECORD (EOR) MARKET, BY REGION, 2018-2033 (USD THOUSAND)
11.5.1 NORTH AMERICA
11.5.2 EUROPE
11.5.3 ASIA-PACIFIC
11.5.4 SOUTH AMERICA
11.5.5 MIDDLE EAST AND AFRICA
11.6 NORTH AMERICA ON-PREMISES IN EMPLOYER OF RECORD (EOR) MARKET, BY REGION, 2018-2033 (USD THOUSAND)
11.6.1 NORTH AMERICA
11.6.2 EUROPE
11.6.3 ASIA-PACIFIC
11.6.4 SOUTH AMERICA
11.6.5 MIDDLE EAST AND AFRICA
11.7 NORTH AMERICA HYBRID DEPLOYMENT IN EMPLOYER OF RECORD (EOR) MARKET, BY REGION, 2018-2033 (USD THOUSAND)
11.7.1 NORTH AMERICA
11.7.2 EUROPE
11.7.3 ASIA-PACIFIC
11.7.4 SOUTH AMERICA
11.7.5 MIDDLE EAST AND AFRICA
12 NORTH AMERICA EMPLOYER OF RECORD (EOR) MARKET, BY APPLICATION
12.1 OVERVIEW
12.2 NORTH AMERICA HIRING
12.3 COMPLIANCE & RISK MANAGEMENT
12.4 PAYROLL OUTSOURCING
12.5 CONTRACTOR ENGAGEMENT
12.6 SEASONAL & ON-DEMAND WORKFORCE SCALING
12.7 INSURANCE & TAX HANDLING
12.8 BUSINESS CONTINUITY & RISK MITIGATION
12.9 MERGERS & ACQUISITIONS WORKFORCE INTEGRATION
12.1 OTHERS
12.11 NORTH AMERICA HIRING IN EMPLOYER OF RECORD (EOR) MARKET, BY REGION, 2018-2033 (USD THOUSAND)
12.11.1 NORTH AMERICA
12.11.2 EUROPE
12.11.3 ASIA-PACIFIC
12.11.4 SOUTH AMERICA
12.11.5 MIDDLE EAST AND AFRICA
12.12 NORTH AMERICA COMPLIANCE & RISK MANAGEMENT IN EMPLOYER OF RECORD (EOR) MARKET, BY REGION, 2018-2033 (USD THOUSAND)
12.12.1 NORTH AMERICA
12.12.2 EUROPE
12.12.3 ASIA-PACIFIC
12.12.4 SOUTH AMERICA
12.12.5 MIDDLE EAST AND AFRICA
12.13 NORTH AMERICA PAYROLL OUTSOURCING IN EMPLOYER OF RECORD (EOR) MARKET, BY REGION, 2018-2033 (USD THOUSAND)
12.13.1 NORTH AMERICA
12.13.2 EUROPE
12.13.3 ASIA-PACIFIC
12.13.4 SOUTH AMERICA
12.13.5 MIDDLE EAST AND AFRICA
12.14 NORTH AMERICA CONTRACTOR ENGAGEMENT IN EMPLOYER OF RECORD (EOR) MARKET, BY REGION, 2018-2033 (USD THOUSAND)
12.14.1 NORTH AMERICA
12.14.2 EUROPE
12.14.3 ASIA-PACIFIC
12.14.4 SOUTH AMERICA
12.14.5 MIDDLE EAST AND AFRICA
12.15 NORTH AMERICA SEASONAL & ON-DEMAND WORKFORCE SCALING IN EMPLOYER OF RECORD (EOR) MARKET, BY REGION, 2018-2033 (USD THOUSAND)
12.15.1 NORTH AMERICA
12.15.2 EUROPE
12.15.3 ASIA-PACIFIC
12.15.4 SOUTH AMERICA
12.15.5 MIDDLE EAST AND AFRICA
12.16 NORTH AMERICA INSURANCE & TAX HANDLING IN EMPLOYER OF RECORD (EOR) MARKET, BY REGION, 2018-2033 (USD THOUSAND)
12.16.1 NORTH AMERICA
12.16.2 EUROPE
12.16.3 ASIA-PACIFIC
12.16.4 SOUTH AMERICA
12.16.5 MIDDLE EAST AND AFRICA
12.17 NORTH AMERICA BUSINESS CONTINUITY & RISK MITIGATION IN EMPLOYER OF RECORD (EOR) MARKET, BY REGION, 2018-2033 (USD THOUSAND)
12.17.1 NORTH AMERICA
12.17.2 EUROPE
12.17.3 ASIA-PACIFIC
12.17.4 SOUTH AMERICA
12.17.5 MIDDLE EAST AND AFRICA
12.18 NORTH AMERICA MERGERS & ACQUISITIONS WORKFORCE INTEGRATION IN EMPLOYER OF RECORD (EOR) MARKET, BY REGION, 2018-2033 (USD THOUSAND)
12.18.1 NORTH AMERICA
12.18.2 EUROPE
12.18.3 ASIA-PACIFIC
12.18.4 SOUTH AMERICA
12.18.5 MIDDLE EAST AND AFRICA
12.19 NORTH AMERICA OTHERS IN EMPLOYER OF RECORD (EOR) MARKET, BY REGION, 2018-2033 (USD THOUSAND)
12.19.1 NORTH AMERICA
12.19.2 EUROPE
12.19.3 ASIA-PACIFIC
12.19.4 SOUTH AMERICA
12.19.5 MIDDLE EAST AND AFRICA
13 NORTH AMERICA EMPLOYER OF RECORD (EOR) MARKET, BY EMPLOYMENT TYPE
13.1 OVERVIEW
13.2 FULL-TIME EMPLOYEES
13.3 INDEPENDENT CONTRACTORS
13.4 FIXED-TERM / CONTRACT EMPLOYEES
13.5 PART-TIME EMPLOYEES
13.6 PROJECT-BASED / TEMPORARY WORKFORCE
13.7 NORTH AMERICA FULL-TIME EMPLOYEES IN EMPLOYER OF RECORD (EOR) MARKET, BY REGION, 2018-2033 (USD THOUSAND)
13.7.1 NORTH AMERICA
13.7.2 EUROPE
13.7.3 ASIA-PACIFIC
13.7.4 SOUTH AMERICA
13.7.5 MIDDLE EAST AND AFRICA
13.8 NORTH AMERICA INDEPENDENT CONTRACTORS IN EMPLOYER OF RECORD (EOR) MARKET, BY REGION, 2018-2033 (USD THOUSAND)
13.8.1 NORTH AMERICA
13.8.2 EUROPE
13.8.3 ASIA-PACIFIC
13.8.4 SOUTH AMERICA
13.8.5 MIDDLE EAST AND AFRICA
13.9 NORTH AMERICA FIXED-TERM / CONTRACT EMPLOYEES IN EMPLOYER OF RECORD (EOR) MARKET, BY REGION, 2018-2033 (USD THOUSAND)
13.9.1 NORTH AMERICA
13.9.2 EUROPE
13.9.3 ASIA-PACIFIC
13.9.4 SOUTH AMERICA
13.9.5 MIDDLE EAST AND AFRICA
13.1 NORTH AMERICA PART-TIME EMPLOYEES IN EMPLOYER OF RECORD (EOR) MARKET, BY REGION, 2018-2033 (USD THOUSAND)
13.10.1 NORTH AMERICA
13.10.2 EUROPE
13.10.3 ASIA-PACIFIC
13.10.4 SOUTH AMERICA
13.10.5 MIDDLE EAST AND AFRICA
13.11 NORTH AMERICA PROJECT-BASED / TEMPORARY WORKFORCE IN EMPLOYER OF RECORD (EOR) MARKET, BY REGION, 2018-2033 (USD THOUSAND)
13.11.1 NORTH AMERICA
13.11.2 EUROPE
13.11.3 ASIA-PACIFIC
13.11.4 SOUTH AMERICA
13.11.5 MIDDLE EAST AND AFRICA
14 NORTH AMERICA EMPLOYER OF RECORD (EOR) MARKET, BY PRICING MODEL
14.1 OVERVIEW
14.2 PER-EMPLOYEE-PER-MONTH (PEPM)
14.3 PERCENTAGE OF PAYROLL
14.4 FLAT FEE / SUBSCRIPTION-BASED
14.5 CUSTOM / ENTERPRISE PRICING
14.6 NORTH AMERICA PER-EMPLOYEE-PER-MONTH (PEPM) IN EMPLOYER OF RECORD (EOR) MARKET, BY REGION, 2018-2033 (USD THOUSAND)
14.6.1 NORTH AMERICA
14.6.2 EUROPE
14.6.3 ASIA-PACIFIC
14.6.4 SOUTH AMERICA
14.6.5 MIDDLE EAST AND AFRICA
14.7 NORTH AMERICA PERCENTAGE OF PAYROLL IN EMPLOYER OF RECORD (EOR) MARKET, BY REGION, 2018-2033 (USD THOUSAND)
14.7.1 NORTH AMERICA
14.7.2 EUROPE
14.7.3 ASIA-PACIFIC
14.7.4 SOUTH AMERICA
14.7.5 MIDDLE EAST AND AFRICA
14.8 NORTH AMERICA FLAT FEE / SUBSCRIPTION-BASED IN EMPLOYER OF RECORD (EOR) MARKET, BY REGION, 2018-2033 (USD THOUSAND)
14.8.1 NORTH AMERICA
14.8.2 EUROPE
14.8.3 ASIA-PACIFIC
14.8.4 SOUTH AMERICA
14.8.5 MIDDLE EAST AND AFRICA
14.9 NORTH AMERICA CUSTOM / ENTERPRISE PRICING IN EMPLOYER OF RECORD (EOR) MARKET, BY REGION, 2018-2033 (USD THOUSAND)
14.9.1 NORTH AMERICA
14.9.2 EUROPE
14.9.3 ASIA-PACIFIC
14.9.4 SOUTH AMERICA
14.9.5 MIDDLE EAST AND AFRICA
15 NORTH AMERICA EMPLOYER OF RECORD (EOR) MARKET, BY END USER INDUSTRY
15.1 OVERVIEW
15.2 IT & TELECOMMUNICATIONS
15.3 BANKING, FINANCIAL SERVICES & INSURANCE (BFSI)
15.4 MANUFACTURING
15.5 HEALTHCARE
15.6 GOVERNMENT & PUBLIC SECTOR
15.7 RETAIL & E-COMMERCE
15.8 LOGISTICS & SUPPLY-CHAIN SERVICES
15.9 ENERGY, UTILITIES & RENEWABLES
15.1 OIL & GAS
15.11 EDUCATION
15.12 CONSTRUCTION & INFRASTRUCTURE
15.13 OTHERS
15.14 NORTH AMERICA IT & TELECOMMUNICATIONS IN EMPLOYER OF RECORD (EOR) MARKET, BY TYPE, 2018-2033 (USD THOUSAND)
15.14.1 SOFTWARE & SAAS COMPANIES
15.14.2 IT SERVICES & CONSULTING FIRMS
15.14.3 REMOTE TECH WORKFORCE
15.14.4 TELECOMMUNICATIONS OPERATORS
15.15 NORTH AMERICA IT & TELECOMMUNICATIONS IN EMPLOYER OF RECORD (EOR) MARKET, BY SERVICE TYPE, 2018-2033 (USD THOUSAND)
15.15.1 PAYROLL MANAGEMENT
15.15.2 TAX & COMPLIANCE MANAGEMENT
15.15.3 HUMAN RESOURCE (HR) MANAGEMENT
15.15.4 EMPLOYEE BENEFITS ADMINISTRATION
15.15.5 RISK & LIABILITY MANAGEMENT
15.15.6 ADVANCED & VALUE-ADDED SERVICES
15.15.7 OTHERS
15.16 NORTH AMERICA IT & TELECOMMUNICATIONS IN EMPLOYER OF RECORD (EOR) MARKET, BY TYPE, 2018-2033 (USD THOUSAND)
15.16.1 INTERNATIONAL EOR
15.16.2 DOMESTIC EOR
15.17 NORTH AMERICA IT & TELECOMMUNICATIONS IN EMPLOYER OF RECORD (EOR) MARKET, BY REGION, 2018-2033 (USD THOUSAND)
15.17.1 NORTH AMERICA
15.17.2 EUROPE
15.17.3 ASIA-PACIFIC
15.17.4 SOUTH AMERICA
15.17.5 MIDDLE EAST AND AFRICA
15.18 NORTH AMERICA BANKING, FINANCIAL SERVICES & INSURANCE (BFSI) IN EMPLOYER OF RECORD (EOR) MARKET, BY TYPE, 2018-2033 (USD THOUSAND)
15.18.1 FINTECH COMPANIES
15.18.2 INVESTMENT & ASSET MANAGEMENT FIRMS
15.18.3 SHARED SERVICES & BACK-OFFICE OPERATIONS
15.18.4 INSURANCE PROVIDERS
15.19 NORTH AMERICA BANKING, FINANCIAL SERVICES & INSURANCE (BFSI) IN EMPLOYER OF RECORD (EOR) MARKET, BY SERVICE TYPE, 2018-2033 (USD THOUSAND)
15.19.1 TAX & COMPLIANCE MANAGEMENT
15.19.2 PAYROLL MANAGEMENT
15.19.3 RISK & LIABILITY MANAGEMENT
15.19.4 HUMAN RESOURCE (HR) MANAGEMENT
15.19.5 EMPLOYEE BENEFITS ADMINISTRATION
15.19.6 ADVANCED & VALUE-ADDED SERVICES
15.19.7 OTHERS
15.2 NORTH AMERICA BANKING, FINANCIAL SERVICES & INSURANCE (BFSI) IN EMPLOYER OF RECORD (EOR) MARKET, BY TYPE, 2018-2033 (USD THOUSAND)
15.20.1 INTERNATIONAL EOR
15.20.2 DOMESTIC EOR
15.21 NORTH AMERICA BANKING, FINANCIAL SERVICES & INSURANCE (BFSI) IN EMPLOYER OF RECORD (EOR) MARKET, BY REGION, 2018-2033 (USD THOUSAND)
15.21.1 NORTH AMERICA
15.21.2 EUROPE
15.21.3 ASIA-PACIFIC
15.21.4 SOUTH AMERICA
15.21.5 MIDDLE EAST AND AFRICA
15.22 NORTH AMERICA MANUFACTURING IN EMPLOYER OF RECORD (EOR) MARKET, BY TYPE, 2018-2033 (USD THOUSAND)
15.22.1 INDUSTRIAL & HEAVY MANUFACTURING
15.22.2 ELECTRONICS & SEMICONDUCTOR MANUFACTURING
15.22.3 AUTOMOTIVE & EV MANUFACTURING
15.22.4 ENGINEERING & EPC FIRMS
15.23 NORTH AMERICA MANUFACTURING IN EMPLOYER OF RECORD (EOR) MARKET, BY SERVICE TYPE, 2018-2033 (USD THOUSAND)
15.23.1 PAYROLL MANAGEMENT
15.23.2 TAX & COMPLIANCE MANAGEMENT
15.23.3 RISK & LIABILITY MANAGEMENT
15.23.4 HUMAN RESOURCE (HR) MANAGEMENT
15.23.5 EMPLOYEE BENEFITS ADMINISTRATION
15.23.6 ADVANCED & VALUE-ADDED SERVICES
15.23.7 OTHERS
15.24 NORTH AMERICA MANUFACTURING IN EMPLOYER OF RECORD (EOR) MARKET, BY TYPE, 2018-2033 (USD THOUSAND)
15.24.1 INTERNATIONAL EOR
15.24.2 DOMESTIC EOR
15.25 NORTH AMERICA MANUFACTURING IN EMPLOYER OF RECORD (EOR) MARKET, BY REGION, 2018-2033 (USD THOUSAND)
15.25.1 NORTH AMERICA
15.25.2 EUROPE
15.25.3 ASIA-PACIFIC
15.25.4 SOUTH AMERICA
15.25.5 MIDDLE EAST AND AFRICA
15.26 NORTH AMERICA HEALTHCARE IN EMPLOYER OF RECORD (EOR) MARKET, BY TYPE, 2018-2033 (USD THOUSAND)
15.26.1 HOSPITALS & HEALTHCARE NETWORKS
15.26.2 CLINICAL RESEARCH ORGANIZATIONS (CROS)
15.26.3 LIFE SCIENCES & BIOTECH COMPANIES
15.26.4 TELEHEALTH & DIGITAL HEALTH FIRMS
15.27 NORTH AMERICA HEALTHCARE IN EMPLOYER OF RECORD (EOR) MARKET, BY SERVICE TYPE, 2018-2033 (USD THOUSAND)
15.27.1 PAYROLL MANAGEMENT
15.27.2 TAX & COMPLIANCE MANAGEMENT
15.27.3 RISK & LIABILITY MANAGEMENT
15.27.4 HUMAN RESOURCE (HR) MANAGEMENT
15.27.5 EMPLOYEE BENEFITS ADMINISTRATION
15.27.6 ADVANCED & VALUE-ADDED SERVICES
15.27.7 OTHERS
15.28 NORTH AMERICA HEALTHCARE IN EMPLOYER OF RECORD (EOR) MARKET, BY TYPE, 2018-2033 (USD THOUSAND)
15.28.1 INTERNATIONAL EOR
15.28.2 DOMESTIC EOR
15.29 NORTH AMERICA HEALTHCARE IN EMPLOYER OF RECORD (EOR) MARKET, BY REGION, 2018-2033 (USD THOUSAND)
15.29.1 NORTH AMERICA
15.29.2 EUROPE
15.29.3 ASIA-PACIFIC
15.29.4 SOUTH AMERICA
15.29.5 MIDDLE EAST AND AFRICA
15.3 NORTH AMERICA GOVERNMENT & PUBLIC SECTOR IN EMPLOYER OF RECORD (EOR) MARKET, BY SERVICE TYPE, 2018-2033 (USD THOUSAND)
15.30.1 PAYROLL MANAGEMENT
15.30.2 TAX & COMPLIANCE MANAGEMENT
15.30.3 HUMAN RESOURCE (HR) MANAGEMENT
15.30.4 RISK & LIABILITY MANAGEMENT
15.30.5 EMPLOYEE BENEFITS ADMINISTRATION
15.30.6 ADVANCED & VALUE-ADDED SERVICES
15.30.7 OTHERS
15.31 NORTH AMERICA GOVERNMENT & PUBLIC SECTOR IN EMPLOYER OF RECORD (EOR) MARKET, BY TYPE, 2018-2033 (USD THOUSAND)
15.31.1 DOMESTIC EOR
15.31.2 INTERNATIONAL EOR
15.32 NORTH AMERICA GOVERNMENT & PUBLIC SECTOR IN EMPLOYER OF RECORD (EOR) MARKET, BY REGION, 2018-2033 (USD THOUSAND)
15.32.1 NORTH AMERICA
15.32.2 EUROPE
15.32.3 ASIA-PACIFIC
15.32.4 SOUTH AMERICA
15.32.5 MIDDLE EAST AND AFRICA
15.33 NORTH AMERICA RETAIL & E-COMMERCE IN EMPLOYER OF RECORD (EOR) MARKET, BY TYPE, 2018-2033 (USD THOUSAND)
15.33.1 E-COMMERCE & OMNICHANNEL RETAIL
15.33.2 CONSUMER GOODS COMPANIES
15.34 NORTH AMERICA RETAIL & E-COMMERCE IN EMPLOYER OF RECORD (EOR) MARKET, BY SERVICE TYPE, 2018-2033 (USD THOUSAND)
15.34.1 PAYROLL MANAGEMENT
15.34.2 TAX & COMPLIANCE MANAGEMENT
15.34.3 RISK & LIABILITY MANAGEMENT
15.34.4 HUMAN RESOURCE (HR) MANAGEMENT
15.34.5 EMPLOYEE BENEFITS ADMINISTRATION
15.34.6 ADVANCED & VALUE-ADDED SERVICES
15.34.7 OTHERS
15.35 NORTH AMERICA RETAIL & E-COMMERCE IN EMPLOYER OF RECORD (EOR) MARKET, BY TYPE, 2018-2033 (USD THOUSAND)
15.35.1 INTERNATIONAL EOR
15.35.2 DOMESTIC EOR
15.36 NORTH AMERICA RETAIL & E-COMMERCE IN EMPLOYER OF RECORD (EOR) MARKET, BY REGION, 2018-2033 (USD THOUSAND)
15.36.1 NORTH AMERICA
15.36.2 EUROPE
15.36.3 ASIA-PACIFIC
15.36.4 SOUTH AMERICA
15.36.5 MIDDLE EAST AND AFRICA
15.37 NORTH AMERICA LOGISTICS & SUPPLY-CHAIN SERVICES IN EMPLOYER OF RECORD (EOR) MARKET, BY SERVICE TYPE, 2018-2033 (USD THOUSAND)
15.37.1 PAYROLL MANAGEMENT
15.37.2 TAX & COMPLIANCE MANAGEMENT
15.37.3 RISK & LIABILITY MANAGEMENT
15.37.4 HUMAN RESOURCE (HR) MANAGEMENT
15.37.5 EMPLOYEE BENEFITS ADMINISTRATION
15.37.6 ADVANCED & VALUE-ADDED SERVICES
15.37.7 OTHERS
15.38 NORTH AMERICA LOGISTICS & SUPPLY-CHAIN SERVICES IN EMPLOYER OF RECORD (EOR) MARKET, BY TYPE, 2018-2033 (USD THOUSAND)
15.38.1 INTERNATIONAL EOR
15.38.2 DOMESTIC EOR
15.39 NORTH AMERICA LOGISTICS & SUPPLY-CHAIN SERVICES IN EMPLOYER OF RECORD (EOR) MARKET, BY REGION, 2018-2033 (USD THOUSAND)
15.39.1 NORTH AMERICA
15.39.2 EUROPE
15.39.3 ASIA-PACIFIC
15.39.4 SOUTH AMERICA
15.39.5 MIDDLE EAST AND AFRICA
15.4 NORTH AMERICA ENERGY, UTILITIES & RENEWABLES IN EMPLOYER OF RECORD (EOR) MARKET, BY SERVICE TYPE, 2018-2033 (USD THOUSAND)
15.40.1 PAYROLL MANAGEMENT
15.40.2 TAX & COMPLIANCE MANAGEMENT
15.40.3 RISK & LIABILITY MANAGEMENT
15.40.4 HUMAN RESOURCE (HR) MANAGEMENT
15.40.5 EMPLOYEE BENEFITS ADMINISTRATION
15.40.6 ADVANCED & VALUE-ADDED SERVICES
15.40.7 OTHERS
15.41 NORTH AMERICA ENERGY, UTILITIES & RENEWABLES IN EMPLOYER OF RECORD (EOR) MARKET, BY TYPE, 2018-2033 (USD THOUSAND)
15.41.1 INTERNATIONAL EOR
15.41.2 DOMESTIC EOR
15.42 NORTH AMERICA ENERGY, UTILITIES & RENEWABLES IN EMPLOYER OF RECORD (EOR) MARKET, BY REGION, 2018-2033 (USD THOUSAND)
15.42.1 NORTH AMERICA
15.42.2 EUROPE
15.42.3 ASIA-PACIFIC
15.42.4 SOUTH AMERICA
15.42.5 MIDDLE EAST AND AFRICA
15.43 NORTH AMERICA OIL & GAS IN EMPLOYER OF RECORD (EOR) MARKET, BY SERVICE TYPE, 2018-2033 (USD THOUSAND)
15.43.1 PAYROLL MANAGEMENT
15.43.2 TAX & COMPLIANCE MANAGEMENT
15.43.3 RISK & LIABILITY MANAGEMENT
15.43.4 HUMAN RESOURCE (HR) MANAGEMENT
15.43.5 EMPLOYEE BENEFITS ADMINISTRATION
15.43.6 ADVANCED & VALUE-ADDED SERVICES
15.43.7 OTHERS
15.44 NORTH AMERICA OIL & GAS IN EMPLOYER OF RECORD (EOR) MARKET, BY TYPE, 2018-2033 (USD THOUSAND)
15.44.1 INTERNATIONAL EOR
15.44.2 DOMESTIC EOR
15.45 NORTH AMERICA OIL & GAS IN EMPLOYER OF RECORD (EOR) MARKET, BY REGION, 2018-2033 (USD THOUSAND)
15.45.1 NORTH AMERICA
15.45.2 EUROPE
15.45.3 ASIA-PACIFIC
15.45.4 SOUTH AMERICA
15.45.5 MIDDLE EAST AND AFRICA
15.46 NORTH AMERICA EDUCATION IN EMPLOYER OF RECORD (EOR) MARKET, BY SERVICE TYPE, 2018-2033 (USD THOUSAND)
15.46.1 PAYROLL MANAGEMENT
15.46.2 TAX & COMPLIANCE MANAGEMENT
15.46.3 RISK & LIABILITY MANAGEMENT
15.46.4 HUMAN RESOURCE (HR) MANAGEMENT
15.46.5 EMPLOYEE BENEFITS ADMINISTRATION
15.46.6 ADVANCED & VALUE-ADDED SERVICES
15.46.7 OTHERS
15.47 NORTH AMERICA EDUCATION IN EMPLOYER OF RECORD (EOR) MARKET, BY TYPE, 2018-2033 (USD THOUSAND)
15.47.1 INTERNATIONAL EOR
15.47.2 DOMESTIC EOR
15.48 NORTH AMERICA EDUCATION IN EMPLOYER OF RECORD (EOR) MARKET, BY REGION, 2018-2033 (USD THOUSAND)
15.48.1 NORTH AMERICA
15.48.2 EUROPE
15.48.3 ASIA-PACIFIC
15.48.4 SOUTH AMERICA
15.48.5 MIDDLE EAST AND AFRICA
15.49 NORTH AMERICA CONSTRUCTION & INFRASTRUCTURE IN EMPLOYER OF RECORD (EOR) MARKET, BY SERVICE TYPE, 2018-2033 (USD THOUSAND)
15.49.1 PAYROLL MANAGEMENT
15.49.2 TAX & COMPLIANCE MANAGEMENT
15.49.3 RISK & LIABILITY MANAGEMENT
15.49.4 HUMAN RESOURCE (HR) MANAGEMENT
15.49.5 EMPLOYEE BENEFITS ADMINISTRATION
15.49.6 ADVANCED & VALUE-ADDED SERVICES
15.49.7 OTHERS
15.5 NORTH AMERICA CONSTRUCTION & INFRASTRUCTURE IN EMPLOYER OF RECORD (EOR) MARKET, BY TYPE, 2018-2033 (USD THOUSAND)
15.50.1 INTERNATIONAL EOR
15.50.2 DOMESTIC EOR
15.51 NORTH AMERICA CONSTRUCTION & INFRASTRUCTURE IN EMPLOYER OF RECORD (EOR) MARKET, BY REGION, 2018-2033 (USD THOUSAND)
15.51.1 NORTH AMERICA
15.51.2 EUROPE
15.51.3 ASIA-PACIFIC
15.51.4 SOUTH AMERICA
15.51.5 MIDDLE EAST AND AFRICA
15.52 NORTH AMERICA OTHERS IN EMPLOYER OF RECORD (EOR) MARKET, BY SERVICE TYPE, 2018-2033 (USD THOUSAND)
15.52.1 PAYROLL MANAGEMENT
15.52.2 TAX & COMPLIANCE MANAGEMENT
15.52.3 RISK & LIABILITY MANAGEMENT
15.52.4 HUMAN RESOURCE (HR) MANAGEMENT
15.52.5 EMPLOYEE BENEFITS ADMINISTRATION
15.52.6 ADVANCED & VALUE-ADDED SERVICES
15.52.7 OTHERS
15.53 NORTH AMERICA OTHERS IN EMPLOYER OF RECORD (EOR) MARKET, BY TYPE, 2018-2033 (USD THOUSAND)
15.53.1 INTERNATIONAL EOR
15.53.2 DOMESTIC EOR
15.54 NORTH AMERICA OTHERS IN EMPLOYER OF RECORD (EOR) MARKET, BY REGION, 2018-2033 (USD THOUSAND)
15.54.1 NORTH AMERICA
15.54.2 EUROPE
15.54.3 ASIA-PACIFIC
15.54.4 SOUTH AMERICA
15.54.5 MIDDLE EAST AND AFRICA
16 NORTH AMERICA EMPLOYER OF RECORD (EOR) MARKET, BY REGION
16.1 NORTH AMERICA
16.1.1 U.S.
16.1.2 CANADA
16.1.3 MEXICO
17 NORTH AMERICA EMPLOYER OF RECORD (EOR) MARKET: COMPANY LANDSCAPE
17.1 COMPANY SHARE ANALYSIS: GLOBAL
18 SWOT ANALYSIS
19 COMPANY PROFILES
19.1 GLOBALIZATION PARTNERS LLC
19.1.1 COMPANY SNAPSHOT
19.1.2 COMPANY SHARE ANALYSIS
19.1.3 PRODUCT PORTFOLIO
19.1.4 RECENT DEVELOPMENT
19.2 SAFEGUARD GLOBAL
19.2.1 COMPANY SNAPSHOT
19.2.2 COMPANY SHARE ANALYSIS
19.2.3 PRODUCT PORTFOLIO
19.2.4 RECENT DEVELOPMENT
19.3 PEBL (VELOCITY GLOBAL, LLC)
19.3.1 COMPANY SNAPSHOT
19.3.2 COMPANY SHARE ANALYSIS
19.3.3 PRODUCT/SERVICE PORTFOLIO
19.3.4 RECENT DEVELOPMENT
19.4 DEEL
19.4.1 COMPANY SNAPSHOT
19.4.2 COMPANY SHARE ANALYSIS
19.4.3 PRODUCT/SERVICE PORTFOLIO
19.4.4 RECENT DEVELOPMENT
19.5 OYSTER HR, INC
19.5.1 COMPANY SNAPSHOT
19.5.2 COMPANY SHARE ANALYSIS
19.5.3 PRODUCT PORTFOLIO
19.5.4 RECENT DEVELOPMENT
19.6 3C NORTH AMERICA GROUP
19.6.1 COMPANY SNAPSHOT
19.6.2 PRODUCT PORTFOLIO
19.6.3 RECENT DEVELOPMENT
19.7 AGILE HRO
19.7.1 COMPANY SNAPSHOT
19.7.2 PRODUCT PORTFOLIO
19.7.3 RECENT DEVELOPMENT
19.8 ANIDAY
19.8.1 COMPANY SNAPSHOT
19.8.2 PRODUCT PORTFOLIO
19.8.3 RECENT DEVELOPMENT
19.9 AQUENT
19.9.1 COMPANY SNAPSHOT
19.9.2 PRODUCT PORTFOLIO
19.9.3 RECENT DEVELOPMENT
19.1 ATLAS TECHNOLOGY SOLUTIONS, INC
19.10.1 COMPANY SNAPSHOT
19.10.2 PRODUCT PORTFOLIO
19.10.3 RECENT DEVELOPMENT
19.11 BORDERLESS AI
19.11.1 COMPANY SNAPSHOT
19.11.2 PRODUCT PORTFOLIO
19.11.3 RECENT DEVELOPMENT
19.12 BRIARS GROUP
19.12.1 COMPANY SNAPSHOT
19.12.2 PRODUCT PORTFOLIO
19.12.3 RECENT DEVELOPMENT
19.13 EXPRESS NORTH AMERICA EMPLOYMENT (PART OF ACUMEN INTERNATIONAL)
19.13.1 COMPANY SNAPSHOT
19.13.2 PRODUCT PORTFOLIO
19.13.3 RECENT DEVELOPMENT
19.14 FOXHIRE
19.14.1 COMPANY SNAPSHOT
19.14.2 PRODUCT PORTFOLIO
19.14.3 RECENT DEVELOPMENT
19.15 GOGLOBAL
19.15.1 COMPANY SNAPSHOT
19.15.2 SOLUTION PORTFOLIO
19.15.3 RECENT DEVELOPMENT
19.16 INFOTREE GLOBAL
19.16.1 COMPANY SNAPSHOT
19.16.2 PRODUCT PORTFOLIO
19.16.3 RECENT DEVELOPMENT
19.17 INS GLOBAL.
19.17.1 COMPANY SNAPSHOT
19.17.2 PRODUCT PORTFOLIO
19.17.3 RECENT DEVELOPMENT
19.18 LINKS INTERNATIONAL
19.18.1 COMPANY SNAPSHOT
19.18.2 PRODUCT PORTFOLIO
19.18.3 RECENT DEVELOPMENT
19.19 MULTIPLIER
19.19.1 COMPANY SNAPSHOT
19.19.2 PRODUCT PORTFOLIO
19.19.3 RECENT DEVELOPMENT
19.2 NATIVE TEAMS LIMITED
19.20.1 COMPANY SNAPSHOT
19.20.2 SOLUTION PORTFOLIO
19.20.3 RECENT DEVELOPMENT
19.21 PAPAYA GLOBAL
19.21.1 COMPANY SNAPSHOT
19.21.2 SOLUTION PORTFOLIO
19.21.3 RECENT DEVELOPMENT
19.22 PROCOM
19.22.1 COMPANY SNAPSHOT
19.22.2 PRODUCT PORTFOLIO
19.22.3 RECENT DEVELOPMENT
19.23 RANDSTAD N.V.
19.23.1 COMPANY SNAPSHOT
19.23.2 REVENUE ANALYSIS
19.23.3 PRODUCT PORTFOLIO
19.23.4 RECENT DEVELOPMENT
19.24 REMOFIRST INC.
19.24.1 COMPANY SNAPSHOT
19.24.2 PRODUCT PORTFOLIO
19.24.3 RECENT DEVELOPMENT
19.25 REMOTE REOPLE (FORMALLY NEW HORIZONS NORTH AMERICA PARTNERS)
19.25.1 COMPANY SNAPSHOT
19.25.2 PRODUCT PORTFOLIO
19.25.3 RECENT DEVELOPMENT
19.26 REMOTE TECHNOLOGY, INC.
19.26.1 COMPANY SNAPSHOT
19.26.2 PRODUCT PORTFOLIO
19.26.3 RECENT DEVELOPMENT
19.27 RIPPLING INC.
19.27.1 COMPANY SNAPSHOT
19.27.2 PRODUCT PORTFOLIO
19.27.3 RECENT DEVELOPMENT
19.28 SKUAD
19.28.1 COMPANY SNAPSHOT
19.28.2 PRODUCT PORTFOLIO
19.28.3 RECENT DEVELOPMENT
19.29 SKY EXECUTIVE
19.29.1 COMPANY SNAPSHOT
19.29.2 PRODUCT PORTFOLIO
19.29.3 RECENT DEVELOPMENT
19.3 UNIVERSAL HIRE
19.30.1 COMPANY SNAPSHOT
19.30.2 PRODUCT PORTFOLIO
19.30.3 RECENT DEVELOPMENT
20 QUESTIONNAIRE
21 RELATED REPORTS
List of Table
TABLE 1 NORTH AMERICA EMPLOYER OF RECORD (EOR) MARKET, BY SERVICE TYPE, 2018-2033 (USD THOUSAND)
TABLE 2 NORTH AMERICA PAYROLL MANAGEMENT IN EMPLOYER OF RECORD (EOR) MARKET, BY REGION, 2018-2033 (USD THOUSAND)
TABLE 3 NORTH AMERICA TAX & COMPLIANCE MANAGEMENT IN EMPLOYER OF RECORD (EOR) MARKET, BY REGION, 2018-2033 (USD THOUSAND)
TABLE 4 NORTH AMERICA RISK & LIABILITY MANAGEMENT IN EMPLOYER OF RECORD (EOR) MARKET, BY REGION, 2018-2033 (USD THOUSAND)
TABLE 5 NORTH AMERICA HUMAN RESOURCE (HR) MANAGEMENT IN EMPLOYER OF RECORD (EOR) MARKET, BY REGION, 2018-2033 (USD THOUSAND)
TABLE 6 NORTH AMERICA EMPLOYEE BENEFITS ADMINISTRATION IN EMPLOYER OF RECORD (EOR) MARKET, BY REGION, 2018-2033 (USD THOUSAND)
TABLE 7 NORTH AMERICA ADVANCED & VALUE-ADDED SERVICES IN EMPLOYER OF RECORD (EOR) MARKET, BY TYPE, 2018-2033 (USD THOUSAND)
TABLE 8 NORTH AMERICA ADVANCED & VALUE-ADDED SERVICES IN EMPLOYER OF RECORD (EOR) MARKET, BY REGION, 2018-2033 (USD THOUSAND)
TABLE 9 NORTH AMERICA OTHERS IN EMPLOYER OF RECORD (EOR) MARKET, BY REGION, 2018-2033 (USD THOUSAND)
TABLE 10 NORTH AMERICA EMPLOYER OF RECORD (EOR) MARKET, BY TYPE, 2018-2033 (USD THOUSAND)
TABLE 11 NORTH AMERICA INTERNATIONAL E0R IN EMPLOYER OF RECORD (EOR) MARKET, BY TYPE, 2018-2033 (USD THOUSAND)
TABLE 12 NORTH AMERICA INTERNATIONAL EOR IN EMPLOYER OF RECORD (EOR) MARKET, BY REGION, 2018-2033 (USD THOUSAND)
TABLE 13 NORTH AMERICA DOMESTIC E0R IN EMPLOYER OF RECORD (EOR) MARKET, BY TYPE, 2018-2033 (USD THOUSAND)
TABLE 14 NORTH AMERICA DOMESTIC E0R IN EMPLOYER OF RECORD (EOR) MARKET, BY REGION, 2018-2033 (USD THOUSAND)
TABLE 15 NORTH AMERICA EMPLOYER OF RECORD (EOR) MARKET, BY ENTERPRISE SIZE, 2018-2033 (USD THOUSAND)
TABLE 16 NORTH AMERICA SMALL AND MEDIUM ENTERPRISES (SMES) IN EMPLOYER OF RECORD (EOR) MARKET, BY REGION, 2018-2033 (USD THOUSAND)
TABLE 17 NORTH AMERICA LARGE ENTERPRISES IN EMPLOYER OF RECORD (EOR) MARKET, BY REGION, 2018-2033 (USD THOUSAND)
TABLE 18 NORTH AMERICA EMPLOYER OF RECORD (EOR) MARKET, BY DEPLOYMENT MODEL, 2018-2033 (USD THOUSAND)
TABLE 19 NORTH AMERICA CLOUD-BASED IN EMPLOYER OF RECORD (EOR) MARKET, BY REGION, 2018-2033 (USD THOUSAND)
TABLE 20 NORTH AMERICA ON-PREMISES IN EMPLOYER OF RECORD (EOR) MARKET, BY REGION, 2018-2033 (USD THOUSAND)
TABLE 21 NORTH AMERICA HYBRID DEPLOYMENT IN EMPLOYER OF RECORD (EOR) MARKET, BY REGION, 2018-2033 (USD THOUSAND)
TABLE 22 NORTH AMERICA EMPLOYER OF RECORD (EOR) MARKET, BY APPLICATION, 2018-2033 (USD THOUSAND)
TABLE 23 NORTH AMERICA HIRING IN EMPLOYER OF RECORD (EOR) MARKET, BY REGION, 2018-2033 (USD THOUSAND)
TABLE 24 NORTH AMERICA COMPLIANCE & RISK MANAGEMENT IN EMPLOYER OF RECORD (EOR) MARKET, BY REGION, 2018-2033 (USD THOUSAND)
TABLE 25 NORTH AMERICA PAYROLL OUTSOURCING IN EMPLOYER OF RECORD (EOR) MARKET, BY REGION, 2018-2033 (USD THOUSAND)
TABLE 26 NORTH AMERICA CONTRACTOR ENGAGEMENT IN EMPLOYER OF RECORD (EOR) MARKET, BY REGION, 2018-2033 (USD THOUSAND)
TABLE 27 NORTH AMERICA SEASONAL & ON-DEMAND WORKFORCE SCALING IN EMPLOYER OF RECORD (EOR) MARKET, BY REGION, 2018-2033 (USD THOUSAND)
TABLE 28 NORTH AMERICA INSURANCE & TAX HANDLING IN EMPLOYER OF RECORD (EOR) MARKET, BY REGION, 2018-2033 (USD THOUSAND)
TABLE 29 NORTH AMERICA BUSINESS CONTINUITY & RISK MITIGATION IN EMPLOYER OF RECORD (EOR) MARKET, BY REGION, 2018-2033 (USD THOUSAND)
TABLE 30 NORTH AMERICA MERGERS & ACQUISITIONS WORKFORCE INTEGRATION IN EMPLOYER OF RECORD (EOR) MARKET, BY REGION, 2018-2033 (USD THOUSAND)
TABLE 31 NORTH AMERICA OTHERS IN EMPLOYER OF RECORD (EOR) MARKET, BY REGION, 2018-2033 (USD THOUSAND)
TABLE 32 NORTH AMERICA EMPLOYER OF RECORD (EOR) MARKET, BY EMPLOYMENT TYPE, 2018-2033 (USD THOUSAND)
TABLE 33 NORTH AMERICA FULL-TIME EMPLOYEES IN EMPLOYER OF RECORD (EOR) MARKET, BY REGION, 2018-2033 (USD THOUSAND)
TABLE 34 NORTH AMERICA INDEPENDENT CONTRACTORS IN EMPLOYER OF RECORD (EOR) MARKET, BY REGION, 2018-2033 (USD THOUSAND)
TABLE 35 NORTH AMERICA FIXED-TERM / CONTRACT EMPLOYEES IN EMPLOYER OF RECORD (EOR) MARKET, BY REGION, 2018-2033 (USD THOUSAND)
TABLE 36 NORTH AMERICA PART-TIME EMPLOYEES IN EMPLOYER OF RECORD (EOR) MARKET, BY REGION, 2018-2033 (USD THOUSAND)
TABLE 37 NORTH AMERICA PROJECT-BASED / TEMPORARY WORKFORCE IN EMPLOYER OF RECORD (EOR) MARKET, BY REGION, 2018-2033 (USD THOUSAND)
TABLE 38 NORTH AMERICA EMPLOYER OF RECORD (EOR) MARKET, BY PRICING MODEL, 2018-2033 (USD THOUSAND)
TABLE 39 NORTH AMERICA PER-EMPLOYEE-PER-MONTH (PEPM) IN EMPLOYER OF RECORD (EOR) MARKET, BY REGION, 2018-2033 (USD THOUSAND)
TABLE 40 NORTH AMERICA PERCENTAGE OF PAYROLL IN EMPLOYER OF RECORD (EOR) MARKET, BY REGION, 2018-2033 (USD THOUSAND)
TABLE 41 NORTH AMERICA FLAT FEE / SUBSCRIPTION-BASED IN EMPLOYER OF RECORD (EOR) MARKET, BY REGION, 2018-2033 (USD THOUSAND)
TABLE 42 NORTH AMERICA CUSTOM / ENTERPRISE PRICING IN EMPLOYER OF RECORD (EOR) MARKET, BY REGION, 2018-2033 (USD THOUSAND)
TABLE 43 NORTH AMERICA EMPLOYER OF RECORD (EOR) MARKET, BY END USER INDUSTRY, 2018-2033 (USD THOUSAND)
TABLE 44 NORTH AMERICA IT & TELECOMMUNICATIONS IN EMPLOYER OF RECORD (EOR) MARKET, BY TYPE, 2018-2033 (USD THOUSAND)
TABLE 45 NORTH AMERICA IT & TELECOMMUNICATIONS IN EMPLOYER OF RECORD (EOR) MARKET, BY SERVICE TYPE, 2018-2033 (USD THOUSAND)
TABLE 46 NORTH AMERICA IT & TELECOMMUNICATIONS IN EMPLOYER OF RECORD (EOR) MARKET, BY TYPE, 2018-2033 (USD THOUSAND)
TABLE 47 NORTH AMERICA IT & TELECOMMUNICATIONS IN EMPLOYER OF RECORD (EOR) MARKET, BY REGION, 2018-2033 (USD THOUSAND)
TABLE 48 NORTH AMERICA BANKING, FINANCIAL SERVICES & INSURANCE (BFSI) IN EMPLOYER OF RECORD (EOR) MARKET, BY TYPE, 2018-2033 (USD THOUSAND)
TABLE 49 NORTH AMERICA BANKING, FINANCIAL SERVICES & INSURANCE (BFSI) IN EMPLOYER OF RECORD (EOR) MARKET, BY SERVICE TYPE, 2018-2033 (USD THOUSAND)
TABLE 50 NORTH AMERICA BANKING, FINANCIAL SERVICES & INSURANCE (BFSI) IN EMPLOYER OF RECORD (EOR) MARKET, BY TYPE, 2018-2033 (USD THOUSAND)
TABLE 51 NORTH AMERICA BANKING, FINANCIAL SERVICES & INSURANCE (BFSI) IN EMPLOYER OF RECORD (EOR) MARKET, BY REGION, 2018-2033 (USD THOUSAND)
TABLE 52 NORTH AMERICA MANUFACTURING IN EMPLOYER OF RECORD (EOR) MARKET, BY TYPE, 2018-2033 (USD THOUSAND)
TABLE 53 NORTH AMERICA MANUFACTURING IN EMPLOYER OF RECORD (EOR) MARKET, BY SERVICE TYPE, 2018-2033 (USD THOUSAND)
TABLE 54 NORTH AMERICA MANUFACTURING IN EMPLOYER OF RECORD (EOR) MARKET, BY TYPE, 2018-2033 (USD THOUSAND)
TABLE 55 NORTH AMERICA MANUFACTURING IN EMPLOYER OF RECORD (EOR) MARKET, BY REGION, 2018-2033 (USD THOUSAND)
TABLE 56 NORTH AMERICA HEALTHCARE IN EMPLOYER OF RECORD (EOR) MARKET, BY TYPE, 2018-2033 (USD THOUSAND)
TABLE 57 NORTH AMERICA HEALTHCARE IN EMPLOYER OF RECORD (EOR) MARKET, BY SERVICE TYPE, 2018-2033 (USD THOUSAND)
TABLE 58 NORTH AMERICA HEALTHCARE IN EMPLOYER OF RECORD (EOR) MARKET, BY TYPE, 2018-2033 (USD THOUSAND)
TABLE 59 NORTH AMERICA HEALTHCARE IN EMPLOYER OF RECORD (EOR) MARKET, BY REGION, 2018-2033 (USD THOUSAND)
TABLE 60 NORTH AMERICA GOVERNMENT & PUBLIC SECTOR IN EMPLOYER OF RECORD (EOR) MARKET, BY SERVICE TYPE, 2018-2033 (USD THOUSAND)
TABLE 61 NORTH AMERICA GOVERNMENT & PUBLIC SECTOR IN EMPLOYER OF RECORD (EOR) MARKET, BY TYPE, 2018-2033 (USD THOUSAND)
TABLE 62 NORTH AMERICA GOVERNMENT & PUBLIC SECTOR IN EMPLOYER OF RECORD (EOR) MARKET, BY REGION, 2018-2033 (USD THOUSAND)
TABLE 63 NORTH AMERICA RETAIL & E-COMMERCE IN EMPLOYER OF RECORD (EOR) MARKET, BY TYPE, 2018-2033 (USD THOUSAND)
TABLE 64 NORTH AMERICA RETAIL & E-COMMERCE IN EMPLOYER OF RECORD (EOR) MARKET, BY SERVICE TYPE, 2018-2033 (USD THOUSAND)
TABLE 65 NORTH AMERICA RETAIL & E-COMMERCE IN EMPLOYER OF RECORD (EOR) MARKET, BY TYPE, 2018-2033 (USD THOUSAND)
TABLE 66 NORTH AMERICA RETAIL & E-COMMERCE IN EMPLOYER OF RECORD (EOR) MARKET, BY REGION, 2018-2033 (USD THOUSAND)
TABLE 67 NORTH AMERICA LOGISTICS & SUPPLY-CHAIN SERVICES IN EMPLOYER OF RECORD (EOR) MARKET, BY SERVICE TYPE, 2018-2033 (USD THOUSAND)
TABLE 68 NORTH AMERICA LOGISTICS & SUPPLY-CHAIN SERVICES IN EMPLOYER OF RECORD (EOR) MARKET, BY TYPE, 2018-2033 (USD THOUSAND)
TABLE 69 NORTH AMERICA LOGISTICS & SUPPLY-CHAIN SERVICES IN EMPLOYER OF RECORD (EOR) MARKET, BY REGION, 2018-2033 (USD THOUSAND)
TABLE 70 NORTH AMERICA ENERGY, UTILITIES & RENEWABLES IN EMPLOYER OF RECORD (EOR) MARKET, BY SERVICE TYPE, 2018-2033 (USD THOUSAND)
TABLE 71 NORTH AMERICA ENERGY, UTILITIES & RENEWABLES IN EMPLOYER OF RECORD (EOR) MARKET, BY TYPE, 2018-2033 (USD THOUSAND)
TABLE 72 NORTH AMERICA ENERGY, UTILITIES & RENEWABLES IN EMPLOYER OF RECORD (EOR) MARKET, BY REGION, 2018-2033 (USD THOUSAND)
TABLE 73 NORTH AMERICA OIL & GAS IN EMPLOYER OF RECORD (EOR) MARKET, BY SERVICE TYPE, 2018-2033 (USD THOUSAND)
TABLE 74 NORTH AMERICA OIL & GAS IN EMPLOYER OF RECORD (EOR) MARKET, BY TYPE, 2018-2033 (USD THOUSAND)
TABLE 75 NORTH AMERICA OIL & GAS IN EMPLOYER OF RECORD (EOR) MARKET, BY REGION, 2018-2033 (USD THOUSAND)
TABLE 76 NORTH AMERICA EDUCATION IN EMPLOYER OF RECORD (EOR) MARKET, BY SERVICE TYPE, 2018-2033 (USD THOUSAND)
TABLE 77 NORTH AMERICA EDUCATION IN EMPLOYER OF RECORD (EOR) MARKET, BY TYPE, 2018-2033 (USD THOUSAND)
TABLE 78 NORTH AMERICA EDUCATION IN EMPLOYER OF RECORD (EOR) MARKET, BY REGION, 2018-2033 (USD THOUSAND)
TABLE 79 NORTH AMERICA CONSTRUCTION & INFRASTRUCTURE IN EMPLOYER OF RECORD (EOR) MARKET, BY SERVICE TYPE, 2018-2033 (USD THOUSAND)
TABLE 80 NORTH AMERICA CONSTRUCTION & INFRASTRUCTURE IN EMPLOYER OF RECORD (EOR) MARKET, BY TYPE, 2018-2033 (USD THOUSAND)
TABLE 81 NORTH AMERICA CONSTRUCTION & INFRASTRUCTURE IN EMPLOYER OF RECORD (EOR) MARKET, BY REGION, 2018-2033 (USD THOUSAND)
TABLE 82 NORTH AMERICA OTHERS IN EMPLOYER OF RECORD (EOR) MARKET, BY SERVICE TYPE, 2018-2033 (USD THOUSAND)
TABLE 83 NORTH AMERICA OTHERS IN EMPLOYER OF RECORD (EOR) MARKET, BY TYPE, 2018-2033 (USD THOUSAND)
TABLE 84 NORTH AMERICA OTHERS IN EMPLOYER OF RECORD (EOR) MARKET, BY REGION, 2018-2033 (USD THOUSAND)
TABLE 85 NORTH AMERICA EMPLOYER OF RECORD (EOR) MARKET, BY COUNTRY, 2018-2033 (USD THOUSAND)
TABLE 86 NORTH AMERICA EMPLOYER OF RECORD (EOR) MARKET, BY SERVICE TYPE, 2018-2033 (USD THOUSAND)
TABLE 87 NORTH AMERICA ADVANCED & VALUE-ADDED SERVICES IN EMPLOYER OF RECORD (EOR) MARKET, BY TYPE, 2018-2033 (USD THOUSAND)
TABLE 88 NORTH AMERICA EMPLOYER OF RECORD (EOR) MARKET, BY TYPE, 2018-2033 (USD THOUSAND)
TABLE 89 NORTH AMERICA INTERNATIONAL E0R IN EMPLOYER OF RECORD (EOR) MARKET, BY TYPE, 2018-2033 (USD THOUSAND)
TABLE 90 NORTH AMERICA DOMESTIC E0R IN EMPLOYER OF RECORD (EOR) MARKET, BY TYPE, 2018-2033 (USD THOUSAND)
TABLE 91 NORTH AMERICA EMPLOYER OF RECORD (EOR) MARKET, BY ENTERPRISE SIZE, 2018-2033 (USD THOUSAND)
TABLE 92 NORTH AMERICA EMPLOYER OF RECORD (EOR) MARKET, BY DEPLOYMENT MODEL, 2018-2033 (USD THOUSAND)
TABLE 93 NORTH AMERICA EMPLOYER OF RECORD (EOR) MARKET, BY APPLICATION, 2018-2033 (USD THOUSAND)
TABLE 94 NORTH AMERICA EMPLOYER OF RECORD (EOR) MARKET, BY EMPLOYMENT TYPE, 2018-2033 (USD THOUSAND)
TABLE 95 NORTH AMERICA EMPLOYER OF RECORD (EOR) MARKET, BY PRICING MODEL, 2018-2033 (USD THOUSAND)
TABLE 96 NORTH AMERICA EMPLOYER OF RECORD (EOR) MARKET, BY END USER INDUSTRY, 2018-2033 (USD THOUSAND)
TABLE 97 NORTH AMERICA IT & TELECOMMUNICATIONS IN EMPLOYER OF RECORD (EOR) MARKET, BY TYPE, 2018-2033 (USD THOUSAND)
TABLE 98 NORTH AMERICA IT & TELECOMMUNICATIONS IN EMPLOYER OF RECORD (EOR) MARKET, BY SERVICE TYPE, 2018-2033 (USD THOUSAND)
TABLE 99 NORTH AMERICA IT & TELECOMMUNICATIONS IN EMPLOYER OF RECORD (EOR) MARKET, BY TYPE, 2018-2033 (USD THOUSAND)
TABLE 100 NORTH AMERICA BANKING, FINANCIAL SERVICES & INSURANCE (BFSI) IN EMPLOYER OF RECORD (EOR) MARKET, BY TYPE, 2018-2033 (USD THOUSAND)
TABLE 101 NORTH AMERICA BANKING, FINANCIAL SERVICES & INSURANCE (BFSI) IN EMPLOYER OF RECORD (EOR) MARKET, BY SERVICE TYPE, 2018-2033 (USD THOUSAND)
TABLE 102 NORTH AMERICA BANKING, FINANCIAL SERVICES & INSURANCE (BFSI) IN EMPLOYER OF RECORD (EOR) MARKET, BY TYPE, 2018-2033 (USD THOUSAND)
TABLE 103 NORTH AMERICA MANUFACTURING IN EMPLOYER OF RECORD (EOR) MARKET, BY TYPE, 2018-2033 (USD THOUSAND)
TABLE 104 NORTH AMERICA MANUFACTURING IN EMPLOYER OF RECORD (EOR) MARKET, BY SERVICE TYPE, 2018-2033 (USD THOUSAND)
TABLE 105 NORTH AMERICA MANUFACTURING IN EMPLOYER OF RECORD (EOR) MARKET, BY TYPE, 2018-2033 (USD THOUSAND)
TABLE 106 NORTH AMERICA HEALTHCARE IN EMPLOYER OF RECORD (EOR) MARKET, BY TYPE, 2018-2033 (USD THOUSAND)
TABLE 107 NORTH AMERICA HEALTHCARE IN EMPLOYER OF RECORD (EOR) MARKET, BY SERVICE TYPE, 2018-2033 (USD THOUSAND)
TABLE 108 NORTH AMERICA HEALTHCARE IN EMPLOYER OF RECORD (EOR) MARKET, BY TYPE, 2018-2033 (USD THOUSAND)
TABLE 109 NORTH AMERICA GOVERNMENT & PUBLIC SECTOR IN EMPLOYER OF RECORD (EOR) MARKET, BY SERVICE TYPE, 2018-2033 (USD THOUSAND)
TABLE 110 NORTH AMERICA GOVERNMENT & PUBLIC SECTOR IN EMPLOYER OF RECORD (EOR) MARKET, BY TYPE, 2018-2033 (USD THOUSAND)
TABLE 111 NORTH AMERICA RETAIL & E-COMMERCE IN EMPLOYER OF RECORD (EOR) MARKET, BY TYPE, 2018-2033 (USD THOUSAND)
TABLE 112 NORTH AMERICA RETAIL & E-COMMERCE IN EMPLOYER OF RECORD (EOR) MARKET, BY SERVICE TYPE, 2018-2033 (USD THOUSAND)
TABLE 113 NORTH AMERICA RETAIL & E-COMMERCE IN EMPLOYER OF RECORD (EOR) MARKET, BY TYPE, 2018-2033 (USD THOUSAND)
TABLE 114 NORTH AMERICA LOGISTICS & SUPPLY-CHAIN SERVICES IN EMPLOYER OF RECORD (EOR) MARKET, BY SERVICE TYPE, 2018-2033 (USD THOUSAND)
TABLE 115 NORTH AMERICA LOGISTICS & SUPPLY-CHAIN SERVICES IN EMPLOYER OF RECORD (EOR) MARKET, BY TYPE, 2018-2033 (USD THOUSAND)
TABLE 116 NORTH AMERICA ENERGY, UTILITIES & RENEWABLES IN EMPLOYER OF RECORD (EOR) MARKET, BY SERVICE TYPE, 2018-2033 (USD THOUSAND)
TABLE 117 NORTH AMERICA ENERGY, UTILITIES & RENEWABLES IN EMPLOYER OF RECORD (EOR) MARKET, BY TYPE, 2018-2033 (USD THOUSAND)
TABLE 118 NORTH AMERICA OIL & GAS IN EMPLOYER OF RECORD (EOR) MARKET, BY SERVICE TYPE, 2018-2033 (USD THOUSAND)
TABLE 119 NORTH AMERICA OIL & GAS IN EMPLOYER OF RECORD (EOR) MARKET, BY TYPE, 2018-2033 (USD THOUSAND)
TABLE 120 NORTH AMERICA EDUCATION IN EMPLOYER OF RECORD (EOR) MARKET, BY SERVICE TYPE, 2018-2033 (USD THOUSAND)
TABLE 121 NORTH AMERICA EDUCATION IN EMPLOYER OF RECORD (EOR) MARKET, BY TYPE, 2018-2033 (USD THOUSAND)
TABLE 122 NORTH AMERICA CONSTRUCTION & INFRASTRUCTURE IN EMPLOYER OF RECORD (EOR) MARKET, BY SERVICE TYPE, 2018-2033 (USD THOUSAND)
TABLE 123 NORTH AMERICA CONSTRUCTION & INFRASTRUCTURE IN EMPLOYER OF RECORD (EOR) MARKET, BY TYPE, 2018-2033 (USD THOUSAND)
TABLE 124 NORTH AMERICA OTHERS IN EMPLOYER OF RECORD (EOR) MARKET, BY SERVICE TYPE, 2018-2033 (USD THOUSAND)
TABLE 125 NORTH AMERICA OTHERS IN EMPLOYER OF RECORD (EOR) MARKET, BY TYPE, 2018-2033 (USD THOUSAND)
TABLE 126 U.S. EMPLOYER OF RECORD (EOR) MARKET, BY SERVICE TYPE, 2018-2033 (USD THOUSAND)
TABLE 127 U.S. ADVANCED & VALUE-ADDED SERVICES IN EMPLOYER OF RECORD (EOR) MARKET, BY TYPE, 2018-2033 (USD THOUSAND)
TABLE 128 U.S. EMPLOYER OF RECORD (EOR) MARKET, BY TYPE, 2018-2033 (USD THOUSAND)
TABLE 129 U.S. INTERNATIONAL E0R IN EMPLOYER OF RECORD (EOR) MARKET, BY TYPE, 2018-2033 (USD THOUSAND)
TABLE 130 U.S. DOMESTIC E0R IN EMPLOYER OF RECORD (EOR) MARKET, BY TYPE, 2018-2033 (USD THOUSAND)
TABLE 131 U.S. EMPLOYER OF RECORD (EOR) MARKET, BY ENTERPRISE SIZE, 2018-2033 (USD THOUSAND)
TABLE 132 U.S. EMPLOYER OF RECORD (EOR) MARKET, BY DEPLOYMENT MODEL, 2018-2033 (USD THOUSAND)
TABLE 133 U.S. EMPLOYER OF RECORD (EOR) MARKET, BY APPLICATION, 2018-2033 (USD THOUSAND)
TABLE 134 U.S. EMPLOYER OF RECORD (EOR) MARKET, BY EMPLOYMENT TYPE, 2018-2033 (USD THOUSAND)
TABLE 135 U.S. EMPLOYER OF RECORD (EOR) MARKET, BY PRICING MODEL, 2018-2033 (USD THOUSAND)
TABLE 136 U.S. EMPLOYER OF RECORD (EOR) MARKET, BY END USER INDUSTRY, 2018-2033 (USD THOUSAND)
TABLE 137 U.S. IT & TELECOMMUNICATIONS IN EMPLOYER OF RECORD (EOR) MARKET, BY TYPE, 2018-2033 (USD THOUSAND)
TABLE 138 U.S. IT & TELECOMMUNICATIONS IN EMPLOYER OF RECORD (EOR) MARKET, BY SERVICE TYPE, 2018-2033 (USD THOUSAND)
TABLE 139 U.S. IT & TELECOMMUNICATIONS IN EMPLOYER OF RECORD (EOR) MARKET, BY TYPE, 2018-2033 (USD THOUSAND)
TABLE 140 U.S. BANKING, FINANCIAL SERVICES & INSURANCE (BFSI) IN EMPLOYER OF RECORD (EOR) MARKET, BY TYPE, 2018-2033 (USD THOUSAND)
TABLE 141 U.S. BANKING, FINANCIAL SERVICES & INSURANCE (BFSI) IN EMPLOYER OF RECORD (EOR) MARKET, BY SERVICE TYPE, 2018-2033 (USD THOUSAND)
TABLE 142 U.S. BANKING, FINANCIAL SERVICES & INSURANCE (BFSI) IN EMPLOYER OF RECORD (EOR) MARKET, BY TYPE, 2018-2033 (USD THOUSAND)
TABLE 143 U.S. MANUFACTURING IN EMPLOYER OF RECORD (EOR) MARKET, BY TYPE, 2018-2033 (USD THOUSAND)
TABLE 144 U.S. MANUFACTURING IN EMPLOYER OF RECORD (EOR) MARKET, BY SERVICE TYPE, 2018-2033 (USD THOUSAND)
TABLE 145 U.S. MANUFACTURING IN EMPLOYER OF RECORD (EOR) MARKET, BY TYPE, 2018-2033 (USD THOUSAND)
TABLE 146 U.S. HEALTHCARE IN EMPLOYER OF RECORD (EOR) MARKET, BY TYPE, 2018-2033 (USD THOUSAND)
TABLE 147 U.S. HEALTHCARE IN EMPLOYER OF RECORD (EOR) MARKET, BY SERVICE TYPE, 2018-2033 (USD THOUSAND)
TABLE 148 U.S. HEALTHCARE IN EMPLOYER OF RECORD (EOR) MARKET, BY TYPE, 2018-2033 (USD THOUSAND)
TABLE 149 U.S. GOVERNMENT & PUBLIC SECTOR IN EMPLOYER OF RECORD (EOR) MARKET, BY SERVICE TYPE, 2018-2033 (USD THOUSAND)
TABLE 150 U.S. GOVERNMENT & PUBLIC SECTOR IN EMPLOYER OF RECORD (EOR) MARKET, BY TYPE, 2018-2033 (USD THOUSAND)
TABLE 151 U.S. RETAIL & E-COMMERCE IN EMPLOYER OF RECORD (EOR) MARKET, BY TYPE, 2018-2033 (USD THOUSAND)
TABLE 152 U.S. RETAIL & E-COMMERCE IN EMPLOYER OF RECORD (EOR) MARKET, BY SERVICE TYPE, 2018-2033 (USD THOUSAND)
TABLE 153 U.S. RETAIL & E-COMMERCE IN EMPLOYER OF RECORD (EOR) MARKET, BY TYPE, 2018-2033 (USD THOUSAND)
TABLE 154 U.S. LOGISTICS & SUPPLY-CHAIN SERVICES IN EMPLOYER OF RECORD (EOR) MARKET, BY SERVICE TYPE, 2018-2033 (USD THOUSAND)
TABLE 155 U.S. LOGISTICS & SUPPLY-CHAIN SERVICES IN EMPLOYER OF RECORD (EOR) MARKET, BY TYPE, 2018-2033 (USD THOUSAND)
TABLE 156 U.S. ENERGY, UTILITIES & RENEWABLES IN EMPLOYER OF RECORD (EOR) MARKET, BY SERVICE TYPE, 2018-2033 (USD THOUSAND)
TABLE 157 U.S. ENERGY, UTILITIES & RENEWABLES IN EMPLOYER OF RECORD (EOR) MARKET, BY TYPE, 2018-2033 (USD THOUSAND)
TABLE 158 U.S. OIL & GAS IN EMPLOYER OF RECORD (EOR) MARKET, BY SERVICE TYPE, 2018-2033 (USD THOUSAND)
TABLE 159 U.S. OIL & GAS IN EMPLOYER OF RECORD (EOR) MARKET, BY TYPE, 2018-2033 (USD THOUSAND)
TABLE 160 U.S. EDUCATION IN EMPLOYER OF RECORD (EOR) MARKET, BY SERVICE TYPE, 2018-2033 (USD THOUSAND)
TABLE 161 U.S. EDUCATION IN EMPLOYER OF RECORD (EOR) MARKET, BY TYPE, 2018-2033 (USD THOUSAND)
TABLE 162 U.S. CONSTRUCTION & INFRASTRUCTURE IN EMPLOYER OF RECORD (EOR) MARKET, BY SERVICE TYPE, 2018-2033 (USD THOUSAND)
TABLE 163 U.S. CONSTRUCTION & INFRASTRUCTURE IN EMPLOYER OF RECORD (EOR) MARKET, BY TYPE, 2018-2033 (USD THOUSAND)
TABLE 164 U.S. OTHERS IN EMPLOYER OF RECORD (EOR) MARKET, BY SERVICE TYPE, 2018-2033 (USD THOUSAND)
TABLE 165 U.S. OTHERS IN EMPLOYER OF RECORD (EOR) MARKET, BY TYPE, 2018-2033 (USD THOUSAND)
TABLE 166 CANADA EMPLOYER OF RECORD (EOR) MARKET, BY SERVICE TYPE, 2018-2033 (USD THOUSAND)
TABLE 167 CANADA ADVANCED & VALUE-ADDED SERVICES IN EMPLOYER OF RECORD (EOR) MARKET, BY TYPE, 2018-2033 (USD THOUSAND)
TABLE 168 CANADA EMPLOYER OF RECORD (EOR) MARKET, BY TYPE, 2018-2033 (USD THOUSAND)
TABLE 169 CANADA INTERNATIONAL E0R IN EMPLOYER OF RECORD (EOR) MARKET, BY TYPE, 2018-2033 (USD THOUSAND)
TABLE 170 CANADA DOMESTIC E0R IN EMPLOYER OF RECORD (EOR) MARKET, BY TYPE, 2018-2033 (USD THOUSAND)
TABLE 171 CANADA EMPLOYER OF RECORD (EOR) MARKET, BY ENTERPRISE SIZE, 2018-2033 (USD THOUSAND)
TABLE 172 CANADA EMPLOYER OF RECORD (EOR) MARKET, BY DEPLOYMENT MODEL, 2018-2033 (USD THOUSAND)
TABLE 173 CANADA EMPLOYER OF RECORD (EOR) MARKET, BY APPLICATION, 2018-2033 (USD THOUSAND)
TABLE 174 CANADA EMPLOYER OF RECORD (EOR) MARKET, BY EMPLOYMENT TYPE, 2018-2033 (USD THOUSAND)
TABLE 175 CANADA EMPLOYER OF RECORD (EOR) MARKET, BY PRICING MODEL, 2018-2033 (USD THOUSAND)
TABLE 176 CANADA EMPLOYER OF RECORD (EOR) MARKET, BY END USER INDUSTRY, 2018-2033 (USD THOUSAND)
TABLE 177 CANADA IT & TELECOMMUNICATIONS IN EMPLOYER OF RECORD (EOR) MARKET, BY TYPE, 2018-2033 (USD THOUSAND)
TABLE 178 CANADA IT & TELECOMMUNICATIONS IN EMPLOYER OF RECORD (EOR) MARKET, BY SERVICE TYPE, 2018-2033 (USD THOUSAND)
TABLE 179 CANADA IT & TELECOMMUNICATIONS IN EMPLOYER OF RECORD (EOR) MARKET, BY TYPE, 2018-2033 (USD THOUSAND)
TABLE 180 CANADA BANKING, FINANCIAL SERVICES & INSURANCE (BFSI) IN EMPLOYER OF RECORD (EOR) MARKET, BY TYPE, 2018-2033 (USD THOUSAND)
TABLE 181 CANADA BANKING, FINANCIAL SERVICES & INSURANCE (BFSI) IN EMPLOYER OF RECORD (EOR) MARKET, BY SERVICE TYPE, 2018-2033 (USD THOUSAND)
TABLE 182 CANADA BANKING, FINANCIAL SERVICES & INSURANCE (BFSI) IN EMPLOYER OF RECORD (EOR) MARKET, BY TYPE, 2018-2033 (USD THOUSAND)
TABLE 183 CANADA MANUFACTURING IN EMPLOYER OF RECORD (EOR) MARKET, BY TYPE, 2018-2033 (USD THOUSAND)
TABLE 184 CANADA MANUFACTURING IN EMPLOYER OF RECORD (EOR) MARKET, BY SERVICE TYPE, 2018-2033 (USD THOUSAND)
TABLE 185 CANADA MANUFACTURING IN EMPLOYER OF RECORD (EOR) MARKET, BY TYPE, 2018-2033 (USD THOUSAND)
TABLE 186 CANADA HEALTHCARE IN EMPLOYER OF RECORD (EOR) MARKET, BY TYPE, 2018-2033 (USD THOUSAND)
TABLE 187 CANADA HEALTHCARE IN EMPLOYER OF RECORD (EOR) MARKET, BY SERVICE TYPE, 2018-2033 (USD THOUSAND)
TABLE 188 CANADA HEALTHCARE IN EMPLOYER OF RECORD (EOR) MARKET, BY TYPE, 2018-2033 (USD THOUSAND)
TABLE 189 CANADA GOVERNMENT & PUBLIC SECTOR IN EMPLOYER OF RECORD (EOR) MARKET, BY SERVICE TYPE, 2018-2033 (USD THOUSAND)
TABLE 190 CANADA GOVERNMENT & PUBLIC SECTOR IN EMPLOYER OF RECORD (EOR) MARKET, BY TYPE, 2018-2033 (USD THOUSAND)
TABLE 191 CANADA RETAIL & E-COMMERCE IN EMPLOYER OF RECORD (EOR) MARKET, BY TYPE, 2018-2033 (USD THOUSAND)
TABLE 192 CANADA RETAIL & E-COMMERCE IN EMPLOYER OF RECORD (EOR) MARKET, BY SERVICE TYPE, 2018-2033 (USD THOUSAND)
TABLE 193 CANADA RETAIL & E-COMMERCE IN EMPLOYER OF RECORD (EOR) MARKET, BY TYPE, 2018-2033 (USD THOUSAND)
TABLE 194 CANADA LOGISTICS & SUPPLY-CHAIN SERVICES IN EMPLOYER OF RECORD (EOR) MARKET, BY SERVICE TYPE, 2018-2033 (USD THOUSAND)
TABLE 195 CANADA LOGISTICS & SUPPLY-CHAIN SERVICES IN EMPLOYER OF RECORD (EOR) MARKET, BY TYPE, 2018-2033 (USD THOUSAND)
TABLE 196 CANADA ENERGY, UTILITIES & RENEWABLES IN EMPLOYER OF RECORD (EOR) MARKET, BY SERVICE TYPE, 2018-2033 (USD THOUSAND)
TABLE 197 CANADA ENERGY, UTILITIES & RENEWABLES IN EMPLOYER OF RECORD (EOR) MARKET, BY TYPE, 2018-2033 (USD THOUSAND)
TABLE 198 CANADA OIL & GAS IN EMPLOYER OF RECORD (EOR) MARKET, BY SERVICE TYPE, 2018-2033 (USD THOUSAND)
TABLE 199 CANADA OIL & GAS IN EMPLOYER OF RECORD (EOR) MARKET, BY TYPE, 2018-2033 (USD THOUSAND)
TABLE 200 CANADA EDUCATION IN EMPLOYER OF RECORD (EOR) MARKET, BY SERVICE TYPE, 2018-2033 (USD THOUSAND)
TABLE 201 CANADA EDUCATION IN EMPLOYER OF RECORD (EOR) MARKET, BY TYPE, 2018-2033 (USD THOUSAND)
TABLE 202 CANADA CONSTRUCTION & INFRASTRUCTURE IN EMPLOYER OF RECORD (EOR) MARKET, BY SERVICE TYPE, 2018-2033 (USD THOUSAND)
TABLE 203 CANADA CONSTRUCTION & INFRASTRUCTURE IN EMPLOYER OF RECORD (EOR) MARKET, BY TYPE, 2018-2033 (USD THOUSAND)
TABLE 204 CANADA OTHERS IN EMPLOYER OF RECORD (EOR) MARKET, BY SERVICE TYPE, 2018-2033 (USD THOUSAND)
TABLE 205 CANADA OTHERS IN EMPLOYER OF RECORD (EOR) MARKET, BY TYPE, 2018-2033 (USD THOUSAND)
TABLE 206 MEXICO EMPLOYER OF RECORD (EOR) MARKET, BY SERVICE TYPE, 2018-2033 (USD THOUSAND)
TABLE 207 MEXICO ADVANCED & VALUE-ADDED SERVICES IN EMPLOYER OF RECORD (EOR) MARKET, BY TYPE, 2018-2033 (USD THOUSAND)
TABLE 208 MEXICO EMPLOYER OF RECORD (EOR) MARKET, BY TYPE, 2018-2033 (USD THOUSAND)
TABLE 209 MEXICO INTERNATIONAL E0R IN EMPLOYER OF RECORD (EOR) MARKET, BY TYPE, 2018-2033 (USD THOUSAND)
TABLE 210 MEXICO DOMESTIC E0R IN EMPLOYER OF RECORD (EOR) MARKET, BY TYPE, 2018-2033 (USD THOUSAND)
TABLE 211 MEXICO EMPLOYER OF RECORD (EOR) MARKET, BY ENTERPRISE SIZE, 2018-2033 (USD THOUSAND)
TABLE 212 MEXICO EMPLOYER OF RECORD (EOR) MARKET, BY DEPLOYMENT MODEL, 2018-2033 (USD THOUSAND)
TABLE 213 MEXICO EMPLOYER OF RECORD (EOR) MARKET, BY APPLICATION, 2018-2033 (USD THOUSAND)
TABLE 214 MEXICO EMPLOYER OF RECORD (EOR) MARKET, BY EMPLOYMENT TYPE, 2018-2033 (USD THOUSAND)
TABLE 215 MEXICO EMPLOYER OF RECORD (EOR) MARKET, BY PRICING MODEL, 2018-2033 (USD THOUSAND)
TABLE 216 MEXICO EMPLOYER OF RECORD (EOR) MARKET, BY END USER INDUSTRY, 2018-2033 (USD THOUSAND)
TABLE 217 MEXICO IT & TELECOMMUNICATIONS IN EMPLOYER OF RECORD (EOR) MARKET, BY TYPE, 2018-2033 (USD THOUSAND)
TABLE 218 MEXICO IT & TELECOMMUNICATIONS IN EMPLOYER OF RECORD (EOR) MARKET, BY SERVICE TYPE, 2018-2033 (USD THOUSAND)
TABLE 219 MEXICO IT & TELECOMMUNICATIONS IN EMPLOYER OF RECORD (EOR) MARKET, BY TYPE, 2018-2033 (USD THOUSAND)
TABLE 220 MEXICO BANKING, FINANCIAL SERVICES & INSURANCE (BFSI) IN EMPLOYER OF RECORD (EOR) MARKET, BY TYPE, 2018-2033 (USD THOUSAND)
TABLE 221 MEXICO BANKING, FINANCIAL SERVICES & INSURANCE (BFSI) IN EMPLOYER OF RECORD (EOR) MARKET, BY SERVICE TYPE, 2018-2033 (USD THOUSAND)
TABLE 222 MEXICO BANKING, FINANCIAL SERVICES & INSURANCE (BFSI) IN EMPLOYER OF RECORD (EOR) MARKET, BY TYPE, 2018-2033 (USD THOUSAND)
TABLE 223 MEXICO MANUFACTURING IN EMPLOYER OF RECORD (EOR) MARKET, BY TYPE, 2018-2033 (USD THOUSAND)
TABLE 224 MEXICO MANUFACTURING IN EMPLOYER OF RECORD (EOR) MARKET, BY SERVICE TYPE, 2018-2033 (USD THOUSAND)
TABLE 225 MEXICO MANUFACTURING IN EMPLOYER OF RECORD (EOR) MARKET, BY TYPE, 2018-2033 (USD THOUSAND)
TABLE 226 MEXICO HEALTHCARE IN EMPLOYER OF RECORD (EOR) MARKET, BY TYPE, 2018-2033 (USD THOUSAND)
TABLE 227 MEXICO HEALTHCARE IN EMPLOYER OF RECORD (EOR) MARKET, BY SERVICE TYPE, 2018-2033 (USD THOUSAND)
TABLE 228 MEXICO HEALTHCARE IN EMPLOYER OF RECORD (EOR) MARKET, BY TYPE, 2018-2033 (USD THOUSAND)
TABLE 229 MEXICO GOVERNMENT & PUBLIC SECTOR IN EMPLOYER OF RECORD (EOR) MARKET, BY SERVICE TYPE, 2018-2033 (USD THOUSAND)
TABLE 230 MEXICO GOVERNMENT & PUBLIC SECTOR IN EMPLOYER OF RECORD (EOR) MARKET, BY TYPE, 2018-2033 (USD THOUSAND)
TABLE 231 MEXICO RETAIL & E-COMMERCE IN EMPLOYER OF RECORD (EOR) MARKET, BY TYPE, 2018-2033 (USD THOUSAND)
TABLE 232 MEXICO RETAIL & E-COMMERCE IN EMPLOYER OF RECORD (EOR) MARKET, BY SERVICE TYPE, 2018-2033 (USD THOUSAND)
TABLE 233 MEXICO RETAIL & E-COMMERCE IN EMPLOYER OF RECORD (EOR) MARKET, BY TYPE, 2018-2033 (USD THOUSAND)
TABLE 234 MEXICO LOGISTICS & SUPPLY-CHAIN SERVICES IN EMPLOYER OF RECORD (EOR) MARKET, BY SERVICE TYPE, 2018-2033 (USD THOUSAND)
TABLE 235 MEXICO LOGISTICS & SUPPLY-CHAIN SERVICES IN EMPLOYER OF RECORD (EOR) MARKET, BY TYPE, 2018-2033 (USD THOUSAND)
TABLE 236 MEXICO ENERGY, UTILITIES & RENEWABLES IN EMPLOYER OF RECORD (EOR) MARKET, BY SERVICE TYPE, 2018-2033 (USD THOUSAND)
TABLE 237 MEXICO ENERGY, UTILITIES & RENEWABLES IN EMPLOYER OF RECORD (EOR) MARKET, BY TYPE, 2018-2033 (USD THOUSAND)
TABLE 238 MEXICO OIL & GAS IN EMPLOYER OF RECORD (EOR) MARKET, BY SERVICE TYPE, 2018-2033 (USD THOUSAND)
TABLE 239 MEXICO OIL & GAS IN EMPLOYER OF RECORD (EOR) MARKET, BY TYPE, 2018-2033 (USD THOUSAND)
TABLE 240 MEXICO EDUCATION IN EMPLOYER OF RECORD (EOR) MARKET, BY SERVICE TYPE, 2018-2033 (USD THOUSAND)
TABLE 241 MEXICO EDUCATION IN EMPLOYER OF RECORD (EOR) MARKET, BY TYPE, 2018-2033 (USD THOUSAND)
TABLE 242 MEXICO CONSTRUCTION & INFRASTRUCTURE IN EMPLOYER OF RECORD (EOR) MARKET, BY SERVICE TYPE, 2018-2033 (USD THOUSAND)
TABLE 243 MEXICO CONSTRUCTION & INFRASTRUCTURE IN EMPLOYER OF RECORD (EOR) MARKET, BY TYPE, 2018-2033 (USD THOUSAND)
TABLE 244 MEXICO OTHERS IN EMPLOYER OF RECORD (EOR) MARKET, BY SERVICE TYPE, 2018-2033 (USD THOUSAND)
TABLE 245 MEXICO OTHERS IN EMPLOYER OF RECORD (EOR) MARKET, BY TYPE, 2018-2033 (USD THOUSAND)
List of Figure
FIGURE 1 NORTH AMERICA EMPLOYER OF RECORD (EOR) MARKET: SEGMENTATION
FIGURE 2 NORTH AMERICA EMPLOYER OF RECORD (EOR) MARKET: DATA TRIANGULATION
FIGURE 3 NORTH AMERICA EMPLOYER OF RECORD (EOR) MARKET: DROC ANALYSIS
FIGURE 4 NORTH AMERICA EMPLOYER OF RECORD (EOR) MARKET: NORTH AMERICA VS REGIONAL MARKET ANALYSIS
FIGURE 5 NORTH AMERICA EMPLOYER OF RECORD (EOR) MARKET: COMPANY RESEARCH ANALYSIS
FIGURE 6 NORTH AMERICA EMPLOYER OF RECORD (EOR) MARKET: INTERVIEW DEMOGRAPHICS
FIGURE 7 NORTH AMERICA EMPLOYER OF RECORD (EOR) MARKET: DBMR MARKET POSITION GRID
FIGURE 8 NORTH AMERICA EMPLOYER OF RECORD (EOR) MARKET: VENDOR SHARE ANALYSIS
FIGURE 9 NORTH AMERICA EMPLOYER OF RECORD (EOR) MARKET: MULTIVARIVATE MODELING
FIGURE 10 NORTH AMERICA EMPLOYER OF RECORD (EOR) MARKET: SERVICE TYPE TIMELINE CURVE
FIGURE 11 NORTH AMERICA EMPLOYER OF RECORD (EOR) MARKET: END-USER COVERAGE GRID
FIGURE 12 NORTH AMERICA EMPLOYER OF RECORD (EOR) MARKET: SEGMENTATION
FIGURE 13 SEVEN SEGMENTS COMPRISE THE NORTH AMERICA EMPLOYER OF RECORD (EOR) MARKET, BY SERVICE TYPE (2025)
FIGURE 14 NORTH AMERICA EMPLOYER OF RECORD (EOR) MARKET: EXECUTIVE SUMMARY
FIGURE 15 NORTH AMERICA WORKFORCE EXPANSION IS EXPECTED TO DRIVE THE NORTH AMERICA EMPLOYER OF RECORD (EOR) MARKET DURING THE FORECAST PERIOD OF 2026 TO 2033
FIGURE 16 PAYROLL MANAGEMENT SEGMENT IS EXPECTED TO ACCOUNT FOR THE LARGEST SHARE OF THE NORTH AMERICA EMPLOYER OF RECORD (EOR) MARKET IN 2025 & 2033
FIGURE 17 STRATEGIC DECISIONS
FIGURE 18 TOTAL PATENTS IN THE NORTH AMERICA EMPLOYER OF RECORD (EOR) MARKET
FIGURE 19 COMPANY EVALUATION QUADRANT
FIGURE 20 DROC ANALYSIS
FIGURE 21 NORTH AMERICA EMPLOYER OF RECORD (EOR) MARKET, BY SERVICE TYPE, 2025
FIGURE 22 NORTH AMERICA EMPLOYER OF RECORD (EOR) MARKET, BY TYPE, 2025
FIGURE 23 NORTH AMERICA EMPLOYER OF RECORD (EOR) MARKET, BY ENTERPRISE SIZE, 2025
FIGURE 24 NORTH AMERICA EMPLOYER OF RECORD (EOR) MARKET, BY DEPLOYMENT MODEL, 2025
FIGURE 25 NORTH AMERICA EMPLOYER OF RECORD (EOR) MARKET, BY APPLICATION, 2025
FIGURE 26 NORTH AMERICA EMPLOYER OF RECORD (EOR) MARKET, BY EMPLOYMENT TYPE, 2025
FIGURE 27 NORTH AMERICA EMPLOYER OF RECORD (EOR) MARKET, BY PRICING MODEL, 2025
FIGURE 28 NORTH AMERICA EMPLOYER OF RECORD (EOR) MARKET, BY END USER INDUSTRY, 2025
FIGURE 29 NORTH AMERICA EMPLOYER 0F RECORD (EOR) MARKET: SNAPSHOT
FIGURE 30 NORTH AMERICA EMPLOYER OF RECORD (EOR) MARKET: COMPANY SHARE 2025 (%)
Research Methodology
Data collection and base year analysis are done using data collection modules with large sample sizes. The stage includes obtaining market information or related data through various sources and strategies. It includes examining and planning all the data acquired from the past in advance. It likewise envelops the examination of information inconsistencies seen across different information sources. The market data is analysed and estimated using market statistical and coherent models. Also, market share analysis and key trend analysis are the major success factors in the market report. To know more, please request an analyst call or drop down your inquiry.
The key research methodology used by DBMR research team is data triangulation which involves data mining, analysis of the impact of data variables on the market and primary (industry expert) validation. Data models include Vendor Positioning Grid, Market Time Line Analysis, Market Overview and Guide, Company Positioning Grid, Patent Analysis, Pricing Analysis, Company Market Share Analysis, Standards of Measurement, Global versus Regional and Vendor Share Analysis. To know more about the research methodology, drop in an inquiry to speak to our industry experts.
Customization Available
Data Bridge Market Research is a leader in advanced formative research. We take pride in servicing our existing and new customers with data and analysis that match and suits their goal. The report can be customized to include price trend analysis of target brands understanding the market for additional countries (ask for the list of countries), clinical trial results data, literature review, refurbished market and product base analysis. Market analysis of target competitors can be analyzed from technology-based analysis to market portfolio strategies. We can add as many competitors that you require data about in the format and data style you are looking for. Our team of analysts can also provide you data in crude raw excel files pivot tables (Fact book) or can assist you in creating presentations from the data sets available in the report.


