
North America Interoperability Market
Market Size in USD Billion
 USD
2.10 Billion
USD
5.51 Billion
2025
2033
USD
2.10 Billion
USD
5.51 Billion
2025
2033
| 2026 - 2033 | |
| USD 2.10 Billion | |
| USD 5.51 Billion | |
| % | |
|
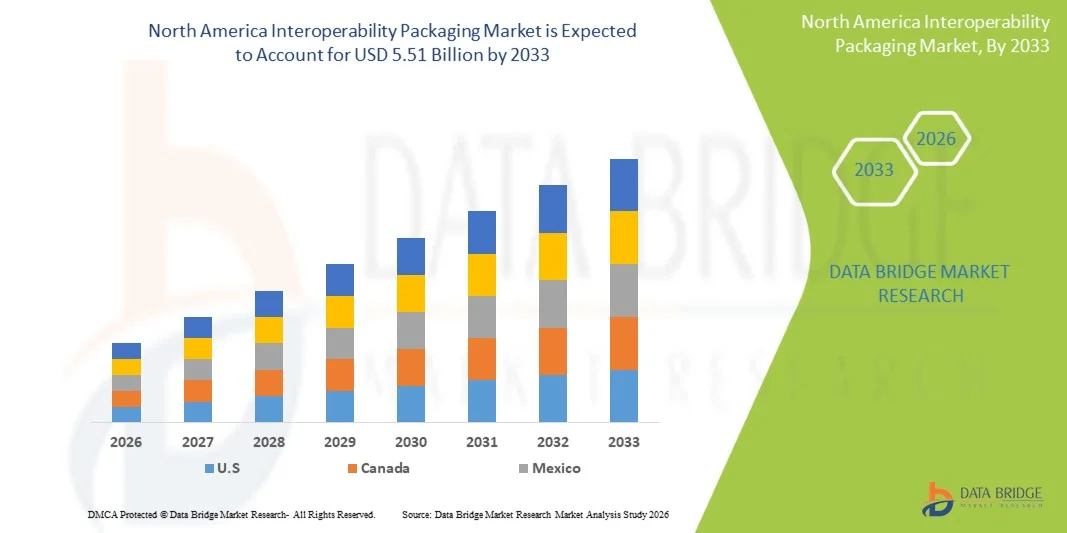
North America Interoperability Packaging Market Size
- The North America Interoperability Market was valued at USD 2.10 billion in 2025 and is expected to reach USD 5.51 billion by 2033 at a CAGR of 12.8% during the forecast period
- The North America Interoperability Market is largely driven by the growing need for seamless data exchange across healthcare, logistics, and digital commerce platforms, supported by rising adoption of integrated IT systems and real-time information sharing across complex supply chains.
- Market growth is further reinforced by the expansion of organized retail and Interoperability ecosystems, increased cross-border trade activities, stricter regulatory requirements for data standardization, and ongoing modernization of digital infrastructure aimed at improving operational efficiency, transparency, and system compatibility.
North America Interoperability Packaging Market Analysis
- Interoperability packaging is becoming increasingly critical across North America as digital commerce adoption continues to expand across both B2C and B2B channels. The accelerating shift toward omnichannel retail models, faster delivery expectations, and cross-border interoperability requirements has heightened demand for durable, lightweight, and protective packaging solutions that preserve product integrity while improving logistics efficiency and last-mile performance.
- Rising online consumption, high urbanization levels, and a well-established logistics and warehousing ecosystem across the United States and Canada are driving sustained demand for advanced interoperability packaging solutions. Strong adoption of right-sized packaging, protective mailers, and automated packaging technologies is helping reduce shipping costs, limit material waste, and enhance overall customer experience.
- Additionally, growing regulatory emphasis on sustainability and increasing consumer preference for eco-friendly packaging continue to influence market dynamics in North America. Brands and logistics providers are progressively shifting toward recyclable, biodegradable, and mono-material packaging formats, while reducing plastic content and excess secondary packaging to align with circular economy initiatives and extended producer responsibility (EPR) objectives.
- The U.S. is expected to dominate the North America Interoperability Packaging Market with the largest market share of 90.02% in 2026 and is also projected to register the highest CAGR during the forecast period. This dominance is supported by the country’s mature interoperability ecosystem, strong expansion of fulfilment and logistics infrastructure, and rising investments in sustainable and smart packaging solutions. Strategic collaborations between global packaging manufacturers and major interoperability platforms further strengthen regional production capacity and market leadership.
- In2025, the Software segment is expected to dominate the market with an 68.39% market share, growing at the highest CAGR of 13.2% during the forecast period of 2026 to 2033in the North America interoperability packaging market, driven by increasing demand for lightweight, cost-effective, and scalable packaging solutions for high-frequency online and omnichannel shipments.
Report Scope and North America Interoperability Market Segmentation
|
Attributes |
North America Interoperability Market Key Insights |
|
Segments Covered |
|
|
Countries Covered |
|
|
Key Market Players |
|
|
Market Opportunities |
|
|
Value Added Data Infosets |
In addition to the insights on market scenarios such as market value, growth rate, segmentation, geographical coverage, and major players, the market reports curated by the Data Bridge Market Research also include in-depth expert analysis, patient epidemiology, pipeline analysis, pricing analysis, and regulatory framework. |
North America Interoperability Market Trends
“Advancements in System Integration, Capacity Expansion, and Emerging Use Cases”
- One prominent trend in the North America Interoperability Market is the accelerated adoption of advanced interoperability software platforms, standardized data exchange frameworks, and cloud-based architectures to enhance system efficiency, expand data-handling capacity, and support diverse applications across healthcare, life sciences, payers, public health agencies, and integrated delivery networks.
- The market is witnessing rising demand for scalable interoperability solutions, API-enabled platforms, and real-time data exchange tools, driven by their ability to improve data accuracy, reduce manual workflows, and enable seamless information flow compared to legacy, siloed systems. This shift is particularly strong in electronic health records (EHR) integration, health information exchanges (HIEs), population health management, and value-based care models where interoperability, reliability, and operational efficiency are critical.
- For instance, in 2025, several healthcare networks and technology providers across North America expanded their cloud-based interoperability infrastructure and enhanced FHIR-enabled interfaces to support cross-platform data sharing and regulatory compliance. Similarly, providers and payers increasingly integrated AI-enabled data normalization and real-time interoperability tools to improve clinical decision-making, care coordination, and patient engagement.
- Industry participants are incorporating innovations such as master data management, identity resolution technologies, consent management platforms, and advanced analytics layers to address growing data volumes from EHRs, wearable devices, diagnostics, and remote patient monitoring systems. At the same time, enhanced cybersecurity frameworks and data governance solutions are strengthening interoperability performance while ensuring privacy, compliance, and trust across interconnected healthcare ecosystems.
- As sectors such as digital health, telemedicine, precision medicine, and connected care continue to expand, demand for secure, scalable, and standards-based interoperability solutions is intensifying. market players are also aligning with regulatory mandates and industry best practices by adopting standardized protocols, improving data transparency, and investing in interoperable infrastructure to strengthen their competitive positioning in the evolving North America healthcare landscape.
North America Interoperability Market Dynamics
Driver
“Rising Stakeholder Expectations for Seamless Data Exchange and Digital Experience”
- In recent years, the global digital ecosystem has undergone a significant transformation, with stakeholders expecting more than basic system connectivity; they increasingly demand seamless data exchange, real-time access, data security, and an overall digital experience that reflects reliability, transparency, and regulatory compliance. As data volumes and digital interactions continue to rise across healthcare, logistics, finance, and public services, minimizing data fragmentation while improving interoperability efficiency has become a strategic priority for organizations. This convergence of expectations—secure data sharing, operational efficiency, and regulatory alignment—is fueling sustained growth in the North America Interoperability Market. Interoperability is no longer viewed as a backend IT function, but as a critical enabler of user experience, organizational trust, compliance readiness, and long-term digital transformation.
- Rising expectations for accurate data integration and enhanced digital interaction are acting as a key driver for the global North America Interoperability Market. As end users demand real-time information availability, system compatibility, secure data flows, and standardized exchange formats, enterprises and solution providers are increasingly investing in advanced interoperability platforms and software solutions. This shift is accelerating the adoption of API-driven architectures, cloud-based integration tools, data standards, and intelligent automation that improve reliability, consistency, and user satisfaction. As expectations continue to rise across industries, interoperability performance is becoming a competitive differentiator, driving continuous innovation and expanding demand for specialized interoperability solutions.
Restraint/Challenge
“Volatility in Technology Input Costs and Implementation Expenses”
- Volatility in technology input costs, including software licensing fees, cloud infrastructure pricing, and integration services, continues to pose a key challenge for the North America Interoperability Market. The cost of deploying interoperability platforms, APIs, data standards frameworks, and cybersecurity solutions fluctuates due to changing cloud service tariffs, evolving regulatory requirements, vendor pricing strategies, and rapid technological advancements. These unpredictable cost structures increase total implementation and maintenance expenses for healthcare providers, payers, and solution vendors—particularly small and mid-sized organizations—limiting their ability to scale interoperability initiatives or invest consistently in advanced, secure, and standards-based solutions. Similar to how enterprise-level interoperability users demand robust, compliant, and customizable platforms, North American vendors face pressure to deliver reliable solutions while managing cost volatility across technology inputs.
- The impact of cost volatility extends across multiple end-use sectors, including healthcare, life sciences, public health, and insurance, where data accuracy, security, and regulatory compliance are mission-critical. Sudden increases in cloud hosting costs, data management expenses, or integration service fees can strain IT budgets, delay interoperability projects, and disrupt digital transformation timelines. Addressing these challenges through strategic vendor partnerships, modular software architectures, phased implementation models, and cost-optimized deployment strategies is essential for maintaining competitiveness. By adopting scalable platforms, leveraging open standards, and optimizing system efficiency, North America interoperability stakeholders can better manage cost volatility while ensuring reliable, secure, and high-quality data exchange across connected ecosystems.
North America Interoperability Market Scope
North America Interoperability Market is segmented into Six notable segments which are based on component type, interoperability level, deployment model, architecture model, application, end user .
• By Component Type
On the basis of component, the global North America Interoperability Market is segmented into software and services. In 2026, the software is expected to dominate the market with 68.61% market share due to their scalability, cost-efficiency, and ability to enable seamless data exchange across EHRs, APIs, and cloud platforms.
Software segment is estimated to grow with the highest CAGR of 13.2% due to its pivotal role in enabling scalable, FHIR-compliant platforms that integrate EHRs, APIs, and cloud-based exchanges across disparate systems
• By Interoperability Level
On the basis of interoperability level, the global North America Interoperability Market is segmented into foundational interoperability, structural interoperability, semantic interoperability, and organizational interoperability. In 2026, the Foundational Interoperability segment is expected to dominate the market with 36.22% market share, owing to its essential role in establishing basic syntax and structure standards, such as HL7 v2, CDA, and foundational FHIR, for secure data transmission across EHRs, devices, and legacy systems.
Semantic interoperability segment is estimated to grow with the highest CAGR of 13.6% due to its critical focus on interpreting data meaning across systems, enabling advanced clinical decision-making through standardized terminologies like SNOMED CT, LOINC, and RxNorm.
• By Deployment Model
On the basis of deployment model, the global North America Interoperability Market is segmented into on-premise, cloud-based, and edge & gateway-based deployment. In 2026, the On-Premise segment is expected to dominate the market with 45.47% market share due to its superior data security, regulatory compliance, and control over sensitive patient information in highly regulated environments like hospitals and government facilities.
Cloud-Based segment is estimated to grow with the highest CAGR of 13.0% in the forecast period due to its scalability, flexibility, and cost efficiencies that enable rapid deployment of FHIR APIs, AI analytics, and real-time data exchanges across distributed networks.
By Architecture Model
On the basis of architecture model, the global North America Interoperability Market is segmented into centralized architecture, decentralized architecture, and hybrid architecture. In 2026, the hybrid architecture segment is expected to dominate the market with 40.40% market share due to its optimal balance of on-premise security and cloud scalability, allowing providers to retain control over sensitive data while leveraging remote access and analytics.
Decentralized architecture segment is estimated to grow with the highest CAGR of 13.7% in the forecast period due to its empowerment of blockchain-led, peer-to-peer data exchanges that eliminate central bottlenecks, enhancing privacy and resilience in distributed networks
• By Application
On the basis of application, the global North America Interoperability Market is segmented into clinical applications, administrative applications, financial applications, public health & population health, digital & virtual care, and research & analytics. In 2026, the clinical applications segment is expected to dominate the market with 33.90% market share due to its direct impact on core workflows like EHR integration, computerized physician order entry (CPOE), and clinical decision support systems that demand real-time, standardized data exchange for patient safety and outcomes.
Digital & virtual care segment is estimated to grow with the highest CAGR of 13.6% in the forecast period due to surging demand for telemedicine, remote patient monitoring (RPM), and virtual health platforms that require seamless, real-time data exchange across wearables, apps, and EHRs.
By End User
On the basis of end user, the global North America Interoperability Market is segmented into healthcare providers, healthcare payers, pharmacies & pharmacy networks, government & public health bodies, life sciences & research organizations, and patients & consumer health platforms. In 2026, the healthcare providers segment is expected to dominate the market with 34.80% market share owing to its central role in driving demand for real-time data exchange across hospitals, clinics, and physician practices to support clinical workflows, patient safety, and care coordination.
Healthcare payers segment is estimated to grow with the highest CAGR of 13.4% in the forecast period due to escalating regulatory mandates like CMS interoperability rules and TEFCA, which compel payers to enable seamless prior authorization, claims processing, and patient data access across provider networks.
North America Interoperability Market Regional Analysis
- The U.S. represents one of the most mature and high-volume North America Interoperability Markets in North America, driven by widespread digital health adoption, strong regulatory support for data exchange, and a highly developed healthcare IT infrastructure. High transaction volumes across hospitals, ambulatory care, laboratories, and payer systems continue to drive demand for foundational and semantic interoperability solutions, while increasing care coordination needs and value-based care models are accelerating adoption of scalable, secure, and standards-based data exchange platforms.
- Canada is witnessing sustained demand for advanced interoperability solutions, supported by its publicly funded healthcare system, growing investment in digital health, and nationwide health information exchange initiatives. The country’s emphasis on data privacy, interoperability standards, and system modernization is driving increased adoption of interoperable electronic health records, secure messaging frameworks, and standardized data exchange solutions aligned with regulatory and governance requirements.
- Mexico’s emerging interoperability ecosystem is contributing steadily to regional market growth, particularly across public healthcare institutions, private hospital networks, and insurance providers. The expansion of digital health programs, improved healthcare access initiatives, and increasing cross-border healthcare data exchange needs are encouraging the adoption of interoperable platforms, cloud-based integration tools, and scalable interoperability solutions to enhance care delivery and operational efficiency.
U.S. North America Interoperability Market Insight
The U.S. North America Interoperability Market is witnessing steady growth, driven by widespread adoption of electronic health records, digital health solutions, and a mature healthcare IT infrastructure. Increasing volumes of clinical, administrative, and payer-related data are fueling demand for foundational, semantic, and hybrid interoperability solutions that enable seamless data exchange across hospitals, laboratories, ambulatory care, and payer systems. Additionally, rising regulatory focus on data security, standardization, and compliance, combined with the need for scalable and efficient IT platforms, is encouraging providers and payers to adopt advanced, secure, and standards-based interoperability solutions, positioning the U.S. as the most mature and innovation-driven market in North America.
Canada North America Interoperability Market Insight
Canada’s North America Interoperability Market continues to expand, supported by nationwide digital health initiatives, publicly funded healthcare systems, and growing investment in health information exchange networks. The increasing scale of clinical data sharing and cross-institution interoperability requirements is driving demand for reliable, standardized, and secure data exchange solutions. Strong emphasis on data privacy, compliance with national interoperability standards, and the adoption of cloud-enabled and hybrid IT architectures are accelerating the implementation of scalable and sustainable interoperability platforms, reinforcing Canada’s position as a leading North American market for connected healthcare solutions.
The Major Market Leaders Operating in the Market Are:
- Epic Systems Corporation (U.S.)
- Oracle (U.S.)
- InterSystems Corporation (U.S.)
- Microsoft Corporation (U.S.)
- Amazon Web Services (AWS) (U.S.)
- NextGen Healthcare (U.S.)
- Infor (U.S.)
- Allscripts Healthcare Solutions / Veradigm (U.S.)
- MEDITECH (U.S.)
- McKesson Corporation (U.S.)
- Athenahealth (U.S.)
- Orion Health (New Zealand)
- Philips Healthcare – (Netherlands)
- Siemens Healthineers – software platforms (Germany)
- GE Healthcare – software platforms (U.S.)
- IBM Corporation (U.S.)
- Health Catalyst (U.S.)
- CareEvolution (U.S.)
- Capsule Technologies (France)
- Interfaceware (Canada)
- Smile CDR (Canada)
- 1upHealth (U.S.)
- Health Gorilla (U.S.)
- TriNetX (U.S.)
- Verato (U.S.)
- Surescripts (U.S.)
- CitiusTech Inc. (U.S.)
- NextGen HealthCare – (U.S.)
- InterSystems – (U.S.)
Latest Developments in North America Interoperability Market
- In August 2025, several North American healthcare and technology associations announced initiatives to expand interoperability solutions, focusing on scalable hybrid and cloud-based platforms, standardized data exchange frameworks, and secure API integrations to ensure seamless information flow, improve care coordination, and enhance system reliability across hospitals, laboratories, and payer networks.
- In July 2025, leading healthcare IT providers and interoperability vendors in North America called for policy incentives and regulatory support to encourage investments in standardized data exchange, secure cloud architectures, and AI-enabled integration tools, highlighting the need to optimize operational efficiency while maintaining compliance with HIPAA and other healthcare regulations.
- In June 2025, public-private collaborations were proposed across key North American markets to develop interoperable health information exchange networks, aiming to improve data accessibility, support value-based care programs, and enhance cross-institution collaboration for hospitals, clinics, and payers.
- In May 2025, a comprehensive industry report revealed that existing interoperability infrastructure in North America is under pressure due to rising healthcare data volumes, particularly for patient records, laboratory results, and telehealth applications, stressing the importance of expanding scalable, secure, and standards-based data exchange platforms.
- In April 2025, private sector players in North America upgraded their interoperability solutions, integrated real-time analytics and API-based platforms, and adopted cloud-enabled and hybrid architectures to meet the growing needs of digital health, telemedicine, population health management, and precision care programs, driving efficiency, reliability, and compliance across healthcare IT ecosystems.
SKU-

- Interactive Data Analysis Dashboard
- Company Analysis Dashboard for high growth potential opportunities
- Research Analyst Access for customization & queries
- Competitor Analysis with Interactive dashboard
- Latest News, Updates & Trend analysis
- Harness the Power of Benchmark Analysis for Comprehensive Competitor Tracking
Table of Content
1 INTRODUCTION
1.1 OBJECTIVES OF THE STUDY
1.2 MARKET DEFINITION
1.3 OVERVIEW OF NORTH AMERICA INTEROPERABILITY MARKET
1.4 LIMITATIONS
1.5 MARKETS COVERED
2 MARKET SEGMENTATION
2.1 MARKETS COVERED
2.2 GEOGRAPHICAL SCOPE
2.3 YEARS CONSIDERED FOR THE STUDY
2.4 CURRENCY AND PRICING
2.5 DBMR TRIPOD DATA VALIDATION MODEL
2.6 MULTIVARIATE MODELLING
2.7 PRIMARY INTERVIEWS WITH KEY OPINION LEADERS
2.8 DBMR MARKET POSITION GRID
2.9 MARKET END USER COVERAGE GRID
2.1 SECONDARY SOURCES
2.11 ASSUMPTIONS
3 EXECUTIVE SUMMARY
4 PREMIUM INSIGHTS
4.1 INDUSTRY INSIGHTS – NORTH AMERICA INTEROPERABILITY MARKET
4.1.1 MICRO AND MACRO ECONOMIC FACTORS
4.1.2 PENETRATION AND GROWTH PROSPECT MAPPING
4.1.3 KEY PRICING STRATEGIES
4.1.4 ANALYSIS AND RECOMMENDATION
4.2 HEALTHCARE TARIFFS IMPACT ANALYSIS
4.2.1 OVERVIEW
4.2.2 TARIFF STRUCTURES
4.2.2.1 NORTH AMERICA VS. REGIONAL TARIFF STRUCTURES
4.2.2.2 UNITED STATES: MEDICARE/MEDICAID TARIFF POLICIES, CMS PRICING MODELS
4.2.2.3 EUROPEAN UNION: CROSS-BORDER TARIFF REGULATIONS, REIMBURSEMENT POLICIES
4.2.2.4 ASIA-PACIFIC: GOVERNMENT-IMPOSED TARIFFS ON IMPORTED MEDICAL PRODUCTS
4.2.2.5 EMERGING MARKETS: CHALLENGES IN TARIFF IMPLEMENTATION
4.2.3 PHARMACEUTICAL TARIFFS AND TRADE BARRIERS
4.2.3.1 IMPORT DUTIES ON PRESCRIPTION DRUGS VS. GENERICS
4.2.3.2 IMPACT ON DRUG AFFORDABILITY AND ACCESS
4.2.3.3 KEY TRADE AGREEMENTS AFFECTING PHARMACEUTICAL TARIFFS
4.2.4 IMPACT OF HEALTHCARE TARIFFS ON PROVIDERS AND PATIENTS
4.2.4.1 COST BURDEN ON HOSPITALS AND HEALTHCARE FACILITIES
4.2.4.2 EFFECT ON PATIENT AFFORDABILITY AND INSURANCE COVERAGE
4.2.4.3 TARIFFS AND THEIR ROLE IN MEDICAL TOURISM
4.2.5 TRADE AGREEMENTS AND HEALTHCARE TARIFFS
4.2.5.1 WTO REGULATIONS ON HEALTHCARE TARIFFS
4.2.5.2 IMPACT OF TRADE WARS ON THE HEALTHCARE SUPPLY CHAIN
4.2.5.3 ROLE OF FREE TRADE AGREEMENTS (FTAS) IN REDUCING TARIFFS
4.2.5.4 IMPACT OF TARIFFS ON HEALTHCARE COSTS AND ACCESSIBILITY
4.2.5.5 IMPORTANCE OF TARIFFS IN THE HEALTHCARE SECTOR
4.3 COMPANY EVALUATION QUADRANT
5 REGULATORY FRAMEWORK
5.1 REGULATORY APPROVAL PROCESS
5.2 GEOGRAPHIES’ EASE OF REGULATORY APPROVAL
5.3 REGULATORY APPROVAL PATHWAYS
5.4 LICENSING AND REGISTRATION
5.5 POST-MARKETING SURVEILLANCE
5.6 GOOD MANUFACTURING PRACTICES (GMPS) GUIDELINES
6 MARKET OVERVIEW
6.1 DRIVERS
6.1.1 RAPID DIGITALIZATION OF HEALTHCARE AND RISING HEALTHCARE IT SPENDING ACROSS APAC
6.1.2 STRONG GOVERNMENT INITIATIVES AND NATIONAL EHR/EMR PROGRAMS
6.1.3 ACCELERATING SHIFT TOWARD VALUE-BASED CARE AND POPULATION HEALTH MANAGEMENT
6.1.4 THE RAPID EXPANSION OF TELEHEALTH, REMOTE PATIENT MONITORING
6.2 RESTRAINTS
6.2.1 HIGH UP-FRONT IMPLEMENTATION AND INTEGRATION COSTS FOR HOSPITALS AND CLINICS
6.2.2 FRAGMENTED REGULATORY AND REIMBURSEMENT LANDSCAPES ACROSS APAC COUNTRIES
6.3 OPPORTUNITIES
6.3.1 RISING DEMAND FOR INTEROPERABLE EMR PLATFORMS SUPPORTING HEALTH INFORMATION EXCHANGE
6.3.2 GROWING ADOPTION OF SOFTWARE-AS-A-SERVICE (SAAS) AND CLOUD-BASED EMR SOLUTIONS
6.3.3 EXPANSION OF INTEROPERABILITY SOLUTIONS FOR AI-DRIVEN HEALTHCARE PLATFORMS
6.4 CHALLENGES
6.4.1 ENSURING DATA PRIVACY, CYBERSECURITY, AND COMPLIANCE WITH COUNTRYSPECIFIC HEALTH DATA PROTECTION REGULATIONS
6.4.2 INTEROPERABILITY ISSUES DUE TO DIVERSE DATA STANDARDS, CODING SYSTEMS, AND VENDOR ECOSYSTEMS
7 NORTH AMERICA INTEROPERABILITY MARKET, BY COMPONENT TYPE
7.1 OVERVIEW
7.2 SOFTWARE
7.2.1 SOFTWARE IN INTEROPERABILITY MARKET, BY TYPE
7.2.1.1 INTEGRATION & INTEROPERABILITY PLATFORMS
7.2.1.1.1 INTEGRATION & INTEROPERABILITY PLATFORMS IN INTEROPERABILITY MARKET, BY TYPE
7.2.1.1.1.1 ENTERPRISE INTEGRATION ENGINES
7.2.1.1.1.2 MIDDLEWARE PLATFORMS
7.2.1.1.1.3 INTERFACE ENGINES
7.2.1.1.1.4 API MANAGEMENT PLATFORMS
7.2.1.1.1.5 DATA EXCHANGE & MESSAGING SOFTWARE
7.2.1.2 HEALTH INFORMATION EXCHANGE (HIE) SOFTWARE
7.2.1.2.1 HEALTH INFORMATION EXCHANGE (HIE) SOFTWARE IN INTEROPERABILITY MARKET, BY INSTALLATION TYPE
7.2.1.2.1.1 PUBLIC / GOVERNMENT-LED HIE PLATFORMS
7.2.1.2.1.2 REGIONAL HIE (RHIO) PLATFORMS
7.2.1.2.1.3 PRIVATE HIE PLATFORMS
7.2.1.2.1.4 NATIONAL HEALTH DATA EXCHANGE PLATFORMS
7.2.1.2.1.5 HEALTH INFORMATION EXCHANGE (HIE) SOFTWARE (GENERIC / PLATFORM-LEVEL)
7.2.1.3 STANDARDS-BASED & PROTOCOL INTEROPERABILITY SOFTWARE
7.2.1.3.1 STANDARDS-BASED & PROTOCOL INTEROPERABILITY SOFTWARE IN INTEROPERABILITY MARKET, BY TYPE
7.2.1.3.1.1 HL7 V2 / V3 MESSAGING SOFTWARE
7.2.1.3.1.2 FHIR-BASED INTEROPERABILITY SOFTWARE
7.2.1.3.1.3 X12 / EDI TRANSACTION SOFTWARE
7.2.1.3.1.4 DICOM INTEROPERABILITY SOFTWARE
7.2.1.4 EMR / EHR INTEROPERABILITY SOFTWARE
7.2.1.4.1 EMR / EHR INTEROPERABILITY SOFTWARE IN INTEROPERABILITY MARKET, BY INSTALLATION TYPE
7.2.1.4.1.1 EMR-TO-EMR INTEROPERABILITY
7.2.1.4.1.2 EMR-TO-HIS INTEROPERABILITY
7.2.1.4.1.3 EMR-TO-RIS / PACS INTEROPERABILITY
7.2.1.4.1.4 EMR-TO-LIS INTEROPERABILITY
7.2.1.4.1.5 EMR / EHR INTEROPERABILITY SOFTWARE (GENERIC / PLATFORM-LEVEL)
7.2.1.5 DATA, IDENTITY & SEMANTIC INTEROPERABILITY SOFTWARE
7.2.1.5.1 DATA, IDENTITY & SEMANTIC INTEROPERABILITY SOFTWARE IN INTEROPERABILITY MARKET, BY INSTALLATION TYPE
7.2.1.5.1.1 DATA MANAGEMENT & NORMALIZATION SOFTWARE
7.2.1.5.1.2 DATA MAPPING & TRANSFORMATION TOOLS
7.2.1.5.1.3 MASTER PATIENT INDEX (MPI) SOFTWARE
7.2.1.5.1.4 TERMINOLOGY MANAGEMENT SOFTWARE
7.2.1.5.1.5 CLINICAL DATA NORMALIZATION SOFTWARE
7.2.1.6 MEDICAL DEVICE & CONNECTED CARE INTEROPERABILITY SOFTWARE
7.2.1.6.1 MEDICAL DEVICE & CONNECTED CARE INTEROPERABILITY SOFTWARE IN INTEROPERABILITY MARKET, BY UV STABILIZATION TECHNOLOGY
7.2.1.6.1.1 MEDICAL DEVICE & IOT INTEROPERABILITY SOFTWARE
7.2.1.6.1.2 BEDSIDE DEVICE INTEGRATION SOFTWARE
7.2.1.6.1.3 IMAGING DEVICE INTEROPERABILITY
7.2.1.6.1.4 WEARABLE & REMOTE MONITORING INTEGRATION
7.2.1.6.1.5 CONNECTED CARE PLATFORM INTEGRATIONS
7.2.2 SOFTWARE IN INTEROPERABILITY MARKET, BY REGION
7.2.2.1 NORTH AMERICA
7.2.2.2 EUROPE
7.2.2.3 ASIA-PACIFIC
7.2.2.4 SOUTH AMERICA
7.2.2.5 MIDDLE EAST & AFRICA
7.3 SERVICES
7.3.1 SERVICE IN INTEROPERABILITY MARKET, BY TYPE
7.3.1.1 SYSTEM INTEGRATION SERVICES
7.3.1.1.1 SYSTEM INTEGRATION SERVICES IN INTEROPERABILITY MARKET, BY TYPE
7.3.1.1.1.1 IMPLEMENTATION & INTEGRATION SERVICES
7.3.1.1.1.2 CUSTOM INTERFACE DEVELOPMENT
7.3.1.1.1.3 LEGACY SYSTEM MODERNIZATION
7.3.1.1.1.4 DATA MIGRATION SERVICES
7.3.1.1.1.5 PLATFORM DEPLOYMENT SERVICES
7.3.1.2 MANAGED SERVICES
7.3.1.2.1 MANAGED SERVICES IN INTEROPERABILITY MARKET, BY TYPE
7.3.1.2.1.1 MANAGED INTEGRATION SERVICES
7.3.1.2.1.2 CLOUD-MANAGED INTEROPERABILITY SERVICES
7.3.1.2.1.3 MANAGED HIE OPERATIONS
7.3.1.2.1.4 MANAGED API SERVICES
7.3.1.3 PROFESSIONAL SERVICES
7.3.1.3.1 PROFESSIONAL SERVICES IN INTEROPERABILITY MARKET, BY TYPE
7.3.1.3.1.1 CONSULTING & STRATEGY SERVICES
7.3.1.3.1.2 WORKFLOW & SYSTEM ASSESSMENT
7.3.1.3.1.3 REGULATORY & COMPLIANCE CONSULTING
7.3.1.4 SUPPORT & MAINTENANCE SERVICES
7.3.1.4.1 SUPPORT & MAINTENANCE SERVICES IN INTEROPERABILITY MARKET, BY TYPE
7.3.1.4.1.1 TECHNICAL SUPPORT
7.3.1.4.1.2 SYSTEM MAINTENANCE
7.3.1.4.1.3 VERSION UPGRADES
7.3.1.4.1.4 PERFORMANCE OPTIMIZATION
7.3.2 SERVICES IN INTEROPERABILITY MARKET, BY REGION
7.3.2.1 NORTH AMERICA
7.3.2.2 EUROPE
7.3.2.3 ASIA-PACIFIC
7.3.2.4 SOUTH AMERICA
7.3.2.5 MIDDLE EAST & AFRICA
8 NORTH AMERICA INTEROPERABILITY MARKET, BY INTEROPERABILITY LEVEL
8.1 OVERVIEW
8.1 FOUNDATIONAL INTEROPERABILITY
8.1.1 FOUNDATIONAL INTEROPERABILITY IN INTEROPERABILITY MARKET, BY TYPE
8.1.1.1 SECURE DATA TRANSMISSION
8.1.1.2 BASIC DATA EXCHANGE
8.1.2 FOUNDATIONAL INTEROPERABILITY IN INTEROPERABILITY MARKET, BY REGION
8.1.2.1 NORTH AMERICA
8.1.2.2 EUROPE
8.1.2.3 ASIA-PACIFIC
8.1.2.4 SOUTH AMERICA
8.1.2.5 MIDDLE EAST & AFRICA
8.2 STRUCTURAL INTEROPERABILITY
8.2.1 STRUCTURAL INTEROPERABILITY IN INTEROPERABILITY MARKET, BY TYPE
8.2.1.1 STRUCTURED MESSAGING FRAMEWORKS
8.2.1.2 STANDARDIZED DATA FORMATTING
8.2.2 STRUCTURAL INTEROPERABILITY IN INTEROPERABILITY MARKET, BY REGION
8.2.2.1 NORTH AMERICA
8.2.2.2 EUROPE
8.2.2.3 ASIA-PACIFIC
8.2.2.4 SOUTH AMERICA
8.2.2.5 MIDDLE EAST & AFRICA
8.3 ORGANIZATIONAL INTEROPERABILITY
8.3.1 ORGANISATIONAL INTEROPERABILITY IN INTEROPERABILITY MARKET, BY APPLICATION
8.3.1.1 CROSS-ORGANIZATION CARE COORDINATION
8.3.1.2 POLICY & GOVERNANCE INTEGRATION
8.3.1.3 WORKFLOW ALIGNMENT
8.3.2 ORGANIZATIONAL INTEROPERABILITY IN INTEROPERABILITY MARKET, BY REGION
8.3.2.1 NORTH AMERICA
8.3.2.2 EUROPE
8.3.2.3 ASIA-PACIFIC
8.3.2.4 SOUTH AMERICA
8.3.2.5 MIDDLE EAST & AFRICA
8.4 SEMANTIC INTEROPERABILITY
8.4.1 SEMENTIC INTEROPERABILITY IN INTEROPERABILITY MARKET, BY PRODUCT
8.4.1.1 CLINICAL TERMINOLOGY MAPPING
8.4.1.2 CONTEXT-AWARE DATA INTERPRETATION
8.4.1.3 AI-ENABLED SEMANTIC MAPPING
8.4.2 ORGANIZATIONAL INTEROPERABILITY IN INTEROPERABILITY MARKET, BY REGION
8.4.2.1 NORTH AMERICA
8.4.2.2 EUROPE
8.4.2.3 ASIA-PACIFIC
8.4.2.4 SOUTH AMERICA
8.4.2.5 MIDDLE EAST & AFRICA
9 NORTH AMERICA INTEROPERABILITY MARKET, BY DEPLOYMENT MODEL, 2018-2033 (USD THOUSAND)
9.1 OVERVIEW
9.2 ON-PREMISE
9.3 CLOUD-BASED
9.4 EDGE & GATEWAY-BASED DEPLOYMENT
9.4.1 NORTH AMERICA ON-PREMISES IN INTEROPERABILITY MARKET, BY TYPE, 2018-2033 (USD THOUSAND)
9.4.1.1 HOSPITAL-BASED DEPLOYMENTS
9.4.1.2 GOVERNMENT HEALTHCARE FACILITIES
9.4.2 NORTH AMERICA ON-PREMISE IN INTEROPERABILITY MARKET, BY REGION, 2018-2033 (USD THOUSAND)
9.4.2.1 NORTH AMERICA
9.4.2.2 EUROPE
9.4.2.3 ASIA-PACIFIC
9.4.2.4 SOUTH AMERICA
9.4.2.5 MIDDLE EAST & AFRICA
9.4.3 NORTH AMERICA CLOUD-BASED IN INTEROPERABILITY MARKET, BY TYPE, 2018-2033 (USD THOUSAND)
9.4.3.1 HYBRID CLOUD
9.4.3.2 PRIVATE CLOUD
9.4.3.3 PUBLIC CLOUD
9.4.4 NORTH AMERICA CLOUD-BASED IN INTEROPERABILITY MARKET, BY REGION, 2018-2033 (USD THOUSAND)
9.4.4.1 NORTH AMERICA
9.4.4.2 EUROPE
9.4.4.3 ASIA-PACIFIC
9.4.4.4 SOUTH AMERICA
9.4.4.5 MIDDLE EAST & AFRICA
9.4.5 NORTH AMERICA EDGE & GATEWAY-BASED DEPLOYMENT IN INTEROPERABILITY MARKET, BY TYPE, 2018-2033 (USD THOUSAND)
9.4.5.1 DEVICE-LEVEL GATEWAYS
9.4.5.2 LOCAL DATA EXCHANGE NODES
9.4.6 NORTH AMERICA EDGE & GATEWAY-BASED DEPLOYMENT IN INTEROPERABILITY MARKET, BY REGION, 2018-2033 (USD THOUSAND)
9.4.6.1 NORTH AMERICA
9.4.6.2 EUROPE
9.4.6.3 ASIA-PACIFIC
9.4.6.4 SOUTH AMERICA
9.4.6.5 MIDDLE EAST & AFRICA
9.4.7 NORTH AMERICA INTEROPERABILITY MARKET, BY COMPONENT TYPE, 2018-2033 (USD THOUSAND)
9.4.7.1 SOFTWARE
9.4.7.2 SERVICES
9.4.8 NORTH AMERICA SOFTWARE IN INTEROPERABILITY MARKET, BY TYPE, 2018-2033 (USD THOUSAND)
9.4.8.1 INTEGRATION & INTEROPERABILITY PLATFORMS
9.4.8.2 HEALTH INFORMATION EXCHANGE (HIE) SOFTWARE
9.4.8.3 STANDARDS-BASED & PROTOCOL INTEROPERABILITY SOFTWARE
9.4.8.4 EMR / EHR INTEROPERABILITY SOFTWARE
9.4.8.5 DATA, IDENTITY & SEMANTIC INTEROPERABILITY SOFTWARE
9.4.8.6 MEDICAL DEVICE & CONNECTED CARE INTEROPERABILITY SOFTWARE
9.4.9 NORTH AMERICA INTEGRATION & INTEROPERABILITY PLATFORMS IN INTEROPERABILITY MARKET, BY TYPE, 2018-2033 (USD THOUSAND)
9.4.9.1 ENTERPRISE INTEGRATION ENGINES
9.4.9.2 MIDDLEWARE PLATFORMS
9.4.9.3 INTERFACE ENGINES
9.4.9.4 API MANAGEMENT PLATFORMS
9.4.9.5 DATA EXCHANGE & MESSAGING SOFTWARE
9.4.10 NORTH AMERICA HEALTH INFORMATION EXCHANGE (HIE) SOFTWARE IN INTEROPERABILITY MARKET, BY INSTALLATION TYPE, 2018-2033 (USD THOUSAND)
9.4.10.1 PUBLIC / GOVERNMENT-LED HIE PLATFORMS
9.4.10.2 REGIONAL HIE (RHIO) PLATFORMS
9.4.10.3 PRIVATE HIE PLATFORMS
9.4.10.4 NATIONAL HEALTH DATA EXCHANGE PLATFORMS
9.4.10.5 HEALTH INFORMATION EXCHANGE (HIE) SOFTWARE (GENERIC / PLATFORM-LEVEL)
9.4.11 NORTH AMERICA STANDARDS-BASED & PROTOCOL INTEROPERABILITY SOFTWARE IN INTEROPERABILITY MARKET, BY TYPE, 2018-2033 (USD THOUSAND)
9.4.11.1 HL7 V2 / V3 MESSAGING SOFTWARE
9.4.11.2 FHIR-BASED INTEROPERABILITY SOFTWARE
9.4.11.3 X12 / EDI TRANSACTION SOFTWARE
9.4.11.4 DICOM INTEROPERABILITY SOFTWARE
9.4.12 NORTH AMERICA EMR / EHR INTEROPERABILITY SOFTWAREG IN INTEROPERABILITY MARKET, BY INSTALLATION TYPE, 2018-2033 (USD THOUSAND)
9.4.12.1 EMR-TO-EMR INTEROPERABILITY
9.4.12.2 EMR-TO-HIS INTEROPERABILITY
9.4.12.3 EMR-TO-RIS / PACS INTEROPERABILITY
9.4.12.4 EMR-TO-LIS INTEROPERABILITY
9.4.12.5 EMR / EHR INTEROPERABILITY SOFTWARE (GENERIC / PLATFORM-LEVEL)
9.4.13 NORTH AMERICA DATA, IDENTITY & SEMANTIC INTEROPERABILITY SOFTWARE IN INTEROPERABILITY MARKET, BY INSTALLATION TYPE, 2018-2033 (USD THOUSAND)
9.4.13.1 DATA MANAGEMENT & NORMALIZATION SOFTWARE
9.4.13.2 DATA MAPPING & TRANSFORMATION TOOLS
9.4.13.3 MASTER PATIENT INDEX (MPI) SOFTWARE
9.4.13.4 TERMINOLOGY MANAGEMENT SOFTWARE
9.4.13.5 CLINICAL DATA NORMALIZATION SOFTWARE
9.4.14 NORTH AMERICA MEDICAL DEVICE & CONNECTED CARE INTEROPERABILITY SOFTWARE IN INTEROPERABILITY MARKET, BY UV STABILIZATION TECHNOLOGY, 2018-2033 (USD THOUSAND)
9.4.14.1 MEDICAL DEVICE & IOT INTEROPERABILITY SOFTWARE
9.4.14.2 BEDSIDE DEVICE INTEGRATION SOFTWARE
9.4.14.3 IMAGING DEVICE INTEROPERABILITY
9.4.14.4 WEARABLE & REMOTE MONITORING INTEGRATION
9.4.14.5 CONNECTED CARE PLATFORM INTEGRATIONS
9.4.15 NORTH AMERICA SOFTWARE IN INTEROPERABILITY MARKET, BY REGION, 2018-2033 (USD THOUSAND)
9.4.15.1 NORTH AMERICA
9.4.15.2 EUROPE
9.4.15.3 ASIA-PACIFIC
9.4.15.4 SOUTH AMERICA
9.4.15.5 MIDDLE EAST & AFRICA
9.4.16 NORTH AMERICA SERVICE IN INTEROPERABILITY MARKET, BY TYPE, 2018-2033 (USD THOUSAND)
9.4.16.1 SYSTEM INTEGRATION SERVICES
9.4.16.2 MANAGED SERVICES
9.4.16.3 PROFESSIONAL SERVICES
9.4.16.4 SUPPORT & MAINTENANCE SERVICES
9.4.17 NORTH AMERICA SYSTEM INTEGRATION SERVICES IN INTEROPERABILITY MARKET, BY TYPE, 2018-2033 (USD THOUSAND)
9.4.17.1 IMPLEMENTATION & INTEGRATION SERVICES
9.4.17.2 CUSTOM INTERFACE DEVELOPMENT
9.4.17.3 LEGACY SYSTEM MODERNIZATION
9.4.17.4 DATA MIGRATION SERVICES
9.4.17.5 PLATFORM DEPLOYMENT SERVICES
9.4.18 NORTH AMERICA MANAGED SERVICES IN INTEROPERABILITY MARKET, BY TYPE, 2018-2033 (USD THOUSAND)
9.4.18.1 MANAGED INTEGRATION SERVICES
9.4.18.2 CLOUD-MANAGED INTEROPERABILITY SERVICES
9.4.18.3 MANAGED HIE OPERATIONS
9.4.18.4 MANAGED API SERVICES
9.4.19 NORTH AMERICA PROFESSIONAL SERVICES IN INTEROPERABILITY MARKET, BY TYPE, 2018-2033 (USD THOUSAND)
9.4.19.1 CONSULTING & STRATEGY SERVICES
9.4.19.2 WORKFLOW & SYSTEM ASSESSMENT
9.4.19.3 REGULATORY & COMPLIANCE CONSULTING
9.4.20 NORTH AMERICA SUPPORT & MAINTENANCE SERVICES IN INTEROPERABILITY MARKET, BY TYPE, 2018-2033 (USD THOUSAND)
9.4.20.1 TECHNICAL SUPPORT
9.4.20.2 SYSTEM MAINTENANCE
9.4.20.3 VERSION UPGRADES
9.4.20.4 PERFORMANCE OPTIMIZATION
9.4.21 NORTH AMERICA SERVICES IN INTEROPERABILITY MARKET, BY REGION, 2018-2033 (USD THOUSAND)
9.4.21.1 NORTH AMERICA
9.4.21.2 EUROPE
9.4.21.3 ASIA-PACIFIC
9.4.21.4 SOUTH AMERICA
9.4.21.5 MIDDLE EAST & AFRICA
9.4.22 NORTH AMERICA INTEROPERABILITY MARKET, BY INTEROPERABILITY LEVEL, 2018-2033 (USD THOUSAND)
9.4.22.1 FOUNDATIONAL INTEROPERABILITY
9.4.22.2 STRUCTURAL INTEROPERABILITY
9.4.22.3 ORGANIZATIONAL INTEROPERABILITY
9.4.22.4 SEMANTIC INTEROPERABILITY
9.4.23 NORTH AMERICA FOUNDATIONAL INTEROPERABILITY IN INTEROPERABILITY MARKET, BY TYPE, 2018-2033 (USD THOUSAND)
9.4.23.1 SECURE DATA TRANSMISSION
9.4.23.2 BASIC DATA EXCHANGE
9.4.24 NORTH AMERICA FOUNDATIONAL INTEROPERABILITY IN INTEROPERABILITY MARKET, BY REGION, 2018-2033 (USD THOUSAND)
9.4.24.1 NORTH AMERICA
9.4.24.2 EUROPE
9.4.24.3 ASIA-PACIFIC
9.4.24.4 SOUTH AMERICA
9.4.24.5 MIDDLE EAST & AFRICA
9.4.25 NORTH AMERICA STRUCTURAL INTEROPERABILITY IN INTEROPERABILITY MARKET, BY TYPE, 2018-2033 (USD THOUSAND)
9.4.25.1 STRUCTURED MESSAGING FRAMEWORKS
9.4.25.2 STANDARDIZED DATA FORMATTING
9.4.26 NORTH AMERICA STRUCTURAL INTEROPERABILITY IN INTEROPERABILITY MARKET, BY REGION, 2018-2033 (USD THOUSAND)
9.4.26.1 NORTH AMERICA
9.4.26.2 EUROPE
9.4.26.3 ASIA-PACIFIC
9.4.26.4 SOUTH AMERICA
9.4.26.5 MIDDLE EAST & AFRICA
9.4.27 NORTH AMERICA ORGANISATIONAL INTEROPERABILITY IN INTEROPERABILITY MARKET, BY APPLICATION, 2018-2033 (USD THOUSAND)
9.4.27.1 CROSS-ORGANIZATION CARE COORDINATION
9.4.27.2 POLICY & GOVERNANCE INTEGRATION
9.4.27.3 WORKFLOW ALIGNMENT
9.4.28 NORTH AMERICA ORGANIZATIONAL INTEROPERABILITY IN INTEROPERABILITY MARKET, BY REGION, 2018-2033 (USD THOUSAND)
9.4.28.1 NORTH AMERICA
9.4.28.2 EUROPE
9.4.28.3 ASIA-PACIFIC
9.4.28.4 SOUTH AMERICA
9.4.28.5 MIDDLE EAST & AFRICA
9.4.29 NORTH AMERICA SEMENTIC INTEROPERABILITY IN INTEROPERABILITY MARKET, BY PRODUCT, 2018-2033 (USD THOUSAND)
9.4.29.1 CLINICAL TERMINOLOGY MAPPING
9.4.29.2 CONTEXT-AWARE DATA INTERPRETATION
9.4.29.3 AI-ENABLED SEMANTIC MAPPING
9.4.30 NORTH AMERICA ORGANIZATIONAL INTEROPERABILITY IN INTEROPERABILITY MARKET, BY REGION, 2018-2033 (USD THOUSAND)
9.4.30.1 NORTH AMERICA
9.4.30.2 EUROPE
9.4.30.3 ASIA-PACIFIC
9.4.30.4 SOUTH AMERICA
9.4.30.5 MIDDLE EAST & AFRICA
9.4.31 NORTH AMERICA INTEROPERABILITY MARKET, BY DEPLOYMENT MODEL, 2018-2033 (USD THOUSAND)
9.4.31.1 ON-PREMISE
9.4.31.2 CLOUD-BASED
9.4.31.3 EDGE & GATEWAY-BASED DEPLOYMENT
9.4.32 NORTH AMERICA ON-PREMISES IN INTEROPERABILITY MARKET, BY TYPE, 2018-2033 (USD THOUSAND)
9.4.32.1 HOSPITAL-BASED DEPLOYMENTS
9.4.32.2 GOVERNMENT HEALTHCARE FACILITIES
9.4.33 NORTH AMERICA ON-PREMISE IN INTEROPERABILITY MARKET, BY REGION, 2018-2033 (USD THOUSAND)
9.4.33.1 NORTH AMERICA
9.4.33.2 EUROPE
9.4.33.3 ASIA-PACIFIC
9.4.33.4 SOUTH AMERICA
9.4.33.5 MIDDLE EAST & AFRICA
9.4.34 NORTH AMERICA CLOUD-BASED IN INTEROPERABILITY MARKET, BY TYPE, 2018-2033 (USD THOUSAND)
9.4.34.1 HYBRID CLOUD
9.4.34.2 PRIVATE CLOUD
9.4.34.3 PUBLIC CLOUD
9.4.35 NORTH AMERICA CLOUD-BASED IN INTEROPERABILITY MARKET, BY REGION, 2018-2033 (USD THOUSAND)
9.4.35.1 NORTH AMERICA
9.4.35.2 EUROPE
9.4.35.3 ASIA-PACIFIC
9.4.35.4 SOUTH AMERICA
9.4.35.5 MIDDLE EAST & AFRICA
9.4.36 NORTH AMERICA EDGE & GATEWAY-BASED DEPLOYMENT IN INTEROPERABILITY MARKET, BY TYPE, 2018-2033 (USD THOUSAND)
9.4.36.1 DEVICE-LEVEL GATEWAYS
9.4.36.2 LOCAL DATA EXCHANGE NODES
9.4.37 NORTH AMERICA EDGE & GATEWAY-BASED DEPLOYMENT IN INTEROPERABILITY MARKET, BY REGION, 2018-2033 (USD THOUSAND)
9.4.37.1 NORTH AMERICA
9.4.37.2 EUROPE
9.4.37.3 ASIA-PACIFIC
9.4.37.4 SOUTH AMERICA
9.4.37.5 MIDDLE EAST & AFRICA
10 NORTH AMERICA INTEROPERABILITY MARKET , BY ARCHITECTURE MODEL.
10.1 OVERVIEW
10.2 NORTH AMERICA INTEROPERABILITY MARKET, BY ARCHITECTURE MODEL, 2018-2033 (USD THOUSAND)
10.2.1 HYBRID ARCHITECTURE
10.2.2 CENTRALIZED ARCHITECTURE
10.2.3 DECENTRALIZED ARCHITECTURE
10.3 NORTH AMERICA HYBRID ARCHITECTURE IN INTEROPERABILITY MARKET, BY TYPE, 2018-2033 (USD THOUSAND)
10.3.1 NATIONAL HEALTH DATA REPOSITORIES
10.3.2 CENTRALIZED HIE MODELS
10.4 NORTH AMERICA HYBRID ARCHITECTURE IN INTEROPERABILITY MARKET, BY REGION, 2018-2033 (USD THOUSAND)
10.4.1 NORTH AMERICA
10.4.2 EUROPE
10.4.3 ASIA-PACIFIC
10.4.4 SOUTH AMERICA
10.4.5 MIDDLE EAST & AFRICA
10.5 NORTH AMERICA CENTRALISED ARCHITECTURE IN INTEROPERABILITY MARKET, BY TYPE, 2018-2033 (USD THOUSAND)
10.5.1 FEDERATED HEALTH NETWORKS
10.5.2 PEER-TO-PEER DATA EXCHANGE
10.6 NORTH AMERICA CENTRALIZED ARCHITECTURE IN INTEROPERABILITY MARKET, BY REGION, 2018-2033 (USD THOUSAND)
10.6.1 NORTH AMERICA
10.6.2 EUROPE
10.6.3 ASIA-PACIFIC
10.6.4 SOUTH AMERICA
10.6.5 MIDDLE EAST & AFRICA
10.7 NORTH AMERICA DECENTRALIZED ARCHITECTURE TYPE IN INTEROPERABILITY MARKET, BY TYPE, 2018-2033 (USD THOUSAND)
10.7.1 CENTRAL INDEX + DISTRIBUTED DATA
10.7.2 REGIONAL–NATIONAL HYBRID MODELS
10.8 NORTH AMERICA CENTRALIZED ARCHITECTURE IN INTEROPERABILITY MARKET, BY REGION, 2018-2033 (USD THOUSAND)
10.8.1 NORTH AMERICA
10.8.2 EUROPE
10.8.3 ASIA-PACIFIC
10.8.4 SOUTH AMERICA
10.8.5 MIDDLE EAST & AFRICA
11 NORTH AMERICA INTEROPERABILITY MARKET , BY APPLICATION.
11.1 OVERVIEW
11.2 NORTH AMERICA INTEROPERABILITY MARKET, BY APPLICATION, 2018-2033 (USD THOUSAND)
11.2.1 CLINICAL APPLICATIONS
11.2.2 ADMINISTRATIVE APPLICATIONS
11.2.3 PUBLIC HEALTH & POPULATION HEALTH
11.2.4 FINANCIAL APPLICATIONS
11.2.5 DIGITAL & VIRTUAL CARE
11.2.6 RESEARCH & ANALYTICS
11.2.7 OTHERS
11.3 NORTH AMERICA CLINICAL APPLICATION IN INTEROPERABILITY MARKET, BY TYPE, 2018-2033 (USD THOUSAND)
11.3.1 DIAGNOSIS & CLINICAL DECISION SUPPORT
11.3.2 TREATMENT PLANNING & COORDINATION
11.3.3 CARE TRANSITIONS & REFERRALS
11.3.4 OTHERS
11.4 NORTH AMERICA CLINICAL APPLICATIONS IN INTEROPERABILITY MARKET, BY REGION, 2018-2033 (USD THOUSAND)
11.4.1 NORTH AMERICA
11.4.2 EUROPE
11.4.3 ASIA-PACIFIC
11.4.4 SOUTH AMERICA
11.4.5 MIDDLE EAST & AFRICA
11.5 NORTH AMERICA ADMINISTRATIVE APPLICATION IN INTEROPERABILITY MARKET, BY TYPE, 2018-2033 (USD THOUSAND)
11.5.1 PATIENT REGISTRATION & RECORDS
11.5.2 SCHEDULING & RESOURCE MANAGEMENT
11.5.3 OTHERS
11.6 NORTH AMERICA ADMINISTRATIVE APPLICATIONS IN INTEROPERABILITY MARKET, BY REGION, 2018-2033 (USD THOUSAND)
11.6.1 NORTH AMERICA
11.6.2 EUROPE
11.6.3 ASIA-PACIFIC
11.6.4 SOUTH AMERICA
11.6.5 MIDDLE EAST & AFRICA
11.7 NORTH AMERICA PUBLIC HEALTH & POPULATION HEALTH IN INTEROPERABILITY MARKET, BY TYPE, 2018-2033 (USD THOUSAND)
11.7.1 DISEASE SURVEILLANCE
11.7.2 POPULATION HEALTH ANALYTICS
11.7.3 IMMUNIZATION TRACKING
11.7.4 OTHERS
11.8 NORTH AMERICA PUBLIC HEALTH & POPULATION HEALTH IN INTEROPERABILITY MARKET, BY REGION, 2018-2033 (USD THOUSAND)
11.8.1 NORTH AMERICA
11.8.2 EUROPE
11.8.3 ASIA-PACIFIC
11.8.4 SOUTH AMERICA
11.8.5 MIDDLE EAST & AFRICA
11.9 NORTH AMERICA FINANCIAL APPLICATION IN INTEROPERABILITY MARKET, BY TYPE, 2018-2033 (USD THOUSAND)
11.9.1 REVENUE CYCLE MANAGEMENT (RCM)
11.9.2 BILLING & CLAIMS MANAGEMENT
11.9.3 INSURANCE VERIFICATION
11.9.4 OTHERS
11.1 NORTH AMERICA FINANCIAL APPLICATIONSH IN INTEROPERABILITY MARKET, BY REGION, 2018-2033 (USD THOUSAND)
11.10.1 NORTH AMERICA
11.10.2 EUROPE
11.10.3 ASIA-PACIFIC
11.10.4 SOUTH AMERICA
11.10.5 MIDDLE EAST & AFRICA
11.11 NORTH AMERICA DIGITAL & VIRTUAL CARE IN INTEROPERABILITY MARKET, BY TYPE, 2018-2033 (USD THOUSAND)
11.11.1 REMOTE PATIENT MONITORING
11.11.2 TELEHEALTH INTEROPERABILITY
11.11.3 HOME HEALTHCARE INTEGRATION
11.11.4 OTHERS
11.12 NORTH AMERICA DIGITAL & VIRTUAL CARE IN INTEROPERABILITY MARKET, BY REGION, 2018-2033 (USD THOUSAND)
11.12.1 NORTH AMERICA
11.12.2 EUROPE
11.12.3 ASIA-PACIFIC
11.12.4 SOUTH AMERICA
11.12.5 MIDDLE EAST & AFRICA
11.13 NORTH AMERICA RESEARCH & ANALYTICS TYPE IN INTEROPERABILITY MARKET, BY TYPE, 2018-2033 (USD THOUSAND)
11.13.1 HEALTHCARE ANALYTICS PLATFORMS
11.13.2 REAL-WORLD EVIDENCE (RWE) GENERATION
11.13.3 CLINICAL RESEARCH DATA SHARING
11.13.4 OTHERS
11.14 NORTH AMERICA RESEARCH & ANALYTICS IN INTEROPERABILITY MARKET, BY REGION, 2018-2033 (USD THOUSAND)
11.14.1 NORTH AMERICA
11.14.2 EUROPE
11.14.3 ASIA-PACIFIC
11.14.4 SOUTH AMERICA
11.14.5 MIDDLE EAST & AFRICA
11.15 NORTH AMERICA OTHERS IN INTEROPERABILITY MARKET, BY REGION, 2018-2033 (USD THOUSAND)
11.15.1 NORTH AMERICA
11.15.2 EUROPE
11.15.3 ASIA-PACIFIC
11.15.4 SOUTH AMERICA
11.15.5 MIDDLE EAST & AFRICA
12 NORTH AMERICA INTEROPERABILITY MARKET , BY END USER.
12.1 OVERVIEW
12.2 NORTH AMERICA INTEROPERABILITY MARKET, BY END USER, 2018-2033 (USD THOUSAND)
12.2.1 HEALTHCARE PROVIDERS
12.2.2 GOVERNMENT & PUBLIC HEALTH BODIES
12.2.3 HEALTHCARE PAYERS
12.2.4 LIFE SCIENCES & RESEARCH ORGANIZATIONS
12.2.5 PHARMACIES & PHARMACY NETWORKS
12.2.6 PATIENTS & CONSUMER HEALTH PLATFORMS
12.2.7 OTHERS
12.3 NORTH AMERICA HEALTHCARE PROVIDERS IN INTEROPERABILITY MARKET, BY TYPE, 2018-2033 (USD THOUSAND)
12.3.1 HOSPITALS
12.3.2 CLINICS & AMBULATORY CARE CENTERS
12.3.3 SPECIALTY CARE CENTERS
12.3.4 DIAGNOSTIC & IMAGING CENTERS
12.3.5 OTHERS
12.4 NORTH AMERICA HEALTHCARE PROVIDERS IN INTEROPERABILITY MARKET, BY REGION, 2018-2033 (USD THOUSAND)
12.4.1 NORTH AMERICA
12.4.2 EUROPE
12.4.3 ASIA-PACIFIC
12.4.4 SOUTH AMERICA
12.4.5 MIDDLE EAST & AFRICA
12.5 NORTH AMERICA GOVERNMENT & PUBLIC HEALTH BODIES IN INTEROPERABILITY MARKET, BY TYPE, 2018-2033 (USD THOUSAND)
12.5.1 NATIONAL HEALTH AUTHORITIES
12.5.2 REGIONAL HEALTH DEPARTMENTS
12.5.3 OTHERS
12.6 NORTH AMERICA GOVERNMENT & PUBLIC HEALTH BODIES PROVIDERS IN INTEROPERABILITY MARKET, BY REGION, 2018-2033 (USD THOUSAND)
12.6.1 NORTH AMERICA
12.6.2 EUROPE
12.6.3 ASIA-PACIFIC
12.6.4 SOUTH AMERICA
12.6.5 MIDDLE EAST & AFRICA
12.7 NORTH AMERICA HEALTHCARE PAYERS IN INTEROPERABILITY MARKET, BY TYPE, 2018-2033 (USD THOUSAND)
12.7.1 INSURANCE COMPANIES
12.7.2 THIRD-PARTY ADMINISTRATORS (TPAS)
12.7.3 OTHERS
12.8 NORTH AMERICA HEALTHCARE PAYERS IN INTEROPERABILITY MARKET, BY REGION, 2018-2033 (USD THOUSAND)
12.8.1 NORTH AMERICA
12.8.2 EUROPE
12.8.3 ASIA-PACIFIC
12.8.4 SOUTH AMERICA
12.8.5 MIDDLE EAST & AFRICA
12.9 NORTH AMERICA LIFE SCIENCES & RESEARCH ORGANIZATIONS IN INTEROPERABILITY MARKET, BY TYPE, 2018-2033 (USD THOUSAND)
12.9.1 CONTRACT RESEARCH ORGANIZATIONS (CROS)
12.9.2 RESEARCH INSTITUTES
12.9.3 ACADEMIC MEDICAL CENTERS
12.9.4 OTHERS
12.1 NORTH AMERICA LIFE SCIENCES & RESEARCH ORGANIZATIONS IN INTEROPERABILITY MARKET, BY REGION, 2018-2033 (USD THOUSAND)
12.10.1 NORTH AMERICA
12.10.2 EUROPE
12.10.3 ASIA-PACIFIC
12.10.4 SOUTH AMERICA
12.10.5 MIDDLE EAST & AFRICA
12.11 NORTH AMERICA PHARMACIES & PHARMACY NETWORKS IN INTEROPERABILITY MARKET, BY TYPE, 2018-2033 (USD THOUSAND)
12.11.1 RETAIL PHARMACIES
12.11.2 HOSPITAL PHARMACIES
12.11.3 E-PHARMACY PLATFORMS
12.11.4 OTHERS
12.12 NORTH AMERICA PHARMACIES & PHARMACY NETWORKS IN INTEROPERABILITY MARKET, BY REGION, 2018-2033 (USD THOUSAND)
12.12.1 NORTH AMERICA
12.12.2 EUROPE
12.12.3 ASIA-PACIFIC
12.12.4 SOUTH AMERICA
12.12.5 MIDDLE EAST & AFRICA
12.13 NORTH AMERICA PATIENTS & CONSUMER HEALTH PLATFORMS IN INTEROPERABILITY MARKET, BY TYPE, 2018-2033 (USD THOUSAND)
12.13.1 PATIENT PORTALS
12.13.2 PERSONAL HEALTH RECORD (PHR) PLATFORMS
12.13.3 OTHERS
12.14 NORTH AMERICA PATIENTS & CONSUMER HEALTH PLATFORMS IN INTEROPERABILITY MARKET, BY REGION, 2018-2033 (USD THOUSAND)
12.14.1 NORTH AMERICA
12.14.2 EUROPE
12.14.3 ASIA-PACIFIC
12.14.4 SOUTH AMERICA
12.14.5 MIDDLE EAST & AFRICA
12.15 NORTH AMERICA OTHERS IN INTEROPERABILITY MARKET, BY REGION, 2018-2033 (USD THOUSAND)
12.15.1 NORTH AMERICA
12.15.2 EUROPE
12.15.3 ASIA-PACIFIC
12.15.4 SOUTH AMERICA
12.15.5 MIDDLE EAST & AFRICA
13 NORTH AMERICA INTEROPERABILITY MARKET, BY REGION
13.1 NORTH AMERICA
13.1.1 U.S.
13.1.2 CANADA
13.1.3 MEXICO
14 NORTH AMERICA INTEROPERABILITY MARKET: COMPANY LANDSCAPE
14.1 MANUFACTURER COMPANY SHARE ANALYSIS: GLOBAL
15 SWOT ANALYSIS
16 COMPANY PROFILES
16.1 MICROSOFT
16.1.1 COMPANY SNAPSHOT
16.1.2 REVENUE ANALYSIS
16.1.3 COMPANY SHARE ANALYSIS
16.1.4 PRODUCT PORTFOLIO
16.1.5 RECENT DEVELOPMENT
16.2 ORACLE
16.2.1 COMPANY SNAPSHOT
16.2.2 REVENUE ANALYSIS
16.2.3 COMPANY SHARE ANALYSIS
16.2.4 PRODUCT PORTFOLIO
16.2.5 RECENT DEVELOPMENT
16.3 EPIC SYSTEMS CORPORATION
16.3.1 COMPANY SNAPSHOT
16.3.2 COMPANY SHARE ANALYSIS
16.3.3 PRODUCT PORTFOLIO
16.3.4 RECENT DEVELOPMENT
16.4 INTERSYSTEMS CORPORATION
16.4.1 COMPANY SNAPSHOT
16.4.2 COMPANY SHARE ANALYSIS
16.4.3 PRODUCT PORTFOLIO
16.4.4 RECENT DEVELOPMENT
16.5 ATHENAHEALTH
16.5.1 COMPANY SNAPSHOT
16.5.2 COMPANY SHARE ANALYSIS
16.5.3 PRODUCT PORTFOLIO
16.5.4 RECENT DEVELOPMENT
16.6 AIGILX HEALTH
16.6.1 COMPANY SNAPSHOT
16.6.2 PRODUCT PORTFOLIO
16.6.3 RECENT DEVELOPMENT
16.7 AMAZON WEB SERVICES (AWS).
16.7.1 COMPANY SNAPSHOT
16.7.2 REVENUE ANALYSIS
16.7.3 PRODUCT PORTFOLIO
16.7.4 RECENT DEVELOPMENT
16.8 CITIUSTECH INC
16.8.1 COMPANY SNAPSHOT
16.8.2 PRODUCT PORTFOLIO
16.8.3 RECENT DEVELOPMENT
16.9 CLEARDATA
16.9.1 COMPANY SNAPSHOT
16.9.2 PRODUCT PORTFOLIO
16.9.3 RECENT DEVELOPMENT
16.1 GE HEALTHCARE
16.10.1 COMPANY SNAPSHOT
16.10.2 REVENUE ANALYSIS
16.10.3 PRODUCT PORTFOLIO
16.10.4 RECENT DEVELOPMENT
16.11 GOOGLE LLC.
16.11.1 COMPANY SNAPSHOT
16.11.2 REVENUE ANALYSIS
16.11.3 PRODUCT PORTFOLIO
16.11.4 RECENT DEVELOPMENT
16.12 HEALTH CATALYST
16.12.1 COMPANY SNAPSHOT
16.12.2 REVENUE ANALYSIS
16.12.3 PRODUCT PORTFOLIO
16.12.4 RECENT DEVELOPMENT
16.13 HEALTH GORILLA
16.13.1 COMPANY SNAPSHOT
16.13.2 PRODUCT PORTFOLIO
16.13.3 RECENT DEVELOPMENT
16.14 IBM.
16.14.1 COMPANY SNAPSHOT
16.14.2 REVENUE ANALYSIS
16.14.3 PRODUCT PORTFOLIO
16.14.4 RECENT DEVELOPMENT
16.15 INTERFACEWARE INC.
16.15.1 COMPANY SNAPSHOT
16.15.2 PRODUCT PORTFOLIO
16.15.3 RECENT DEVELOPMENT
16.16 KOCH IP HOLDINGS, LLC
16.16.1 COMPANY SNAPSHOT
16.16.2 PRODUCT PORTFOLIO
16.16.3 RECENT DEVELOPMENT
16.17 KONINKLIJKE PHILIPS N.V.
16.17.1 COMPANY SNAPSHOT
16.17.2 REVENUE ANALYSIS
16.17.3 PRODUCT PORTFOLIO
16.17.4 RECENT DEVELOPMENT
16.18 MCKESSON CORPORATION.
16.18.1 COMPANY SNAPSHOT
16.18.2 REVENUE ANALYSIS
16.18.3 PRODUCT PORTFOLIO
16.18.4 RECENT DEVELOPMENT
16.19 MEDICAL INFORMATION TECHNOLOGY, INC.
16.19.1 COMPANY SNAPSHOT
16.19.2 PRODUCT PORTFOLIO
16.19.3 RECENT DEVELOPMENT
16.2 NXGN MANAGEMENT, LLC
16.20.1 COMPANY SNAPSHOT
16.20.2 PRODUCT PORTFOLIO
16.20.3 RECENT DEVELOPMENT
16.21 ORION HEALTH
16.21.1 COMPANY SNAPSHOT
16.21.2 PRODUCT PORTFOLIO
16.21.3 RECENT DEVELOPMENT
16.22 OSP
16.22.1 COMPANY SNAPSHOT
16.22.2 PRODUCT PORTFOLIO
16.22.3 RECENT DEVELOPMENT
16.23 RHAPSODY
16.23.1 COMPANY SNAPSHOT
16.23.2 PRODUCT PORTFOLIO
16.23.3 RECENT DEVELOPMENT
16.24 SIEMENS HEALTHINEERS AG.
16.24.1 COMPANY SNAPSHOT
16.24.2 REVENUE ANALYSIS
16.24.3 PRODUCT PORTFOLIO
16.24.4 RECENT DEVELOPMENT
16.25 SMILE CDR INC.
16.25.1 COMPANY SNAPSHOT
16.25.2 PRODUCT PORTFOLIO
16.25.3 RECENT DEVELOPMENT
16.26 SURESCRIPTS
16.26.1 COMPANY SNAPSHOT
16.26.2 PRODUCT PORTFOLIO
16.26.3 RECENT DEVELOPMENT
16.27 TRINETX, LLC
16.27.1 COMPANY SNAPSHOT
16.27.2 PRODUCT PORTFOLIO
16.27.3 RECENT DEVELOPMENT
16.28 VERADIGM LLC
16.28.1 COMPANY SNAPSHOT
16.28.2 PRODUCT PORTFOLIO
16.28.3 RECENT DEVELOPMENT
16.29 VERATO
16.29.1 COMPANY SNAPSHOT
16.29.2 PRODUCT PORTFOLIO
16.29.3 RECENT DEVELOPMENT
16.3 1UPHEALTH, INC.
16.30.1 COMPANY SNAPSHOT
16.30.2 PRODUCT PORTFOLIO
16.30.3 RECENT DEVELOPMENT
17 QUESTIONNAIRE
18 RELATED REPORTS
List of Table
TABLE 1 NORTH AMERICA INTEROPERABILITY MARKET, BY COMPONENT TYPE, 2018-2033 (USD THOUSAND)
TABLE 2 NORTH AMERICA SOFTWARE IN INTEROPERABILITY MARKET, BY TYPE, 2018-2033 (USD THOUSAND)
TABLE 3 NORTH AMERICA INTEGRATION & INTEROPERABILITY PLATFORMS IN INTEROPERABILITY MARKET, BY TYPE, 2018-2033 (USD THOUSAND)
TABLE 4 NORTH AMERICA HEALTH INFORMATION EXCHANGE (HIE) SOFTWARE IN INTEROPERABILITY MARKET, BY INSTALLATION TYPE, 2018-2033 (USD THOUSAND)
TABLE 5 NORTH AMERICA STANDARDS-BASED & PROTOCOL INTEROPERABILITY SOFTWARE IN INTEROPERABILITY MARKET, BY TYPE, 2018-2033 (USD THOUSAND)
TABLE 6 NORTH AMERICA EMR / EHR INTEROPERABILITY SOFTWARE IN INTEROPERABILITY MARKET, BY INSTALLATION TYPE, 2018-2033 (USD THOUSAND)
TABLE 7 NORTH AMERICA DATA, IDENTITY & SEMANTIC INTEROPERABILITY SOFTWARE IN INTEROPERABILITY MARKET, BY INSTALLATION TYPE, 2018-2033 (USD THOUSAND)
TABLE 8 NORTH AMERICA MEDICAL DEVICE & CONNECTED CARE INTEROPERABILITY SOFTWARE IN INTEROPERABILITY MARKET, BY UV STABILIZATION TECHNOLOGY, 2018-2033 (USD THOUSAND)
TABLE 9 NORTH AMERICA SOFTWARE IN INTEROPERABILITY MARKET, BY REGION, 2018-2033 (USD THOUSAND)
TABLE 10 NORTH AMERICA SERVICE IN INTEROPERABILITY MARKET, BY TYPE, 2018-2033 (USD THOUSAND)
TABLE 11 NORTH AMERICA SYSTEM INTEGRATION SERVICES IN INTEROPERABILITY MARKET, BY TYPE, 2018-2033 (USD THOUSAND)
TABLE 12 NORTH AMERICA MANAGED SERVICES IN INTEROPERABILITY MARKET, BY TYPE, 2018-2033 (USD THOUSAND)
TABLE 13 NORTH AMERICA PROFESSIONAL SERVICES IN INTEROPERABILITY MARKET, BY TYPE, 2018-2033 (USD THOUSAND)
TABLE 14 NORTH AMERICA SUPPORT & MAINTENANCE SERVICES IN INTEROPERABILITY MARKET, BY TYPE, 2018-2033 (USD THOUSAND)
TABLE 15 NORTH AMERICA SERVICES IN INTEROPERABILITY MARKET, BY REGION, 2018-2033 (USD THOUSAND)
TABLE 16 NORTH AMERICA INTEROPERABILITY MARKET, BY INTEROPERABILITY LEVEL, 2018-2033 (USD THOUSAND)
TABLE 17 NORTH AMERICA FOUNDATIONAL INTEROPERABILITY IN INTEROPERABILITY MARKET, BY TYPE, 2018-2033 (USD THOUSAND)
TABLE 18 NORTH AMERICA FOUNDATIONAL INTEROPERABILITY IN INTEROPERABILITY MARKET, BY REGION, 2018-2033 (USD THOUSAND)
TABLE 19 NORTH AMERICA STRUCTURAL INTEROPERABILITY IN INTEROPERABILITY MARKET, BY TYPE, 2018-2033 (USD THOUSAND)
TABLE 20 NORTH AMERICA STRUCTURAL INTEROPERABILITY IN INTEROPERABILITY MARKET, BY REGION, 2018-2033 (USD THOUSAND)
TABLE 21 NORTH AMERICA ORGANIZATIONAL INTEROPERABILITY IN INTEROPERABILITY MARKET, BY APPLICATION, 2018-2033 (USD THOUSAND)
TABLE 22 NORTH AMERICA ORGANIZATIONAL INTEROPERABILITY IN INTEROPERABILITY MARKET, BY REGION, 2018-2033 (USD THOUSAND)
TABLE 23 NORTH AMERICA SEMANTIC INTEROPERABILITY IN INTEROPERABILITY MARKET, BY PRODUCT, 2018-2033 (USD THOUSAND)
TABLE 24 NORTH AMERICA ORGANIZATIONAL INTEROPERABILITY IN INTEROPERABILITY MARKET, BY REGION, 2018-2033 (USD THOUSAND)
TABLE 25 NORTH AMERICA INTEROPERABILITY MARKET, BY DEPLOYMENT MODEL, 2018-2033 (USD THOUSAND)
TABLE 26 NORTH AMERICA ON-PREMISES IN INTEROPERABILITY MARKET, BY TYPE, 2018-2033 (USD THOUSAND)
TABLE 27 NORTH AMERICA ON-PREMISE IN INTEROPERABILITY MARKET, BY REGION, 2018-2033 (USD THOUSAND)
TABLE 28 NORTH AMERICA CLOUD-BASED IN INTEROPERABILITY MARKET, BY TYPE, 2018-2033 (USD THOUSAND)
TABLE 29 NORTH AMERICA CLOUD-BASED IN INTEROPERABILITY MARKET, BY REGION, 2018-2033 (USD THOUSAND)
TABLE 30 NORTH AMERICA EDGE & GATEWAY-BASED DEPLOYMENT IN INTEROPERABILITY MARKET, BY TYPE, 2018-2033 (USD THOUSAND)
TABLE 31 NORTH AMERICA EDGE & GATEWAY-BASED DEPLOYMENT IN INTEROPERABILITY MARKET, BY REGION, 2018-2033 (USD THOUSAND)
TABLE 32 NORTH AMERICA INTEROPERABILITY MARKET, BY COMPONENT TYPE, 2018-2033 (USD THOUSAND)
TABLE 33 NORTH AMERICA SOFTWARE IN INTEROPERABILITY MARKET, BY TYPE, 2018-2033 (USD THOUSAND)
TABLE 34 NORTH AMERICA INTEGRATION & INTEROPERABILITY PLATFORMS IN INTEROPERABILITY MARKET, BY TYPE, 2018-2033 (USD THOUSAND)
TABLE 35 NORTH AMERICA HEALTH INFORMATION EXCHANGE (HIE) SOFTWARE IN INTEROPERABILITY MARKET, BY INSTALLATION TYPE, 2018-2033 (USD THOUSAND)
TABLE 36 NORTH AMERICA STANDARDS-BASED & PROTOCOL INTEROPERABILITY SOFTWARE IN INTEROPERABILITY MARKET, BY TYPE, 2018-2033 (USD THOUSAND)
TABLE 37 NORTH AMERICA EMR / EHR INTEROPERABILITY SOFTWAREG IN INTEROPERABILITY MARKET, BY INSTALLATION TYPE, 2018-2033 (USD THOUSAND)
TABLE 38 NORTH AMERICA DATA, IDENTITY & SEMANTIC INTEROPERABILITY SOFTWARE IN INTEROPERABILITY MARKET, BY INSTALLATION TYPE, 2018-2033 (USD THOUSAND)
TABLE 39 NORTH AMERICA MEDICAL DEVICE & CONNECTED CARE INTEROPERABILITY SOFTWARE IN INTEROPERABILITY MARKET, BY UV STABILIZATION TECHNOLOGY, 2018-2033 (USD THOUSAND)
TABLE 40 NORTH AMERICA SOFTWARE IN INTEROPERABILITY MARKET, BY REGION, 2018-2033 (USD THOUSAND)
TABLE 41 NORTH AMERICA SERVICE IN INTEROPERABILITY MARKET, BY TYPE, 2018-2033 (USD THOUSAND)
TABLE 42 NORTH AMERICA SYSTEM INTEGRATION SERVICES IN INTEROPERABILITY MARKET, BY TYPE, 2018-2033 (USD THOUSAND)
TABLE 43 NORTH AMERICA MANAGED SERVICES IN INTEROPERABILITY MARKET, BY TYPE, 2018-2033 (USD THOUSAND)
TABLE 44 NORTH AMERICA PROFESSIONAL SERVICES IN INTEROPERABILITY MARKET, BY TYPE, 2018-2033 (USD THOUSAND)
TABLE 45 NORTH AMERICA SUPPORT & MAINTENANCE SERVICES IN INTEROPERABILITY MARKET, BY TYPE, 2018-2033 (USD THOUSAND)
TABLE 46 NORTH AMERICA SERVICES IN INTEROPERABILITY MARKET, BY REGION, 2018-2033 (USD THOUSAND)
TABLE 47 NORTH AMERICA INTEROPERABILITY MARKET, BY INTEROPERABILITY LEVEL, 2018-2033 (USD THOUSAND)
TABLE 48 NORTH AMERICA FOUNDATIONAL INTEROPERABILITY IN INTEROPERABILITY MARKET, BY TYPE, 2018-2033 (USD THOUSAND)
TABLE 49 NORTH AMERICA FOUNDATIONAL INTEROPERABILITY IN INTEROPERABILITY MARKET, BY REGION, 2018-2033 (USD THOUSAND)
TABLE 50 NORTH AMERICA STRUCTURAL INTEROPERABILITY IN INTEROPERABILITY MARKET, BY TYPE, 2018-2033 (USD THOUSAND)
TABLE 51 NORTH AMERICA STRUCTURAL INTEROPERABILITY IN INTEROPERABILITY MARKET, BY REGION, 2018-2033 (USD THOUSAND)
TABLE 52 NORTH AMERICA ORGANISATIONAL INTEROPERABILITY IN INTEROPERABILITY MARKET, BY APPLICATION, 2018-2033 (USD THOUSAND)
TABLE 53 NORTH AMERICA ORGANIZATIONAL INTEROPERABILITY IN INTEROPERABILITY MARKET, BY REGION, 2018-2033 (USD THOUSAND)
TABLE 54 NORTH AMERICA SEMENTIC INTEROPERABILITY IN INTEROPERABILITY MARKET, BY PRODUCT, 2018-2033 (USD THOUSAND)
TABLE 55 NORTH AMERICA ORGANIZATIONAL INTEROPERABILITY IN INTEROPERABILITY MARKET, BY REGION, 2018-2033 (USD THOUSAND)
TABLE 56 NORTH AMERICA INTEROPERABILITY MARKET, BY DEPLOYMENT MODEL, 2018-2033 (USD THOUSAND)
TABLE 57 NORTH AMERICA ON-PREMISES IN INTEROPERABILITY MARKET, BY TYPE, 2018-2033 (USD THOUSAND)
TABLE 58 NORTH AMERICA ON-PREMISE IN INTEROPERABILITY MARKET, BY REGION, 2018-2033 (USD THOUSAND)
TABLE 59 NORTH AMERICA CLOUD-BASED IN INTEROPERABILITY MARKET, BY TYPE, 2018-2033 (USD THOUSAND)
TABLE 60 NORTH AMERICA CLOUD-BASED IN INTEROPERABILITY MARKET, BY REGION, 2018-2033 (USD THOUSAND)
TABLE 61 NORTH AMERICA EDGE & GATEWAY-BASED DEPLOYMENT IN INTEROPERABILITY MARKET, BY TYPE, 2018-2033 (USD THOUSAND)
TABLE 62 NORTH AMERICA EDGE & GATEWAY-BASED DEPLOYMENT IN INTEROPERABILITY MARKET, BY REGION, 2018-2033 (USD THOUSAND)
TABLE 63 NORTH AMERICA INTEROPERABILITY MARKET, BY ARCHITECTURE MODEL, 2018-2033 (USD THOUSAND)
TABLE 64 NORTH AMERICA HYBRID ARCHITECTURE IN INTEROPERABILITY MARKET, BY TYPE, 2018-2033 (USD THOUSAND)
TABLE 65 NORTH AMERICA HYBRID ARCHITECTURE IN INTEROPERABILITY MARKET, BY REGION, 2018-2033 (USD THOUSAND)
TABLE 66 NORTH AMERICA CENTRALISED ARCHITECTURE IN INTEROPERABILITY MARKET, BY TYPE, 2018-2033 (USD THOUSAND)
TABLE 67 NORTH AMERICA CENTRALIZED ARCHITECTURE IN INTEROPERABILITY MARKET, BY REGION, 2018-2033 (USD THOUSAND)
TABLE 68 NORTH AMERICA DECENTRALIZED ARCHITECTURE TYPE IN INTEROPERABILITY MARKET, BY TYPE, 2018-2033 (USD THOUSAND)
TABLE 69 NORTH AMERICA CENTRALIZED ARCHITECTURE IN INTEROPERABILITY MARKET, BY REGION, 2018-2033 (USD THOUSAND)
TABLE 70 NORTH AMERICA INTEROPERABILITY MARKET, BY APPLICATION, 2018-2033 (USD THOUSAND)
TABLE 71 NORTH AMERICA CLINICAL APPLICATION IN INTEROPERABILITY MARKET, BY TYPE, 2018-2033 (USD THOUSAND)
TABLE 72 NORTH AMERICA CLINICAL APPLICATIONS IN INTEROPERABILITY MARKET, BY REGION, 2018-2033 (USD THOUSAND)
TABLE 73 NORTH AMERICA ADMINISTRATIVE APPLICATION IN INTEROPERABILITY MARKET, BY TYPE, 2018-2033 (USD THOUSAND)
TABLE 74 NORTH AMERICA ADMINISTRATIVE APPLICATIONS IN INTEROPERABILITY MARKET, BY REGION, 2018-2033 (USD THOUSAND)
TABLE 75 NORTH AMERICA PUBLIC HEALTH & POPULATION HEALTH IN INTEROPERABILITY MARKET, BY TYPE, 2018-2033 (USD THOUSAND)
TABLE 76 NORTH AMERICA PUBLIC HEALTH & POPULATION HEALTH IN INTEROPERABILITY MARKET, BY REGION, 2018-2033 (USD THOUSAND)
TABLE 77 NORTH AMERICA FINANCIAL APPLICATION IN INTEROPERABILITY MARKET, BY TYPE, 2018-2033 (USD THOUSAND)
TABLE 78 NORTH AMERICA FINANCIAL APPLICATIONSH IN INTEROPERABILITY MARKET, BY REGION, 2018-2033 (USD THOUSAND)
TABLE 79 NORTH AMERICA DIGITAL & VIRTUAL CARE IN INTEROPERABILITY MARKET, BY TYPE, 2018-2033 (USD THOUSAND)
TABLE 80 NORTH AMERICA DIGITAL & VIRTUAL CARE IN INTEROPERABILITY MARKET, BY REGION, 2018-2033 (USD THOUSAND)
TABLE 81 NORTH AMERICA RESEARCH & ANALYTICS TYPE IN INTEROPERABILITY MARKET, BY TYPE, 2018-2033 (USD THOUSAND)
TABLE 82 NORTH AMERICA RESEARCH & ANALYTICS IN INTEROPERABILITY MARKET, BY REGION, 2018-2033 (USD THOUSAND)
TABLE 83 NORTH AMERICA OTHERS IN INTEROPERABILITY MARKET, BY REGION, 2018-2033 (USD THOUSAND)
TABLE 84 NORTH AMERICA INTEROPERABILITY MARKET, BY END USER, 2018-2033 (USD THOUSAND)
TABLE 85 NORTH AMERICA HEALTHCARE PROVIDERS IN INTEROPERABILITY MARKET, BY TYPE, 2018-2033 (USD THOUSAND)
TABLE 86 NORTH AMERICA HEALTHCARE PROVIDERS IN INTEROPERABILITY MARKET, BY REGION, 2018-2033 (USD THOUSAND)
TABLE 87 NORTH AMERICA GOVERNMENT & PUBLIC HEALTH BODIES IN INTEROPERABILITY MARKET, BY TYPE, 2018-2033 (USD THOUSAND)
TABLE 88 NORTH AMERICA GOVERNMENT & PUBLIC HEALTH BODIES PROVIDERS IN INTEROPERABILITY MARKET, BY REGION, 2018-2033 (USD THOUSAND)
TABLE 89 NORTH AMERICA HEALTHCARE PAYERS IN INTEROPERABILITY MARKET, BY TYPE, 2018-2033 (USD THOUSAND)
TABLE 90 NORTH AMERICA HEALTHCARE PAYERS IN INTEROPERABILITY MARKET, BY REGION, 2018-2033 (USD THOUSAND)
TABLE 91 NORTH AMERICA LIFE SCIENCES & RESEARCH ORGANIZATIONS IN INTEROPERABILITY MARKET, BY TYPE, 2018-2033 (USD THOUSAND)
TABLE 92 NORTH AMERICA LIFE SCIENCES & RESEARCH ORGANIZATIONS IN INTEROPERABILITY MARKET, BY REGION, 2018-2033 (USD THOUSAND)
TABLE 93 NORTH AMERICA PHARMACIES & PHARMACY NETWORKS IN INTEROPERABILITY MARKET, BY TYPE, 2018-2033 (USD THOUSAND)
TABLE 94 NORTH AMERICA PHARMACIES & PHARMACY NETWORKS IN INTEROPERABILITY MARKET, BY REGION, 2018-2033 (USD THOUSAND)
TABLE 95 NORTH AMERICA PATIENTS & CONSUMER HEALTH PLATFORMS IN INTEROPERABILITY MARKET, BY TYPE, 2018-2033 (USD THOUSAND)
TABLE 96 NORTH AMERICA PATIENTS & CONSUMER HEALTH PLATFORMS IN INTEROPERABILITY MARKET, BY REGION, 2018-2033 (USD THOUSAND)
TABLE 97 NORTH AMERICA OTHERS IN INTEROPERABILITY MARKET, BY REGION, 2018-2033 (USD THOUSAND)
TABLE 98 NORTH AMERICA INTEROPERABILITY MARKET, 2018-2033 (USD THOUSAND)
TABLE 99 NORTH AMERICA INTEROPERABILITY MARKET, BY COUNTRY, 2018-2033 (USD THOUSAND)
TABLE 100 COUNTRY
TABLE 101 NORTH AMERICA INTEROPERABILITY MARKET, BY COMPONENT TYPE, 2018-2033 (USD THOUSAND)
TABLE 102 NORTH AMERICA SOFTWARE IN INTEROPERABILITY MARKET, BY TYPE, 2018-2033 (USD THOUSAND)
TABLE 103 NORTH AMERICA INTEGRATION & INTEROPERABILITY PLATFORMS IN INTEROPERABILITY MARKET, BY TYPE, 2018-2033 (USD THOUSAND)
TABLE 104 NORTH AMERICA HEALTH INFORMATION EXCHANGE (HIE) SOFTWARE IN INTEROPERABILITY MARKET, BY INSTALLATION TYPE, 2018-2033 (USD THOUSAND)
TABLE 105 NORTH AMERICA STANDARDS-BASED & PROTOCOL INTEROPERABILITY SOFTWARE IN INTEROPERABILITY MARKET, BY TYPE, 2018-2033 (USD THOUSAND)
TABLE 106 NORTH AMERICA EMR / EHR INTEROPERABILITY SOFTWAREG IN INTEROPERABILITY MARKET, BY INSTALLATION TYPE, 2018-2033 (USD THOUSAND)
TABLE 107 NORTH AMERICA DATA, IDENTITY & SEMANTIC INTEROPERABILITY SOFTWARE IN INTEROPERABILITY MARKET, BY INSTALLATION TYPE, 2018-2033 (USD THOUSAND)
TABLE 108 NORTH AMERICA MEDICAL DEVICE & CONNECTED CARE INTEROPERABILITY SOFTWARE IN INTEROPERABILITY MARKET, BY UV STABILIZATION TECHNOLOGY, 2018-2033 (USD THOUSAND)
TABLE 109 NORTH AMERICA SERVICE IN INTEROPERABILITY MARKET, BY TYPE, 2018-2033 (USD THOUSAND)
TABLE 110 NORTH AMERICA SYSTEM INTEGRATION SERVICES IN INTEROPERABILITY MARKET, BY TYPE, 2018-2033 (USD THOUSAND)
TABLE 111 NORTH AMERICA MANAGED SERVICES IN INTEROPERABILITY MARKET, BY TYPE, 2018-2033 (USD THOUSAND)
TABLE 112 NORTH AMERICA PROFESSIONAL SERVICES IN INTEROPERABILITY MARKET, BY TYPE, 2018-2033 (USD THOUSAND)
TABLE 113 NORTH AMERICA SUPPORT & MAINTENANCE SERVICES IN INTEROPERABILITY MARKET, BY TYPE, 2018-2033 (USD THOUSAND)
TABLE 114 NORTH AMERICA INTEROPERABILITY MARKET, BY INTEROPERABILITY LEVEL, 2018-2033 (USD THOUSAND)
TABLE 115 NORTH AMERICA FOUNDATIONAL INTEROPERABILITY IN INTEROPERABILITY MARKET, BY TYPE, 2018-2033 (USD THOUSAND)
TABLE 116 NORTH AMERICA STRUCTURAL INTEROPERABILITY IN INTEROPERABILITY MARKET, BY TYPE, 2018-2033 (USD THOUSAND)
TABLE 117 NORTH AMERICA ORGANISATIONAL INTEROPERABILITY IN INTEROPERABILITY MARKET, BY APPLICATION, 2018-2033 (USD THOUSAND)
TABLE 118 NORTH AMERICA SEMENTIC INTEROPERABILITY IN INTEROPERABILITY MARKET, BY PRODUCT, 2018-2033 (USD THOUSAND)
TABLE 119 NORTH AMERICA INTEROPERABILITY MARKET, BY DEPLOYMENT MODEL, 2018-2033 (USD THOUSAND)
TABLE 120 NORTH AMERICA ON-PREMISES IN INTEROPERABILITY MARKET, BY TYPE, 2018-2033 (USD THOUSAND)
TABLE 121 NORTH AMERICA CLOUD-BASED IN INTEROPERABILITY MARKET, BY TYPE, 2018-2033 (USD THOUSAND)
TABLE 122 NORTH AMERICA EDGE & GATEWAY-BASED DEPLOYMENT IN INTEROPERABILITY MARKET, BY TYPE, 2018-2033 (USD THOUSAND)
TABLE 123 NORTH AMERICA INTEROPERABILITY MARKET, BY ARCHITECTURE MODEL, 2018-2033 (USD THOUSAND)
TABLE 124 NORTH AMERICA HYBRID ARCHITECTURE IN INTEROPERABILITY MARKET, BY TYPE, 2018-2033 (USD THOUSAND)
TABLE 125 NORTH AMERICA CENTRALISED ARCHITECTURE IN INTEROPERABILITY MARKET, BY TYPE, 2018-2033 (USD THOUSAND)
TABLE 126 NORTH AMERICA DECENTRALIZED ARCHITECTURE TYPE IN INTEROPERABILITY MARKET, BY TYPE, 2018-2033 (USD THOUSAND)
TABLE 127 NORTH AMERICA INTEROPERABILITY MARKET, BY APPLICATION, 2018-2033 (USD THOUSAND)
TABLE 128 NORTH AMERICA CLINICAL APPLICATION IN INTEROPERABILITY MARKET, BY TYPE, 2018-2033 (USD THOUSAND)
TABLE 129 NORTH AMERICA ADMINISTRATIVE APPLICATION IN INTEROPERABILITY MARKET, BY TYPE, 2018-2033 (USD THOUSAND)
TABLE 130 NORTH AMERICA PUBLIC HEALTH & POPULATION HEALTH IN INTEROPERABILITY MARKET, BY TYPE, 2018-2033 (USD THOUSAND)
TABLE 131 NORTH AMERICA FINANCIAL APPLICATION IN INTEROPERABILITY MARKET, BY TYPE, 2018-2033 (USD THOUSAND)
TABLE 132 NORTH AMERICA DIGITAL & VIRTUAL CARE IN INTEROPERABILITY MARKET, BY TYPE, 2018-2033 (USD THOUSAND)
TABLE 133 NORTH AMERICA RESEARCH & ANALYTICS TYPE IN INTEROPERABILITY MARKET, BY TYPE, 2018-2033 (USD THOUSAND)
TABLE 134 NORTH AMERICA INTEROPERABILITY MARKET, BY END USER, 2018-2033 (USD THOUSAND)
TABLE 135 NORTH AMERICA HEALTHCARE PROVIDERS IN INTEROPERABILITY MARKET, BY TYPE, 2018-2033 (USD THOUSAND)
TABLE 136 NORTH AMERICA GOVERNMENT & PUBLIC HEALTH BODIES IN INTEROPERABILITY MARKET, BY TYPE, 2018-2033 (USD THOUSAND)
TABLE 137 NORTH AMERICA HEALTHCARE PAYERS IN INTEROPERABILITY MARKET, BY TYPE, 2018-2033 (USD THOUSAND)
TABLE 138 NORTH AMERICA LIFE SCIENCES & RESEARCH ORGANIZATIONS IN INTEROPERABILITY MARKET, BY TYPE, 2018-2033 (USD THOUSAND)
TABLE 139 NORTH AMERICA PHARMACIES & PHARMACY NETWORKS IN INTEROPERABILITY MARKET, BY TYPE, 2018-2033 (USD THOUSAND)
TABLE 140 NORTH AMERICA PATIENTS & CONSUMER HEALTH PLATFORMS IN INTEROPERABILITY MARKET, BY TYPE, 2018-2033 (USD THOUSAND)
TABLE 141 U.S. INTEROPERABILITY MARKET, BY COMPONENT TYPE, 2018-2033 (USD THOUSAND)
TABLE 142 U.S. SOFTWARE IN INTEROPERABILITY MARKET, BY TYPE, 2018-2033 (USD THOUSAND)
TABLE 143 U.S. INTEGRATION & INTEROPERABILITY PLATFORMS IN INTEROPERABILITY MARKET, BY TYPE, 2018-2033 (USD THOUSAND)
TABLE 144 U.S. HEALTH INFORMATION EXCHANGE (HIE) SOFTWARE IN INTEROPERABILITY MARKET, BY INSTALLATION TYPE, 2018-2033 (USD THOUSAND)
TABLE 145 U.S. STANDARDS-BASED & PROTOCOL INTEROPERABILITY SOFTWARE IN INTEROPERABILITY MARKET, BY TYPE, 2018-2033 (USD THOUSAND)
TABLE 146 U.S. EMR / EHR INTEROPERABILITY SOFTWAREG IN INTEROPERABILITY MARKET, BY INSTALLATION TYPE, 2018-2033 (USD THOUSAND)
TABLE 147 U.S. DATA, IDENTITY & SEMANTIC INTEROPERABILITY SOFTWARE IN INTEROPERABILITY MARKET, BY INSTALLATION TYPE, 2018-2033 (USD THOUSAND)
TABLE 148 U.S. MEDICAL DEVICE & CONNECTED CARE INTEROPERABILITY SOFTWARE IN INTEROPERABILITY MARKET, BY UV STABILIZATION TECHNOLOGY, 2018-2033 (USD THOUSAND)
TABLE 149 U.S. SERVICE IN INTEROPERABILITY MARKET, BY TYPE, 2018-2033 (USD THOUSAND)
TABLE 150 U.S. SYSTEM INTEGRATION SERVICES IN INTEROPERABILITY MARKET, BY TYPE, 2018-2033 (USD THOUSAND)
TABLE 151 U.S. MANAGED SERVICES IN INTEROPERABILITY MARKET, BY TYPE, 2018-2033 (USD THOUSAND)
TABLE 152 U.S. PROFESSIONAL SERVICES IN INTEROPERABILITY MARKET, BY TYPE, 2018-2033 (USD THOUSAND)
TABLE 153 U.S. SUPPORT & MAINTENANCE SERVICES IN INTEROPERABILITY MARKET, BY TYPE, 2018-2033 (USD THOUSAND)
TABLE 154 U.S. INTEROPERABILITY MARKET, BY INTEROPERABILITY LEVEL, 2018-2033 (USD THOUSAND)
TABLE 155 U.S. FOUNDATIONAL INTEROPERABILITY IN INTEROPERABILITY MARKET, BY TYPE, 2018-2033 (USD THOUSAND)
TABLE 156 U.S. STRUCTURAL INTEROPERABILITY IN INTEROPERABILITY MARKET, BY TYPE, 2018-2033 (USD THOUSAND)
TABLE 157 U.S. ORGANISATIONAL INTEROPERABILITY IN INTEROPERABILITY MARKET, BY APPLICATION, 2018-2033 (USD THOUSAND)
TABLE 158 U.S. SEMENTIC INTEROPERABILITY IN INTEROPERABILITY MARKET, BY PRODUCT, 2018-2033 (USD THOUSAND)
TABLE 159 U.S. INTEROPERABILITY MARKET, BY DEPLOYMENT MODEL, 2018-2033 (USD THOUSAND)
TABLE 160 U.S. ON-PREMISES IN INTEROPERABILITY MARKET, BY TYPE, 2018-2033 (USD THOUSAND)
TABLE 161 U.S. CLOUD-BASED IN INTEROPERABILITY MARKET, BY TYPE, 2018-2033 (USD THOUSAND)
TABLE 162 U.S. EDGE & GATEWAY-BASED DEPLOYMENT IN INTEROPERABILITY MARKET, BY TYPE, 2018-2033 (USD THOUSAND)
TABLE 163 U.S. INTEROPERABILITY MARKET, BY ARCHITECTURE MODEL, 2018-2033 (USD THOUSAND)
TABLE 164 U.S. HYBRID ARCHITECTURE IN INTEROPERABILITY MARKET, BY TYPE, 2018-2033 (USD THOUSAND)
TABLE 165 U.S. CENTRALISED ARCHITECTURE IN INTEROPERABILITY MARKET, BY TYPE, 2018-2033 (USD THOUSAND)
TABLE 166 U.S. DECENTRALIZED ARCHITECTURE TYPE IN INTEROPERABILITY MARKET, BY TYPE, 2018-2033 (USD THOUSAND)
TABLE 167 U.S. INTEROPERABILITY MARKET, BY APPLICATION, 2018-2033 (USD THOUSAND)
TABLE 168 U.S. CLINICAL APPLICATION IN INTEROPERABILITY MARKET, BY TYPE, 2018-2033 (USD THOUSAND)
TABLE 169 U.S. ADMINISTRATIVE APPLICATION IN INTEROPERABILITY MARKET, BY TYPE, 2018-2033 (USD THOUSAND)
TABLE 170 U.S. PUBLIC HEALTH & POPULATION HEALTH IN INTEROPERABILITY MARKET, BY TYPE, 2018-2033 (USD THOUSAND)
TABLE 171 U.S. FINANCIAL APPLICATION IN INTEROPERABILITY MARKET, BY TYPE, 2018-2033 (USD THOUSAND)
TABLE 172 U.S. DIGITAL & VIRTUAL CARE IN INTEROPERABILITY MARKET, BY TYPE, 2018-2033 (USD THOUSAND)
TABLE 173 U.S. RESEARCH & ANALYTICS TYPE IN INTEROPERABILITY MARKET, BY TYPE, 2018-2033 (USD THOUSAND)
TABLE 174 U.S. INTEROPERABILITY MARKET, BY END USER, 2018-2033 (USD THOUSAND)
TABLE 175 U.S. HEALTHCARE PROVIDERS IN INTEROPERABILITY MARKET, BY TYPE, 2018-2033 (USD THOUSAND)
TABLE 176 U.S. GOVERNMENT & PUBLIC HEALTH BODIES IN INTEROPERABILITY MARKET, BY TYPE, 2018-2033 (USD THOUSAND)
TABLE 177 U.S. HEALTHCARE PAYERS IN INTEROPERABILITY MARKET, BY TYPE, 2018-2033 (USD THOUSAND)
TABLE 178 U.S. LIFE SCIENCES & RESEARCH ORGANIZATIONS IN INTEROPERABILITY MARKET, BY TYPE, 2018-2033 (USD THOUSAND)
TABLE 179 U.S. PHARMACIES & PHARMACY NETWORKS IN INTEROPERABILITY MARKET, BY TYPE, 2018-2033 (USD THOUSAND)
TABLE 180 U.S. PATIENTS & CONSUMER HEALTH PLATFORMS IN INTEROPERABILITY MARKET, BY TYPE, 2018-2033 (USD THOUSAND)
TABLE 181 CANADAINTEROPERABILITY MARKET, BY COMPONENT TYPE, 2018-2033 (USD THOUSAND)
TABLE 182 CANADASOFTWARE IN INTEROPERABILITY MARKET, BY TYPE, 2018-2033 (USD THOUSAND)
TABLE 183 CANADAINTEGRATION & INTEROPERABILITY PLATFORMS IN INTEROPERABILITY MARKET, BY TYPE, 2018-2033 (USD THOUSAND)
TABLE 184 CANADAHEALTH INFORMATION EXCHANGE (HIE) SOFTWARE IN INTEROPERABILITY MARKET, BY INSTALLATION TYPE, 2018-2033 (USD THOUSAND)
TABLE 185 CANADASTANDARDS-BASED & PROTOCOL INTEROPERABILITY SOFTWARE IN INTEROPERABILITY MARKET, BY TYPE, 2018-2033 (USD THOUSAND)
TABLE 186 CANADAEMR / EHR INTEROPERABILITY SOFTWAREG IN INTEROPERABILITY MARKET, BY INSTALLATION TYPE, 2018-2033 (USD THOUSAND)
TABLE 187 CANADADATA, IDENTITY & SEMANTIC INTEROPERABILITY SOFTWARE IN INTEROPERABILITY MARKET, BY INSTALLATION TYPE, 2018-2033 (USD THOUSAND)
TABLE 188 CANADAMEDICAL DEVICE & CONNECTED CARE INTEROPERABILITY SOFTWARE IN INTEROPERABILITY MARKET, BY UV STABILIZATION TECHNOLOGY, 2018-2033 (USD THOUSAND)
TABLE 189 CANADASERVICE IN INTEROPERABILITY MARKET, BY TYPE, 2018-2033 (USD THOUSAND)
TABLE 190 CANADASYSTEM INTEGRATION SERVICES IN INTEROPERABILITY MARKET, BY TYPE, 2018-2033 (USD THOUSAND)
TABLE 191 CANADAMANAGED SERVICES IN INTEROPERABILITY MARKET, BY TYPE, 2018-2033 (USD THOUSAND)
TABLE 192 CANADAPROFESSIONAL SERVICES IN INTEROPERABILITY MARKET, BY TYPE, 2018-2033 (USD THOUSAND)
TABLE 193 CANADASUPPORT & MAINTENANCE SERVICES IN INTEROPERABILITY MARKET, BY TYPE, 2018-2033 (USD THOUSAND)
TABLE 194 CANADA INTEROPERABILITY MARKET, BY INTEROPERABILITY LEVEL, 2018-2033 (USD THOUSAND)
TABLE 195 CANADAFOUNDATIONAL INTEROPERABILITY IN INTEROPERABILITY MARKET, BY TYPE, 2018-2033 (USD THOUSAND)
TABLE 196 CANADASTRUCTURAL INTEROPERABILITY IN INTEROPERABILITY MARKET, BY TYPE, 2018-2033 (USD THOUSAND)
TABLE 197 CANADAORGANISATIONAL INTEROPERABILITY IN INTEROPERABILITY MARKET, BY APPLICATION, 2018-2033 (USD THOUSAND)
TABLE 198 CANADASEMENTIC INTEROPERABILITY IN INTEROPERABILITY MARKET, BY PRODUCT, 2018-2033 (USD THOUSAND)
TABLE 199 CANADAINTEROPERABILITY MARKET, BY DEPLOYMENT MODEL, 2018-2033 (USD THOUSAND)
TABLE 200 CANADAON-PREMISES IN INTEROPERABILITY MARKET, BY TYPE, 2018-2033 (USD THOUSAND)
TABLE 201 CANADACLOUD-BASED IN INTEROPERABILITY MARKET, BY TYPE, 2018-2033 (USD THOUSAND)
TABLE 202 CANADAEDGE & GATEWAY-BASED DEPLOYMENT IN INTEROPERABILITY MARKET, BY TYPE, 2018-2033 (USD THOUSAND)
TABLE 203 CANADAINTEROPERABILITY MARKET, BY ARCHITECTURE MODEL, 2018-2033 (USD THOUSAND)
TABLE 204 CANADAHYBRID ARCHITECTURE IN INTEROPERABILITY MARKET, BY TYPE, 2018-2033 (USD THOUSAND)
TABLE 205 CANADACENTRALISED ARCHITECTURE IN INTEROPERABILITY MARKET, BY TYPE, 2018-2033 (USD THOUSAND)
TABLE 206 CANADADECENTRALIZED ARCHITECTURE TYPE IN INTEROPERABILITY MARKET, BY TYPE, 2018-2033 (USD THOUSAND)
TABLE 207 CANADAINTEROPERABILITY MARKET, BY APPLICATION, 2018-2033 (USD THOUSAND)
TABLE 208 CANADACLINICAL APPLICATION IN INTEROPERABILITY MARKET, BY TYPE, 2018-2033 (USD THOUSAND)
TABLE 209 CANADAADMINISTRATIVE APPLICATION IN INTEROPERABILITY MARKET, BY TYPE, 2018-2033 (USD THOUSAND)
TABLE 210 CANADAPUBLIC HEALTH & POPULATION HEALTH IN INTEROPERABILITY MARKET, BY TYPE, 2018-2033 (USD THOUSAND)
TABLE 211 CANADAFINANCIAL APPLICATION IN INTEROPERABILITY MARKET, BY TYPE, 2018-2033 (USD THOUSAND)
TABLE 212 CANADADIGITAL & VIRTUAL CARE IN INTEROPERABILITY MARKET, BY TYPE, 2018-2033 (USD THOUSAND)
TABLE 213 CANADARESEARCH & ANALYTICS TYPE IN INTEROPERABILITY MARKET, BY TYPE, 2018-2033 (USD THOUSAND)
TABLE 214 CANADAINTEROPERABILITY MARKET, BY END USER, 2018-2033 (USD THOUSAND)
TABLE 215 CANADAHEALTHCARE PROVIDERS IN INTEROPERABILITY MARKET, BY TYPE, 2018-2033 (USD THOUSAND)
TABLE 216 CANADAGOVERNMENT & PUBLIC HEALTH BODIES IN INTEROPERABILITY MARKET, BY TYPE, 2018-2033 (USD THOUSAND)
TABLE 217 CANADAHEALTHCARE PAYERS IN INTEROPERABILITY MARKET, BY TYPE, 2018-2033 (USD THOUSAND)
TABLE 218 CANADALIFE SCIENCES & RESEARCH ORGANIZATIONS IN INTEROPERABILITY MARKET, BY TYPE, 2018-2033 (USD THOUSAND)
TABLE 219 CANADAPHARMACIES & PHARMACY NETWORKS IN INTEROPERABILITY MARKET, BY TYPE, 2018-2033 (USD THOUSAND)
TABLE 220 CANADAPATIENTS & CONSUMER HEALTH PLATFORMS IN INTEROPERABILITY MARKET, BY TYPE, 2018-2033 (USD THOUSAND)
TABLE 221 MEXICO INTEROPERABILITY MARKET, BY COMPONENT TYPE, 2018-2033 (USD THOUSAND)
TABLE 222 MEXICO SOFTWARE IN INTEROPERABILITY MARKET, BY TYPE, 2018-2033 (USD THOUSAND)
TABLE 223 MEXICO INTEGRATION & INTEROPERABILITY PLATFORMS IN INTEROPERABILITY MARKET, BY TYPE, 2018-2033 (USD THOUSAND)
TABLE 224 MEXICO HEALTH INFORMATION EXCHANGE (HIE) SOFTWARE IN INTEROPERABILITY MARKET, BY INSTALLATION TYPE, 2018-2033 (USD THOUSAND)
TABLE 225 MEXICO STANDARDS-BASED & PROTOCOL INTEROPERABILITY SOFTWARE IN INTEROPERABILITY MARKET, BY TYPE, 2018-2033 (USD THOUSAND)
TABLE 226 MEXICO EMR / EHR INTEROPERABILITY SOFTWAREG IN INTEROPERABILITY MARKET, BY INSTALLATION TYPE, 2018-2033 (USD THOUSAND)
TABLE 227 MEXICO DATA, IDENTITY & SEMANTIC INTEROPERABILITY SOFTWARE IN INTEROPERABILITY MARKET, BY INSTALLATION TYPE, 2018-2033 (USD THOUSAND)
TABLE 228 MEXICO MEDICAL DEVICE & CONNECTED CARE INTEROPERABILITY SOFTWARE IN INTEROPERABILITY MARKET, BY UV STABILIZATION TECHNOLOGY, 2018-2033 (USD THOUSAND)
TABLE 229 MEXICO SERVICE IN INTEROPERABILITY MARKET, BY TYPE, 2018-2033 (USD THOUSAND)
TABLE 230 MEXICO SYSTEM INTEGRATION SERVICES IN INTEROPERABILITY MARKET, BY TYPE, 2018-2033 (USD THOUSAND)
TABLE 231 MEXICO MANAGED SERVICES IN INTEROPERABILITY MARKET, BY TYPE, 2018-2033 (USD THOUSAND)
TABLE 232 MEXICO PROFESSIONAL SERVICES IN INTEROPERABILITY MARKET, BY TYPE, 2018-2033 (USD THOUSAND)
TABLE 233 MEXICO SUPPORT & MAINTENANCE SERVICES IN INTEROPERABILITY MARKET, BY TYPE, 2018-2033 (USD THOUSAND)
TABLE 234 MEXICO INTEROPERABILITY MARKET, BY INTEROPERABILITY LEVEL, 2018-2033 (USD THOUSAND)
TABLE 235 MEXICO FOUNDATIONAL INTEROPERABILITY IN INTEROPERABILITY MARKET, BY TYPE, 2018-2033 (USD THOUSAND)
TABLE 236 MEXICO STRUCTURAL INTEROPERABILITY IN INTEROPERABILITY MARKET, BY TYPE, 2018-2033 (USD THOUSAND)
TABLE 237 MEXICO ORGANISATIONAL INTEROPERABILITY IN INTEROPERABILITY MARKET, BY APPLICATION, 2018-2033 (USD THOUSAND)
TABLE 238 MEXICO SEMENTIC INTEROPERABILITY IN INTEROPERABILITY MARKET, BY PRODUCT, 2018-2033 (USD THOUSAND)
TABLE 239 MEXICO INTEROPERABILITY MARKET, BY DEPLOYMENT MODEL, 2018-2033 (USD THOUSAND)
TABLE 240 MEXICO ON-PREMISES IN INTEROPERABILITY MARKET, BY TYPE, 2018-2033 (USD THOUSAND)
TABLE 241 MEXICO CLOUD-BASED IN INTEROPERABILITY MARKET, BY TYPE, 2018-2033 (USD THOUSAND)
TABLE 242 MEXICO EDGE & GATEWAY-BASED DEPLOYMENT IN INTEROPERABILITY MARKET, BY TYPE, 2018-2033 (USD THOUSAND)
TABLE 243 MEXICO INTEROPERABILITY MARKET, BY ARCHITECTURE MODEL, 2018-2033 (USD THOUSAND)
TABLE 244 MEXICO HYBRID ARCHITECTURE IN INTEROPERABILITY MARKET, BY TYPE, 2018-2033 (USD THOUSAND)
TABLE 245 MEXICO CENTRALISED ARCHITECTURE IN INTEROPERABILITY MARKET, BY TYPE, 2018-2033 (USD THOUSAND)
TABLE 246 MEXICO DECENTRALIZED ARCHITECTURE TYPE IN INTEROPERABILITY MARKET, BY TYPE, 2018-2033 (USD THOUSAND)
TABLE 247 MEXICO INTEROPERABILITY MARKET, BY APPLICATION, 2018-2033 (USD THOUSAND)
TABLE 248 MEXICO CLINICAL APPLICATION IN INTEROPERABILITY MARKET, BY TYPE, 2018-2033 (USD THOUSAND)
TABLE 249 MEXICO ADMINISTRATIVE APPLICATION IN INTEROPERABILITY MARKET, BY TYPE, 2018-2033 (USD THOUSAND)
TABLE 250 MEXICO PUBLIC HEALTH & POPULATION HEALTH IN INTEROPERABILITY MARKET, BY TYPE, 2018-2033 (USD THOUSAND)
TABLE 251 MEXICO FINANCIAL APPLICATION IN INTEROPERABILITY MARKET, BY TYPE, 2018-2033 (USD THOUSAND)
TABLE 252 MEXICO DIGITAL & VIRTUAL CARE IN INTEROPERABILITY MARKET, BY TYPE, 2018-2033 (USD THOUSAND)
TABLE 253 MEXICO RESEARCH & ANALYTICS TYPE IN INTEROPERABILITY MARKET, BY TYPE, 2018-2033 (USD THOUSAND)
TABLE 254 MEXICO INTEROPERABILITY MARKET, BY END USER, 2018-2033 (USD THOUSAND)
TABLE 255 MEXICO HEALTHCARE PROVIDERS IN INTEROPERABILITY MARKET, BY TYPE, 2018-2033 (USD THOUSAND)
TABLE 256 MEXICO GOVERNMENT & PUBLIC HEALTH BODIES IN INTEROPERABILITY MARKET, BY TYPE, 2018-2033 (USD THOUSAND)
TABLE 257 MEXICO HEALTHCARE PAYERS IN INTEROPERABILITY MARKET, BY TYPE, 2018-2033 (USD THOUSAND)
TABLE 258 MEXICO LIFE SCIENCES & RESEARCH ORGANIZATIONS IN INTEROPERABILITY MARKET, BY TYPE, 2018-2033 (USD THOUSAND)
TABLE 259 MEXICO PHARMACIES & PHARMACY NETWORKS IN INTEROPERABILITY MARKET, BY TYPE, 2018-2033 (USD THOUSAND)
TABLE 260 MEXICO PATIENTS & CONSUMER HEALTH PLATFORMS IN INTEROPERABILITY MARKET, BY TYPE, 2018-2033 (USD THOUSAND)
List of Figure
FIGURE 1 GLO INTROPERABILITY MARKET: SEGMENTATION
FIGURE 2 NORTH AMERICA INTEROPERABILITY MARKET: DATA TRIANGULATION
FIGURE 3 NORTH AMERICA INTOPERABILITY MARKET: DROC ANALYSIS
FIGURE 4 NORTH AMERICA INTEROPERABILITY MARKET : NORTH AMERICA VS REGIONAL ANALYSIS
FIGURE 5 NORTH AMERICA INTEROPERABILITY MARKET : COMPANY RESEARCH ANALYSIS
FIGURE 6 NORTH AMERICA INTEROPERABILITY MARKET : INTERVIEW DEMOGRAPHICS
FIGURE 7 NORTH AMERICA INTEROPERABILITY MARKET : DBMR MARKET POSITION GRID
FIGURE 8 NORTH AMERICA INTEROPERABILITY MARKET : MARKET END USER COVERAGE GRID
FIGURE 9 EXECUTIVE SUMMARY
FIGURE 10 STRATEGIC DECISIONS
FIGURE 11 TWO SEGMENTS COMPRISE THE NORTH AMERICA INTEROPERABILITY MARKET , BY COMPONENT TYPE (2025)
FIGURE 12 NORTH AMERICA INTEROPERABILITY MARKET : SEGMENTATION
FIGURE 13 RAPID DIGITALIZATION OF HEALTHCARE AND RISING HEALTHCARE IT SPENDING ACROSS APAC IS EXPECTED TO DRIVE THE NORTH AMERICA INTEROPERABILITY MARKET IN THE FORECAST PERIOD OF 2026 TO 2033
FIGURE 14 SOFTWARE SEGMENT IS EXPECTED TO ACCOUNT FOR THE LARGEST SHARE OF THE NORTH AMERICA INTEROPERABILITY MARKET IN 2026 & 2032
FIGURE 15 COMPANY EVALUATION QUADRANT
FIGURE 16 DROC ANALYSIS
FIGURE 17 NORTH AMERICA INTEROPERABILITY MARKET, BY COMPONENT TYPE, 2025
FIGURE 18 NORTH AMERICA INTEROPERABILITY MARKET, BY INTEROPERABILITY LEVEL, 2025
FIGURE 19 NORTH AMERICA INTEROPERABILITY MARKET, BY DEPLOYMENT MODEL
FIGURE 20 NORTH AMERICA INTEROPERABILITY MARKET , BY HYBRID ARCHITECTURE, 2025
FIGURE 21 NORTH AMERICA INTEROPERABILITY MARKET , BY APPLICATION, 2025
FIGURE 22 NORTH AMERICA INTEROPERABILITY MARKET , BY END USER, 2025
FIGURE 23 NORTH AMERICA INTEROPERABILITY MARKET SNAPSHOTS
FIGURE 24 NORTH AMERICA INTEROPERABILITY MARKET: COMPANY SHARE 2025 (%)
Data collection and base year analysis are done using data collection modules with large sample sizes. The stage includes obtaining market information or related data through various sources and strategies. It includes examining and planning all the data acquired from the past in advance. It likewise envelops the examination of information inconsistencies seen across different information sources. The market data is analysed and estimated using market statistical and coherent models. Also, market share analysis and key trend analysis are the major success factors in the market report. To know more, please request an analyst call or drop down your inquiry.
The key research methodology used by DBMR research team is data triangulation which involves data mining, analysis of the impact of data variables on the market and primary (industry expert) validation. Data models include Vendor Positioning Grid, Market Time Line Analysis, Market Overview and Guide, Company Positioning Grid, Patent Analysis, Pricing Analysis, Company Market Share Analysis, Standards of Measurement, Global versus Regional and Vendor Share Analysis. To know more about the research methodology, drop in an inquiry to speak to our industry experts.
Data Bridge Market Research is a leader in advanced formative research. We take pride in servicing our existing and new customers with data and analysis that match and suits their goal. The report can be customized to include price trend analysis of target brands understanding the market for additional countries (ask for the list of countries), clinical trial results data, literature review, refurbished market and product base analysis. Market analysis of target competitors can be analyzed from technology-based analysis to market portfolio strategies. We can add as many competitors that you require data about in the format and data style you are looking for. Our team of analysts can also provide you data in crude raw excel files pivot tables (Fact book) or can assist you in creating presentations from the data sets available in the report.


