
North America Knee Cartilage Repair Market
Market Size in USD Million
 USD
751.18 Million
USD
1,390.38 Million
2025
2033
USD
751.18 Million
USD
1,390.38 Million
2025
2033
| 2026 - 2033 | |
| USD 751.18 Million | |
| USD 1,390.38 Million | |
| % | |
|
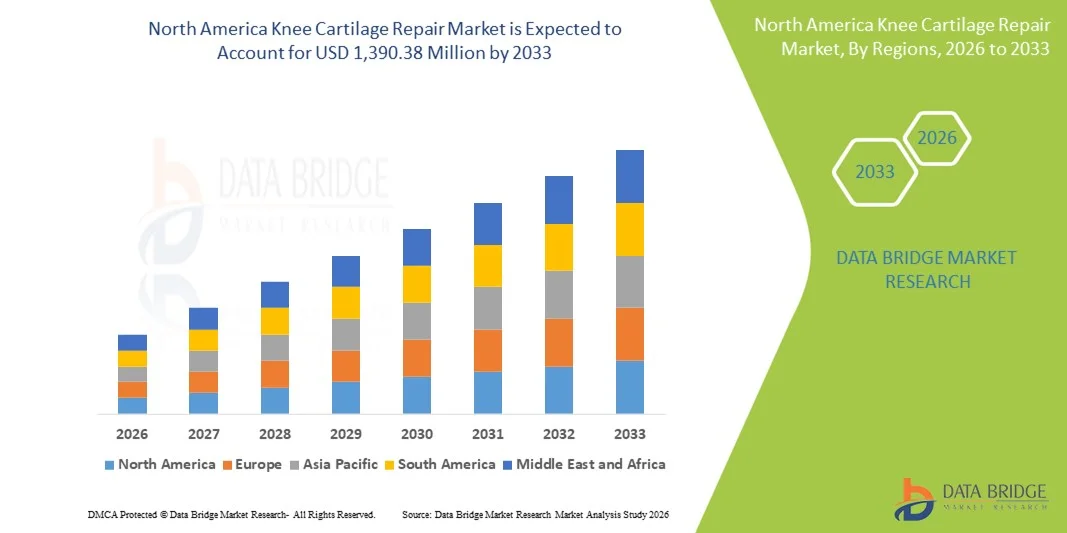
North America Knee Cartilage Repair Market Size
- The North America knee cartilage repair market size was valued at USD 751.18 million in 2025 and is expected to reach USD 1,390.38 million by 2033, at a CAGR of 8.0% during the forecast period
- The market growth is largely fueled by the increasing prevalence of knee osteoarthritis, sports‑related injuries, and the rising adoption of advanced cartilage repair therapies and minimally invasive surgical procedures in the region
- Furthermore, enhanced healthcare infrastructure, strong reimbursement policies, and high consumer demand for effective, regenerative treatment options are driving rapid adoption of knee cartilage repair solutions, solidifying them as preferred options for restoring joint function in both active and aging populations. These converging factors are accelerating the uptake of cartilage repair procedures and technologies, thereby significantly boosting overall market growth in North America
North America Knee Cartilage Repair Market Analysis
- Knee cartilage repair solutions, encompassing cell-based and non-cell-based treatments, surgical procedures, and orthopedic devices, are increasingly vital components of modern orthopedic care in North America due to their effectiveness in relieving pain, restoring joint function, and delaying or avoiding total knee replacement in both active and aging populations
- The escalating demand for knee cartilage repair is primarily fueled by the rising prevalence of osteoarthritis and sports-related knee injuries, growing awareness of early cartilage intervention, and increasing adoption of minimally invasive and regenerative treatment approaches
- The United States dominated the North America knee cartilage repair market with a revenue share of 75.2% in 2025, supported by advanced healthcare infrastructure, high orthopedic procedure volumes, and the strong presence of leading medical device and biotechnology companies
- Canada is expected to be the fastest growing country during the forecast period due to expanding access to orthopedic care, increasing healthcare investments, and rising adoption of advanced cartilage repair techniques
- Osteoarthritis segment dominated the market with a market share of 62.9% in 2025, attributed to the growing aging population, rising obesity prevalence, and increasing demand for minimally invasive procedures aimed at preserving knee joint function and improving patient mobility
Report Scope and North America Knee Cartilage Repair Market Segmentation
|
Attributes |
North America Knee Cartilage Repair Key Market Insights |
|
Segments Covered |
|
|
Countries Covered |
North America
|
|
Key Market Players |
|
|
Market Opportunities |
|
|
Value Added Data Infosets |
In addition to the insights on market scenarios such as market value, growth rate, segmentation, geographical coverage, and major players, the market reports curated by the Data Bridge Market Research also include in-depth expert analysis, patient epidemiology, pipeline analysis, pricing analysis, and regulatory framework |
North America Knee Cartilage Repair Market Trends
Rising Shift Toward Regenerative and Cell-Based Therapies
- A significant and accelerating trend in the North America knee cartilage repair market is the increasing shift toward regenerative, cell-based treatment approaches, driven by the need for long-term cartilage restoration rather than symptomatic relief alone. These advanced therapies are reshaping clinical practices across orthopedic centers
- For instance, autologous chondrocyte implantation and other cell-based techniques are increasingly being adopted in specialized hospitals and sports medicine clinics to treat focal cartilage defects, particularly among younger and active patients seeking durable outcomes
- Advancements in tissue engineering, biologics, and scaffold technologies are enabling improved cartilage regeneration, enhanced integration with native tissue, and better post-surgical outcomes. These innovations are expanding the clinical applicability of cartilage repair beyond traditional surgical methods
- The growing use of minimally invasive surgical techniques in cartilage repair is further influencing treatment preferences, as these approaches reduce recovery time, minimize hospital stays, and lower overall procedural risk compared to conventional open surgeries
- The integration of advanced imaging, arthroscopy tools, and precision surgical devices is supporting more accurate defect assessment and targeted cartilage repair, improving procedural success rates and patient satisfaction across North America
- This trend toward more advanced, regenerative, and patient-centric knee cartilage repair solutions is redefining treatment standards, prompting manufacturers and healthcare providers to invest heavily in biologic innovation and specialized orthopedic training programs
North America Knee Cartilage Repair Market Dynamics
Driver
Rising Burden of Osteoarthritis and Sports-Related Knee Injuries
- The increasing prevalence of osteoarthritis, combined with a high incidence of sports-related and traumatic knee injuries, is a major driver fueling demand for knee cartilage repair solutions across North America
- For instance, the growing number of knee injuries among athletes and physically active individuals has led to higher adoption of cartilage preservation procedures aimed at restoring joint function and preventing long-term degeneration
- An aging population further contributes to market growth, as age-related cartilage wear and degenerative joint conditions increase the need for effective cartilage repair and regeneration therapies
- Increased awareness among patients and clinicians regarding early intervention and cartilage-saving treatments is encouraging the use of repair procedures as alternatives to total knee replacement, particularly in early-stage disease
- The expanding number of outpatient orthopedic procedures performed in ambulatory surgical centers is driving demand for efficient and minimally invasive knee cartilage repair techniques
- Technological advancements in arthroscopy and surgical instrumentation are enabling surgeons to perform cartilage repair procedures with greater precision, supporting higher procedural success rates and wider adoption
- In addition, favorable reimbursement policies and strong healthcare infrastructure in the region are supporting higher procedure volumes and faster adoption of advanced knee cartilage repair technologies
Restraint/Challenge
High Treatment Costs and Limited Long-Term Clinical Evidence
- The high cost associated with advanced knee cartilage repair procedures, particularly cell-based and biologic therapies, remains a key challenge limiting widespread adoption across North America
- For instance, procedures such as autologous chondrocyte implantation often involve multiple surgical stages, specialized laboratory processing, and extended rehabilitation, significantly increasing overall treatment expenses
- Limited long-term clinical outcome data for certain emerging cartilage repair technologies can also make clinicians cautious, slowing broader acceptance in routine orthopedic practice
- Variability in patient outcomes based on age, activity level, and severity of cartilage damage further complicates treatment selection and may impact physician confidence in newer techniques
- Limited availability of specialized surgeons trained in advanced cartilage repair techniques can restrict access to these procedures, particularly outside major urban healthcare centers
- Lengthy rehabilitation periods associated with certain cartilage repair surgeries may discourage patient adoption, especially among working-age individuals concerned about recovery time and mobility limitations
- Overcoming these challenges through cost optimization, expanded clinical trials, improved patient selection criteria, and broader insurance coverage will be critical for sustained growth of the North America knee cartilage repair market
North America Knee Cartilage Repair Market Scope
The market is segmented on the basis of treatment, surgery, devices, application, end user, and distribution channel.
- By Treatment
On the basis of treatment, the North America knee cartilage repair market is segmented into cell-based and non-cell-based therapies. The cell-based segment dominated the market in 2025, driven by its ability to regenerate hyaline-like cartilage and deliver long-term functional improvement. These treatments are widely adopted for younger and active patients with focal cartilage defects. Strong clinical evidence supporting durability and superior outcomes enhances physician preference. Advanced regenerative medicine infrastructure across the U.S. further supports adoption. Increasing investments in cell therapy research accelerate innovation. Favorable reimbursement for select procedures also contributes to dominance.
The non-cell-based segment is expected to witness the fastest growth during the forecast period, supported by lower treatment costs and simplified surgical protocols. These therapies are commonly used for older patients and early-stage cartilage damage. Continuous improvements in biomaterials are enhancing efficacy. Faster recovery timelines make them suitable for outpatient settings. Growing adoption in ambulatory surgical centers supports expansion. Cost-effectiveness remains a key growth driver.
- By Surgery
On the basis of surgery, the market is segmented into osteochondral autograft transplantation, osteochondral allograft transplantation, micro fracture, drilling, abrasion arthroplasty, autologous chondrocyte implantation, and others. The micro fracture segment dominated the market in 2025, owing to its minimally invasive nature and widespread use as a first-line intervention. Surgeons favor this technique for small cartilage lesions and early-stage damage. Lower procedural cost supports high adoption rates. Compatibility with arthroscopic procedures enhances efficiency. High surgeon familiarity further strengthens demand. Broad availability across hospitals reinforces dominance.
The autologous chondrocyte implantation segment is expected to grow at the fastest rate during the forecast period, driven by demand for long-term cartilage regeneration. This procedure restores durable cartilage with superior biomechanical properties. Technological advancements are improving implantation success. Rising adoption among athletes and younger patients supports growth. Increased regulatory acceptance strengthens market confidence. Long-term outcome benefits continue to drive expansion.
- By Devices
On the basis of devices, the market is segmented into implants, osteotomy, bone grafts, arthroscopy, resurfacing, arthrodesis, and others. The arthroscopy segment held the largest market share in 2025, supported by the widespread shift toward minimally invasive orthopedic procedures. Arthroscopy enables precise cartilage assessment and repair. Reduced hospital stay and quicker recovery drive preference. Continuous innovation improves visualization and accuracy. High procedure volumes in hospitals sustain demand. Cost efficiency further supports dominance.
The implants segment is anticipated to witness the fastest growth during the forecast period, fueled by advancements in biomaterials and patient-specific implant design. These devices improve tissue integration and durability. Growing use in complex defects supports adoption. Personalized medicine trends enhance demand. Surgeon confidence in implant outcomes is rising. Technological progress continues to accelerate growth. As personalized medicine advances, implant demand continues to accelerate.
- By Application
On the basis of application, the market is segmented into osteoarthritis, rheumatoid arthritis, osteonecrosis, fractures, bone tumors, and others. The osteoarthritis segment dominated the market in 2025 with a market share of 62.9%, driven by high disease prevalence across North America. Aging populations significantly increase demand. Rising obesity rates further elevate risk. Cartilage repair helps delay knee replacement surgeries. Early diagnosis supports intervention. Strong patient awareness sustains dominance. These factors collectively drive strong demand in this segment.
The osteonecrosis segment is expected to grow at the fastest rate during forecast period, supported by improved imaging and early detection. Increasing focus on joint preservation fuels demand. Cartilage repair prevents disease progression. Advancements in surgical techniques improve outcomes. Referral rates to specialty centers are rising. These factors drive rapid growth. Growing referral rates to specialized orthopedic centers support growth. This makes osteonecrosis a key emerging application area.
- By End User
On the basis of end user, the market is segmented into hospital, ambulatory surgical centers, and independent centers. The hospital segment dominated the market in 2025, due to advanced infrastructure and specialized orthopedic expertise. Hospitals manage complex cartilage repair cases. High patient inflow supports volume growth. Access to advanced imaging enhances outcomes. Teaching hospitals contribute to innovation. Comprehensive post-operative care strengthens dominance.
The ambulatory surgical centers segment is expected to witness the fastest growth during forecast period, driven by cost efficiency and outpatient preference. Shorter hospital stays attract patients. Technological advancements enable complex procedures. Lower infection risk supports adoption. Expanding reimbursement coverage accelerates growth. Patient convenience remains a key driver. Expanding insurance coverage further accelerates adoption. This trend positions ASCs as a rapidly growing end-user segment.
- By Distribution Channel
On the basis of distribution channel, the market is segmented into third party distributor, online sales, direct sales, and others. The direct sales segment dominated the market in 2025, supported by strong manufacturer-provider relationships. Direct engagement enables training and customization. High-value products favor direct procurement. Quality control is improved. Hospitals prefer direct sourcing. Reliable after-sales support reinforces dominance. These advantages reinforce market leadership.
The online sales segment is expected to grow at the fastest rate during forecast period, driven by digital procurement adoption. Online platforms enhance transparency. Faster ordering supports efficiency. Smaller clinics favor digital access. Regulatory improvements build trust. Cost savings accelerate adoption. Cost efficiency and broader product accessibility support growth. Improved regulatory oversight enhances trust in online procurement. This shift is accelerating adoption across North America.
North America Knee Cartilage Repair Market Regional Analysis
- The United States dominated the North America knee cartilage repair market with a revenue share of 75.2% in 2025, supported by advanced healthcare infrastructure, high orthopedic procedure volumes, and the strong presence of leading medical device and biotechnology companies
- Patients and healthcare providers in the U.S. place high value on clinically proven cartilage repair solutions that offer sustained pain relief, improved mobility, and the ability to delay or avoid total knee replacement, supported by widespread access to advanced surgical technologies and specialized orthopedic expertise
- This strong adoption is further supported by advanced healthcare infrastructure, favorable reimbursement policies, high healthcare spending, and the strong presence of leading orthopedic device manufacturers and specialized treatment centers, establishing knee cartilage repair as a preferred orthopedic intervention across hospitals and ambulatory surgical facilities in the United States
The U.S. Knee Cartilage Repair Market Insight
The U.S. knee cartilage repair market captured the largest revenue share within North America in 2025, driven by the high prevalence of osteoarthritis and sports-related knee injuries, along with strong demand for joint-preserving and regenerative treatment options. Patients increasingly prioritize procedures that relieve pain, restore mobility, and delay total knee replacement. The widespread availability of advanced orthopedic technologies and specialized sports medicine centers further supports adoption. Moreover, favorable reimbursement policies and high healthcare spending significantly contribute to sustained market growth in the United States.
Canada Knee Cartilage Repair Market Insight
The Canada knee cartilage repair market is projected to expand at a notable CAGR during the forecast period, primarily driven by an aging population and rising incidence of degenerative joint disorders. Increasing awareness of early cartilage intervention and joint-preserving procedures is fostering adoption across the country. Canada’s publicly funded healthcare system is gradually expanding access to advanced orthopedic treatments. Growth is further supported by improving surgical infrastructure and rising referrals to specialized orthopedic centers. The adoption of minimally invasive and outpatient procedures is also contributing to market expansion.
Mexico Knee Cartilage Repair Market Insight
The Mexico knee cartilage repair market is expected to grow steadily during the forecast period, fueled by increasing awareness of orthopedic treatments and rising sports-related and occupational knee injuries. Growing investments in healthcare infrastructure and orthopedic specialty centers are supporting the adoption of cartilage repair procedures. A rising middle-class population with higher healthcare affordability is contributing to market growth. In addition, the increasing adoption of minimally invasive and cost-effective surgical options is accelerating market penetration. Government initiatives to improve access to advanced orthopedic care further strengthen growth prospects.
North America Knee Cartilage Repair Market Share
The North America Knee Cartilage Repair industry is primarily led by well-established companies, including:
- Anika Therapeutics, Inc. (U.S.)
- Bioventus LLC (U.S.)
- Vericel Corporation (U.S.)
- CONMED Corporation (U.S.)
- Arthrex, Inc. (U.S.)
- LifeNet Health (U.S.)
- Zimmer Biomet (U.S.)
- Stryker (U.S.)
- Integra LifeSciences Corporation (U.S.)
- Smith & Nephew (U.S.)
- Bioventure Partners (U.S.)
- ConforMIS, Inc. (U.S.)
- Moximed, Inc. (U.S.)
- MTF Biologics (U.S.)
- MiMedx Group, Inc. (U.S.)
- Octane Medical Group, Inc. (U.S.)
- BioPoly LLC (U.S.)
- RegenLab (U.S.)
What are the Recent Developments in North America Knee Cartilage Repair Market?
- In October 2025, Smith+Nephew announced that the American Medical Association (AMA) established a Category I CPT® code for its CARTIHEAL AGILI‑C cartilage repair implant, effective January 1, 2027, streamlining reimbursement processes and supporting broader clinical adoption in U.S. orthopedic practice
- In July 2025, Anika Therapeutics reported topline results from its U.S. pivotal FastTRACK Phase III study for the Hyalofast® cartilage repair scaffold, showing improvements over standard microfracture procedures and indicating a strengthened clinical profile ahead of its planned FDA PMA submission
- In May 2025, Smith+Nephew reported that patients treated with its CARTIHEAL™ AGILI‑C™ cartilage repair implant demonstrated an 87% lower relative risk of progressing to total knee arthroplasty or osteotomy over a 4‑year period compared to standard care, highlighting strong long‑term functional benefits and expanding clinical validation for advanced cartilage repair implants
- In April 2025, Hy2Care® received FDA Investigational Device Exemption (IDE) approval to launch its first U.S. clinical trial for the CartRevive® hydrogel cartilage repair implant, enabling evaluation of a new minimally invasive solution designed to improve traumatic knee cartilage repair outcomes and address a significant unmet clinical need
- In September 2024, Sparta Biomedical successfully implanted its Ormi device the company’s synthetic cartilage repair solution in the first patients as part of a first‑in‑human clinical trial, marking an important early human test of a novel approach to treating focal knee cartilage lesions
SKU-

- Interactive Data Analysis Dashboard
- Company Analysis Dashboard for high growth potential opportunities
- Research Analyst Access for customization & queries
- Competitor Analysis with Interactive dashboard
- Latest News, Updates & Trend analysis
- Harness the Power of Benchmark Analysis for Comprehensive Competitor Tracking
Data collection and base year analysis are done using data collection modules with large sample sizes. The stage includes obtaining market information or related data through various sources and strategies. It includes examining and planning all the data acquired from the past in advance. It likewise envelops the examination of information inconsistencies seen across different information sources. The market data is analysed and estimated using market statistical and coherent models. Also, market share analysis and key trend analysis are the major success factors in the market report. To know more, please request an analyst call or drop down your inquiry.
The key research methodology used by DBMR research team is data triangulation which involves data mining, analysis of the impact of data variables on the market and primary (industry expert) validation. Data models include Vendor Positioning Grid, Market Time Line Analysis, Market Overview and Guide, Company Positioning Grid, Patent Analysis, Pricing Analysis, Company Market Share Analysis, Standards of Measurement, Global versus Regional and Vendor Share Analysis. To know more about the research methodology, drop in an inquiry to speak to our industry experts.
Data Bridge Market Research is a leader in advanced formative research. We take pride in servicing our existing and new customers with data and analysis that match and suits their goal. The report can be customized to include price trend analysis of target brands understanding the market for additional countries (ask for the list of countries), clinical trial results data, literature review, refurbished market and product base analysis. Market analysis of target competitors can be analyzed from technology-based analysis to market portfolio strategies. We can add as many competitors that you require data about in the format and data style you are looking for. Our team of analysts can also provide you data in crude raw excel files pivot tables (Fact book) or can assist you in creating presentations from the data sets available in the report.


