
North America Network Service Market
Market Size in USD Billion
CAGR :
% 
 USD
12.93 Billion
USD
76.67 Billion
2025
2033
USD
12.93 Billion
USD
76.67 Billion
2025
2033
| 2026 –2033 | |
| USD 12.93 Billion | |
| USD 76.67 Billion | |
| % | |
|
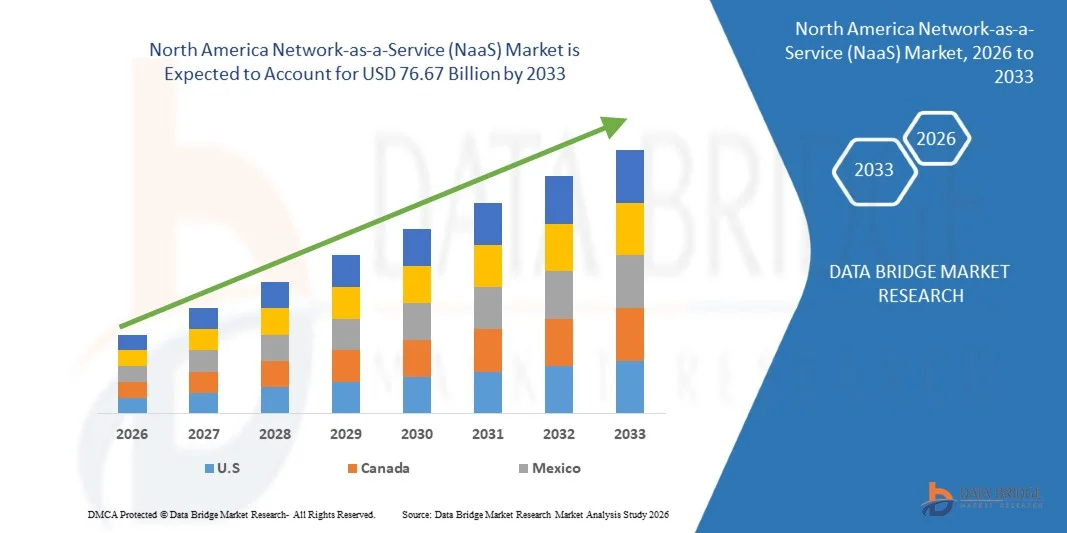
North America Network-as-a-Service (NaaS) Market Size
- The North America Network-as-a-Service (NaaS) market was valued at USD 12.93 billion in 2025 and is expected to reach USD 76.67 billion by 2033 at a CAGR of 24.6% during the forecast period.
- Market growth is driven by rising demand for cost-effective, technology-enabled, and scalable network solutions across enterprises, telecom operators, and government sectors. Key adoption areas include cloud networking, virtualized network infrastructure, software-defined networking (SDN), network automation, and data-driven network management across large enterprises and mid-sized organizations.
- Continuous innovations in AI-driven network analytics, edge computing, IoT integration, and integrated hardware–software platforms, along with favorable government policies and investments in digital infrastructure, are strengthening the overall market outlook in the Asia Pacific region.
North America Network-as-a-Service (NaaS) Market Analysis
- The North America Network-as-a-Service (NaaS) market is witnessing strong growth as solution providers focus on technological innovation, operational efficiency, and application-specific optimization. Key NaaS solutions leverage AI-driven analytics, IoT-enabled sensors, cloud platforms, and automation systems to support enterprises in network management, real-time monitoring, data-driven decision-making, and digital infrastructure optimization across large enterprises, mid-sized organizations, and government institutions.
- Continuous advancements in AI, SDN (software-defined networking), edge computing, and integrated hardware–software platforms are strengthening the NaaS value chain by enhancing scalability, improving operational efficiency, and reducing IT costs. Expanding partnerships, cloud adoption, and collaborative deployments across telecom, BFSI, manufacturing, and government sectors are accelerating market penetration and improving accessibility.
- U.S. is expected to dominate the North America NaaS market, holding the largest revenue share of 69.66% in 2025, supported by rapid digital transformation, high technology adoption, strong telecom infrastructure, and sustained investments in cloud-based and automated network solutions.
- U.S. is also projected to be the fastest-growing market with a CAGR of 24.8%, driven by rising adoption of cloud networking, SDN solutions, IoT integration, and government initiatives promoting digital infrastructure expansion.
- In 2025, the WAN-as-a-Service (WaaS) segment is expected to lead the North America NaaS market with a 59.88% share, reflecting strong demand for virtualized network infrastructure, secure connectivity solutions, and automation-enabled network management across enterprises and telecom operators
Report Scope and North America Network-as-a-Service (NaaS) Market Segmentation
|
Attributes |
North America Network-as-a-Service (NaaS) Key Market insights |
|
Segments Covered |
|
|
Country Covered |
North America
|
|
Key Market Players |
|
|
Market Opportunities |
|
|
Value Added Data infosets |
In addition to the market insights such as market value, growth rate, market segments, geographical coverage, market players, and market scenario, the market report curated by the Data Bridge Market Research team includes in-depth expert analysis, import/export analysis, pricing analysis, production consumption analysis, and PESTLE analysis. |
North America Network-as-a-Service (NaaS) Market Trends
“Increasing Deployment of Edge Networking Infrastructure Supporting Iot and Real-Time Data Processing Applications”
- The growing reliance on Internet of Things (IoT) devices and real-time applications is driving enterprises to expand their edge networking infrastructure, creating new opportunities for Network-as-a-Service (NaaS) adoption. Edge networks, positioned closer to end devices and data sources, enable faster data processing, lower latency, and improved responsiveness, which are critical for applications such as industrial automation, smart cities, healthcare monitoring, and autonomous systems. By deploying networking capabilities at the edge, organizations can efficiently handle massive volumes of IoT-generated data without overloading centralized cloud systems, enhancing operational efficiency and enabling real-time decision-making.
- Moreover, edge networking supports distributed computing architectures, where analytics and data processing are executed locally rather than being entirely dependent on remote cloud data centers. This reduces bandwidth usage, improves reliability, and ensures timely response for mission-critical applications. Enterprises implementing NaaS solutions at the edge can benefit from flexible, scalable, and managed infrastructure that adapts to dynamic workloads while minimizing the complexity and cost of maintaining traditional on-premise networking setups.
- Additionally, the integration of edge networking with IoT ecosystems enables organizations to capture actionable insights in real time, improving predictive maintenance, operational monitoring, and user experience. As industries increasingly rely on data-driven operations, the deployment of edge networks offers a strategic advantage by accelerating application performance, reducing latency, and providing secure, localized control over sensitive data. This trend positions NaaS providers to capitalize on enterprises’ need for high-performance, low-latency, and scalable networking infrastructure, establishing edge deployments as a significant growth opportunity in the evolving enterprise networking landscape.
- In May 2025, Amazon Web Services (AWS) announced the general availability of a new Wavelength Zone edge location in Lenexa, Kansas, in partnership with Verizon, bringing low‑latency compute, storage, and networking closer to end users and devices. This infrastructure enables developers to deploy ultra‑responsive applications — including IoT data processing, real‑time analytics, and latency‑sensitive services — by embedding compute at the edge of 5G and telco networks.
- As reported by Computer Weekly in October 2025, enterprises are increasingly prioritizing real‑time analytics for IoT deployments, with many organizations focusing on edge computing and AI integration to process sensor data instantly and make decisions based on live data flows rather than delayed cloud‑based processing.
- As reported by TierPoint in February 2024, enterprises are using edge deployment models alongside cloud and hybrid systems to deliver lower‑latency responses, optimized bandwidth usage, and real‑time insights for critical applications from wearable health monitors to industrial automation — by processing data closer to its source.
- In 2021, edge computing was widely recognized as critical for IoT and real‑time analytics because processing at “the edge” near sensors and endpoints dramatically reduces latency and enables local decision‑making in distributed environments. This capability became essential for applications such as autonomous vehicles, industrial IoT, and remote monitoring, shifting how networking and compute resources are deployed across enterprise systems
- The rapid deployment of edge networking infrastructure is enabling enterprises to process IoT and real-time data locally, reducing latency and improving responsiveness. This trend presents a significant growth opportunity for NaaS providers to deliver flexible, low-latency, and scalable network solutions that support enterprise digital transformation and distributed operations
North America Network-as-a-Service (NaaS) Market Dynamics
Driver
“Growing Adoption of Sd-Wan and Wan-As-A-Service for Enterprise Branch Connectivity Optimization ”
- The growing complexity of enterprise networks is driving adoption of SD-WAN and WAN-as-a-Service (WANaaS) solutions to improve connectivity across distributed branch locations. Traditional WANs using static routing and MPLS are costly and difficult to scale, prompting enterprises to redesign networks around software-defined frameworks with centralized policy control and application-aware traffic management. Managed, subscription-based SD-WAN services allow secure connections between headquarters, branches, cloud platforms, and remote users, dynamically optimizing network performance.
- SD-WAN-enabled WANaaS solutions are particularly valuable for sectors such as retail, banking, healthcare, and telecom, where uninterrupted connectivity is critical. These solutions support cloud and SaaS applications by providing flexible, service-based network infrastructure that adapts to evolving digital operations.
- Enterprise network traffic has become increasingly complex due to cloud-hosted applications, real-time collaboration, and remote access tools. Conventional WANs often route traffic through central data centers, causing latency and bandwidth inefficiencies, while SD-WAN and WANaaS intelligently route traffic across multiple paths (broadband, fiber, LTE, MPLS) based on performance metrics and application priorities.
- NaaS platforms integrate centralized orchestration tools for automated traffic steering, real-time analytics, and simplified provisioning across branch networks. This enables IT teams to deploy new branch connectivity faster while maintaining consistent security and performance policies, enhancing operational agility and service continuity for multi-site enterprises.
- SD-WAN and WANaaS adoption supports scalable network management frameworks for remote work, cloud connectivity, and IoT integration. Cloud-based platforms provide centralized visibility, integrated security, automated failover, and application-level traffic prioritization, reducing operational complexity and enabling consistent network performance. These service-based models are expected to remain key in evolving enterprise networking architectures.
Restraints/Challenges
“Integration Challenges Between Naas Platforms and Existing Legacy Enterprise Networking Systems”
- The rapid adoption of Network-as-a-Service (NaaS) provides operational and strategic benefits, but integrating these platforms with existing legacy networks remains a major challenge. Enterprises often operate multi-generational infrastructures with outdated hardware, protocols, and software, making compatibility, security, and centralized management difficult. Integration issues can slow service deployment and reduce operational efficiency.
- Legacy systems frequently lack modern APIs, automation capabilities, and security frameworks required by NaaS solutions, forcing enterprises to implement custom connectors or workarounds. This increases deployment time, cost, and complexity, especially for large organizations with distributed branches and mission-critical applications.
- Lack of standardization and vendor-specific protocols in legacy networks complicates monitoring, analytics, and orchestration, making it harder to maintain consistent policies for security, traffic management, and application performance across hybrid infrastructures.
- 2025: Legacy networks often lack NETCONF and modern APIs, requiring custom middleware to connect old controllers with cloud-native NaaS orchestration layers.
- 2024 (Cloudflare): On-premise hardware and older setups require careful planning to achieve seamless interoperability with cloud-centric NaaS offerings.
- 2023: Hybrid topologies and custom integration layers are needed to connect hardware-centric networks to cloud-native NaaS architectures, increasing project delays and overhead.
- 2022 (Comparitech): Traditional routers and switches may not support SDN protocols, demanding phased transitions or hybrid middlebox solutions.
- 2021: Legacy systems create data silos, fragmented communications, and inconsistent interfaces, requiring significant effort to unify network policies and data flows.
- Conclusion: Integrating NaaS platforms with legacy enterprise networks remains a key restraint on adoption. Compatibility gaps, outdated hardware, and fragmented systems increase complexity and operational overhead, limiting customization, slowing deployment, and requiring careful planning for hybrid network operations
North America Network-as-a-Service (NaaS) Market Scope
North America Network-as-a-Service (NaaS) market is categorized into six notable segments which are based on type, offering, application, deployment mode, end user, and distribution channel.
- By Type
On the basis of type, North America Network-as-a-Service (NaaS) market is segmented into WAN-as-a-Service, LAN-as-a-Service, Security-as-a-Service (SECaaS), Cloud Network-as-a-Service. in 2026, the WAN-as-a-Service segment is expected to dominate the market with a 59.90% share, driven by adoption across enterprises for secure, high-performance connectivity, virtualized network infrastructure, and automated traffic management. Rising replacement demand for legacy WAN solutions, expansion of use cases beyond traditional connectivity, and adoption of scalable, productivity-enhancing technologies reinforce the segment’s leadership.
The Lan-As-A-Service segment is expected to be the fastest-growing, registering a CAGR of 25.0% in the North America Network-as-a-Service (NaaS) market. Growth is driven by increasing adoption of integrated, user-friendly, and scalable digital platforms. Enterprises are leveraging LaaS for data-driven decision-making, resource planning, compliance management, and performance optimization. Cloud-based deployment, mobile access, and subscription-based service models are further accelerating market penetration across the region.
- By Offering
On the basis of offering, the North America Network-as-a-Service (NaaS) market is segmented into Service, Software and Hardware. in 2026, the Service segment is expected to dominate the market with a 52.02% share, driven by widespread application in enterprise network deployment, secure connectivity, traffic optimization, and managed network operations. Strong adoption across large enterprises, telecom operators, and government organizations, supported by scalability, reliability, and operational efficiency, reinforces the segment’s leadership in North America.
The Service segment is also expected to be the fastest-growing, registering a CAGR of 24.8% in the North America Network-as-a-Service (NaaS) market. Growth is driven by rising demand for flexible, subscription-based network services, cloud-managed solutions, and AI-enabled network optimization. Increasing adoption of SD-WAN, WAN-as-a-Service, and automated orchestration tools, along with supportive digital transformation initiatives and growing enterprise cloud integration, is expected to accelerate market expansion across North America.
- By Application
On the basis of application, the North America Network-as-a-Service (NaaS) market is segmented into network security and access control, cloud-based network management, data center and branch connectivity, wide area network (WAN) optimization, virtual private network (VPN) services, unified communication and collaboration, IoT and edge networking and others. in 2026, the Network Security and Access Control segment is expected to dominate the market with a 20.57% share, driven by its broad applicability in enterprise security, access management, monitoring, and compliance. Features such as ease of deployment, scalability, real-time monitoring, and low operating costs, along with integration across large, medium, and small enterprises, reinforce its leading position in the Asia Pacific NaaS market.
The Wide Area Network (WAN) Optimization segment is expected to be the fastest-growing, registering a CAGR of 25.5% in the North America Network-as-a-Service (NaaS) market. Growth is driven by rising demand for advanced decision-support, predictive analytics, automated insights, and performance optimization across enterprise networks. Adoption of AI-powered tools, machine learning, computer vision, and integration with cloud and edge networking platforms is accelerating WAN optimization deployment across the region.
- By Deployment Mode
On the basis of deployment mode, the North America Network-as-a-Service (NaaS) market is segmented into Cloud and On Premise. in 2026, the Cloud segment is expected to dominate the market with a 68.80% share, driven by ease of deployment, real-time insights, and strong impact on operational efficiency, risk mitigation, and network scalability. Widespread adoption of cloud-managed services, real-time monitoring, and AI-enabled analytics across enterprises reinforces the segment’s leadership in North America.
The Cloud segment is expected to be the fastest-growing, registering a CAGR of 24.7% in the North America Network-as-a-Service (NaaS) market. Growth is driven by increasing demand for remote monitoring, real-time performance tracking, and automated management across distributed enterprise networks. Expanding adoption of IoT devices, edge integration, AI-driven analytics, and automated orchestration tools accelerates cloud deployment across the region.
- By End User
On the basis of end user, the North America Network-as-a-Service (NaaS) market is segmented into IT & telecom, BFSI, manufacturing, healthcare & life sciences, retail & e-commerce, government & public sector, education, energy & utilities, transportation & logistics and others. in 2026, the IT & Telecom segment is expected to dominate the market with a 21.52% share, driven by high demand for advanced, data-intensive, and cost-efficient Network-as-a-Service (NaaS) solutions that support precision farming, large-scale crop monitoring, automated machinery, and resource optimization. Widespread adoption of GPS-guided equipment, AI-enabled analytics, smart irrigation systems, and integrated farm management platforms, coupled with continuous advancements in automation, connectivity, and real-time decision support, reinforces the segment’s leadership across North America.
The IT & Telecom segment is also expected to be the fastest-growing, registering a CAGR of 26.0% in the North America Network-as-a-Service (NaaS) market. Growth is driven by demand for scalable, affordable, and easy-to-use NaaS solutions that enhance productivity, monitoring, and resource efficiency. Expanding access to mobile platforms, low-cost sensors, digital networks, and government-supported adoption programs is accelerating growth across enterprises and mid-scale organizations in the region.
- By Distribution Channel
On the basis of distribution channel, the North America Network-as-a-Service (NaaS) market is segmented into direct sales and indirect. in 2026, the Direct Sales segment is expected to dominate the market with an 63.69% share, driven by adoption of NaaS solutions for enterprise network operations, cloud connectivity, traffic optimization, and real-time monitoring. Ease of deployment, reliability, cost-effectiveness, and low maintenance, combined with growing demand for integrated, user-friendly network tools, reinforce the segment’s leadership across large and mid-sized organizations in North America.
The indirect segment is expected to be the fastest-growing, registering a CAGR of 24.9% in the North America Network-as-a-Service (NaaS) market. Growth is driven by expanding deployment through partnerships, managed service providers, system integrators, and reseller networks. Increasing enterprise demand for scalable, easily deployable, and low-maintenance NaaS solutions accelerates market penetration across multiple industries in the region.
North America Network-as-a-Service (NaaS) Market Regional Analysis
- The U.S. is expected to dominate the North America Network-as-a-Service (NaaS) market, accounting for the largest revenue share of 25.50% in 2026, supported by major investments in digital networking infrastructure, enterprise SD-WAN deployments, cloud-managed platforms, and AI-enabled network management solutions. High adoption of automated traffic control, secure connectivity services, and cloud orchestration platforms, along with active participation from telecom operators and large enterprises, strengthens its position in the regional NaaS market.
- U.S. is expected to be the fastest-growing market in the North America Network-as-a-Service (NaaS) sector, registering a CAGR of 24.3% during the forecast period. Growth is driven by increasing adoption of cloud-based networking, software-defined WAN, managed network services, and secure access solutions. Supportive government digital initiatives, expanding enterprise IT infrastructure, and rising awareness of cost-efficient, scalable NaaS deployments are accelerating market penetration across small and medium-sized organizations.
- Overall, the North America NaaS market is expected to grow steadily as enterprises prioritize cost-effective, scalable, and easy-to-deploy network solutions, invest in cloud orchestration, automation, AI-based analytics, and SD-WAN frameworks, and expand adoption across large enterprises, mid-sized companies, and emerging organizations throughout the region.
U,S, Network-as-a-Service (NaaS) Market insight
U.S. is experiencing steady growth in the NaaS market, supported by major investments in digital networking infrastructure, enterprise SD-WAN deployments, cloud-managed platforms, and AI-enabled network management solutions. High adoption of automated traffic control, secure connectivity services, and cloud orchestration platforms, along with active participation from telecom operators and large enterprises.
Canada Network-as-a-Service (NaaS) Market insight
The Canada NaaS market is expected to grow steadily as enterprises prioritize cost-effective, scalable, and easy-to-deploy network solutions, invest in cloud orchestration, automation, AI-based analytics, and SD-WAN frameworks, and expand adoption across large enterprises, mid-sized companies, and emerging organizations throughout the region
The Major Market Leaders Operating in the Market Are:
- Cisco Systems, Inc. (U.S.)
- AT&T (U.S.)
- Juniper Networks, Inc. (U.S.)
- VMware (U.S.)
- IBM (U.S.)
- Amazon Web Services, Inc. (U.S.)
- Microsoft Azure (U.S.)
- Google LLC (Alphabet Inc.) (U.S.)
- Verizon Communications Inc. (U.S.)
- Lumen Technologies (U.S.)
- Deutsche Telekom AG (Germany)
- Telefónica S.A. (Spain)
- BT Group (U.K.)
- Orange Business (France)
- NTT DOCOMO Business, Inc. (Japan)
- Tata Communications Limited (India)
- Colt Technology Services Group Limited (U.K.)
- Masergy (A part of Comcast Business) (U.S.)
- Extreme Networks (U.S.)
- Megaport (Australia)
- PacketFabric, Inc. (U.S.)
- Ciena Corporation (U.S.)Epsilon Telecommunications (Australia)
- Aryaka Networks, Inc. (U.S.)
- Cloudflare, Inc. (U.S.)
- Akamai Technologies (U.S.)
- Ericsson AB (Sweden)
- Nokia Corporation (Finland)
- Oracle (U.S.)
Latest Developments in North America Network-as-a-Service (NaaS) Market
- In November 2025, Cisco has unveiled enhancements to its secure enterprise network architecture to meet the demands of the AI era, introducing innovations like cloud‑managed fabrics, AI‑powered automation, and simplified deployment tools that allow enterprises to provision and secure networks quickly at scale. These updates also embed advanced security and high‑performance connectivity. This strengthens Cisco’s leadership in AI‑ready enterprise networking by enabling faster, more secure deployments and tapping growing demand from organizations modernizing infrastructure for distributed AI applications.
- In October 2024, AT&T has introduced an innovative integrated gateway that combines ultra fast fiber broadband with built in 5G wireless backup in a single device for business customers ordering 1 Gbps or higher, ensuring continuous connectivity even if the primary fiber link experiences an outage. The gateway also supports advanced Wi Fi 6E technology. This product strengthens AT&T’s competitive edge in business connectivity by offering a unified, resilient solution that enhances uptime and reliability for enterprise customers.
- In July 2025, Juniper Networks has officially become part of Hewlett Packard Enterprise following the completion of HPE’s approximately $14 billion acquisition, combining Juniper’s AI-native networking technologies with HPE’s enterprise IT portfolio to deliver a comprehensive cloud-native, AI-driven networking stack. The integration strengthens Juniper’s capabilities in routers, switching, security, and AI-driven network management while expanding its global reach through HPE’s hybrid cloud and edge-to-cloud ecosystem
- In November 2024, VMware announced advancements in the VMware Cloud Foundation platform, including expanded data services and tools to support faster application development, stronger data governance, and improved operational efficiency. The company also introduced new security and networking capabilities, such as AI-driven threat detection and enhanced load-balancing technologies, to strengthen enterprise cybersecurity and performance.
- In February 2023, IBM announced plans to acquire NS1, a leading provider of network automation SaaS solutions, to strengthen its hybrid multicloud networking capabilities and help enterprises deliver content and services more reliably and securely at scale. The acquisition will bring NS1’s team into IBM Software and expand IBM’s portfolio with advanced network automation. This move enhances IBM’s competitive edge in hybrid cloud networking by delivering richer automation and performance tools
SKU-
Get online access to the report on the World's First Market Intelligence Cloud

- Interactive Data Analysis Dashboard
- Company Analysis Dashboard for high growth potential opportunities
- Research Analyst Access for customization & queries
- Competitor Analysis with Interactive dashboard
- Latest News, Updates & Trend analysis
- Harness the Power of Benchmark Analysis for Comprehensive Competitor Tracking
Table of Content
1 INTRODUCTION
1.1 OBJECTIVES OF THE STUDY
1.2 MARKET DEFINITION
1.3 OVERVIEW OF NORTH AMERICA NETWORK-AS-A-SERVICE (NAAS) MARKET
1.4 LIMITATIONS
1.5 MARKETS COVERED
2 MARKET SEGMENTATION
2.1 MARKETS COVERED
2.2 GEOGRAPHICAL SCOPE
2.3 YEARS CONSIDERED FOR THE STUDY
2.4 CURRENCY AND PRICING
2.5 DBMR TRIPOD DATA VALIDATION MODEL
2.6 MULTIVARIATE MODELLING
2.7 PRIMARY INTERVIEWS WITH KEY OPINION LEADERS
2.8 DBMR MARKET POSITION GRID
2.9 MARKET END USER COVERAGE GRID
2.1 VENDOR SHARE ANALYSIS
2.11 SECONDARY SOURCES
2.12 ASSUMPTIONS
3 EXECUTIVE SUMMARY
4 PREMIUM INSIGHTS
4.1 PORTER’S FIVE FORCES ANALYSIS
4.1.1 INTRODUCTION
4.1.2 INTENSITY OF COMPETITIVE RIVALRY (HIGH)
4.1.3 THREAT OF NEW ENTRANTS (MODERATE)
4.1.4 BARGAINING POWER OF SUPPLIERS (MODERATE)
4.1.5 BARGAINING POWER OF BUYERS (HIGH)
4.1.6 THREAT OF SUBSTITUTES (MODERATE)
4.1.7 CONCLUSION
4.2 INNOVATION TRACKER AND STRATEGIC ANALYSIS
4.2.1 INTRODUCTION
4.2.2 MAJOR DEALS AND STRATEGIC ALLIANCES ANALYSIS
4.2.3 MERGERS AND ACQUISITIONS
4.2.4 LICENSING AND PARTNERSHIP
4.2.5 TECHNOLOGY COLLABORATIONS
4.2.6 STRATEGIC DIVESTMENTS
4.2.7 NUMBER OF PRODUCTS IN DEVELOPMENT
4.2.8 STAGE OF DEVELOPMENT
4.2.9 TIMELINES AND MILESTONES
4.2.10 INNOVATION STRATEGIES AND METHODOLOGIES
4.2.11 RISK ASSESSMENT AND MITIGATION
4.3 FUTURE OUTLOOK
4.3.1 CONCLUSION
4.4 SUPPLY CHAIN ANALYSIS –
4.4.1 INTRODUCTION
4.4.2 NETWORK INFRASTRUCTURE & HARDWARE SOURCING
4.5 PLATFORM DEVELOPMENT & SERVICE INTEGRATION
4.5.1 NETWORK OPERATIONS & SERVICE DELIVERY
4.5.2 ENTERPRISE ADOPTION & END-USER DEPLOYMENT
4.5.3 CONCLUSION
4.6 TECHNOLOGICAL ADVANCEMENTS
4.6.1 INTRODUCTION
4.6.2 SOFTWARE‑DEFINED NETWORKING (SDN) & SD‑WAN INTEGRATION
4.6.3 CLOUD‑ORCHESTRATED NAAS PLATFORMS
4.6.4 SECURITY‑AS‑A‑SERVICE (SECAAS)
4.6.5 EDGE NETWORKING & MULTI‑CLOUD CONNECTIVITY
4.6.6 IOT ANALYTICS & NETWORK AUTOMATION
4.6.7 CONCLUSION
4.7 VALUE CHAIN ANALYSIS:
4.7.1 BETWORK INFRASTRUCTURE PROVIDERS (15-20%)
4.7.2 ENGINEERING & DESIGN (15-20%).
4.7.3 SERVICE DEVELOPMENT & INTEGRATION (30-35%)
4.7.4 EXECUTION & DELIVERY (15-20%)
4.7.5 END-USER INDUSTRIES / CLIENTS (15-20%)
4.7.6 CONCLUSION
4.8 VENDOR SELECTION CRITERIA –
4.8.1 INTRODUCTION
4.8.2 TECHNICAL COMPETENCE & SOLUTION FIT
4.8.3 PERFORMANCE & RELIABILITY
4.8.4 COMPLIANCE & GOVERNANCE
4.8.5 COST & TOTAL COST OF OWNERSHIP (TCO)
4.8.6 INNOVATION & FUTURE-READINESS
4.8.7 RISK MANAGEMENT & RELIABILITY
4.8.8 CONCLUSION
4.9 BRAND OUTLOOK
4.9.1 OVERVIEW
4.9.2 CISCO SYSTEMS
4.9.3 BRAND IDENTITY
4.9.4 AT&T
4.9.5 JUNIPER NETWORKS
4.9.6 VMWARE
4.9.7 IBM
4.9.8 COMPARATIVE BRAND POSITIONING IN NAAS MARKET
4.9.9 CONCLUSION
4.1 CONSUMER BUYING BEHAVIOUR
4.10.1 INTRODUCTION
4.10.2 NATURE OF BUYERS IN THE NAAS MARKET
4.10.3 FACTORS INFLUENCING CONSUMER BUYING BEHAVIOUR IN THE NAAS MARKET
4.10.4 TECHNOLOGICAL FACTORS
4.10.5 ECONOMIC AND COST FACTORS
4.10.6 SECURITY AND RISK CONSIDERATION
4.10.7 VENDOR REPUTATION AND BRAND TRUST
4.10.8 ORGANIZATIONAL FACTORS
4.10.9 ENVIRONMENTAL AND MARKET FACTORS
4.10.10 MARKET TRENDS INFLUENCING CONSUMER BEHAVIOUR
4.10.10.1 Growth of Cloud Computing
4.10.10.2 Remote and Hybrid Work
4.10.10.3 Expansion of Edge Computing
4.10.11 ARTIFICIAL INTELLIGENCE AND AUTOMATION
4.10.12 INCREASING DEMAND FOR SCALABILITY
4.10.13 FUTURE OUTLOOK OF CONSUMER BEHAVIOUR IN THE NAAS MARKET
4.11 TECHNOLOGY MATRIX
4.11.1 KEY INSIGHTS
4.11.1.1 LAN-as-a-Service (LANaaS)
4.11.1.2 WAN-as-a-Service (WANaaS)
4.11.1.3 Security-as-a-Service (SECaaS)
4.11.1.4 Cloud Network-as-a-Service
4.11.2 SUMMARY
4.12 COMPANY COMPARATIVE ANALYSIS
4.12.1 KEY OBSERVATIONS
4.13 COST ANALYSIS BREAKDOWN–
4.13.1 INTRODUCTION
4.13.2 NETWORK INFRASTRUCTURE HARDWARE
4.13.3 NETWORKING SOFTWARE PLATFORMS
4.13.4 CONNECTIVITY AND BANDWIDTH RESOURCES
4.13.5 SECURITY INFRASTRUCTURE
4.13.6 MANAGED AND PROFESSIONAL SERVICES
4.13.7 OPERATIONS AND SUPPORT
4.13.8 CLOUD INFRASTRUCTURE AND EDGE NETWORKING
4.13.9 CONCLUSION
5 TARIFFS & IMPACT
5.1 INTRODUCTION
5.2 CURRENT TARIFF RATE(S) IN TOP-5 COUNTRY MARKETS
5.2.1 U.S.
5.3 OUTLOOK: LOCAL PRODUCTION V/S IMPORT RELIANCE
5.4 VENDOR SELECTION CRITERIA DYNAMICS
5.5 IMPACT ON SUPPLY CHAIN
5.5.1 RAW MATERIAL PROCUREMENT
5.5.2 MANUFACTURING AND PRODUCTION
5.5.3 LOGISTICS AND DISTRIBUTION
5.5.4 PRICE PITCHING AND POSITION OF MARKET
5.6 INDUSTRY PARTICIPANTS: PROACTIVE MOVES
5.6.1 SUPPLY CHAIN OPTIMIZATION
5.6.2 JOINT VENTURE ESTABLISHMENTS
5.7 IMPACT ON PRICES
5.8 REGULATORY INCLINATION
5.8.1 GEOPOLITICAL SITUATION
5.8.2 TRADE PARTNERSHIPS BETWEEN THE COUNTRIES
5.8.2.1 Free Trade Agreements
5.8.2.2 Alliance Establishments
5.8.3 STATUS ACCREDITATION (INCLUDING MFN)
5.8.4 DOMESTIC COURSE OF CORRECTION
5.8.4.1 Incentive Schemes to Boost Production Outputs
5.8.4.2 COMPANY PRODUCTION CAPACITY OUTLOOK
5.8.4.3 Establishment of Special Economic Zones / Industrial Parks
5.9 CONCLUSION
6 REGULATION COVERAGE
6.1 PRODUCT CODES
6.2 CERTIFIED STANDARDS
7 MARKET OVERVIEW
7.1 DRIVERS
7.1.1 GROWING ADOPTION OF SD-WAN AND WAN-AS-A-SERVICE FOR ENTERPRISE BRANCH CONNECTIVITY OPTIMIZATION.
7.1.2 INCREASING DEVELOPMENT OF PETROCHEMICAL, FERTILIZER, AND INDUSTRIAL PROCESSING FACILITIES GLOBALLY.
7.1.3 INCREASING ENTERPRISE REQUIREMENT FOR INTEGRATED NETWORK SECURITY SOLUTIONS DELIVERED THROUGH SECURITY-AS-A-SERVICE MODELS
7.1.4 EXPANSION OF HYBRID AND MULTI-CLOUD NETWORKING INFRASTRUCTURE SUPPORTING ENTERPRISE DIGITAL TRANSFORMATION INITIATIVES
7.2 RESTRAINTS
7.2.1 LIMITED CONTROL AND CUSTOMIZATION CONCERNS ASSOCIATED WITH OUTSOURCED NETWORK INFRASTRUCTURE.
7.2.2 INTEGRATION CHALLENGES BETWEEN NAAS PLATFORMS AND EXISTING LEGACY ENTERPRISE NETWORKING SYSTEMS
7.3 OPPORTUNITIES
7.3.1 INCREASING DEPLOYMENT OF EDGE NETWORKING INFRASTRUCTURE SUPPORTING IOT AND REAL-TIME DATA PROCESSING APPLICATIONS
7.3.2 GROWING DEMAND FOR UNIFIED COMMUNICATION AND COLLABORATION PLATFORMS REQUIRING OPTIMIZED NETWORK PERFORMANCE
7.3.3 EXPANSION OF MUNICIPAL WATER, WASTEWATER, AND DESALINATION INFRASTRUCTURE PROJECTS
7.4 CHALLENGES
7.4.1 DATA PRIVACY AND REGULATORY COMPLIANCE COMPLEXITIES ACROSS GLOBALLY DISTRIBUTED NETWORK SERVICE ARCHITECTURES
7.4.2 DEPENDENCE ON RELIABLE HIGH-SPEED INTERNET CONNECTIVITY FOR CONSISTENT NAAS SERVICE PERFORMANCE
8 NORTH AMERICA NETWORK-AS-A-SERVICE (NAAS) MARKET , BY TYPE
8.1 OVERVIEW
8.2 NORTH AMERICA NETWORK-AS-A-SERVICE (NAAS) MARKET, BY TYPE, 2018-2033 (USD THOUSAND)
8.2.1 WAN-AS-A-SERVICE
8.2.2 LAN-AS-A-SERVICE
8.2.3 SECURITY-AS-A-SERVICE (SECAAS)
8.2.4 CLOUD NETWORK-AS-A-SERVICE
8.3 NORTH AMERICA WAN-AS-A-SERVICE IN NETWORK-AS-A-SERVICE (NAAS) MARKET, BY TYPE, 2018-2033 (USD THOUSAND)
8.3.1 SD-WAN (SOFTWARE-DEFINED WAN)
8.3.2 MANAGED VPN AND MPLS SERVICES
8.4 NORTH AMERICA WAN-AS-A-SERVICE IN NETWORK-AS-A-SERVICE (NAAS) MARKET, BY REGION, 2018-2033 (USD THOUSAND)
8.4.1 NORTH AMERICA
8.4.2 ASIA-PACIFIC
8.4.3 EUROPE
8.4.4 SOUTH AMERICA
8.4.5 MIDDLE EAST & AFRICA
8.5 NORTH AMERICA LAN-AS-A-SERVICE IN NETWORK-AS-A-SERVICE (NAAS) MARKET, BY TYPE, 2018-2033 (USD THOUSAND)
8.5.1 ENTERPRISE WI-FI AND SD-LAN SOLUTIONS
8.5.2 MANAGED LOCAL AREA NETWORK SERVICES
8.6 NORTH AMERICA LAN-AS-A-SERVICE IN NETWORK-AS-A-SERVICE (NAAS) MARKET, BY REGION, 2018-2033 (USD THOUSAND)
8.6.1 NORTH AMERICA
8.6.2 ASIA-PACIFIC
8.6.3 EUROPE
8.6.4 SOUTH AMERICA
8.6.5 MIDDLE EAST & AFRICA
8.7 NORTH AMERICA SECURITY-AS-A-SERVICE (SECAAS) IN NETWORK-AS-A-SERVICE (NAAS) MARKET, BY TYPE, 2018-2033 (USD THOUSAND)
8.7.1 FIREWALL AND THREAT MANAGEMENT
8.7.2 IDENTITY AND ACCESS MANAGEMENT (IAM)
8.7.3 SECURE WEB GATEWAY (SWG)
8.7.4 NETWORK ENCRYPTION AND DDOS PROTECTION
8.8 NORTH AMERICA SECURITY-AS-A-SERVICE (SECAAS) IN NETWORK-AS-A-SERVICE (NAAS) MARKET, BY REGION, 2018-2033 (USD THOUSAND)
8.8.1 NORTH AMERICA
8.8.2 ASIA-PACIFIC
8.8.3 EUROPE
8.8.4 SOUTH AMERICA
8.8.5 MIDDLE EAST & AFRICA
8.9 NORTH AMERICA CLOUD NETWORK-AS-A-SERVICE IN NETWORK-AS-A-SERVICE (NAAS) MARKET, BY TYPE, 2018-2033 (USD THOUSAND)
8.9.1 CONNECTIVITY & INTERCONNECT SERVICES
8.9.2 MULTI-CLOUD AND HYBRID NETWORKING SOLUTIONS
8.9.3 EDGE NETWORKING AND CONTENT DELIVERY
8.1 NORTH AMERICA CLOUD NETWORK-AS-A-SERVICE IN NETWORK-AS-A-SERVICE (NAAS) MARKET, BY REGION, 2018-2033 (USD THOUSAND)
8.10.1 NORTH AMERICA
8.10.2 ASIA-PACIFIC
8.10.3 EUROPE
8.10.4 SOUTH AMERICA
8.10.5 MIDDLE EAST & AFRICA
9 NORTH AMERICA NETWORK-AS-A-SERVICE (NAAS) MARKET , BY OFFERING
9.1 OVERVIEW
9.2 NORTH AMERICA NETWORK-AS-A-SERVICE (NAAS) MARKET, BY OFFERING, 2018-2033 (USD THOUSAND)
9.2.1 SERVICE
9.2.2 SOFTWARE
9.2.3 HARDWARE
9.3 NORTH AMERICA SERVICE IN NETWORK-AS-A-SERVICE (NAAS) MARKET, BY TYPE, 2018-2033 (USD THOUSAND)
9.3.1 MANAGED SERVICES
9.3.2 PROFESSIONAL SERVICES
9.4 NORTH AMERICA PROFESSIONAL SERVICES IN NETWORK-AS-A-SERVICE (NAAS) MARKET, BY TYPE, 2018-2033 (USD THOUSAND)
9.4.1 CONSULTING AND INTEGRATION SERVICES
9.4.2 SUPPORT AND MAINTENANCE
9.5 NORTH AMERICA SERVICE IN NETWORK-AS-A-SERVICE (NAAS) MARKET, BY REGION, 2018-2033 (USD THOUSAND)
9.5.1 NORTH AMERICA
9.5.2 ASIA-PACIFIC
9.5.3 EUROPE
9.5.4 SOUTH AMERICA
9.5.5 MIDDLE EAST & AFRICA
9.6 NORTH AMERICA SOFTWARE IN NETWORK-AS-A-SERVICE (NAAS) MARKET, BY TYPE, 2018-2033 (USD THOUSAND)
9.6.1 NETWORK MANAGEMENT PLATFORMS
9.6.2 ORCHESTRATION AND AUTOMATION TOOLS
9.6.3 ANALYTICS AND PERFORMANCE MONITORING SOLUTIONS
9.7 NORTH AMERICA SOFTWARE IN NETWORK-AS-A-SERVICE (NAAS) MARKET, BY REGION, 2018-2033 (USD THOUSAND)
9.7.1 NORTH AMERICA
9.7.2 ASIA-PACIFIC
9.7.3 EUROPE
9.7.4 SOUTH AMERICA
9.7.5 MIDDLE EAST & AFRICA
9.8 NORTH AMERICA HARDWARE IN NETWORK-AS-A-SERVICE (NAAS) MARKET, BY TYPE, 2018-2033 (USD THOUSAND)
9.8.1 ROUTERS AND SWITCHES
9.8.2 WIRELESS ACCESS POINTS
9.8.3 EDGE DEVICES
9.8.4 GATEWAYS
9.8.5 OTHERS
9.9 NORTH AMERICA HARDWARE IN NETWORK-AS-A-SERVICE (NAAS) MARKET, BY REGION, 2018-2033 (USD THOUSAND)
9.9.1 NORTH AMERICA
9.9.2 ASIA-PACIFIC
9.9.3 EUROPE
9.9.4 SOUTH AMERICA
9.9.5 MIDDLE EAST & AFRICA
10 NORTH AMERICA NETWORK-AS-A-SERVICE (NAAS) MARKET , BY APPLICATION
10.1 OVERVIEW
10.2 NORTH AMERICA NETWORK-AS-A-SERVICE (NAAS) MARKET, BY APPLICATION, 2018-2033 (USD THOUSAND)
10.2.1 NETWORK SECURITY AND ACCESS CONTROL
10.2.2 CLOUD-BASED NETWORK MANAGEMENT
10.2.3 DATA CENTER AND BRANCH CONNECTIVITY
10.2.4 WIDE AREA NETWORK (WAN) OPTIMIZATION
10.2.5 VIRTUAL PRIVATE NETWORK (VPN) SERVICES
10.2.6 UNIFIED COMMUNICATION AND COLLABORATION
10.2.7 IOT AND EDGE NETWORKING
10.2.8 OTHERS
10.3 NORTH AMERICA NETWORK SECURITY AND ACCESS CONTROL IN NETWORK-AS-A-SERVICE (NAAS) MARKET, BY REGION, 2018-2033 (USD THOUSAND)
10.3.1 NORTH AMERICA
10.3.2 ASIA-PACIFIC
10.3.3 EUROPE
10.3.4 SOUTH AMERICA
10.3.5 MIDDLE EAST & AFRICA
10.4 NORTH AMERICA CLOUD-BASED NETWORK MANAGEMENT IN NETWORK-AS-A-SERVICE (NAAS) MARKET, BY REGION, 2018-2033 (USD THOUSAND)
10.4.1 NORTH AMERICA
10.4.2 ASIA-PACIFIC
10.4.3 EUROPE
10.4.4 SOUTH AMERICA
10.4.5 MIDDLE EAST & AFRICA
10.5 NORTH AMERICA DATA CENTER AND BRANCH CONNECTIVITY IN NETWORK-AS-A-SERVICE (NAAS) MARKET, BY REGION, 2018-2033 (USD THOUSAND)
10.5.1 NORTH AMERICA
10.5.2 ASIA-PACIFIC
10.5.3 EUROPE
10.5.4 SOUTH AMERICA
10.5.5 MIDDLE EAST & AFRICA
10.6 NORTH AMERICA WIDE AREA NETWORK (WAN) OPTIMIZATION IN NETWORK-AS-A-SERVICE (NAAS) MARKET, BY REGION, 2018-2033 (USD THOUSAND)
10.6.1 NORTH AMERICA
10.6.2 ASIA-PACIFIC
10.6.3 EUROPE
10.6.4 SOUTH AMERICA
10.6.5 MIDDLE EAST & AFRICA
10.7 NORTH AMERICA VIRTUAL PRIVATE NETWORK (VPN) SERVICES IN NETWORK-AS-A-SERVICE (NAAS) MARKET, BY REGION, 2018-2033 (USD THOUSAND)
10.7.1 NORTH AMERICA
10.7.2 ASIA-PACIFIC
10.7.3 EUROPE
10.7.4 SOUTH AMERICA
10.7.5 MIDDLE EAST & AFRICA
10.8 NORTH AMERICA UNIFIED COMMUNICATION AND COLLABORATION IN NETWORK-AS-A-SERVICE (NAAS) MARKET, BY REGION, 2018-2033 (USD THOUSAND)
10.8.1 NORTH AMERICA
10.8.2 ASIA-PACIFIC
10.8.3 EUROPE
10.8.4 SOUTH AMERICA
10.8.5 MIDDLE EAST & AFRICA
10.9 NORTH AMERICA IOT AND EDGE NETWORKING IN NETWORK-AS-A-SERVICE (NAAS) MARKET, BY REGION, 2018-2033 (USD THOUSAND)
10.9.1 NORTH AMERICA
10.9.2 ASIA-PACIFIC
10.9.3 EUROPE
10.9.4 SOUTH AMERICA
10.9.5 MIDDLE EAST & AFRICA
10.1 NORTH AMERICA OTHERS IN NETWORK-AS-A-SERVICE (NAAS) MARKET, BY REGION, 2018-2033 (USD THOUSAND)
10.10.1 NORTH AMERICA
10.10.2 ASIA-PACIFIC
10.10.3 EUROPE
10.10.4 SOUTH AMERICA
10.10.5 MIDDLE EAST & AFRICA
11 NORTH AMERICA NETWORK-AS-A-SERVICE (NAAS) MARKET, BY DEPLOYMENT MODE
11.1 OVERVIEW
11.2 NORTH AMERICA NETWORK-AS-A-SERVICE (NAAS) MARKET, BY DEPLOYMENT MODE, 2018-2033 (USD THOUSAND)
11.2.1 CLOUD
11.2.2 ON-PREMISE
11.3 NORTH AMERICA CLOUD IN NETWORK-AS-A-SERVICE (NAAS) MARKET, BY TYPE, 2018-2033 (USD THOUSAND)
11.3.1 PUBLIC CLOUD
11.3.2 PRIVATE CLOUD
11.3.3 HYBRID CLOUD
11.4 NORTH AMERICA CLOUD IN NETWORK-AS-A-SERVICE (NAAS) MARKET, BY REGION, 2018-2033 (USD THOUSAND)
11.4.1 NORTH AMERICA
11.4.2 ASIA-PACIFIC
11.4.3 EUROPE
11.4.4 SOUTH AMERICA
11.4.5 MIDDLE EAST & AFRICA
11.5 NORTH AMERICA ON-PREMISE IN NETWORK-AS-A-SERVICE (NAAS) MARKET, BY REGION, 2018-2033 (USD THOUSAND)
11.5.1 NORTH AMERICA
11.5.2 ASIA-PACIFIC
11.5.3 EUROPE
11.5.4 SOUTH AMERICA
11.5.5 MIDDLE EAST & AFRICA
12 NORTH AMERICA NETWORK-AS-A-SERVICE (NAAS) MARKET , BY END-USER
12.1 OVERVIEW
12.2 NORTH AMERICA NETWORK-AS-A-SERVICE (NAAS) MARKET, BY END-USER, 2018-2033 (USD THOUSAND)
12.2.1 IT & TELECOM
12.2.2 BFSI
12.2.3 MANUFACTURING
12.2.4 HEALTHCARE & LIFE SCIENCES
12.2.5 RETAIL & E-COMMERCE
12.2.6 GOVERNMENT & PUBLIC SECTOR
12.2.7 EDUCATION
12.2.8 ENERGY & UTILITIES
12.2.9 TRANSPORTATION & LOGISTICS
12.2.10 OTHERS
12.3 NORTH AMERICA IT & TELECOM IN NETWORK-AS-A-SERVICE (NAAS) MARKET, BY TYPE, 2018-2033 (USD THOUSAND)
12.3.1 NETWORK SECURITY AND ACCESS CONTROL
12.3.2 CLOUD-BASED NETWORK MANAGEMENT
12.3.3 DATA CENTER AND BRANCH CONNECTIVITY
12.3.4 IOT AND EDGE NETWORKING
12.3.5 WIDE AREA NETWORK (WAN) OPTIMIZATION
12.3.6 VIRTUAL PRIVATE NETWORK (VPN) SERVICES
12.3.7 UNIFIED COMMUNICATION AND COLLABORATION
12.3.8 OTHERS
12.4 NORTH AMERICA IT & TELECOM IN NETWORK-AS-A-SERVICE (NAAS) MARKET, BY REGION, 2018-2033 (USD THOUSAND)
12.4.1 NORTH AMERICA
12.4.2 ASIA-PACIFIC
12.4.3 EUROPE
12.4.4 SOUTH AMERICA
12.4.5 MIDDLE EAST & AFRICA
12.5 NORTH AMERICA BFSI IN NETWORK-AS-A-SERVICE (NAAS) MARKET, BY TYPE, 2018-2033 (USD THOUSAND)
12.5.1 NETWORK SECURITY AND ACCESS CONTROL
12.5.2 DATA CENTER AND BRANCH CONNECTIVITY
12.5.3 CLOUD-BASED NETWORK MANAGEMENT
12.5.4 VIRTUAL PRIVATE NETWORK (VPN) SERVICES
12.5.5 WIDE AREA NETWORK (WAN) OPTIMIZATION
12.5.6 UNIFIED COMMUNICATION AND COLLABORATION
12.5.7 IOT AND EDGE NETWORKING
12.5.8 OTHERS
12.6 NORTH AMERICA BFSI IN NETWORK-AS-A-SERVICE (NAAS) MARKET, BY REGION, 2018-2033 (USD THOUSAND)
12.6.1 NORTH AMERICA
12.6.2 ASIA-PACIFIC
12.6.3 EUROPE
12.6.4 SOUTH AMERICA
12.6.5 MIDDLE EAST & AFRICA
12.7 NORTH AMERICA MANUFACTURING IN NETWORK-AS-A-SERVICE (NAAS) MARKET, BY TYPE, 2018-2033 (USD THOUSAND)
12.7.1 IOT AND EDGE NETWORKING
12.7.2 NETWORK SECURITY AND ACCESS CONTROL
12.7.3 DATA CENTER AND BRANCH CONNECTIVITY
12.7.4 CLOUD-BASED NETWORK MANAGEMENT
12.7.5 WIDE AREA NETWORK (WAN) OPTIMIZATION
12.7.6 UNIFIED COMMUNICATION AND COLLABORATION
12.7.7 VIRTUAL PRIVATE NETWORK (VPN) SERVICES
12.7.8 OTHERS
12.8 NORTH AMERICA MANUFACTURING IN NETWORK-AS-A-SERVICE (NAAS) MARKET, BY REGION, 2018-2033 (USD THOUSAND)
12.8.1 NORTH AMERICA
12.8.2 ASIA-PACIFIC
12.8.3 EUROPE
12.8.4 SOUTH AMERICA
12.8.5 MIDDLE EAST & AFRICA
12.9 NORTH AMERICA HEALTHCARE & LIFE SCIENCES IN NETWORK-AS-A-SERVICE (NAAS) MARKET, BY TYPE, 2018-2033 (USD THOUSAND)
12.9.1 IOT AND EDGE NETWORKING
12.9.2 NETWORK SECURITY AND ACCESS CONTROL
12.9.3 DATA CENTER AND BRANCH CONNECTIVITY
12.9.4 CLOUD-BASED NETWORK MANAGEMENT
12.9.5 UNIFIED COMMUNICATION AND COLLABORATION
12.9.6 WIDE AREA NETWORK (WAN) OPTIMIZATION
12.9.7 VIRTUAL PRIVATE NETWORK (VPN) SERVICES
12.9.8 OTHERS
12.1 NORTH AMERICA HEALTHCARE & LIFE SCIENCES IN NETWORK-AS-A-SERVICE (NAAS) MARKET, BY REGION, 2018-2033 (USD THOUSAND)
12.10.1 NORTH AMERICA
12.10.2 ASIA-PACIFIC
12.10.3 EUROPE
12.10.4 SOUTH AMERICA
12.10.5 MIDDLE EAST & AFRICA
12.11 NORTH AMERICA RETAIL & E-COMMERCE IN NETWORK-AS-A-SERVICE (NAAS) MARKET, BY TYPE, 2018-2033 (USD THOUSAND)
12.11.1 IOT AND EDGE NETWORKING
12.11.2 NETWORK SECURITY AND ACCESS CONTROL
12.11.3 DATA CENTER AND BRANCH CONNECTIVITY
12.11.4 CLOUD-BASED NETWORK MANAGEMENT
12.11.5 UNIFIED COMMUNICATION AND COLLABORATION
12.11.6 WIDE AREA NETWORK (WAN) OPTIMIZATION
12.11.7 VIRTUAL PRIVATE NETWORK (VPN) SERVICES
12.11.8 OTHERS
12.12 NORTH AMERICA RETAIL & E-COMMERCE IN NETWORK-AS-A-SERVICE (NAAS) MARKET, BY REGION, 2018-2033 (USD THOUSAND)
12.12.1 NORTH AMERICA
12.12.2 ASIA-PACIFIC
12.12.3 EUROPE
12.12.4 SOUTH AMERICA
12.12.5 MIDDLE EAST & AFRICA
12.13 NORTH AMERICA GOVERNMENT & PUBLIC SECTOR IN NETWORK-AS-A-SERVICE (NAAS) MARKET, BY TYPE, 2018-2033 (USD THOUSAND)
12.13.1 NETWORK SECURITY AND ACCESS CONTROL
12.13.2 DATA CENTER AND BRANCH CONNECTIVITY
12.13.3 CLOUD-BASED NETWORK MANAGEMENT
12.13.4 IOT AND EDGE NETWORKING
12.13.5 VIRTUAL PRIVATE NETWORK (VPN) SERVICES
12.13.6 UNIFIED COMMUNICATION AND COLLABORATION
12.13.7 WIDE AREA NETWORK (WAN) OPTIMIZATION
12.13.8 OTHERS
12.14 NORTH AMERICA GOVERNMENT & PUBLIC SECTOR IN NETWORK-AS-A-SERVICE (NAAS) MARKET, BY REGION, 2018-2033 (USD THOUSAND)
12.14.1 NORTH AMERICA
12.14.2 ASIA-PACIFIC
12.14.3 EUROPE
12.14.4 SOUTH AMERICA
12.14.5 MIDDLE EAST & AFRICA
12.15 NORTH AMERICA EDUCATION IN NETWORK-AS-A-SERVICE (NAAS) MARKET, BY TYPE, 2018-2033 (USD THOUSAND)
12.15.1 CLOUD-BASED NETWORK MANAGEMENT
12.15.2 NETWORK SECURITY AND ACCESS CONTROL
12.15.3 UNIFIED COMMUNICATION AND COLLABORATION
12.15.4 DATA CENTER AND BRANCH CONNECTIVITY
12.15.5 IOT AND EDGE NETWORKING
12.15.6 VIRTUAL PRIVATE NETWORK (VPN) SERVICES
12.15.7 WIDE AREA NETWORK (WAN) OPTIMIZATION
12.15.8 OTHERS
12.16 NORTH AMERICA EDUCATION IN NETWORK-AS-A-SERVICE (NAAS) MARKET, BY REGION, 2018-2033 (USD THOUSAND)
12.16.1 NORTH AMERICA
12.16.2 ASIA-PACIFIC
12.16.3 EUROPE
12.16.4 SOUTH AMERICA
12.16.5 MIDDLE EAST & AFRICA
12.17 NORTH AMERICA ENERGY & UTILITIES IN NETWORK-AS-A-SERVICE (NAAS) MARKET, BY TYPE, 2018-2033 (USD THOUSAND)
12.17.1 IOT AND EDGE NETWORKING
12.17.2 NETWORK SECURITY AND ACCESS CONTROL
12.17.3 DATA CENTER AND BRANCH CONNECTIVITY
12.17.4 CLOUD-BASED NETWORK MANAGEMENT
12.17.5 WIDE AREA NETWORK (WAN) OPTIMIZATION
12.17.6 UNIFIED COMMUNICATION AND COLLABORATION
12.17.7 VIRTUAL PRIVATE NETWORK (VPN) SERVICES
12.17.8 OTHERS
12.18 NORTH AMERICA ENERGY & UTILITIES IN NETWORK-AS-A-SERVICE (NAAS) MARKET, BY REGION, 2018-2033 (USD THOUSAND)
12.18.1 NORTH AMERICA
12.18.2 ASIA-PACIFIC
12.18.3 EUROPE
12.18.4 SOUTH AMERICA
12.18.5 MIDDLE EAST & AFRICA
12.19 NORTH AMERICA TRANSPORTATION & LOGISTICS IN NETWORK-AS-A-SERVICE (NAAS) MARKET, BY TYPE, 2018-2033 (USD THOUSAND)
12.19.1 IOT AND EDGE NETWORKING
12.19.2 DATA CENTER AND BRANCH CONNECTIVITY
12.19.3 NETWORK SECURITY AND ACCESS CONTROL
12.19.4 CLOUD-BASED NETWORK MANAGEMENT
12.19.5 UNIFIED COMMUNICATION AND COLLABORATION
12.19.6 WIDE AREA NETWORK (WAN) OPTIMIZATION
12.19.7 VIRTUAL PRIVATE NETWORK (VPN) SERVICES
12.19.8 OTHERS
12.2 NORTH AMERICA TRANSPORTATION & LOGISTICS IN NETWORK-AS-A-SERVICE (NAAS) MARKET, BY REGION, 2018-2033 (USD THOUSAND)
12.20.1 NORTH AMERICA
12.20.2 ASIA-PACIFIC
12.20.3 EUROPE
12.20.4 SOUTH AMERICA
12.20.5 MIDDLE EAST & AFRICA
12.21 NORTH AMERICA OTHERS IN NETWORK-AS-A-SERVICE (NAAS) MARKET, BY TYPE, 2018-2033 (USD THOUSAND)
12.21.1 NETWORK SECURITY AND ACCESS CONTROL
12.21.2 CLOUD-BASED NETWORK MANAGEMENT
12.21.3 DATA CENTER AND BRANCH CONNECTIVITY
12.21.4 IOT AND EDGE NETWORKING
12.21.5 UNIFIED COMMUNICATION AND COLLABORATION
12.21.6 WIDE AREA NETWORK (WAN) OPTIMIZATION
12.21.7 VIRTUAL PRIVATE NETWORK (VPN) SERVICES
12.21.8 OTHERS
12.22 NORTH AMERICA OTHERS IN NETWORK-AS-A-SERVICE (NAAS) MARKET, BY REGION, 2018-2033 (USD THOUSAND)
12.22.1 NORTH AMERICA
12.22.2 ASIA-PACIFIC
12.22.3 EUROPE
12.22.4 SOUTH AMERICA
12.22.5 MIDDLE EAST & AFRICA
13 NORTH AMERICA NETWORK-AS-A-SERVICE (NAAS) MARKET , BY DISTRIBUTION CHANNEL
13.1 OVERVIEW
13.2 NORTH AMERICA NETWORK-AS-A-SERVICE (NAAS) MARKET, BY DISTRIBUTION CHANNEL, 2018-2033 (USD THOUSAND)
13.2.1 DIRECT SALES
13.2.2 INDIRECT
13.3 NORTH AMERICA DIRECT SALES IN NETWORK-AS-A-SERVICE (NAAS) MARKET, BY REGION, 2018-2033 (USD THOUSAND)
13.3.1 NORTH AMERICA
13.3.2 ASIA-PACIFIC
13.3.3 EUROPE
13.3.4 SOUTH AMERICA
13.3.5 MIDDLE EAST & AFRICA
13.4 NORTH AMERICA INDIRECT IN NETWORK-AS-A-SERVICE (NAAS) MARKET, BY TYPE, 2018-2033 (USD THOUSAND)
13.4.1 MANAGED SERVICE PROVIDERS (MSPS)
13.4.2 SYSTEM INTEGRATORS (SIS)
13.4.3 VALUE-ADDED RESELLERS (VARS)
13.4.4 OTHERS
13.5 NORTH AMERICA INDIRECT IN NETWORK-AS-A-SERVICE (NAAS) MARKET, BY REGION, 2018-2033 (USD THOUSAND)
13.5.1 NORTH AMERICA
13.5.2 ASIA-PACIFIC
13.5.3 EUROPE
13.5.4 SOUTH AMERICA
13.5.5 MIDDLE EAST & AFRICA
14 NORTH AMERICA NETWORK-AS-A-SERVICE (NAAS) MARKET, BY REGION
14.1 NORTH AMERICA
14.1.1 U.S.
14.1.2 CANADA
14.1.3 MEXICO
15 NORTH AMERICA NETWORK AS A SERVICE (NAAS) MARKET: COMPANY LANDSCAPE
15.1 MANUFACTURER COMPANY SHARE ANALYSIS: GLOBAL
16 SWOT ANALYSIS
17 COMPANY PROFILE
17.1 CISCO SYSTEMS, INC.
17.1.1 COMPANY SNAPSHOT
17.1.2 REVENUE ANALYSIS
17.1.3 COMPANY SHARE ANALYSIS
17.1.4 PRODUCT PORTFOLIO
17.1.5 RECENT DEVELOPMENT
17.2 AT&T INC.
17.2.1 COMPANY SNAPSHOT
17.2.2 REVENUE ANALYSIS
17.2.3 COMPANY SHARE ANALYSIS
17.2.4 PRODUCT PORTFOLIO
17.2.5 RECENT DEVELOPMENT
17.3 JUNIPER NETWORKS, INC. (PART OF HPE)
17.3.1 COMPANY SNAPSHOT
17.3.2 COMPANY SHARE ANALYSIS
17.3.3 PRODUCT PORTFOLIO
17.3.4 RECENT DEVELOPMENT
17.4 VMWARE (A PART OF BROADCOM)
17.4.1 COMPANY SNAPSHOT
17.4.2 REVENUE ANALYSIS
17.4.3 COMPANY SHARE ANALYSIS
17.4.4 PRODUCT PORTFOLIO
17.4.5 RECENT DEVELOPMENT
17.5 IBM CORPORATION
17.5.1 COMPANY SNAPSHOT
17.5.2 REVENUE ANALYSIS
17.5.3 COMPANY SHARE ANALYSIS
17.5.4 PRODUCT PORTFOLIO
17.5.5 RECENT DEVELOPMENT
17.6 AKAMAI TECHNOLOGIES
17.6.1 COMPANY SNAPSHOT
17.6.2 REVENUE ANALYSIS
17.6.3 PRODUCT PORTFOLIO
17.6.4 RECENT DEVELOPMENT
17.7 AMAZON WEB SERVICES, INC.
17.7.1 COMPANY SNAPSHOT
17.7.2 REVENUE ANALYSIS
17.7.3 PRODUCT PORTFOLIO
17.7.4 RECENT DEVELOPMENT
17.8 ARYAKA NETWORKS, INC.
17.8.1 COMPANY SNAPSHOT
17.8.2 PRODUCT PORTFOLIO
17.8.3 RECENT DEVELOPMENT
17.9 BT GROUP
17.9.1 COMPANY SNAPSHOT
17.9.2 REVENUE ANALYSIS
17.9.3 PRODUCT PORTFOLIO
17.9.4 RECENT DEVELOPMENT
17.1 CIENA CORPORATION
17.10.1 COMPANY SNAPSHOT
17.10.2 REVENUE ANALYSIS
17.10.3 PRODUCT PORTFOLIO
17.10.4 RECENT DEVELOPMENT
17.11 CLOUDFLARE, INC.
17.11.1 COMPANY SNAPSHOT
17.11.2 REVENUE ANALYSIS
17.11.3 PRODUCT PORTFOLIO
17.11.4 RECENT DEVELOPMENT
17.12 COLT TECHNOLOGY SERVICES GROUP LIMITED
17.12.1 COMPANY SNAPSHOT
17.12.2 PRODUCT PORTFOLIO
17.12.3 RECENT DEVELOPMENT
17.13 DEUTSCHE TELEKOM AG
17.13.1 COMPANY SNAPSHOT
17.13.2 REVENUE ANALYSIS
17.13.3 PRODUCT PORTFOLIO
17.13.4 RECENT DEVELOPMENT
17.14 EPSILON TELECOMMUNICATIONS
17.14.1 COMPANY SNAPSHOT
17.14.2 PRODUCT PORTFOLIO
17.14.3 RECENT DEVELOPMENT
17.15 ERICSSON AB
17.15.1 COMPANY SNAPSHOT
17.15.2 REVENUE ANALYSIS
17.15.3 PRODUCT PORTFOLIO
17.15.4 RECENT DEVELOPMENT
17.16 EXTREME NETWORKS, INC.
17.16.1 COMPANY SNAPSHOT
17.16.2 REVENUE ANALYSIS
17.16.3 PRODUCT PORTFOLIO
17.16.4 RECENT DEVELOPMENT
17.17 GOOGLE LLC (ALPHABET INC.)
17.17.1 COMPANY SNAPSHOT
17.17.2 REVENUE ANALYSIS
17.17.3 PRODUCT PORTFOLIO
17.17.4 RECENT DEVELOPMENT
17.18 LUMEN TECHNOLOGIES
17.18.1 COMPANY SNAPSHOT
17.18.2 REVENUE ANALYSIS
17.18.3 SERVICE PORTFOLIO
17.18.4 RECENT DEVELOPMENT
17.19 MASERGY (A PART OF COMCAST BUSINESS)
17.19.1 COMPANY SNAPSHOT
17.19.2 PRODUCT PORTFOLIO
17.19.3 RECENT DEVELOPMENT
17.2 MEGAPORT
17.20.1 COMPANY SNAPSHOT
17.20.2 REVENUE ANALYSIS
17.20.3 PRODUCT PORTFOLIO
17.20.4 RECENT DEVELOPMENT
17.21 MICROSOFT AZURE
17.21.1 COMPANY SNAPSHOT
17.21.2 REVENUE ANALYSIS
17.21.3 PRODUCT PORTFOLIO
17.21.4 RECENT DEVELOPMENT
17.22 NOKIA CORPORATION
17.22.1 COMPANY SNAPSHOT
17.22.2 REVENUE ANALYSIS
17.22.3 PRODUCT PORTFOLIO
17.22.4 RECENT DEVELOPMENT
17.23 NTT DOCOMO BUSINESS, INC.
17.23.1 COMPANY SNAPSHOT
17.23.2 REVENUE ANALYSIS
17.23.3 PRODUCT PORTFOLIO
17.23.4 RECENT DEVELOPMENT
17.24 ORACLE
17.24.1 COMPANY SNAPSHOT
17.24.2 REVENUE ANALYSIS
17.24.3 PRODUCT PORTFOLIO
17.24.4 RECENT DEVELOPMENT
17.25 ORANGE BUSINESS
17.25.1 COMPANY SNAPSHOT
17.25.2 REVENUE ANALYSIS
17.25.3 PRODUCT PORTFOLIO
17.25.4 RECENT DEVELOPMENT
17.26 PACKETFABRIC, INC.
17.26.1 COMPANY SNAPSHOT
17.26.2 PRODUCT PORTFOLIO
17.26.3 RECENT DEVELOPMENT
17.27 TATA COMMUNICATIONS LIMITED.
17.27.1 COMPANY SNAPSHOT
17.27.2 REVENUE ANALYSIS
17.27.3 PRODUCT PORTFOLIO
17.27.4 RECENT DEVELOPMENT
17.28 TELEFÓNICA S.A.
17.28.1 COMPANY SNAPSHOT
17.28.2 REVENUE ANALYSIS
17.28.3 PRODUCT PORTFOLIO
17.28.4 RECENT DEVELOPMENT
17.29 VERIZON COMMUNICATIONS INC
17.29.1 COMPANY SNAPSHOT
17.29.2 REVENUE ANALYSIS
17.29.3 PRODUCT PORTFOLIO
17.29.4 RECENT DEVELOPMENT
18 QUESTIONNAIRE
19 RELATED REPORTS
List of Table
TABLE 1 COMPETITIVE STRUCTURE OF THE NORTH AMERICA NETWORK-AS-A-SERVICE MARKET
TABLE 2 KEY STRATEGIC TAKEAWAYS FOR VENDORS IN THE NORTH AMERICA NETWORK-AS-A-SERVICE (NAAS) MARKET
TABLE 3 KEY STRATEGIC DEAL CATEGORIES IN THE NORTH AMERICA NETWORK-AS-A-SERVICE (NAAS) MARKET
TABLE 4 NORTH AMERICA NAAS SUPPLY CHAIN OVERVIEW: STAGES, STAKEHOLDERS, AND STRATEGIC RELEVANCE
TABLE 5 KEY TECHNOLOGICAL ADVANCEMENTS DRIVING THE NAAS MARKET
TABLE 6 KEY VENDOR SELECTION CRITERIA FOR NETWORK-AS-A-SERVICE (NAAS) PROVIDERS
TABLE 7 CONSUMER DECISION-MAKING PROCESS IN THE NAAS MARKET
TABLE 8 TECHNOLOGY MATRIX
TABLE 9 COMPANY COMPARATIVE ANALYSIS
TABLE 10 DISTRIBUTION OF COST COMPONENTS IN NORTH AMERICA NETWORK-AS-A-SERVICE (NAAS) DEPLOYMENTS
TABLE 11 COST CONTRIBUTION BY NAAS TYPE IN ENTERPRISE NETWORK DEPLOYMENTS
TABLE 12 MAJOR TECHNOLOGY PRODUCTS IMPACTED BY U.S. TARIFF MEASURES DURING THE TRUMP ADMINISTRATION
TABLE 13 STRATEGIC SUPPLY CHAIN OPTIMIZATION APPROACHES ADOPTED BY NETWORKING INFRASTRUCTURE VENDORS
TABLE 14 REGULATORY AND TRADE MECHANISMS INFLUENCING THE NORTH AMERICA NAAS ECOSYSTEM
TABLE 15 PRODUCT CODES
TABLE 16 CERTIFIED STANDARDS
TABLE 17 NORTH AMERICA NETWORK-AS-A-SERVICE (NAAS) MARKET, BY TYPE, 2018-2033 (USD THOUSAND)
TABLE 18 NORTH AMERICA WAN-AS-A-SERVICE IN NETWORK-AS-A-SERVICE (NAAS) MARKET, BY TYPE, 2018-2033 (USD THOUSAND)
TABLE 19 NORTH AMERICA WAN-AS-A-SERVICE IN NETWORK-AS-A-SERVICE (NAAS) MARKET, BY REGION, 2018-2033 (USD THOUSAND)
TABLE 20 NORTH AMERICA LAN-AS-A-SERVICE IN NETWORK-AS-A-SERVICE (NAAS) MARKET, BY TYPE, 2018-2033 (USD THOUSAND)
TABLE 21 NORTH AMERICA LAN-AS-A-SERVICE IN NETWORK-AS-A-SERVICE (NAAS) MARKET, BY REGION, 2018-2033 (USD THOUSAND)
TABLE 22 NORTH AMERICA SECURITY-AS-A-SERVICE (SECAAS) IN NETWORK-AS-A-SERVICE (NAAS) MARKET, BY TYPE, 2018-2033 (USD THOUSAND)
TABLE 23 NORTH AMERICA SECURITY-AS-A-SERVICE (SECAAS) IN NETWORK-AS-A-SERVICE (NAAS) MARKET, BY REGION, 2018-2033 (USD THOUSAND)
TABLE 24 NORTH AMERICA CLOUD NETWORK-AS-A-SERVICE IN NETWORK-AS-A-SERVICE (NAAS) MARKET, BY TYPE, 2018-2033 (USD THOUSAND)
TABLE 25 NORTH AMERICA CLOUD NETWORK-AS-A-SERVICE IN NETWORK-AS-A-SERVICE (NAAS) MARKET, BY REGION, 2018-2033 (USD THOUSAND)
TABLE 26 NORTH AMERICA NETWORK-AS-A-SERVICE (NAAS) MARKET, BY OFFERING, 2018-2033 (USD THOUSAND)
TABLE 27 NORTH AMERICA SERVICE IN NETWORK-AS-A-SERVICE (NAAS) MARKET, BY TYPE, 2018-2033 (USD THOUSAND)
TABLE 28 NORTH AMERICA PROFESSIONAL SERVICES IN NETWORK-AS-A-SERVICE (NAAS) MARKET, BY TYPE, 2018-2033 (USD THOUSAND)
TABLE 29 NORTH AMERICA SERVICE IN NETWORK-AS-A-SERVICE (NAAS) MARKET, BY REGION, 2018-2033 (USD THOUSAND)
TABLE 30 NORTH AMERICA SOFTWARE IN NETWORK-AS-A-SERVICE (NAAS) MARKET, BY TYPE, 2018-2033 (USD THOUSAND)
TABLE 31 NORTH AMERICA SOFTWARE IN NETWORK-AS-A-SERVICE (NAAS) MARKET, BY REGION, 2018-2033 (USD THOUSAND)
TABLE 32 NORTH AMERICA HARDWARE IN NETWORK-AS-A-SERVICE (NAAS) MARKET, BY TYPE, 2018-2033 (USD THOUSAND)
TABLE 33 NORTH AMERICA HARDWARE IN NETWORK-AS-A-SERVICE (NAAS) MARKET, BY REGION, 2018-2033 (USD THOUSAND)
TABLE 34 NORTH AMERICA NETWORK-AS-A-SERVICE (NAAS) MARKET, BY APPLICATION, 2018-2033 (USD THOUSAND)
TABLE 35 NORTH AMERICA NETWORK SECURITY AND ACCESS CONTROL IN NETWORK-AS-A-SERVICE (NAAS) MARKET, BY REGION, 2018-2033 (USD THOUSAND)
TABLE 36 NORTH AMERICA CLOUD-BASED NETWORK MANAGEMENT IN NETWORK-AS-A-SERVICE (NAAS) MARKET, BY REGION, 2018-2033 (USD THOUSAND)
TABLE 37 NORTH AMERICA DATA CENTER AND BRANCH CONNECTIVITY IN NETWORK-AS-A-SERVICE (NAAS) MARKET, BY REGION, 2018-2033 (USD THOUSAND)
TABLE 38 NORTH AMERICA WIDE AREA NETWORK (WAN) OPTIMIZATION IN NETWORK-AS-A-SERVICE (NAAS) MARKET, BY REGION, 2018-2033 (USD THOUSAND)
TABLE 39 NORTH AMERICA VIRTUAL PRIVATE NETWORK (VPN) SERVICES IN NETWORK-AS-A-SERVICE (NAAS) MARKET, BY REGION, 2018-2033 (USD THOUSAND)
TABLE 40 NORTH AMERICA UNIFIED COMMUNICATION AND COLLABORATION IN NETWORK-AS-A-SERVICE (NAAS) MARKET, BY REGION, 2018-2033 (USD THOUSAND)
TABLE 41 NORTH AMERICA IOT AND EDGE NETWORKING IN NETWORK-AS-A-SERVICE (NAAS) MARKET, BY REGION, 2018-2033 (USD THOUSAND)
TABLE 42 NORTH AMERICA OTHERS IN NETWORK-AS-A-SERVICE (NAAS) MARKET, BY REGION, 2018-2033 (USD THOUSAND)
TABLE 43 NORTH AMERICA NETWORK-AS-A-SERVICE (NAAS) MARKET, BY DEPLOYMET MODE, 2018-2033 (USD THOUSAND)
TABLE 44 NORTH AMERICA CLOUD IN NETWORK-AS-A-SERVICE (NAAS) MARKET, BY TYPE, 2018-2033 (USD THOUSAND)
TABLE 45 NORTH AMERICA CLOUD IN NETWORK-AS-A-SERVICE (NAAS) MARKET, BY REGION, 2018-2033 (USD THOUSAND)
TABLE 46 NORTH AMERICA ON-PREMISE IN NETWORK-AS-A-SERVICE (NAAS) MARKET, BY REGION, 2018-2033 (USD THOUSAND)
TABLE 47 NORTH AMERICA NETWORK-AS-A-SERVICE (NAAS) MARKET, BY END-USER, 2018-2033 (USD THOUSAND)
TABLE 48 NORTH AMERICA IT & TELECOM IN NETWORK-AS-A-SERVICE (NAAS) MARKET, BY TYPE, 2018-2033 (USD THOUSAND)
TABLE 49 NORTH AMERICA IT & TELECOM IN NETWORK-AS-A-SERVICE (NAAS) MARKET, BY REGION, 2018-2033 (USD THOUSAND)
TABLE 50 NORTH AMERICA BFSI IN NETWORK-AS-A-SERVICE (NAAS) MARKET, BY TYPE, 2018-2033 (USD THOUSAND)
TABLE 51 NORTH AMERICA BFSI IN NETWORK-AS-A-SERVICE (NAAS) MARKET, BY REGION, 2018-2033 (USD THOUSAND)
TABLE 52 NORTH AMERICA MANUFACTURING IN NETWORK-AS-A-SERVICE (NAAS) MARKET, BY TYPE, 2018-2033 (USD THOUSAND)
TABLE 53 NORTH AMERICA MANUFACTURING IN NETWORK-AS-A-SERVICE (NAAS) MARKET, BY REGION, 2018-2033 (USD THOUSAND)
TABLE 54 NORTH AMERICA HEALTHCARE & LIFE SCIENCES IN NETWORK-AS-A-SERVICE (NAAS) MARKET, BY TYPE, 2018-2033 (USD THOUSAND)
TABLE 55 NORTH AMERICA HEALTHCARE & LIFE SCIENCES IN NETWORK-AS-A-SERVICE (NAAS) MARKET, BY REGION, 2018-2033 (USD THOUSAND)
TABLE 56 NORTH AMERICA RETAIL & E-COMMERCE IN NETWORK-AS-A-SERVICE (NAAS) MARKET, BY TYPE, 2018-2033 (USD THOUSAND)
TABLE 57 NORTH AMERICA RETAIL & E-COMMERCE IN NETWORK-AS-A-SERVICE (NAAS) MARKET, BY REGION, 2018-2033 (USD THOUSAND)
TABLE 58 NORTH AMERICA GOVERNMENT & PUBLIC SECTOR IN NETWORK-AS-A-SERVICE (NAAS) MARKET, BY TYPE, 2018-2033 (USD THOUSAND)
TABLE 59 NORTH AMERICA GOVERNMENT & PUBLIC SECTOR IN NETWORK-AS-A-SERVICE (NAAS) MARKET, BY REGION, 2018-2033 (USD THOUSAND)
TABLE 60 NORTH AMERICA EDUCATION IN NETWORK-AS-A-SERVICE (NAAS) MARKET, BY TYPE, 2018-2033 (USD THOUSAND)
TABLE 61 NORTH AMERICA EDUCATION IN NETWORK-AS-A-SERVICE (NAAS) MARKET, BY REGION, 2018-2033 (USD THOUSAND)
TABLE 62 NORTH AMERICA ENERGY & UTILITIES IN NETWORK-AS-A-SERVICE (NAAS) MARKET, BY TYPE, 2018-2033 (USD THOUSAND)
TABLE 63 NORTH AMERICA ENERGY & UTILITIES IN NETWORK-AS-A-SERVICE (NAAS) MARKET, BY REGION, 2018-2033 (USD THOUSAND)
TABLE 64 NORTH AMERICA TRANSPORTATION & LOGISTICS IN NETWORK-AS-A-SERVICE (NAAS) MARKET, BY TYPE, 2018-2033 (USD THOUSAND)
TABLE 65 NORTH AMERICA TRANSPORTATION & LOGISTICS IN NETWORK-AS-A-SERVICE (NAAS) MARKET, BY REGION, 2018-2033 (USD THOUSAND)
TABLE 66 NORTH AMERICA OTHERS IN NETWORK-AS-A-SERVICE (NAAS) MARKET, BY TYPE, 2018-2033 (USD THOUSAND)
TABLE 67 NORTH AMERICA OTHERS IN NETWORK-AS-A-SERVICE (NAAS) MARKET, BY REGION, 2018-2033 (USD THOUSAND)
TABLE 68 NORTH AMERICA NETWORK-AS-A-SERVICE (NAAS) MARKET, BY DISTRIBUTION CHANNEL, 2018-2033 (USD THOUSAND)
TABLE 69 NORTH AMERICA DIRECT SALES IN NETWORK-AS-A-SERVICE (NAAS) MARKET, BY REGION, 2018-2033 (USD THOUSAND)
TABLE 70 NORTH AMERICA INDIRECT IN NETWORK-AS-A-SERVICE (NAAS) MARKET, BY TYPE, 2018-2033 (USD THOUSAND)
TABLE 71 NORTH AMERICA INDIRECT IN NETWORK-AS-A-SERVICE (NAAS) MARKET, BY REGION, 2018-2033 (USD THOUSAND)
TABLE 72 NORTH AMERICA NETWORK-AS-A-SERVICE (NAAS) MARKET, 2018-2033 (USD THOUSAND)
TABLE 73 NORTH AMERICA NETWORK-AS-A-SERVICE (NAAS) MARKET, BY COUNTRY, 2018-2033 (USD THOUSAND)
TABLE 74 USD THOUSAND
TABLE 75 NORTH AMERICA NETWORK-AS-A-SERVICE (NAAS) MARKET, BY TYPE, 2018-2033 (USD THOUSAND)
TABLE 76 NORTH AMERICA WAN-AS-A-SERVICE IN NETWORK-AS-A-SERVICE (NAAS) MARKET, BY TYPE, 2018-2033 (USD THOUSAND)
TABLE 77 NORTH AMERICA LAN-AS-A-SERVICE IN NETWORK-AS-A-SERVICE (NAAS) MARKET, BY TYPE, 2018-2033 (USD THOUSAND)
TABLE 78 NORTH AMERICA SECURITY-AS-A-SERVICE (SECAAS) IN NETWORK-AS-A-SERVICE (NAAS) MARKET, BY TYPE, 2018-2033 (USD THOUSAND)
TABLE 79 NORTH AMERICA CLOUD NETWORK-AS-A-SERVICE IN NETWORK-AS-A-SERVICE (NAAS) MARKET, BY TYPE, 2018-2033 (USD THOUSAND)
TABLE 80 NORTH AMERICA NETWORK-AS-A-SERVICE (NAAS) MARKET, BY OFFERING, 2018-2033 (USD THOUSAND)
TABLE 81 NORTH AMERICA SERVICE IN NETWORK-AS-A-SERVICE (NAAS) MARKET, BY TYPE, 2018-2033 (USD THOUSAND)
TABLE 82 NORTH AMERICA PROFESSIONAL SERVICES IN NETWORK-AS-A-SERVICE (NAAS) MARKET, BY TYPE, 2018-2033 (USD THOUSAND)
TABLE 83 NORTH AMERICA SOFTWARE IN NETWORK-AS-A-SERVICE (NAAS) MARKET, BY TYPE, 2018-2033 (USD THOUSAND)
TABLE 84 NORTH AMERICA HARDWARE IN NETWORK-AS-A-SERVICE (NAAS) MARKET, BY TYPE, 2018-2033 (USD THOUSAND)
TABLE 85 NORTH AMERICA NETWORK-AS-A-SERVICE (NAAS) MARKET, BY APPLICATION, 2018-2033 (USD THOUSAND)
TABLE 86 NORTH AMERICA NETWORK-AS-A-SERVICE (NAAS) MARKET, BY DEPLOYMET MODE, 2018-2033 (USD THOUSAND)
TABLE 87 NORTH AMERICA CLOUD IN NETWORK-AS-A-SERVICE (NAAS) MARKET, BY TYPE, 2018-2033 (USD THOUSAND)
TABLE 88 NORTH AMERICA NETWORK-AS-A-SERVICE (NAAS) MARKET, BY END-USER, 2018-2033 (USD THOUSAND)
TABLE 89 NORTH AMERICA IT & TELECOM IN NETWORK-AS-A-SERVICE (NAAS) MARKET, BY TYPE, 2018-2033 (USD THOUSAND)
TABLE 90 NORTH AMERICA BFSI IN NETWORK-AS-A-SERVICE (NAAS) MARKET, BY TYPE, 2018-2033 (USD THOUSAND)
TABLE 91 NORTH AMERICA MANUFACTURING IN NETWORK-AS-A-SERVICE (NAAS) MARKET, BY TYPE, 2018-2033 (USD THOUSAND)
TABLE 92 NORTH AMERICA HEALTHCARE & LIFE SCIENCES IN NETWORK-AS-A-SERVICE (NAAS) MARKET, BY TYPE, 2018-2033 (USD THOUSAND)
TABLE 93 NORTH AMERICA RETAIL & E-COMMERCE IN NETWORK-AS-A-SERVICE (NAAS) MARKET, BY TYPE, 2018-2033 (USD THOUSAND)
TABLE 94 NORTH AMERICA GOVERNMENT & PUBLIC SECTOR IN NETWORK-AS-A-SERVICE (NAAS) MARKET, BY TYPE, 2018-2033 (USD THOUSAND)
TABLE 95 NORTH AMERICA EDUCATION IN NETWORK-AS-A-SERVICE (NAAS) MARKET, BY TYPE, 2018-2033 (USD THOUSAND)
TABLE 96 NORTH AMERICA ENERGY & UTILITIES IN NETWORK-AS-A-SERVICE (NAAS) MARKET, BY TYPE, 2018-2033 (USD THOUSAND)
TABLE 97 NORTH AMERICA TRANSPORTATION & LOGISTICS IN NETWORK-AS-A-SERVICE (NAAS) MARKET, BY TYPE, 2018-2033 (USD THOUSAND)
TABLE 98 NORTH AMERICA OTHERS IN NETWORK-AS-A-SERVICE (NAAS) MARKET, BY TYPE, 2018-2033 (USD THOUSAND)
TABLE 99 NORTH AMERICA NETWORK-AS-A-SERVICE (NAAS) MARKET, BY DISTRIBUTION CHANNEL, 2018-2033 (USD THOUSAND)
TABLE 100 NORTH AMERICA INDIRECT IN NETWORK-AS-A-SERVICE (NAAS) MARKET, BY TYPE, 2018-2033 (USD THOUSAND)
TABLE 101 U.S. NETWORK-AS-A-SERVICE (NAAS) MARKET, BY TYPE, 2018-2033 (USD THOUSAND)
TABLE 102 U.S. WAN-AS-A-SERVICE IN NETWORK-AS-A-SERVICE (NAAS) MARKET, BY TYPE, 2018-2033 (USD THOUSAND)
TABLE 103 U.S. LAN-AS-A-SERVICE IN NETWORK-AS-A-SERVICE (NAAS) MARKET, BY TYPE, 2018-2033 (USD THOUSAND)
TABLE 104 U.S. SECURITY-AS-A-SERVICE (SECAAS) IN NETWORK-AS-A-SERVICE (NAAS) MARKET, BY TYPE, 2018-2033 (USD THOUSAND)
TABLE 105 U.S. CLOUD NETWORK-AS-A-SERVICE IN NETWORK-AS-A-SERVICE (NAAS) MARKET, BY TYPE, 2018-2033 (USD THOUSAND)
TABLE 106 U.S. NETWORK-AS-A-SERVICE (NAAS) MARKET, BY OFFERING, 2018-2033 (USD THOUSAND)
TABLE 107 U.S. SERVICE IN NETWORK-AS-A-SERVICE (NAAS) MARKET, BY TYPE, 2018-2033 (USD THOUSAND)
TABLE 108 U.S. PROFESSIONAL SERVICES IN NETWORK-AS-A-SERVICE (NAAS) MARKET, BY TYPE, 2018-2033 (USD THOUSAND)
TABLE 109 U.S. SOFTWARE IN NETWORK-AS-A-SERVICE (NAAS) MARKET, BY TYPE, 2018-2033 (USD THOUSAND)
TABLE 110 U.S. HARDWARE IN NETWORK-AS-A-SERVICE (NAAS) MARKET, BY TYPE, 2018-2033 (USD THOUSAND)
TABLE 111 U.S. NETWORK-AS-A-SERVICE (NAAS) MARKET, BY APPLICATION, 2018-2033 (USD THOUSAND)
TABLE 112 U.S. NETWORK-AS-A-SERVICE (NAAS) MARKET, BY DEPLOYMET MODE, 2018-2033 (USD THOUSAND)
TABLE 113 U.S. CLOUD IN NETWORK-AS-A-SERVICE (NAAS) MARKET, BY TYPE, 2018-2033 (USD THOUSAND)
TABLE 114 U.S. NETWORK-AS-A-SERVICE (NAAS) MARKET, BY END-USER, 2018-2033 (USD THOUSAND)
TABLE 115 U.S. IT & TELECOM IN NETWORK-AS-A-SERVICE (NAAS) MARKET, BY TYPE, 2018-2033 (USD THOUSAND)
TABLE 116 U.S. BFSI IN NETWORK-AS-A-SERVICE (NAAS) MARKET, BY TYPE, 2018-2033 (USD THOUSAND)
TABLE 117 U.S. MANUFACTURING IN NETWORK-AS-A-SERVICE (NAAS) MARKET, BY TYPE, 2018-2033 (USD THOUSAND)
TABLE 118 U.S. HEALTHCARE & LIFE SCIENCES IN NETWORK-AS-A-SERVICE (NAAS) MARKET, BY TYPE, 2018-2033 (USD THOUSAND)
TABLE 119 U.S. RETAIL & E-COMMERCE IN NETWORK-AS-A-SERVICE (NAAS) MARKET, BY TYPE, 2018-2033 (USD THOUSAND)
TABLE 120 U.S. GOVERNMENT & PUBLIC SECTOR IN NETWORK-AS-A-SERVICE (NAAS) MARKET, BY TYPE, 2018-2033 (USD THOUSAND)
TABLE 121 U.S. EDUCATION IN NETWORK-AS-A-SERVICE (NAAS) MARKET, BY TYPE, 2018-2033 (USD THOUSAND)
TABLE 122 U.S. ENERGY & UTILITIES IN NETWORK-AS-A-SERVICE (NAAS) MARKET, BY TYPE, 2018-2033 (USD THOUSAND)
TABLE 123 U.S. TRANSPORTATION & LOGISTICS IN NETWORK-AS-A-SERVICE (NAAS) MARKET, BY TYPE, 2018-2033 (USD THOUSAND)
TABLE 124 U.S. OTHERS IN NETWORK-AS-A-SERVICE (NAAS) MARKET, BY TYPE, 2018-2033 (USD THOUSAND)
TABLE 125 U.S. NETWORK-AS-A-SERVICE (NAAS) MARKET, BY DISTRIBUTION CHANNEL, 2018-2033 (USD THOUSAND)
TABLE 126 U.S. INDIRECT IN NETWORK-AS-A-SERVICE (NAAS) MARKET, BY TYPE, 2018-2033 (USD THOUSAND)
TABLE 127 CANADA NETWORK-AS-A-SERVICE (NAAS) MARKET, BY TYPE, 2018-2033 (USD THOUSAND)
TABLE 128 CANADA WAN-AS-A-SERVICE IN NETWORK-AS-A-SERVICE (NAAS) MARKET, BY TYPE, 2018-2033 (USD THOUSAND)
TABLE 129 CANADA LAN-AS-A-SERVICE IN NETWORK-AS-A-SERVICE (NAAS) MARKET, BY TYPE, 2018-2033 (USD THOUSAND)
TABLE 130 CANADA SECURITY-AS-A-SERVICE (SECAAS) IN NETWORK-AS-A-SERVICE (NAAS) MARKET, BY TYPE, 2018-2033 (USD THOUSAND)
TABLE 131 CANADA CLOUD NETWORK-AS-A-SERVICE IN NETWORK-AS-A-SERVICE (NAAS) MARKET, BY TYPE, 2018-2033 (USD THOUSAND)
TABLE 132 CANADA NETWORK-AS-A-SERVICE (NAAS) MARKET, BY OFFERING, 2018-2033 (USD THOUSAND)
TABLE 133 CANADA SERVICE IN NETWORK-AS-A-SERVICE (NAAS) MARKET, BY TYPE, 2018-2033 (USD THOUSAND)
TABLE 134 CANADA PROFESSIONAL SERVICES IN NETWORK-AS-A-SERVICE (NAAS) MARKET, BY TYPE, 2018-2033 (USD THOUSAND)
TABLE 135 CANADA SOFTWARE IN NETWORK-AS-A-SERVICE (NAAS) MARKET, BY TYPE, 2018-2033 (USD THOUSAND)
TABLE 136 CANADA HARDWARE IN NETWORK-AS-A-SERVICE (NAAS) MARKET, BY TYPE, 2018-2033 (USD THOUSAND)
TABLE 137 CANADA NETWORK-AS-A-SERVICE (NAAS) MARKET, BY APPLICATION, 2018-2033 (USD THOUSAND)
TABLE 138 CANADA NETWORK-AS-A-SERVICE (NAAS) MARKET, BY DEPLOYMET MODE, 2018-2033 (USD THOUSAND)
TABLE 139 CANADA CLOUD IN NETWORK-AS-A-SERVICE (NAAS) MARKET, BY TYPE, 2018-2033 (USD THOUSAND)
TABLE 140 CANADA NETWORK-AS-A-SERVICE (NAAS) MARKET, BY END-USER, 2018-2033 (USD THOUSAND)
TABLE 141 CANADA IT & TELECOM IN NETWORK-AS-A-SERVICE (NAAS) MARKET, BY TYPE, 2018-2033 (USD THOUSAND)
TABLE 142 CANADA BFSI IN NETWORK-AS-A-SERVICE (NAAS) MARKET, BY TYPE, 2018-2033 (USD THOUSAND)
TABLE 143 CANADA MANUFACTURING IN NETWORK-AS-A-SERVICE (NAAS) MARKET, BY TYPE, 2018-2033 (USD THOUSAND)
TABLE 144 CANADA HEALTHCARE & LIFE SCIENCES IN NETWORK-AS-A-SERVICE (NAAS) MARKET, BY TYPE, 2018-2033 (USD THOUSAND)
TABLE 145 CANADA RETAIL & E-COMMERCE IN NETWORK-AS-A-SERVICE (NAAS) MARKET, BY TYPE, 2018-2033 (USD THOUSAND)
TABLE 146 CANADA GOVERNMENT & PUBLIC SECTOR IN NETWORK-AS-A-SERVICE (NAAS) MARKET, BY TYPE, 2018-2033 (USD THOUSAND)
TABLE 147 CANADA EDUCATION IN NETWORK-AS-A-SERVICE (NAAS) MARKET, BY TYPE, 2018-2033 (USD THOUSAND)
TABLE 148 CANADA ENERGY & UTILITIES IN NETWORK-AS-A-SERVICE (NAAS) MARKET, BY TYPE, 2018-2033 (USD THOUSAND)
TABLE 149 CANADA TRANSPORTATION & LOGISTICS IN NETWORK-AS-A-SERVICE (NAAS) MARKET, BY TYPE, 2018-2033 (USD THOUSAND)
TABLE 150 CANADA OTHERS IN NETWORK-AS-A-SERVICE (NAAS) MARKET, BY TYPE, 2018-2033 (USD THOUSAND)
TABLE 151 CANADA NETWORK-AS-A-SERVICE (NAAS) MARKET, BY DISTRIBUTION CHANNEL, 2018-2033 (USD THOUSAND)
TABLE 152 CANADA INDIRECT IN NETWORK-AS-A-SERVICE (NAAS) MARKET, BY TYPE, 2018-2033 (USD THOUSAND)
TABLE 153 MEXICO NETWORK-AS-A-SERVICE (NAAS) MARKET, BY TYPE, 2018-2033 (USD THOUSAND)
TABLE 154 MEXICO WAN-AS-A-SERVICE IN NETWORK-AS-A-SERVICE (NAAS) MARKET, BY TYPE, 2018-2033 (USD THOUSAND)
TABLE 155 MEXICO LAN-AS-A-SERVICE IN NETWORK-AS-A-SERVICE (NAAS) MARKET, BY TYPE, 2018-2033 (USD THOUSAND)
TABLE 156 MEXICO SECURITY-AS-A-SERVICE (SECAAS) IN NETWORK-AS-A-SERVICE (NAAS) MARKET, BY TYPE, 2018-2033 (USD THOUSAND)
TABLE 157 MEXICO CLOUD NETWORK-AS-A-SERVICE IN NETWORK-AS-A-SERVICE (NAAS) MARKET, BY TYPE, 2018-2033 (USD THOUSAND)
TABLE 158 MEXICO NETWORK-AS-A-SERVICE (NAAS) MARKET, BY OFFERING, 2018-2033 (USD THOUSAND)
TABLE 159 MEXICO SERVICE IN NETWORK-AS-A-SERVICE (NAAS) MARKET, BY TYPE, 2018-2033 (USD THOUSAND)
TABLE 160 MEXICO PROFESSIONAL SERVICES IN NETWORK-AS-A-SERVICE (NAAS) MARKET, BY TYPE, 2018-2033 (USD THOUSAND)
TABLE 161 MEXICO SOFTWARE IN NETWORK-AS-A-SERVICE (NAAS) MARKET, BY TYPE, 2018-2033 (USD THOUSAND)
TABLE 162 MEXICO HARDWARE IN NETWORK-AS-A-SERVICE (NAAS) MARKET, BY TYPE, 2018-2033 (USD THOUSAND)
TABLE 163 MEXICO NETWORK-AS-A-SERVICE (NAAS) MARKET, BY APPLICATION, 2018-2033 (USD THOUSAND)
TABLE 164 MEXICO NETWORK-AS-A-SERVICE (NAAS) MARKET, BY DEPLOYMET MODE, 2018-2033 (USD THOUSAND)
TABLE 165 MEXICO CLOUD IN NETWORK-AS-A-SERVICE (NAAS) MARKET, BY TYPE, 2018-2033 (USD THOUSAND)
TABLE 166 MEXICO NETWORK-AS-A-SERVICE (NAAS) MARKET, BY END-USER, 2018-2033 (USD THOUSAND)
TABLE 167 MEXICO IT & TELECOM IN NETWORK-AS-A-SERVICE (NAAS) MARKET, BY TYPE, 2018-2033 (USD THOUSAND)
TABLE 168 MEXICO BFSI IN NETWORK-AS-A-SERVICE (NAAS) MARKET, BY TYPE, 2018-2033 (USD THOUSAND)
TABLE 169 MEXICO MANUFACTURING IN NETWORK-AS-A-SERVICE (NAAS) MARKET, BY TYPE, 2018-2033 (USD THOUSAND)
TABLE 170 MEXICO HEALTHCARE & LIFE SCIENCES IN NETWORK-AS-A-SERVICE (NAAS) MARKET, BY TYPE, 2018-2033 (USD THOUSAND)
TABLE 171 MEXICO RETAIL & E-COMMERCE IN NETWORK-AS-A-SERVICE (NAAS) MARKET, BY TYPE, 2018-2033 (USD THOUSAND)
TABLE 172 MEXICO GOVERNMENT & PUBLIC SECTOR IN NETWORK-AS-A-SERVICE (NAAS) MARKET, BY TYPE, 2018-2033 (USD THOUSAND)
TABLE 173 MEXICO EDUCATION IN NETWORK-AS-A-SERVICE (NAAS) MARKET, BY TYPE, 2018-2033 (USD THOUSAND)
TABLE 174 MEXICO ENERGY & UTILITIES IN NETWORK-AS-A-SERVICE (NAAS) MARKET, BY TYPE, 2018-2033 (USD THOUSAND)
TABLE 175 MEXICO TRANSPORTATION & LOGISTICS IN NETWORK-AS-A-SERVICE (NAAS) MARKET, BY TYPE, 2018-2033 (USD THOUSAND)
TABLE 176 MEXICO OTHERS IN NETWORK-AS-A-SERVICE (NAAS) MARKET, BY TYPE, 2018-2033 (USD THOUSAND)
TABLE 177 MEXICO NETWORK-AS-A-SERVICE (NAAS) MARKET, BY DISTRIBUTION CHANNEL, 2018-2033 (USD THOUSAND)
TABLE 178 MEXICO INDIRECT IN NETWORK-AS-A-SERVICE (NAAS) MARKET, BY TYPE, 2018-2033 (USD THOUSAND)
List of Figure
FIGURE 1 NORTH AMERICA NETWORK-AS-A-SERVICE (NAAS) MARKET : SEGMENTATION
FIGURE 2 NORTH AMERICA NETWORK-AS-A-SERVICE (NAAS) MARKET : DATA TRIANGULATION
FIGURE 3 NORTH AMERICA NETWORK-AS-A-SERVICE (NAAS) MARKET: DROC ANALYSIS
FIGURE 4 NORTH AMERICA NETWORK-AS-A-SERVICE (NAAS) MARKET: NORTH AMERICA VS REGIONAL ANALYSIS
FIGURE 5 NORTH AMERICA NETWORK-AS-A-SERVICE (NAAS) MARKET : COMPANY RESEARCH ANALYSIS
FIGURE 6 NORTH AMERICA NETWORK-AS-A-SERVICE (NAAS) MARKET: INTERVIEW DEMOGRAPHICS
FIGURE 7 NORTH AMERICA NETWORK-AS-A-SERVICE (NAAS) MARKET: DBMR MARKET POSITION GRID
FIGURE 8 NORTH AMERICA NETWORK-AS-A-SERVICE (NAAS) MARKET: MARKET END USER COVERAGE GRID
FIGURE 9 NORTH AMERICA NETWORK-AS-A-SERVICE (NAAS) MARKET : VENDOR SHARE ANALYSIS
FIGURE 10 EXECUTIVE SUMMARY
FIGURE 11 STRATEGIC DECISION
FIGURE 12 NORTH AMERICA NETWORK-AS-A-SERVICE (NAAS) MARKET: SEGMENTATION
FIGURE 13 GROWING ADOPTION OF SD-WAN AND WAN-AS-A-SERVICE FOR ENTERPRISE BRANCH CONNECTIVITY OPTIMIZATION EXPECTED TO DRIVE THE NORTH AMERICA NETWORK-AS-A-SERVICE (NAAS) MARKET IN THE FORECAST PERIOD OF 2026 TO 2033
FIGURE 14 WAN-AS-A-SERVICE SEGMENT IS EXPECTED TO ACCOUNT FOR THE LARGEST SHARE OF THE NORTH AMERICA NETWORK-AS-A-SERVICE (NAAS) MARKET IN 2026 & 2033
FIGURE 15 NORTH AMERICA NETWORK-AS-A-SERVICE (NAAS) MARKET – STRATEGIC DEALS DISTRIBUTION BY TYPE (%)
FIGURE 16 SUPPLY CHAIN ANALYSIS
FIGURE 17 ADOPTION OF NETWORK-AS-A-SERVICE (NAAS) TECHNOLOGIES ACROSS KEY END-USER SEGMENTS – CURRENT TRENDS
FIGURE 18 VALUE CHAIN ANALYSIS
FIGURE 19 DRIVERS, RESTRAINTS, OPPORTUNITIES AND CHALLENGES ANALYSIS OF NORTH AMERICA NETWORK-AS-A-SERVICE MARKET
FIGURE 20 NORTH AMERICA NETWORK-AS-A-SERVICE (NAAS) MARKET : BY TYPE, 2025
FIGURE 21 NORTH AMERICA NETWORK-AS-A-SERVICE (NAAS) MARKET : BY OFFERING, 2025
FIGURE 22 NORTH AMERICA NETWORK-AS-A-SERVICE (NAAS) MARKET : BY APPLICATION, 2025
FIGURE 23 NORTH AMERICA NETWORK-AS-A-SERVICE (NAAS) MARKET : BY DEPLOYMENT MODE, 2025
FIGURE 24 NORTH AMERICA NETWORK-AS-A-SERVICE (NAAS) MARKET: BY END-USER, 2025
FIGURE 25 NORTH AMERICA NETWORK-AS-A-SERVICE (NAAS) MARKET : BY DISTRIBUTION CHANNEL, 2025
FIGURE 26 NORTH AMERICA NETWORK-AS-A-SERVICE (NAAS) MARKET: SNAPSHOT
FIGURE 27 NORTH AMERICA NETWORK AS A SERVICE (NAAS) MARKET: COMPANY SHARE 2025 (%)
Research Methodology
Data collection and base year analysis are done using data collection modules with large sample sizes. The stage includes obtaining market information or related data through various sources and strategies. It includes examining and planning all the data acquired from the past in advance. It likewise envelops the examination of information inconsistencies seen across different information sources. The market data is analysed and estimated using market statistical and coherent models. Also, market share analysis and key trend analysis are the major success factors in the market report. To know more, please request an analyst call or drop down your inquiry.
The key research methodology used by DBMR research team is data triangulation which involves data mining, analysis of the impact of data variables on the market and primary (industry expert) validation. Data models include Vendor Positioning Grid, Market Time Line Analysis, Market Overview and Guide, Company Positioning Grid, Patent Analysis, Pricing Analysis, Company Market Share Analysis, Standards of Measurement, Global versus Regional and Vendor Share Analysis. To know more about the research methodology, drop in an inquiry to speak to our industry experts.
Customization Available
Data Bridge Market Research is a leader in advanced formative research. We take pride in servicing our existing and new customers with data and analysis that match and suits their goal. The report can be customized to include price trend analysis of target brands understanding the market for additional countries (ask for the list of countries), clinical trial results data, literature review, refurbished market and product base analysis. Market analysis of target competitors can be analyzed from technology-based analysis to market portfolio strategies. We can add as many competitors that you require data about in the format and data style you are looking for. Our team of analysts can also provide you data in crude raw excel files pivot tables (Fact book) or can assist you in creating presentations from the data sets available in the report.


