North America Sports Flooring Market
Market Size in USD Billion
CAGR :
% 
 USD
2.35 Billion
USD
3.63 Billion
2025
2033
USD
2.35 Billion
USD
3.63 Billion
2025
2033
| 2026 –2033 | |
| USD 2.35 Billion | |
| USD 3.63 Billion | |
| % | |
|
North America Sports Flooring Market Size
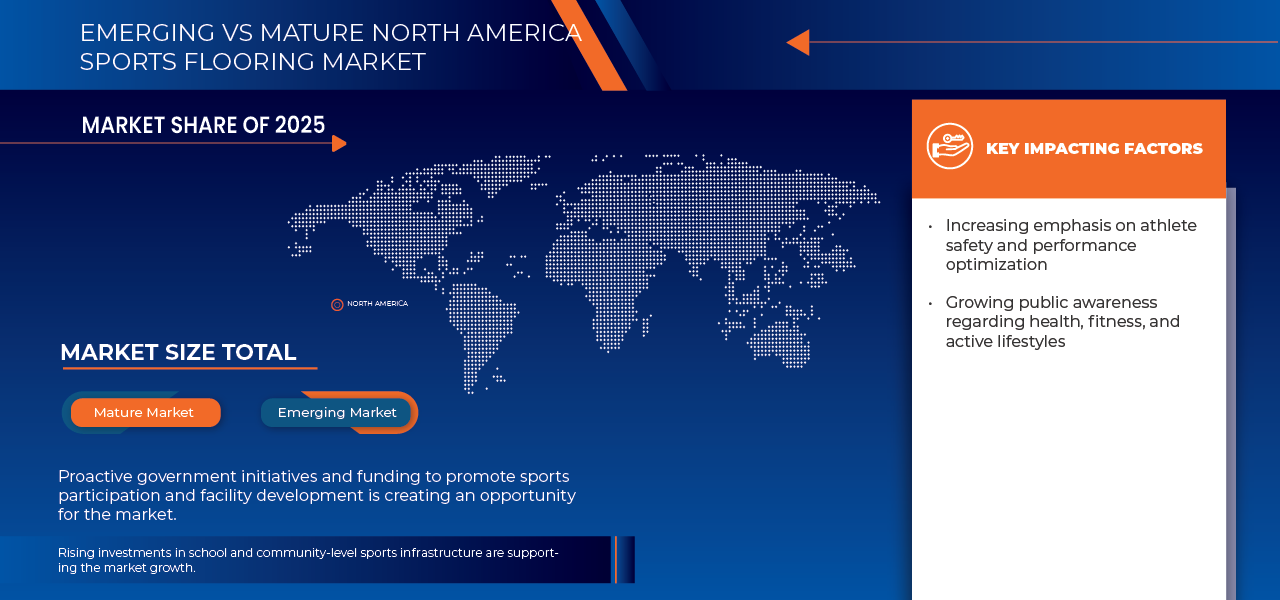
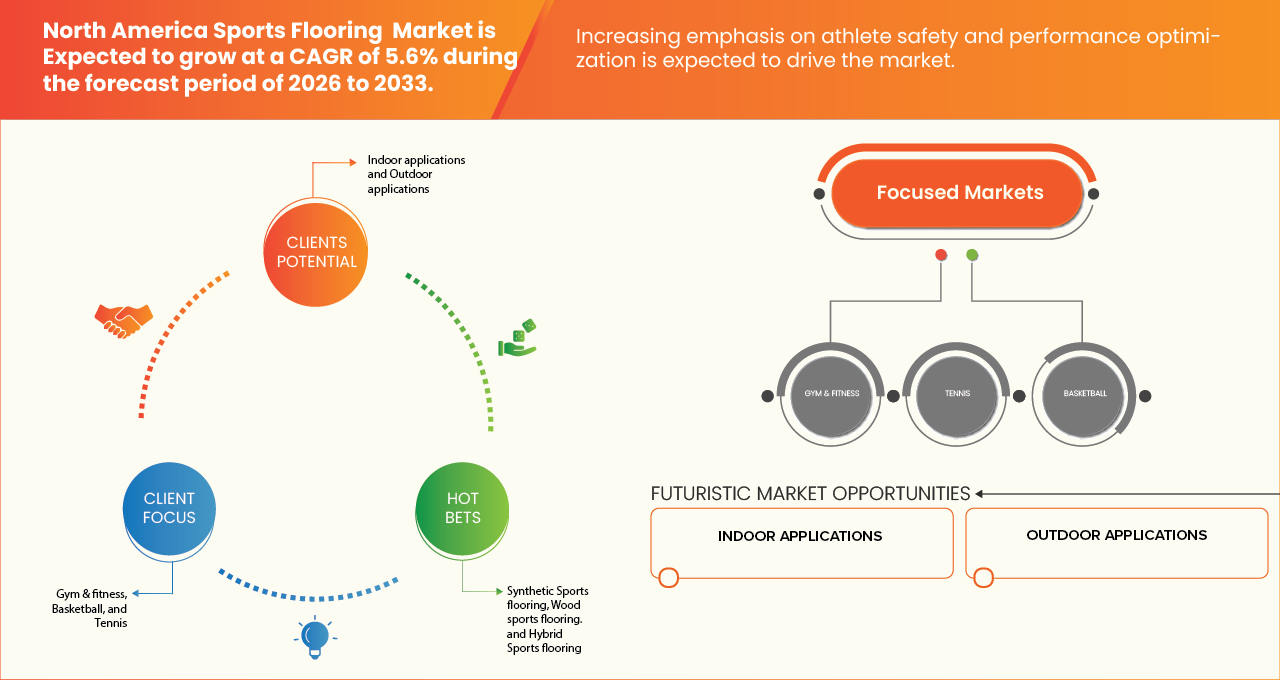
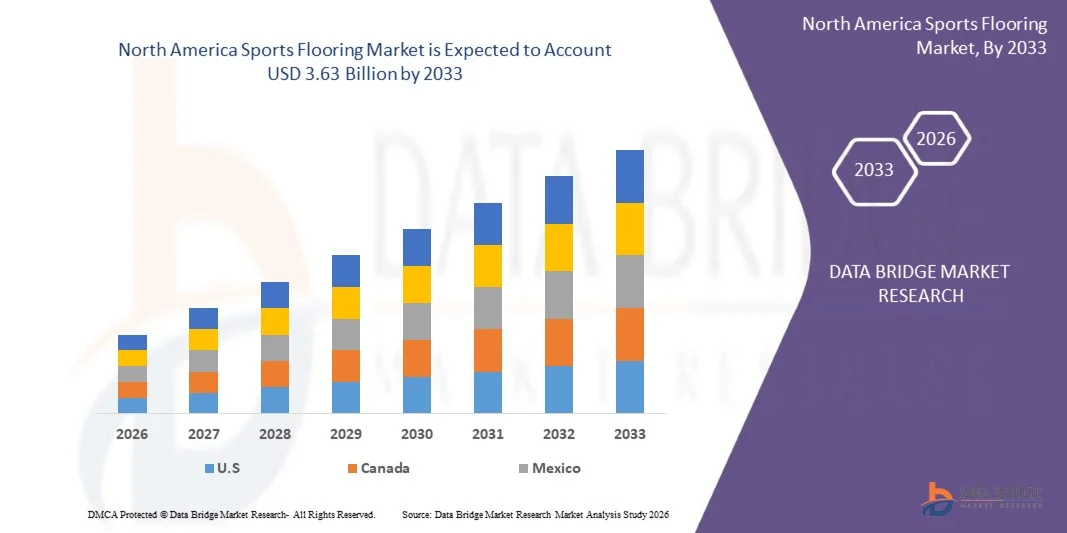
- The North America Sports Flooring Market size was valued at USD 2.35 billion in 2025 and is expected to reach USD 3.63 billion by 2033, at a CAGR of 5.6% during the forecast period 2026-2033.
- The market growth is largely driven by the increasing participation in sports and fitness activities, rising investments in sports infrastructure, gyms, health clubs, and indoor sports facilities, and growing demand for high-performance, durable, and safe sports flooring solutions across schools, stadiums, and training centers.
- Furthermore, increasing government initiatives to promote sports, expansion of multi-purpose indoor arenas, and growing focus on athlete safety, shock absorption, and surface performance are further accelerating the adoption of advanced sports flooring materials such as rubber, vinyl, polyurethane, and engineered wood across the region.
North America Sports Flooring Market Analysis
- Rising health consciousness and increasing participation in sports, fitness activities, and recreational programs are significantly driving the demand for sports flooring solutions. These flooring systems provide enhanced shock absorption, durability, and safety, aligning with the growing emphasis on injury prevention and improved athletic performance across schools, gyms, stadiums, and training facilities.
- The education, sports infrastructure, and commercial fitness sectors are key growth drivers, utilizing advanced sports flooring systems to support high-performance activities and long-term durability. Increasing investments in indoor sports complexes, gymnasiums, health clubs, and community sports centers—along with growing adoption in schools and universities—are expanding market reach and ensuring steady demand throughout the year.
- U.S. is dominated with the highest market share of 78.39% in 2025 due to increasing demand for smaller-scale installations and renovation projects is encouraging the use of distributors, dealers, and retail channels that provide easier product access, faster delivery, and a wide range of sports flooring options for commercial and community facilities
- Mexico is growing with highest CAGR of 6.1% in forecasted period 2026-2033 due to the rapid expansion of private gyms, boutique fitness studios, sports training academies, and recreational clubs across North America
- The Synthetic Sports flooring segment is expected to dominate the North America Sports Flooring Market with a 52,35% share in 2026, driven by its durability, shock absorption properties, low maintenance requirements, and ability to withstand heavy foot traffic.
Report Scope and North America Sports Flooring Market Segmentation
|
Attributes |
North America Sports Flooring Key Market Insights |
|
Segments Covered |
|
|
Key Market Players |
|
|
Market Opportunities |
|
|
Value Added Data Infosets |
In addition to the insights on market scenarios such as market value, growth rate, segmentation, geographical coverage, and major players, the market reports curated by the Data Bridge Market Research also include in-depth expert analysis, pricing analysis, brand share analysis, consumer survey, demography analysis, supply chain analysis, value chain analysis, raw material/consumables overview, vendor selection criteria, PESTLE Analysis, Porter Analysis, and regulatory framework. |
North America Sports Flooring Market Trends
“Increasing Emphasis on Athlete Safety and Performance Optimization”
- With the growing focus on athlete health, safety, and performance, sports facility operators are increasingly investing in high-quality sports flooring solutions that minimize injury risks and enhance playing conditions. Modern sports flooring systems are designed to provide optimal shock absorption, slip resistance, and surface stability, helping reduce stress on joints and muscles during high-impact activities such as basketball, volleyball, futsal, and indoor athletics.
- Advanced sports flooring materials such as polyurethane, rubber, and engineered wood are widely adopted across indoor arenas, gyms, and training centers due to their durability and performance-enhancing properties.
- These flooring systems support consistent ball bounce, traction control, and energy return, enabling athletes to perform efficiently while maintaining safety and comfort during training and competitive events.
- Additionally, increasing investments in sports infrastructure across schools, universities, community recreation centers, and professional sports facilities in North America are accelerating the adoption of certified and high-performance sports flooring systems.
- Manufacturers are also introducing innovative solutions with enhanced cushioning layers, moisture resistance, and easy maintenance features, supporting long-term durability and improved athlete performance while meeting strict safety standards set by sports governing bodies.
North America Sports Flooring Market Dynamics
Driver
“Growing Public Awareness Regarding Health, Fitness, and Active Lifestyles”
- Increasing public awareness about health, fitness, and active lifestyles is significantly driving demand for sports infrastructure and high-performance sports flooring across North America. As more individuals participate in sports, recreational activities, and fitness programs, there is a growing need for safe and durable flooring systems that can support intense physical activity while minimizing injury risks.
- Modern sports flooring technologies have evolved to provide improved shock absorption, impact resistance, and traction control. Innovations in materials such as polyurethane, rubber, vinyl, and engineered wood help enhance athlete comfort and performance while maintaining long-term durability in high-traffic sports environments such as gyms, indoor courts, training facilities, and recreational centers.
- Additionally, advancements in sports flooring design now incorporate multi-layer structures, moisture resistance, and improved surface coatings that maintain consistent performance and reduce maintenance requirements.
- Modern sports flooring systems are designed to provide optimal shock absorption, slip resistance, and surface stability, helping reduce stress on joints and muscles during high-impact activities such as basketball, volleyball, futsal, and indoor athletics.
- These developments ensure better surface stability, player safety, and energy return, making them suitable for a wide range of sports including basketball, volleyball, badminton, and indoor athletics.
Restraint/Challenge
“High Initial Capital Expenditure for Installation and Procurement”
- The high initial capital investment required for the procurement and installation of sports flooring systems is a key restraint for the North America Sports Flooring Market. Advanced flooring solutions such as polyurethane, rubber, vinyl, and engineered wood involve significant upfront costs due to specialized materials, surface treatments, and installation processes. This financial burden can limit adoption, particularly among small schools, community sports centers, and local recreational facilities with constrained budgets.
- In addition to material costs, installation requires skilled labor, proper subfloor preparation, and compliance with performance and safety standards set by sports governing bodies. These requirements increase the overall project cost, making it challenging for organizations to implement high-performance flooring systems without substantial capital expenditure.
- Additionally, maintenance and periodic replacement costs further add to the long-term financial commitment. High-performance sports flooring must maintain shock absorption, traction, and durability over time, which may require resurfacing, repairs, or upgrades to maintain safety and performance standards.
- Smaller facilities with constrained budgets are particularly affected, as limited financial resources often force prioritization of operational expenses over infrastructure upgrades.
- In addition to material and installation costs, maintaining compliance with safety and performance standards set by sports governing bodies further adds to financial pressures.

North America Sports Flooring Market Scope
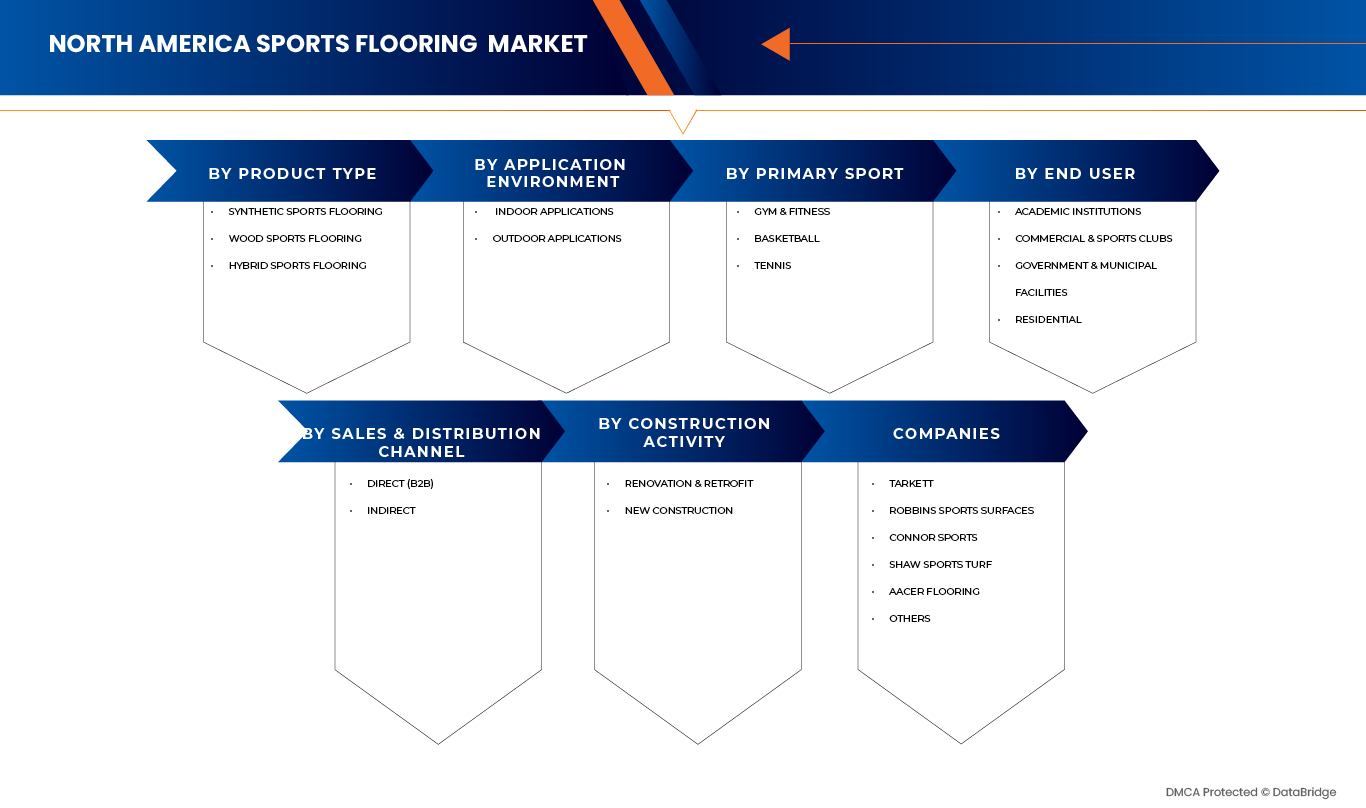
The North America Sports Flooring Market is categorized into six notable segments which are based on product type, application environment, primary sport, end user, sales & distribution channel, and construction activity.
- By Product Type
On the basis of Product Type, the market is segmented into Synthetic Sports flooring, Wood sports flooring, Hybrid Sports flooring. In 2026, the Synthetic Sports Flooring segment is expected to dominate the market with market share of 52.35% and also growing with highest CAGR of 5.9% during forecast period 2026-2033, supported by the increasing preference for high-performance, durable, and impact-resistant flooring solutions. These advanced flooring systems are becoming essential in ensuring athlete safety, consistent performance, and long-term durability across gyms, sports complexes, and multi-purpose activity areas. As organizations and institutions place greater emphasis on providing safe, high-quality facilities for training, competitions, and recreational activities, the demand for technologically enhanced synthetic flooring is steadily rising.
- By Application Environment
On the basis of application environment, North America Sports Flooring Market is segmented into indoor applications and outdoor applications. In 2026, the indoor applications segment is expected to dominate the market with market share of 70.16%, supported by the increasing demand for high-performance, durable, and impact-resistant flooring systems in indoor sports environments. Indoor sports facilities such as gyms, basketball courts, badminton halls, fitness centers, and multi-purpose arenas require specialized flooring that provides superior shock absorption, traction, and consistent surface performance.
The outdoor applications segment is growing with the highest CAGR of 6.1% during forecast period 2026-2033. This growth is driven by increasing investments in outdoor sports infrastructure such as tennis courts, running tracks, playgrounds, and community recreation parks. Rising participation in outdoor recreational activities, along with government initiatives promoting sports and physical fitness, is encouraging the development of modern outdoor facilities.
- By Primary Sport
On the basis of primary sport, North America Sports Flooring Market is segmented into gym & fitness, basketball and tennis. In 2026, the gym & fitness segment is expected to dominate the market with market share of 42.09% and also growing with highest CAGR of 6.3% during forecast period 2026-2033. This growth is supported by the increasing demand for high-performance, durable, and impact-resistant flooring solutions in gyms, health clubs, and fitness centers. As fitness awareness continues to rise across the region, more commercial gyms, boutique fitness studios, and wellness centers are investing in specialized flooring systems that provide shock absorption, slip resistance, and enhanced safety during high-intensity workouts and weight training activities.
- By End User
On the basis of end user, North America Sports Flooring Market is segmented into academic institutions, commercial & sports clubs, government & municipal facilities and residential. In 2026, the academic institutions segment is expected to dominate the market with market share of 39.21%, supported by the increasing investment in sports infrastructure across schools, colleges, and universities. Educational institutions require durable and high-performance sports flooring for gymnasiums, indoor courts, and multi-purpose activity halls that can support a variety of sports such as basketball, volleyball, badminton, and indoor athletics.
The commercial & sports clubs segment is growing with the highest CAGR of 6.5% during forecast period 2026-2033. This growth is driven by the rapid expansion of private fitness centers, sports training academies, health clubs, and recreational facilities across North America.
- By Sales & Distribution Channel
On the basis of sales & distribution channel, North America Sports Flooring Market is segmented into direct (b2b) and indirect. In 2026, the direct (b2b) segment is expected to dominate the market with market share of 62.98%, supported by increasing investments in sports infrastructure across schools, colleges, universities, professional sports facilities, and government-funded recreational centers. Large-scale projects typically involve direct procurement from manufacturers or specialized contractors to ensure customized flooring solutions, quality assurance, and compliance with international sports performance and safety standards.
The indirect segment is growing with the highest CAGR of 6.5% during forecast period 2026-2033. This growth is driven by the rapid expansion of private gyms, boutique fitness studios, sports training academies, and recreational clubs across North America. Increasing demand for smaller-scale installations and renovation projects is encouraging the use of distributors, dealers, and retail channels that provide easier product access, faster delivery, and a wide range of sports flooring options for commercial and community facilities.
- By Construction Activity
On the basis of construction activity, North America Sports Flooring Market is segmented into renovation & retrofit and new construction. In 2026, the renovation & retrofit segment is expected to dominate the market with market share of 67.00%, supported by the growing need to upgrade aging sports infrastructure across schools, colleges, universities, professional sports arenas, and government-funded recreational facilities. Many existing sports venues are replacing outdated or worn-out flooring systems with modern, high-performance materials that provide improved shock absorption, durability, and safety.
The new construction segment is growing with the highest CAGR of 6.1% during forecast period 2026-2033. This growth is driven by the increasing development of new sports complexes, fitness centers, training academies, and multi-purpose recreational facilities across North America. Rising investments in sports infrastructure, growing participation in fitness and recreational activities, and government initiatives promoting active lifestyles are encouraging the construction of modern sports venues equipped with advanced flooring systems designed for high performance and long-term durability.
North America Sports Flooring Market Regional Analysis
- U.S. dominates the Market with the largest revenue share 78.39% in 2025, driven by high investments in professional sports arenas, educational institutions, and community recreation centers.
- Growing participation in indoor and outdoor sports, coupled with stringent safety and performance regulations by sports governing bodies, fuels demand for advanced flooring systems such as polyurethane, vinyl, rubber, and engineered wood.
- Continuous infrastructure development and renovation projects, particularly in gyms, schools, and multipurpose sports facilities, further position the U.S. as the largest growth engine for the North American market.
Canada North America Sports Flooring Market
The Canadian market is expanding due to increasing investments in educational sports facilities, municipal recreation centers, and fitness clubs. The adoption of high-performance and multi-sport flooring solutions is supported by safety standards compliance, durability requirements for extreme climates, and government initiatives promoting youth sports. Renovation of older gymnasiums and growth in indoor sports leagues accelerate demand across the country.
Mexico North America Sports Flooring Market
Mexico’s North America Sports Flooring Market is growing with highest CAGR of 6.1% during forecast period 2026-2033 due to modernization of educational and community sports facilities and the growth of professional indoor sports leagues. Rising urbanization, investment in school and university infrastructure, and increasing awareness of athlete safety and performance contribute to market expansion. Demand for durable, cost-effective flooring solutions that can withstand high traffic in gyms, multipurpose halls, and recreational centers is fueling adoption in the country.
North America Sports Flooring Market Share
The North America Sports Flooring Market industry is primarily led by well-established companies, including:
- Tarkett (France)
- Connor Sports (U.S.)
- Robbins Sports Surfaces (U.S.)
- Shaw Sports Turf (Georgia)
- Aacer Flooring (U.S.)
- Mats Inc. (U.S.)
- MONDO S.p.A. (Italy)
- Polyflor Ltd (U.K.)
- COASTAL SPORTS FLOORS (U.S.)
- FieldTurf (U.S.)
- Horner Flooring (U.S.)
- Junckers Industrier A/S. (Denmark)
- GRABO (Hungary)
- Kiefer USA (U.S.)
- ACTION FLOOR SYSTEMS, LLC (U.S.)
- ALLIED PRODUCTS (U.S.)
- Roppe Corporation (parent of Armour rubber) (U.S.)
- CENTAUR PRODUCTS INC. (Canada)
- ModuTile (U.S.)
- AHF, LLC (Parent company of ARMSTRONG FLOORING, INC.) (U.S.)
Latest Developments in North America Sports Flooring Market
- In November 2025, Tarkett has achieved a major sustainability milestone with the introduction of the world’s first carbon-negative linoleum flooring, accounting for all life-cycle stages from production to end-of-life. The product is made from renewable materials and is integrated into a closed-loop recycling system, significantly reducing environmental impact. This innovation reinforces Tarkett’s commitment to sustainable building solutions, offering architects, designers, and facility managers a high-performance, eco-friendly flooring option that actively reduces carbon footprint. The carbon-negative linoleum strengthens Tarkett’s leadership in green building materials.
- In September 2025, Shaw Sports Turf was spotlighted on the Inside the Headset with the AFCA podcast, where Game ON technology — the company’s innovative synthetic turf design approach — was discussed in depth. The feature explains how Game ON’s factory-tufted lines, logos, numbers, and graphics offer expanded creative capabilities, improve safety by eliminating seams, and speed up installation compared with traditional turf systems. Examples from schools including the University of Kansas and the University of Denver highlight how unique field designs applying this technology are gaining attention nationwide.
- In December 2023, Action Floor Systems has introduced five new flooring products, including the Action SL series of polyurethane systems designed for high‑traffic commercial, industrial and decorative use, along with the Action 33 Blue synthetic sports flooring system optimized for shock absorption and athletic performance. The Action SL series offers durable, low‑VOC polyurethane solutions for busy environments, while Action 33 Blue delivers enhanced cushioning and energy restitution for basketball, volleyball, aerobics and training facilities in a choice of standard colors. This product rollout expands Action Floor Systems’ market reach across both commercial and athletic segments by delivering performance‑driven, eco‑friendly flooring solutions.
- In June 2023, AHF Products has united its three leading commercial flooring brands. Armstrong Flooring, Parterre, and AHF Contract to deliver a cohesive, design‑driven portfolio of commercial flooring solutions that blend performance, flexibility, and aesthetics for sectors like healthcare, education, retail, and hospitality. This strategic alignment showcases the combined strength of the brands at major industry events, highlighting innovative products and unified design capabilities that meet evolving customer and specifier needs. This integrated brand approach enhances market visibility and simplifies customer choice, strengthening AHF’s competitive position in the commercial flooring segment
SKU-
Get online access to the report on the World's First Market Intelligence Cloud

- Interactive Data Analysis Dashboard
- Company Analysis Dashboard for high growth potential opportunities
- Research Analyst Access for customization & queries
- Competitor Analysis with Interactive dashboard
- Latest News, Updates & Trend analysis
- Harness the Power of Benchmark Analysis for Comprehensive Competitor Tracking
Table of Content
1 INTRODUCTION
1.1 OBJECTIVES OF THE STUDY
1.2 MARKET DEFINITION
1.3 OVERVIEW
1.4 LIMITATIONS
1.5 MARKETS COVERED
2 MARKET SEGMENTATION
2.1 MARKETS COVERED
2.2 GEOGRAPHICAL SCOPE
2.3 YEARS CONSIDERED FOR THE STUDY
2.4 CURRENCY AND PRICING
2.5 DBMR TRIPOD DATA VALIDATION MODEL
2.6 MULTIVARIATE MODELING
2.7 PRIMARY INTERVIEWS WITH KEY OPINION LEADERS
2.8 DBMR MARKET POSITION GRID
2.9 MARKET APPLICATION COVERAGE GRID
2.1 DBMR VENDOR SHARE ANALYSIS
2.11 SECONDARY SOURCES
2.12 ASSUMPTIONS
3 EXECUTIVE SUMMARY
4 PREMIUM INSIGHTS
4.1 PORTER’S FIVE FORCES: NORTH AMERICA SPORTS FLOORING MARKET
4.1.1 THREAT OF NEW ENTRANTS (LOW)
4.1.2 THREAT OF SUBSTITUTES (LOW TO MEDIUM)
4.1.3 CUSTOMER BARGAINING POWER (HIGH)
4.1.4 SUPPLIER BARGAINING POWER (LOW TO MEDIUM)
4.1.5 COMPETITIVE RIVALRY (HIGH)
4.2 RAW MATERIAL COVERAGE
4.3 VENDOR SELECTION CRITERIA
4.4 TECHNOLIGICAL ADVANCEMENT
4.5 VALUE CHAIN ANALYSIS
4.5.1 RAW MATERIAL SOURCING
4.5.2 MANUFACTURING AND SYSTEM ENGINEERING
4.5.3 OUTBOUND LOGISTICS
4.5.4 MARKETING AND SALES
4.5.5 INSTALLATION & AFTER-SALES SERVICE
4.6 INNOVATION TRACKER AND STRATEGIC ANALYSIS
4.6.1 INTRODUCTION
4.6.2 MAJOR DEALS AND STRATEGIC ALLIANCES ANALYSIS
4.6.2.1 JOINT VENTURES
4.6.2.2 MERGERS AND ACQUISITIONS
4.6.2.3 LICENSING AND PARTNERSHIP
4.6.2.4 TECHNOLOGY COLLABORATIONS
4.6.2.5 STRATEGIC DIVESTMENTS
4.6.3 NUMBER OF PRODUCTS IN DEVELOPMENT
4.6.4 STAGE OF DEVELOPMENT
4.6.5 TIMELINES AND MILESTONES
4.6.6 INNOVATION STRATEGIES AND METHODOLOGIES
4.6.7 RISK ASSESSMENT AND MITIGATION
4.6.8 FUTURE OUTLOOK
4.6.9 CONCLUSION
4.7 PRICING ANALYSIS
4.7.1 INTRODUCTION
4.8 SUPPLY CHAIN ANALYSIS –
4.8.1 INTRODUCTION
4.8.2 RAW INPUT SOURCING & PROCUREMENT
4.8.3 PROCESSING & PRODUCT MANUFACTURING (PRODUCTION)
4.8.4 SUPPLY CHAIN & DISTRIBUTION LOGISTICS (TRANSPORTATION)
4.8.5 RETAIL & COMMERCIAL BUYER CHANNELS (DISTRIBUTION & SALES)
4.8.6 CONCLUSION
5 TARIFFS & IMPACT–
5.1 INTRODUCTION
5.2 CURRENT TARIFF RATE(S) IN TOP-5 COUNTRY MARKETS
5.3 OUTLOOK: LOCAL PRODUCTION V/S IMPORT RELIANCE
5.4 VENDOR SELECTION CRITERIA DYNAMICS
5.5 IMPACT ON SUPPLY CHAIN
5.5.1 RAW MATERIAL PROCUREMENT
5.5.2 MANUFACTURING AND PRODUCTION
5.5.3 LOGISTICS AND DISTRIBUTION
5.5.4 PRICE PITCHING AND POSITION OF MARKET
5.6 INDUSTRY PARTICIPANTS: PROACTIVE MOVES
5.6.1 SUPPLY CHAIN OPTIMIZATION
5.6.2 JOINT VENTURE ESTABLISHMENTS
5.7 IMPACT ON PRICES
5.8 REGULATORY INCLINATION
5.8.1 GEOPOLITICAL SITUATION
5.8.2 TRADE PARTNERSHIPS BETWEEN THE COUNTRIES
5.8.2.1 FREE TRADE AGREEMENTS
5.8.2.2 ALLIANCE ESTABLISHMENTS
5.8.3 STATUS ACCREDITATION (INCLUDING MFN)
5.8.4 DOMESTIC COURSE OF CORRECTION
5.8.4.1 INCENTIVE SCHEMES TO BOOST PRODUCTION OUTPUTS
5.8.4.2 ESTABLISHMENT OF SPECIAL ECONOMIC ZONES / INDUSTRIAL PARKS
5.9 CONCLUSION
6 REGULATION COVERAGE
6.1 PRODUCT CODES
6.2 CERTIFIED STANDARDS
6.3 SAFETY STANDARDS
6.3.1 MATERIAL HANDLING & STORAGE
6.3.2 TRANSPORT & PRECAUTIONS
6.3.3 HAZARD IDENTIFICATION
7 MARKET OVERVIEW
7.1 DRIVERS
7.1.1 INCREASING EMPHASIS ON ATHLETE SAFETY AND PERFORMANCE OPTIMIZATION
7.1.2 GROWING PUBLIC AWARENESS REGARDING HEALTH, FITNESS, AND ACTIVE LIFESTYLES
7.1.3 RISING INVESTMENTS IN SCHOOL AND COMMUNITY-LEVEL SPORTS INFRASTRUCTURE
7.2 RESTRAINTS
7.2.1 HIGH INITIAL CAPITAL EXPENDITURE FOR INSTALLATION AND PROCUREMENT
7.2.2 INCONSISTENT CONSUMER PERFORMANCE EXPECTATIONS ACROSS APPLICATIONS
7.3 OPPORTUNITIES
7.3.1 PROACTIVE GOVERNMENT INITIATIVES AND FUNDING TO PROMOTE SPORTS PARTICIPATION AND FACILITY DEVELOPMENT
7.3.2 SUSTAINABILITY & ECO-FRIENDLY MATERIALS ADOPTION IN SPORTS INFRASTRUCTURE DEVELOPMENT
7.4 CHALLENGES
7.4.1 INTENSIFYING COMPETITION AMONG MANUFACTURERS LEADING TO PRESSURE ON PROFIT MARGINS
7.4.2 STRICT REGULATORY STANDARDS GOVERNING FLOORING INSTALLATION AND COMPLIANCE
8 NORTH AMERICA SPORTS FLOORING MARKET, BY PRODUCT TYPE
8.1 OVERVIEW
8.2 NORTH AMERICA SPORTS FLOORING MARKET, BY PRODUCT TYPE, 2018-2033 (USD THOUSAND)
8.2.1 SYNTHETIC SPORTS FLOORING
8.2.2 WOOD SPORTS FLOORING
8.2.3 HYBRID SPORTS FLOORING
8.3 NORTH AMERICA SYNTHETIC SPORTS FLOORING IN SPORTS FLOORING MARKET, BY FORM FACTOR, 2018-2033 (USD THOUSAND)
8.3.1 ROLLS
8.3.2 TILES
8.3.3 SHEETS
8.3.4 MODULAR PANELS
8.4 NORTH AMERICA SYNTHETIC SPORTS FLOORING IN SPORTS FLOORING MARKET, BY INSTALLATION METHOD, 2018-2033 (USD THOUSAND)
8.4.1 ADHESIVE-BONDED
8.4.2 INTERLOCKING
8.4.3 LOOSE LAY
8.4.4 FLOATING SYSTEM
8.5 NORTH AMERICA SYNTHETIC SPORTS FLOORING IN SPORTS FLOORING MARKET, BY SYSTEM MOBILITY, 2018-2033 (USD THOUSAND)
8.5.1 PERMANENT SYSTEMS
8.5.2 SEMI-PERMANENT SYSTEMS
8.5.3 PORTABLE / REMOVABLE SYSTEMS
8.6 NORTH AMERICA SYNTHETIC SPORTS FLOORING IN SPORTS FLOORING MARKET, BY FUNCTIONAL PROPERTIES, 2018-2033 (USD THOUSAND)
8.6.1 SHOCK ABSORBING
8.6.2 SLIP RESISTANT
8.6.3 MOISTURE RESISTANT
8.6.4 UV RESISTANT
8.6.5 ANTIMICROBIAL
8.6.6 FIRE RETARDANT
8.6.7 TEXTURED / NON-TEXTURED
8.7 NORTH AMERICA SYNTHETIC SPORTS FLOORING IN SPORTS FLOORING MARKET, BY RAW MATERIAL, 2018-2033 (USD THOUSAND)
8.7.1 POLYVINYL CHLORIDE (PVC)
8.7.2 POLYURETHANE (PU)
8.7.3 RUBBER BLENDS
8.7.4 POLYPROPYLENE
8.7.5 RECYCLED PLASTICS
8.7.6 ELASTOMERIC POLYMERS
8.7.7 BIO-BASED POLYMERS
8.7.8 OTHER SYNTHETIC MATERIALS
8.8 NORTH AMERICA WOOD SPORTS FLOORING IN SPORTS FLOORING MARKET, BY WOOD SPECIES, 2018-2033 (USD THOUSAND)
8.8.1 MAPLE
8.8.2 OAK
8.8.3 BEECH
8.8.4 ASH
8.8.5 BIRCH
8.8.6 WALNUT
8.9 NORTH AMERICA WOOD SPORTS FLOORING IN SPORTS FLOORING MARKET, BY WOOD CONSTRUCTION TYPE, 2018-2033 (USD THOUSAND)
8.9.1 SOLID WOOD
8.9.2 ENGINEERED WOOD
8.9.3 MULTI-LAYER SYSTEMS
8.9.4 LAMINATED SYSTEMS
8.9.5 BAMBOO-BASED SYSTEMS
8.1 NORTH AMERICA WOOD SPORTS FLOORING IN SPORTS FLOORING MARKET, BY SURFACE FINISH, 2018-2033 (USD THOUSAND)
8.10.1 GLOSSY
8.10.2 LACQUERED
8.10.3 UV-CURED
8.10.4 MATTE
8.10.5 OIL FINISHED
8.10.6 TEXTURED
8.11 NORTH AMERICA HYBRID SPORTS FLOORING IN SPORTS FLOORING MARKET, BY STRUCTURAL COMPOSITION, 2018-2033 (USD THOUSAND)
8.11.1 FOAM-BACKED SYSTEMS
8.11.2 VINYL-TOPPED PLYWOOD
8.11.3 WOOD–POLYMER COMPOSITE
8.11.4 SANDWICH PANEL SYSTEMS
8.11.5 RUBBER-INFUSED LAMINATES
8.11.6 FIBER-REINFORCED COMPOSITES
8.11.7 CORK-BACKED SYSTEMS
9 NORTH AMERICA SPORTS FLOORING MARKET, BY APPLICATION ENVIRONMENT
9.1 OVERVIEW
9.2 NORTH AMERICA SPORTS FLOORING MARKET, BY APPLICATION ENVIRONMENT, 2018-2033 (USD THOUSAND)
9.2.1 INDOOR APPLICATIONS
9.2.2 OUTDOOR APPLICATIONS
9.3 NORTH AMERICA INDOOR APPLICATIONS IN SPORTS FLOORING MARKET, BY FACILITY TYPE, 2018-2033 (USD THOUSAND)
9.3.1 GYMNASIUMS
9.3.2 COURTS
9.3.3 FITNESS CENTERS
9.3.4 MULTIPURPOSE HALLS
9.3.5 INDOOR FIELDS
9.3.6 INDOOR TRACKS
9.3.7 YOGA & STUDIO SPACES
9.3.8 LOCKER & CHANGING ROOMS
9.4 NORTH AMERICA OUTDOOR APPLICATIONS IN SPORTS FLOORING MARKET, BY FACILITY TYPE, 2018-2033 (USD THOUSAND)
9.4.1 FIELDS
9.4.2 COURTS
9.4.3 PLAYGROUNDS
9.4.4 TRACKS
9.4.5 STADIUMS
9.4.6 OUTDOOR FITNESS ZONES
9.4.7 SKATE PARKS
10 NORTH AMERICA SPORTS FLOORING MARKET, BY PRIMARY SPORT
10.1 OVERVIEW
10.2 NORTH AMERICA SPORTS FLOORING MARKET, BY PRIMARY SPORT, 2018-2033 (USD THOUSAND)
10.2.1 GYM & FITNESS
10.2.2 BASKETBALL
10.2.3 TENNIS
10.3 NORTH AMERICA GYM & FITNESS IN SPORTS FLOORING MARKET, BY FUNCTIONAL ZONE, 2018-2033 (USD THOUSAND)
10.3.1 FREE WEIGHT
10.3.2 CARDIO
10.3.3 FUNCTIONAL TRAINING
10.4 NORTH AMERICA BASKETBALL IN SPORTS FLOORING MARKET, BY INSTALLATION, 2018-2033 (USD THOUSAND)
10.4.1 RENOVATION/RETROFIT
10.4.2 NEW CONSTRUCTION
10.4.3 REPAIR/REPLACEMENT
10.4.4 PERMANENT SYSTEM
10.4.5 PORTABLE COURT
10.4.6 MOBILE FLOORING
10.4.7 TEMPORARY INSTALLATION
10.4.8 EVENT-SPECIFIC
10.5 NORTH AMERICA BASKETBALL IN SPORTS FLOORING MARKET, BY LEVEL OF PLAY, 2018-2033 (USD THOUSAND)
10.5.1 SCHOOL
10.5.2 COLLEGIATE
10.5.3 COMMUNITY/RECREATIONAL
10.5.4 LEAGUE/CLUB
10.5.5 TRAINING
10.5.6 PROFESSIONAL
10.5.7 MULTILEVEL
10.6 NORTH AMERICA TENNIS IN SPORTS FLOORING MARKET, BY COURT TYPE, 2018-2033 (USD THOUSAND)
10.6.1 HARD COURT
10.6.2 CUSHIONED SYSTEM
10.6.3 INDOOR TENNIS
10.6.4 OUTDOOR TENNIS
10.6.5 SYNTHETIC TURF COURT
10.6.6 MODULAR TILE COURT
10.6.7 CLAY COURT
10.6.8 HYBRID COURT
10.7 NORTH AMERICA TENNIS IN SPORTS FLOORING MARKET, BY LEVEL OF PLAY, 2018-2033 (USD THOUSAND)
10.7.1 SCHOOL
10.7.2 PUBLIC
10.7.3 PRIVATE
10.7.4 AMATEUR
10.7.5 LEAGUE
10.7.6 PROFESSIONAL
10.7.7 EVENT-SPECIFIC
11 NORTH AMERICA SPORTS FLOORING MARKET, BY END USER
11.1 OVERVIEW
11.2 NORTH AMERICA SPORTS FLOORING MARKET, BY END USER, 2018-2033 (USD THOUSAND)
11.2.1 ACADEMIC INSTITUTIONS
11.2.2 COMMERCIAL & SPORTS CLUBS
11.2.3 GOVERNMENT & MUNICIPAL FACILITIES
11.2.4 RESIDENTIAL
11.3 NORTH AMERICA ACADEMIC INSTITUTIONS IN SPORTS FLOORING MARKET, BY TYPE, 2018-2033 (USD THOUSAND)
11.3.1 SCHOOLS
11.3.2 COLLEGES
11.3.3 UNIVERSITIES
11.3.4 SPORTS ACADEMIES
11.3.5 PRIVATE INSTITUTIONS
11.3.6 COMMUNITY SCHOOLS
11.3.7 INTERNATIONAL SCHOOLS
11.3.8 SPECIALTY SPORTS SCHOOLS
11.4 NORTH AMERICA COMMERCIAL & SPORTS CLUBS IN SPORTS FLOORING MARKET, BY TYPE, 2018-2033 (USD THOUSAND)
11.4.1 GYMS
11.4.2 FITNESS CHAINS
11.4.3 COMMUNITY RECREATION CENTERS
11.4.4 SPORTS FRANCHISES
11.4.5 PRIVATE CLUBS
11.4.6 EVENT VENUES
11.4.7 HOTEL & RESORT FITNESS ROOM
11.4.8 HEALTH CLINIC/PHYSIOTHERAPY
11.5 NORTH AMERICA GOVERNMENT & MUNICIPAL FACILITIES IN SPORTS FLOORING MARKET, BY AREA, 2018-2033 (USD THOUSAND)
11.5.1 PUBLIC SPORTS COMPLEXES
11.5.2 MUNICIPAL GYMS
11.5.3 PARK DISTRICTS
11.5.4 COMMUNITY CENTERS
11.5.5 RECREATIONAL DEPARTMENTS
11.5.6 YOUTH SPORTS PROGRAMS
11.5.7 MILITARY BASES
11.5.8 PRISON/REHABILITATION CENTERS
11.6 NORTH AMERICA RESIDENTIAL IN SPORTS FLOORING MARKET, BY INSTALLATION AREA, 2018-2033 (USD THOUSAND)
11.6.1 HOME GYMS
11.6.2 GARAGE CONVERSIONS
11.6.3 YOGA/EXERCISE ROOMS
11.6.4 KIDS' PLAY AREA
11.6.5 OUTDOOR COURTS
11.6.6 MULTIPURPOSE ROOMS
11.6.7 PERSONAL TRAINING STUDIOS
11.6.8 BASEMENT APPLICATIONS
12 NORTH AMERICA SPORTS FLOORING MARKET, BY SALES & DISTRIBUTION CHANNEL
12.1 OVERVIEW
12.2 NORTH AMERICA SPORTS FLOORING MARKET, BY SALES & DISTRIBUTION CHANNEL, 2018-2033 (USD THOUSAND)
12.2.1 DIRECT (B2B)
12.2.2 INDIRECT
12.3 NORTH AMERICA DIRECT (B2B) IN SPORTS FLOORING MARKET, BY TYPE, 2018-2033 (USD THOUSAND)
12.3.1 CONTRACTORS
12.3.2 ARCHITECTS
12.3.3 GOVERNMENT AGENCIES
12.3.4 SPORTS ASSOCIATIONS
12.3.5 INSTITUTIONAL BUYERS
12.4 NORTH AMERICA INDIRECT IN SPORTS FLOORING MARKET, BY TYPE, 2018-2033 (USD THOUSAND)
12.4.1 SPECIALTY RETAILERS
12.4.2 DISTRIBUTORS
12.4.3 HOME IMPROVEMENT CHAINS
12.4.4 ONLINE / E-COMMERCE
12.4.5 INSTALLER NETWORKS
13 NORTH AMERICA SPORTS FLOORING MARKET, BY CONSTRUCTION ACTIVITY
13.1 OVERVIEW
13.2 NORTH AMERICA SPORTS FLOORING MARKET, BY CONSTRUCTION ACTIVITY, 2018-2033 (USD THOUSAND)
13.2.1 RENOVATION & RETROFIT
13.2.2 NEW CONSTRUCTION
13.3 NORTH AMERICA RENOVATION & RETROFIT IN SPORTS FLOORING MARKET, BY TYPE, 2018-2033 (USD THOUSAND)
13.3.1 SCHOOL GYMS
13.3.2 COMMUNITY CENTERS
13.3.3 FITNESS CHAINS
13.3.4 TRAINING COMPLEXES
13.3.5 MULTIPURPOSE HALLS
13.3.6 RESIDENTIAL PROJECTS
13.3.7 REGIONAL STADIUMS
13.3.8 MEGA SPORTS VENUES
13.4 NORTH AMERICA NEW CONSTRUCTION IN SPORTS FLOORING MARKET, BY TYPE, 2018-2033 (USD THOUSAND)
13.4.1 SCHOOL GYMS
13.4.2 COMMUNITY CENTERS
13.4.3 FITNESS CHAINS
13.4.4 RESIDENTIAL PROJECTS
13.4.5 TRAINING COMPLEXES
13.4.6 MULTIPURPOSE HALLS
13.4.7 REGIONAL STADIUMS
13.4.8 MEGA SPORTS VENUES
14 NORTH AMERICA SPORTS FLOORING MARKET, COUNTRY
14.1 NORTH AMERICA
14.1.1 U.S.
14.1.2 CANADA
14.1.3 MEXICO
15 NORTH AMERICA SPORTS FLOORING MARKET: COMPANY LANDSCAPE
15.1 COMPANY SHARE ANALYSIS: NORTH AMERICA
16 SWOT ANALYSIS
17 COMPANY PROFILE
17.1 TARKETT S.A.
17.1.1 COMPANY SNAPSHOT
17.1.2 REVENUE ANALYSIS
17.1.3 PRODUCT PORTFOLIO
17.1.4 RECENT DEVELOPMENT
17.2 ROBBINS SPORTS SURFACES
17.2.1 COMPANY SNAPSHOT
17.2.2 PRODUCT PORTFOLIO
17.2.3 RECENT DEVELOPMENT
17.3 CONNOR SPORTS
17.3.1 COMPANY SNAPSHOT
17.3.2 PRODUCT PORTFOLIO
17.3.3 RECENT DEVELOPMENT
17.4 SHAW SPORTS TURF
17.4.1 COMPANY SNAPSHOT
17.4.2 PRODUCT PORTFOLIO
17.4.3 RECENT DEVELOPMENT
17.5 AACER FLOORING
17.5.1 COMPANY SNAPSHOT
17.5.2 PRODUCT PORTFOLIO
17.5.3 RECENT DEVELOPMENT
17.6 ACTION FLOOR SYSTEMS LLC
17.6.1 COMPANY SNAPSHOT
3.3 PRODUCT PORTFOLIO
17.6.2 RECENT DEVELOPMENT
17.7 ALLIED PRODUCTS, LLC
17.7.1 COMPANY SNAPSHOT
17.7.2 PRODUCT PORTFOLIO
17.7.3 RECENT DEVELOPMENT
17.8 ROPPE CORPORATION (PARENT OF ARMOUR RUBBER)
17.8.1 COMPANY SNAPSHOT
17.8.2 PRODUCT PORTFOLIO
17.8.3 RECENT DEVELOPMENT
17.9 AHF PRODUCTS (PARENT COMPANY OF ARMSTRONG FLOORING, INC.)
17.9.1 COMPANY SNAPSHOT
17.9.2 PRODUCT PORTFOLIO
17.9.3 RECENT DEVELOPMENT
17.1 CENTAUR PRODUCTS
17.10.1 COMPANY SNAPSHOT
17.10.2 PRODUCT PORTFOLIO
17.10.3 RECENT DEVELOPMENT
17.11 COASTAL SPORTS FLOORS.
17.11.1 COMPANY SNAPSHOT
17.11.2 PRODUCT PORTFOLIO
17.11.3 RECENT DEVELOPMENT
17.12 FIELDTURF.
17.12.1 COMPANY SNAPSHOT
17.12.2 PRODUCT PORTFOLIO
17.12.3 RECENT DEVELOPMENT
17.13 GRABO
17.13.1 COMPANY SNAPSHOT
17.13.2 PRODUCT PORTFOLIO
17.13.3 RECENT DEVELOPMENT
17.14 HORNER FLOORING
17.14.1 COMPANY SNAPSHOT
17.14.2 PRODUCT PORTFOLIO
17.14.3 RECENT DEVELOPMENT
17.15 JUNCKERS INDUSTRIER A/S.
17.15.1 COMPANY SNAPSHOT
17.15.2 PRODUCT PORTFOLIO
17.15.3 RECENT DEVELOPMENT
17.16 KIEFER USA
17.16.1 COMPANY SNAPSHOT
17.16.2 PRODUCT PORTFOLIO
17.16.3 RECENT DEVELOPMENT
17.17 MATS INC.
17.17.1 COMPANY SNAPSHOT
17.17.2 PRODUCT PORTFOLIO
17.17.3 RECENT DEVELOPMENT
17.18 MONDO S.P.A.
17.18.1 COMPANY SNAPSHOT
17.18.2 PRODUCT PORTFOLIO
17.18.3 RECENT DEVELOPMENT
17.19 POLYFLOR LTD.
17.19.1 COMPANY SNAPSHOT
17.19.2 PRODUCT PORTFOLIO
17.19.3 RECENT DEVELOPMENT
17.2 MODUTILE
17.20.1 COMPANY SNAPSHOT
17.20.2 PRODUCT PORTFOLIO
17.20.3 RECENT DEVELOPMENT
18 QUESTIONNAIRE
19 RELATED REPORTS
List of Table
TABLE 1 INTEGRATED SUPPLY CHAIN FRAMEWORK AND VALUE FLOW ANALYSIS
TABLE 2 NORTH AMERICA SPORTS FLOORING MARKET, BY PRODUCT TYPE, 2018-2033 (USD THOUSAND)
TABLE 3 NORTH AMERICA SYNTHETIC SPORTS FLOORING IN SPORTS FLOORING MARKET, BY FORM FACTOR, 2018-2033 (USD THOUSAND)
TABLE 4 NORTH AMERICA SYNTHETIC SPORTS FLOORING IN SPORTS FLOORING MARKET, BY INSTALLATION METHOD, 2018-2033 (USD THOUSAND)
TABLE 5 NORTH AMERICA SYNTHETIC SPORTS FLOORING IN SPORTS FLOORING MARKET, BY SYSTEM MOBILITY, 2018-2033 (USD THOUSAND)
TABLE 6 NORTH AMERICA SYNTHETIC SPORTS FLOORING IN SPORTS FLOORING MARKET, BY FUNCTIONAL PROPERTIES, 2018-2033 (USD THOUSAND)
TABLE 7 NORTH AMERICA SYNTHETIC SPORTS FLOORING IN SPORTS FLOORING MARKET, BY RAW MATERIAL, 2018-2033 (USD THOUSAND)
TABLE 8 NORTH AMERICA WOOD SPORTS FLOORING IN SPORTS FLOORING MARKET, BY WOOD SPECIES, 2018-2033 (USD THOUSAND)
TABLE 9 NORTH AMERICA WOOD SPORTS FLOORING IN SPORTS FLOORING MARKET, BY WOOD CONSTRUCTION TYPE, 2018-2033 (USD THOUSAND)
TABLE 10 NORTH AMERICA WOOD SPORTS FLOORING IN SPORTS FLOORING MARKET, BY SURFACE FINISH, 2018-2033 (USD THOUSAND)
TABLE 11 NORTH AMERICA HYBRID SPORTS FLOORING IN SPORTS FLOORING MARKET, BY STRUCTURAL COMPOSITION, 2018-2033 (USD THOUSAND)
TABLE 12 NORTH AMERICA SPORTS FLOORING MARKET, BY APPLICATION ENVIRONMENT, 2018-2033 (USD THOUSAND)
TABLE 13 NORTH AMERICA INDOOR APPLICATIONS IN SPORTS FLOORING MARKET, BY FACILITY TYPE, 2018-2033 (USD THOUSAND)
TABLE 14 NORTH AMERICA OUTDOOR APPLICATIONS IN SPORTS FLOORING MARKET, BY FACILITY TYPE, 2018-2033 (USD THOUSAND)
TABLE 15 NORTH AMERICA SPORTS FLOORING MARKET, BY PRIMARY SPORT, 2018-2033 (USD THOUSAND)
TABLE 16 NORTH AMERICA GYM & FITNESS IN SPORTS FLOORING MARKET, BY FUNCTIONAL ZONE, 2018-2033 (USD THOUSAND)
TABLE 17 NORTH AMERICA BASKETBALL IN SPORTS FLOORING MARKET, BY INSTALLATION, 2018-2033 (USD THOUSAND)
TABLE 18 NORTH AMERICA BASKETBALL IN SPORTS FLOORING MARKET, BY LEVEL OF PLAY, 2018-2033 (USD THOUSAND)
TABLE 19 NORTH AMERICA TENNIS IN SPORTS FLOORING MARKET, BY COURT TYPE, 2018-2033 (USD THOUSAND)
TABLE 20 NORTH AMERICA TENNIS IN SPORTS FLOORING MARKET, BY LEVEL OF PLAY, 2018-2033 (USD THOUSAND)
TABLE 21 NORTH AMERICA SPORTS FLOORING MARKET, BY END USER, 2018-2033 (USD THOUSAND)
TABLE 22 NORTH AMERICA ACADEMIC INSTITUTIONS IN SPORTS FLOORING MARKET, BY TYPE, 2018-2033 (USD THOUSAND)
TABLE 23 NORTH AMERICA COMMERCIAL & SPORTS CLUBS IN SPORTS FLOORING MARKET, BY TYPE, 2018-2033 (USD THOUSAND)
TABLE 24 NORTH AMERICA GOVERNMENT & MUNICIPAL FACILITIES IN SPORTS FLOORING MARKET, BY AREA, 2018-2033 (USD THOUSAND)
TABLE 25 NORTH AMERICA RESIDENTIAL IN SPORTS FLOORING MARKET, BY INSTALLATION AREA, 2018-2033 (USD THOUSAND)
TABLE 26 NORTH AMERICA SPORTS FLOORING MARKET, BY SALES & DISTRIBUTION CHANNEL, 2018-2033 (USD THOUSAND)
TABLE 27 NORTH AMERICA DIRECT (B2B) IN SPORTS FLOORING MARKET, BY TYPE, 2018-2033 (USD THOUSAND)
TABLE 28 NORTH AMERICA INDIRECT IN SPORTS FLOORING MARKET, BY TYPE, 2018-2033 (USD THOUSAND)
TABLE 29 NORTH AMERICA SPORTS FLOORING MARKET, BY CONSTRUCTION ACTIVITY, 2018-2033 (USD THOUSAND)
TABLE 30 NORTH AMERICA RENOVATION & RETROFIT IN SPORTS FLOORING MARKET, BY TYPE, 2018-2033 (USD THOUSAND)
TABLE 31 NORTH AMERICA NEW CONSTRUCTION IN SPORTS FLOORING MARKET, BY TYPE, 2018-2033 (USD THOUSAND)
TABLE 32 NORTH AMERICA SPORTS FLOORING MARKET
TABLE 33 NORTH AMERICA SPORTS FLOORING MARKET, BY COUNTRY, 2018-2033 (USD THOUSAND)
TABLE 34 NORTH AMERICA
TABLE 35 NORTH AMERICA SPORTS FLOORING MARKET, BY PRODUCT TYPE, 2018-2033 (USD THOUSAND)
TABLE 36 NORTH AMERICA SYNTHETIC SPORTS FLOORING IN SPORTS FLOORING MARKET, BY FORM FACTOR, 2018-2033 (USD THOUSAND)
TABLE 37 NORTH AMERICA SYNTHETIC SPORTS FLOORING IN SPORTS FLOORING MARKET, BY INSTALLATION METHOD, 2018-2033 (USD THOUSAND)
TABLE 38 NORTH AMERICA SYNTHETIC SPORTS FLOORING IN SPORTS FLOORING MARKET, BY SYSTEM MOBILITY, 2018-2033 (USD THOUSAND)
TABLE 39 NORTH AMERICA SYNTHETIC SPORTS FLOORING IN SPORTS FLOORING MARKET, BY FUNCTIONAL PROPERTIES, 2018-2033 (USD THOUSAND)
TABLE 40 NORTH AMERICA SYNTHETIC SPORTS FLOORING IN SPORTS FLOORING MARKET, BY RAW MATERIAL, 2018-2033 (USD THOUSAND)
TABLE 41 NORTH AMERICA WOOD SPORTS FLOORING IN SPORTS FLOORING MARKET, BY WOOD SPECIES, 2018-2033 (USD THOUSAND)
TABLE 42 NORTH AMERICA WOOD SPORTS FLOORING IN SPORTS FLOORING MARKET, BY WOOD CONSTRUCTION TYPE, 2018-2033 (USD THOUSAND)
TABLE 43 NORTH AMERICA WOOD SPORTS FLOORING IN SPORTS FLOORING MARKET, BY SURFACE FINISH, 2018-2033 (USD THOUSAND)
TABLE 44 NORTH AMERICA HYBRID SPORTS FLOORING IN SPORTS FLOORING MARKET, BY STRUCTURAL COMPOSITION, 2018-2033 (USD THOUSAND)
TABLE 45 NORTH AMERICA SPORTS FLOORING MARKET, BY APPLICATION ENVIRONMENT, 2018-2033 (USD THOUSAND)
TABLE 46 NORTH AMERICA INDOOR APPLICATIONS IN SPORTS FLOORING MARKET, BY FACILITY TYPE, 2018-2033 (USD THOUSAND)
TABLE 47 NORTH AMERICA OUTDOOR APPLICATIONS IN SPORTS FLOORING MARKET, BY FACILITY TYPE, 2018-2033 (USD THOUSAND)
TABLE 48 NORTH AMERICA SPORTS FLOORING MARKET, BY PRIMARY SPORT, 2018-2033 (USD THOUSAND)
TABLE 49 NORTH AMERICA GYM & FITNESS IN SPORTS FLOORING MARKET, BY FUNCTIONAL ZONE, 2018-2033 (USD THOUSAND)
TABLE 50 NORTH AMERICA BASKETBALL IN SPORTS FLOORING MARKET, BY INSTALLATION, 2018-2033 (USD THOUSAND)
TABLE 51 NORTH AMERICA BASKETBALL IN SPORTS FLOORING MARKET, BY LEVEL OF PLAY, 2018-2033 (USD THOUSAND)
TABLE 52 NORTH AMERICA TENNIS IN SPORTS FLOORING MARKET, BY COURT TYPE, 2018-2033 (USD THOUSAND)
TABLE 53 NORTH AMERICA TENNIS IN SPORTS FLOORING MARKET, BY LEVEL OF PLAY, 2018-2033 (USD THOUSAND)
TABLE 54 NORTH AMERICA SPORTS FLOORING MARKET, BY END USER, 2018-2033 (USD THOUSAND)
TABLE 55 NORTH AMERICA ACADEMIC INSTITUTIONS IN SPORTS FLOORING MARKET, BY TYPE, 2018-2033 (USD THOUSAND)
TABLE 56 NORTH AMERICA COMMERCIAL & SPORTS CLUBS IN SPORTS FLOORING MARKET, BY TYPE, 2018-2033 (USD THOUSAND)
TABLE 57 NORTH AMERICA GOVERNMENT & MUNICIPAL FACILITIES IN SPORTS FLOORING MARKET, BY AREA, 2018-2033 (USD THOUSAND)
TABLE 58 NORTH AMERICA RESIDENTIAL IN SPORTS FLOORING MARKET, BY INSTALLATION AREA, 2018-2033 (USD THOUSAND)
TABLE 59 NORTH AMERICA SPORTS FLOORING MARKET, BY SALES & DISTRIBUTION CHANNEL, 2018-2033 (USD THOUSAND)
TABLE 60 NORTH AMERICA DIRECT (B2B) IN SPORTS FLOORING MARKET, BY TYPE, 2018-2033 (USD THOUSAND)
TABLE 61 NORTH AMERICA INDIRECT IN SPORTS FLOORING MARKET, BY TYPE, 2018-2033 (USD THOUSAND)
TABLE 62 NORTH AMERICA SPORTS FLOORING MARKET, BY CONSTRUCTION ACTIVITY, 2018-2033 (USD THOUSAND)
TABLE 63 NORTH AMERICA RENOVATION & RETROFIT IN SPORTS FLOORING MARKET, BY TYPE, 2018-2033 (USD THOUSAND)
TABLE 64 NORTH AMERICA NEW CONSTRUCTION IN SPORTS FLOORING MARKET, BY TYPE, 2018-2033 (USD THOUSAND)
TABLE 65 U.S. SPORTS FLOORING MARKET, BY PRODUCT TYPE, 2018-2033 (USD THOUSAND)
TABLE 66 U.S. SYNTHETIC SPORTS FLOORING IN SPORTS FLOORING MARKET, BY FORM FACTOR, 2018-2033 (USD THOUSAND)
TABLE 67 U.S. SYNTHETIC SPORTS FLOORING IN SPORTS FLOORING MARKET, BY INSTALLATION METHOD, 2018-2033 (USD THOUSAND)
TABLE 68 U.S. SYNTHETIC SPORTS FLOORING IN SPORTS FLOORING MARKET, BY SYSTEM MOBILITY, 2018-2033 (USD THOUSAND)
TABLE 69 U.S. SYNTHETIC SPORTS FLOORING IN SPORTS FLOORING MARKET, BY FUNCTIONAL PROPERTIES, 2018-2033 (USD THOUSAND)
TABLE 70 U.S. SYNTHETIC SPORTS FLOORING IN SPORTS FLOORING MARKET, BY RAW MATERIAL, 2018-2033 (USD THOUSAND)
TABLE 71 U.S. WOOD SPORTS FLOORING IN SPORTS FLOORING MARKET, BY WOOD SPECIES, 2018-2033 (USD THOUSAND)
TABLE 72 U.S. WOOD SPORTS FLOORING IN SPORTS FLOORING MARKET, BY WOOD CONSTRUCTION TYPE, 2018-2033 (USD THOUSAND)
TABLE 73 U.S. WOOD SPORTS FLOORING IN SPORTS FLOORING MARKET, BY SURFACE FINISH, 2018-2033 (USD THOUSAND)
TABLE 74 U.S. HYBRID SPORTS FLOORING IN SPORTS FLOORING MARKET, BY STRUCTURAL COMPOSITION, 2018-2033 (USD THOUSAND)
TABLE 75 U.S. SPORTS FLOORING MARKET, BY APPLICATION ENVIRONMENT, 2018-2033 (USD THOUSAND)
TABLE 76 U.S. INDOOR APPLICATIONS IN SPORTS FLOORING MARKET, BY FACILITY TYPE, 2018-2033 (USD THOUSAND)
TABLE 77 U.S. OUTDOOR APPLICATIONS IN SPORTS FLOORING MARKET, BY FACILITY TYPE, 2018-2033 (USD THOUSAND)
TABLE 78 U.S. SPORTS FLOORING MARKET, BY PRIMARY SPORT, 2018-2033 (USD THOUSAND)
TABLE 79 U.S. GYM & FITNESS IN SPORTS FLOORING MARKET, BY FUNCTIONAL ZONE, 2018-2033 (USD THOUSAND)
TABLE 80 U.S. BASKETBALL IN SPORTS FLOORING MARKET, BY INSTALLATION, 2018-2033 (USD THOUSAND)
TABLE 81 U.S. BASKETBALL IN SPORTS FLOORING MARKET, BY LEVEL OF PLAY, 2018-2033 (USD THOUSAND)
TABLE 82 U.S. TENNIS IN SPORTS FLOORING MARKET, BY COURT TYPE, 2018-2033 (USD THOUSAND)
TABLE 83 U.S. TENNIS IN SPORTS FLOORING MARKET, BY LEVEL OF PLAY, 2018-2033 (USD THOUSAND)
TABLE 84 U.S. SPORTS FLOORING MARKET, BY END USER, 2018-2033 (USD THOUSAND)
TABLE 85 U.S. ACADEMIC INSTITUTIONS IN SPORTS FLOORING MARKET, BY TYPE, 2018-2033 (USD THOUSAND)
TABLE 86 U.S. COMMERCIAL & SPORTS CLUBS IN SPORTS FLOORING MARKET, BY TYPE, 2018-2033 (USD THOUSAND)
TABLE 87 U.S. GOVERNMENT & MUNICIPAL FACILITIES IN SPORTS FLOORING MARKET, BY AREA, 2018-2033 (USD THOUSAND)
TABLE 88 U.S. RESIDENTIAL IN SPORTS FLOORING MARKET, BY INSTALLATION AREA, 2018-2033 (USD THOUSAND)
TABLE 89 U.S. SPORTS FLOORING MARKET, BY SALES & DISTRIBUTION CHANNEL, 2018-2033 (USD THOUSAND)
TABLE 90 U.S. DIRECT (B2B) IN SPORTS FLOORING MARKET, BY TYPE, 2018-2033 (USD THOUSAND)
TABLE 91 U.S. INDIRECT IN SPORTS FLOORING MARKET, BY TYPE, 2018-2033 (USD THOUSAND)
TABLE 92 U.S. SPORTS FLOORING MARKET, BY CONSTRUCTION ACTIVITY, 2018-2033 (USD THOUSAND)
TABLE 93 U.S. RENOVATION & RETROFIT IN SPORTS FLOORING MARKET, BY TYPE, 2018-2033 (USD THOUSAND)
TABLE 94 U.S. NEW CONSTRUCTION IN SPORTS FLOORING MARKET, BY TYPE, 2018-2033 (USD THOUSAND)
TABLE 95 CANADA SPORTS FLOORING MARKET, BY PRODUCT TYPE, 2018-2033 (USD THOUSAND)
TABLE 96 CANADA SYNTHETIC SPORTS FLOORING IN SPORTS FLOORING MARKET, BY FORM FACTOR, 2018-2033 (USD THOUSAND)
TABLE 97 CANADA SYNTHETIC SPORTS FLOORING IN SPORTS FLOORING MARKET, BY INSTALLATION METHOD, 2018-2033 (USD THOUSAND)
TABLE 98 CANADA SYNTHETIC SPORTS FLOORING IN SPORTS FLOORING MARKET, BY SYSTEM MOBILITY, 2018-2033 (USD THOUSAND)
TABLE 99 CANADA SYNTHETIC SPORTS FLOORING IN SPORTS FLOORING MARKET, BY FUNCTIONAL PROPERTIES, 2018-2033 (USD THOUSAND)
TABLE 100 CANADA SYNTHETIC SPORTS FLOORING IN SPORTS FLOORING MARKET, BY RAW MATERIAL, 2018-2033 (USD THOUSAND)
TABLE 101 CANADA WOOD SPORTS FLOORING IN SPORTS FLOORING MARKET, BY WOOD SPECIES, 2018-2033 (USD THOUSAND)
TABLE 102 CANADA WOOD SPORTS FLOORING IN SPORTS FLOORING MARKET, BY WOOD CONSTRUCTION TYPE, 2018-2033 (USD THOUSAND)
TABLE 103 CANADA WOOD SPORTS FLOORING IN SPORTS FLOORING MARKET, BY SURFACE FINISH, 2018-2033 (USD THOUSAND)
TABLE 104 CANADA HYBRID SPORTS FLOORING IN SPORTS FLOORING MARKET, BY STRUCTURAL COMPOSITION, 2018-2033 (USD THOUSAND)
TABLE 105 CANADA SPORTS FLOORING MARKET, BY APPLICATION ENVIRONMENT, 2018-2033 (USD THOUSAND)
TABLE 106 CANADA INDOOR APPLICATIONS IN SPORTS FLOORING MARKET, BY FACILITY TYPE, 2018-2033 (USD THOUSAND)
TABLE 107 CANADA OUTDOOR APPLICATIONS IN SPORTS FLOORING MARKET, BY FACILITY TYPE, 2018-2033 (USD THOUSAND)
TABLE 108 CANADA SPORTS FLOORING MARKET, BY PRIMARY SPORT, 2018-2033 (USD THOUSAND)
TABLE 109 CANADA GYM & FITNESS IN SPORTS FLOORING MARKET, BY FUNCTIONAL ZONE, 2018-2033 (USD THOUSAND)
TABLE 110 CANADA BASKETBALL IN SPORTS FLOORING MARKET, BY INSTALLATION, 2018-2033 (USD THOUSAND)
TABLE 111 CANADA BASKETBALL IN SPORTS FLOORING MARKET, BY LEVEL OF PLAY, 2018-2033 (USD THOUSAND)
TABLE 112 CANADA TENNIS IN SPORTS FLOORING MARKET, BY COURT TYPE, 2018-2033 (USD THOUSAND)
TABLE 113 CANADA TENNIS IN SPORTS FLOORING MARKET, BY LEVEL OF PLAY, 2018-2033 (USD THOUSAND)
TABLE 114 CANADA SPORTS FLOORING MARKET, BY END USER, 2018-2033 (USD THOUSAND)
TABLE 115 CANADA ACADEMIC INSTITUTIONS IN SPORTS FLOORING MARKET, BY TYPE, 2018-2033 (USD THOUSAND)
TABLE 116 CANADA COMMERCIAL & SPORTS CLUBS IN SPORTS FLOORING MARKET, BY TYPE, 2018-2033 (USD THOUSAND)
TABLE 117 CANADA GOVERNMENT & MUNICIPAL FACILITIES IN SPORTS FLOORING MARKET, BY AREA, 2018-2033 (USD THOUSAND)
TABLE 118 CANADA RESIDENTIAL IN SPORTS FLOORING MARKET, BY INSTALLATION AREA, 2018-2033 (USD THOUSAND)
TABLE 119 CANADA SPORTS FLOORING MARKET, BY SALES & DISTRIBUTION CHANNEL, 2018-2033 (USD THOUSAND)
TABLE 120 CANADA DIRECT (B2B) IN SPORTS FLOORING MARKET, BY TYPE, 2018-2033 (USD THOUSAND)
TABLE 121 CANADA INDIRECT IN SPORTS FLOORING MARKET, BY TYPE, 2018-2033 (USD THOUSAND)
TABLE 122 CANADA SPORTS FLOORING MARKET, BY CONSTRUCTION ACTIVITY, 2018-2033 (USD THOUSAND)
TABLE 123 CANADA RENOVATION & RETROFIT IN SPORTS FLOORING MARKET, BY TYPE, 2018-2033 (USD THOUSAND)
TABLE 124 CANADA NEW CONSTRUCTION IN SPORTS FLOORING MARKET, BY TYPE, 2018-2033 (USD THOUSAND)
TABLE 125 MEXICO SPORTS FLOORING MARKET, BY PRODUCT TYPE, 2018-2033 (USD THOUSAND)
TABLE 126 MEXICO SYNTHETIC SPORTS FLOORING IN SPORTS FLOORING MARKET, BY FORM FACTOR, 2018-2033 (USD THOUSAND)
TABLE 127 MEXICO SYNTHETIC SPORTS FLOORING IN SPORTS FLOORING MARKET, BY INSTALLATION METHOD, 2018-2033 (USD THOUSAND)
TABLE 128 MEXICO SYNTHETIC SPORTS FLOORING IN SPORTS FLOORING MARKET, BY SYSTEM MOBILITY, 2018-2033 (USD THOUSAND)
TABLE 129 MEXICO SYNTHETIC SPORTS FLOORING IN SPORTS FLOORING MARKET, BY FUNCTIONAL PROPERTIES, 2018-2033 (USD THOUSAND)
TABLE 130 MEXICO SYNTHETIC SPORTS FLOORING IN SPORTS FLOORING MARKET, BY RAW MATERIAL, 2018-2033 (USD THOUSAND)
TABLE 131 MEXICO WOOD SPORTS FLOORING IN SPORTS FLOORING MARKET, BY WOOD SPECIES, 2018-2033 (USD THOUSAND)
TABLE 132 MEXICO WOOD SPORTS FLOORING IN SPORTS FLOORING MARKET, BY WOOD CONSTRUCTION TYPE, 2018-2033 (USD THOUSAND)
TABLE 133 MEXICO WOOD SPORTS FLOORING IN SPORTS FLOORING MARKET, BY SURFACE FINISH, 2018-2033 (USD THOUSAND)
TABLE 134 MEXICO HYBRID SPORTS FLOORING IN SPORTS FLOORING MARKET, BY STRUCTURAL COMPOSITION, 2018-2033 (USD THOUSAND)
TABLE 135 MEXICO SPORTS FLOORING MARKET, BY APPLICATION ENVIRONMENT, 2018-2033 (USD THOUSAND)
TABLE 136 MEXICO INDOOR APPLICATIONS IN SPORTS FLOORING MARKET, BY FACILITY TYPE, 2018-2033 (USD THOUSAND)
TABLE 137 MEXICO OUTDOOR APPLICATIONS IN SPORTS FLOORING MARKET, BY FACILITY TYPE, 2018-2033 (USD THOUSAND)
TABLE 138 MEXICO SPORTS FLOORING MARKET, BY PRIMARY SPORT, 2018-2033 (USD THOUSAND)
TABLE 139 MEXICO GYM & FITNESS IN SPORTS FLOORING MARKET, BY FUNCTIONAL ZONE, 2018-2033 (USD THOUSAND)
TABLE 140 MEXICO BASKETBALL IN SPORTS FLOORING MARKET, BY INSTALLATION, 2018-2033 (USD THOUSAND)
TABLE 141 MEXICO BASKETBALL IN SPORTS FLOORING MARKET, BY LEVEL OF PLAY, 2018-2033 (USD THOUSAND)
TABLE 142 MEXICO TENNIS IN SPORTS FLOORING MARKET, BY COURT TYPE, 2018-2033 (USD THOUSAND)
TABLE 143 MEXICO TENNIS IN SPORTS FLOORING MARKET, BY LEVEL OF PLAY, 2018-2033 (USD THOUSAND)
TABLE 144 MEXICO SPORTS FLOORING MARKET, BY END USER, 2018-2033 (USD THOUSAND)
TABLE 145 MEXICO ACADEMIC INSTITUTIONS IN SPORTS FLOORING MARKET, BY TYPE, 2018-2033 (USD THOUSAND)
TABLE 146 MEXICO COMMERCIAL & SPORTS CLUBS IN SPORTS FLOORING MARKET, BY TYPE, 2018-2033 (USD THOUSAND)
TABLE 147 MEXICO GOVERNMENT & MUNICIPAL FACILITIES IN SPORTS FLOORING MARKET, BY AREA, 2018-2033 (USD THOUSAND)
TABLE 148 MEXICO RESIDENTIAL IN SPORTS FLOORING MARKET, BY INSTALLATION AREA, 2018-2033 (USD THOUSAND)
TABLE 149 MEXICO SPORTS FLOORING MARKET, BY SALES & DISTRIBUTION CHANNEL, 2018-2033 (USD THOUSAND)
TABLE 150 MEXICO DIRECT (B2B) IN SPORTS FLOORING MARKET, BY TYPE, 2018-2033 (USD THOUSAND)
TABLE 151 MEXICO INDIRECT IN SPORTS FLOORING MARKET, BY TYPE, 2018-2033 (USD THOUSAND)
TABLE 152 MEXICO SPORTS FLOORING MARKET, BY CONSTRUCTION ACTIVITY, 2018-2033 (USD THOUSAND)
TABLE 153 MEXICO RENOVATION & RETROFIT IN SPORTS FLOORING MARKET, BY TYPE, 2018-2033 (USD THOUSAND)
TABLE 154 MEXICO NEW CONSTRUCTION IN SPORTS FLOORING MARKET, BY TYPE, 2018-2033 (USD THOUSAND)
List of Figure
FIGURE 1 NORTH AMERICA SPORTS FLOORING MARKET
FIGURE 2 NORTH AMERICA SPORTS FLOORING MARKET: DATA TRIANGULATION
FIGURE 3 NORTH AMERICA SPORTS FLOORING MARKET: DROC ANALYSIS
FIGURE 4 NORTH AMERICA SPORTS FLOORING MARKET: REGION VS STATE MARKET ANALYSIS
FIGURE 5 NORTH AMERICA SPORTS FLOORING MARKET: COMPANY RESEARCH ANALYSIS
FIGURE 6 NORTH AMERICA SPORTS FLOORING MARKET: MULTIVARIATE MODELLING
FIGURE 7 NORTH AMERICA SPORTS FLOORING MARKET: INTERVIEW DEMOGRAPHICS
FIGURE 8 NORTH AMERICA SPORTS FLOORING MARKET: DBMR MARKET POSITION GRID
FIGURE 9 NORTH AMERICA SPORTS FLOORING MARKET: MARKET APPLICATION COVERAGE GRID
FIGURE 10 NORTH AMERICA SPORTS FLOORING MARKET: VENDOR SHARE ANALYSIS
FIGURE 11 NORTH AMERICA SPORTS FLOORING MARKET: SEGMENTATION
FIGURE 12 THREE SEGMENTS COMPRISE THE NORTH AMERICA SPORTS FLOORING MARKET, BY PRODUCT TYPE (2025)
FIGURE 13 STRATEGIC DECISIONS
FIGURE 14 EXECUTIVE SUMMARY
FIGURE 15 RISING INVESTMENTS IN SCHOOL, COLLEGIATE, AND FITNESS INFRASTRUCTURE MODERNIZATION IS EXPECTED TO DRIVE THE NORTH AMERICA SPORTS FLOORING MARKET IN THE FORECAST PERIOD
FIGURE 16 SYNTHETIC SPORTS FLOORING IS EXPECTED TO ACCOUNT FOR THE LARGEST SHARE OF THE NORTH AMERICA SPORTS FLOORING MARKET IN 2026 AND 2033
FIGURE 17 VENDOR SELECTION CRITERIA
FIGURE 18 RISING ANNUAL STRATEGIC DEAL ACTIVITY
FIGURE 19 STRATEGIC DEAL DISTRIBUTION BY TRANSACTION TYPE
FIGURE 20 YEAR-ON-YEAR BASE PRICE TREND OF SPORTS FLOORING IN NORTH AMERICA (USD/SQ FT)
FIGURE 21 SUPPLY CHAIN ANALYSIS
FIGURE 22 COMPANY PRODUCTION CAPACITY OUTLOOK – MARKET SHARE
FIGURE 23 DRIVERS, RESTRAINS, OPPORUTNITY AND CHANLLENGES (DROC) ANALYSIS OF NORTH AMERICA SPORTS FLOORING MARKET
FIGURE 24 NORTH AMERICA SPORTS FLOORING MARKET: BY PRODUCT TYPE, 2025
FIGURE 25 NORTH AMERICA SPORTS FLOORING MARKET: BY APPLICATION ENVIRONMENT, 2025
FIGURE 26 NORTH AMERICA SPORTS FLOORING MARKET: BY PRIMARY SPORT, 2025
FIGURE 27 NORTH AMERICA SPORTS FLOORING MARKET: BY END USER, 2025
FIGURE 28 NORTH AMERICA SPORTS FLOORING MARKET: BY SALES & DISTRIBUTION CHANNEL, 2025
FIGURE 29 NORTH AMERICA SPORTS FLOORING MARKET: BY CONSTRUCTION ACTIVITY, 2025
FIGURE 30 NORTH AMERICA SPORTS FLOORING MARKET, SNAPSHOT (2025)
FIGURE 31 NORTH AMERICA SPORTS FLOORING MARKET: COMPANY SHARE 2025 (%)
Research Methodology
Data collection and base year analysis are done using data collection modules with large sample sizes. The stage includes obtaining market information or related data through various sources and strategies. It includes examining and planning all the data acquired from the past in advance. It likewise envelops the examination of information inconsistencies seen across different information sources. The market data is analysed and estimated using market statistical and coherent models. Also, market share analysis and key trend analysis are the major success factors in the market report. To know more, please request an analyst call or drop down your inquiry.
The key research methodology used by DBMR research team is data triangulation which involves data mining, analysis of the impact of data variables on the market and primary (industry expert) validation. Data models include Vendor Positioning Grid, Market Time Line Analysis, Market Overview and Guide, Company Positioning Grid, Patent Analysis, Pricing Analysis, Company Market Share Analysis, Standards of Measurement, Global versus Regional and Vendor Share Analysis. To know more about the research methodology, drop in an inquiry to speak to our industry experts.
Customization Available
Data Bridge Market Research is a leader in advanced formative research. We take pride in servicing our existing and new customers with data and analysis that match and suits their goal. The report can be customized to include price trend analysis of target brands understanding the market for additional countries (ask for the list of countries), clinical trial results data, literature review, refurbished market and product base analysis. Market analysis of target competitors can be analyzed from technology-based analysis to market portfolio strategies. We can add as many competitors that you require data about in the format and data style you are looking for. Our team of analysts can also provide you data in crude raw excel files pivot tables (Fact book) or can assist you in creating presentations from the data sets available in the report.


