
Us Low Speed Vehicle Market
Market Size in USD Billion
 USD
2.32 Billion
USD
3.99 Billion
2025
2033
USD
2.32 Billion
USD
3.99 Billion
2025
2033
| 2026 - 2033 | |
| USD 2.32 Billion | |
| USD 3.99 Billion | |
| % | |
|
U.S. Low Speed Vehicle Market Size
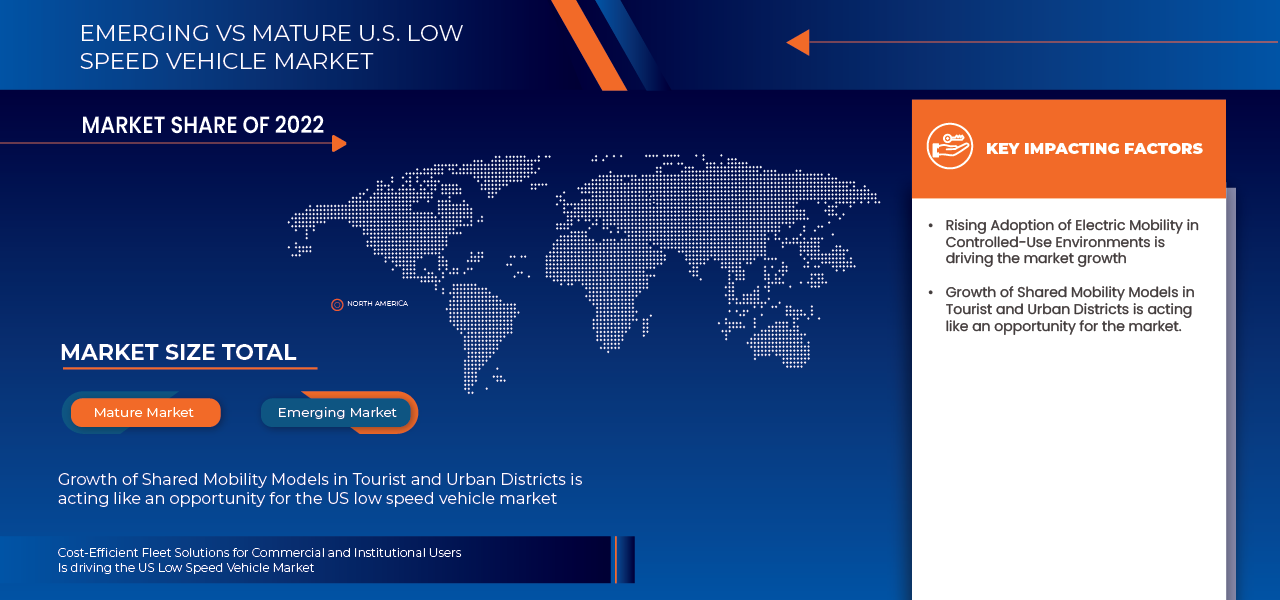
- The U.S. Low Speed Vehicle market was valued at USD 2.32 billion in 2025 and is expected to reach USD 3.99 billion by 2033
- During the forecast period of 2026 to 2033 the market is likely to grow at a CAGR of 7.17%, supported primarily driven by rising demand for cost-effective and eco-friendly transportation solutions, increasing adoption of electric low-speed vehicles, and growing use of LSVs across gated communities, golf courses, campuses, resorts, industrial sites, and urban last-mile mobility applications.
- Moreover, continuous product innovation in electric powertrains, battery technology, vehicle safety features, and connectivity systems, along with the expansion of direct-to-consumer and dealer-based distribution channels, is supporting sustained market growth. Favorable regulatory frameworks for low-speed electric vehicles, increasing investments in sustainable mobility infrastructure, and rising emphasis on urban congestion reduction and carbon emission control are further strengthening the U.S. LSV market outlook.
U.S. Low Speed Vehicle Market Analysis
- The U.S. Low Speed Vehicle (LSV) Market is witnessing steady advancement as manufacturers increasingly focus on electric mobility, vehicle safety enhancements, and application-specific design optimization to meet evolving consumer and commercial transportation needs.
- LSV producers are leveraging advanced electric powertrains, improved battery technologies, lightweight materials, and modular vehicle platforms to enhance driving range, operational efficiency, and product differentiation across residential, commercial, and institutional use cases. The integration of connectivity features, telematics, and smart controls is further shaping product development strategies across the market.
- These advancements are strengthening the U.S. LSV value chain by improving manufacturing efficiency, scalability, and vehicle reliability, while reducing total cost of ownership. Expanding direct-to-consumer sales models, dealership networks, and fleet partnerships are supporting faster market penetration and improved customer engagement.
- Additionally, rising adoption of LSVs across gated communities, campuses, resorts, industrial facilities, and last-mile logistics, supported by favorable regulations and sustainability initiatives, is increasing overall market accessibility.
- In 2026, the Golf Cart segment is expected to dominate the U.S. Low Speed Vehicle market with a 39.25% share, reflecting strong demand for compact, easy-to-operate, and cost-efficient vehicles suitable for short-distance mobility. Widespread use across golf courses, residential communities, hospitality venues, and commercial campuses, combined with growing electrification and customization options, continues to reinforce the golf cart segment’s leadership within the U.S. LSV market.
Report Scope and U.S. Low Speed Vehicle Market Segmentation
|
Attributes |
U.S. Low Speed Vehicle Key Market Insights |
|
Segments Covered |
|
|
Country Covered |
|
|
Key Market Players |
|
|
Market Opportunities |
|
|
Value Added Data Infosets |
In addition to the insights on, and major players, the market reports curated by the Data market scenarios such as market value, growth rate, segmentation, geographical coverage Bridge Market Research also include porter’s five forces, company evaluation quadrant, pricing analysis, raw material coverage, climate change scenario, industry ecosystem analysis, brand outlook, consumer buying behaviour, innovation tracker and strategic analysis, profit margins scenario, raw material coverage, supply chain analysis, technological advancements, value chain analysis, vendor selection criteria, regulatory coverage. |
U.S. Low Speed Vehicle Market Trends
“Municipal Adoption For Smart City And Last-Mile Public Services”
- Municipal adoption of low-speed vehicles is emerging as a strategic enabler for smart city initiatives and last-mile public service delivery across the United States. City governments are increasingly integrating low-speed electric vehicles into public fleets for applications such as parking enforcement, utility maintenance, parks and recreation operations, and community patrols, where short-distance travel, frequent stops, and controlled operating zones are common. These use cases align well with municipal objectives to reduce operational costs, lower emissions, and modernize urban mobility systems without requiring extensive changes to existing infrastructure.
- Additionally, the growing emphasis on smart city frameworks is encouraging municipalities to deploy low-speed vehicles as part of digitally enabled, service-oriented transportation models. When combined with telematics, fleet management software, and energy-efficient charging solutions, these vehicles support data-driven decision-making and improve service responsiveness at the neighborhood level. As cities continue to prioritize sustainability, efficiency, and localized mobility, municipal adoption is expected to play a critical role in expanding the functional and geographic footprint of low-speed vehicles within public-sector operations.
- As reported by the City of Buffalo official press office in April 2025, Mayor Christopher Scanlon and city officials unveiled the first electric vehicles in the municipal fleet as part of a broader sustainability initiative aimed at reducing emissions and improving city services, demonstrating Buffalo’s municipal adoption of electric mobility for public operational use.
- As documented by MyJournalCourier.com in October 2023, the City of Jacksonville, Illinois joined a community electric transportation program receiving state and utility partnership funding to advance electric transportation planning including public charging and infrastructure highlighting municipal-level collaboration to support EV deployment for local services.
- Municipal adoption of low-speed and electric vehicles presents a significant opportunity for market expansion in the United States, as cities increasingly align transportation strategies with smart city objectives and efficient last-mile public service delivery. The integration of these vehicles into municipal fleets for applications such as utilities, public safety support, maintenance, and community services demonstrates their practical value in controlled, low-speed urban environments. As local governments continue to prioritize sustainability, operational efficiency, and technology-enabled service models, municipal demand is expected to create stable, long-term procurement opportunities. This trend positions low-speed vehicles as a critical enabler of modern public-sector mobility, supporting scalable deployment while reinforcing their role in future-ready urban infrastructure
U.S. Low Speed Vehicle Market Dynamics
Driver
“Favorable Federal and State-Level Classification of Low-Speed Vehicles”
- The favorable federal and state-level classification of low-speed vehicles in the U.S. has provided a clear regulatory foundation that supports their structured adoption across designated road networks and controlled-use environments. By formally defining low-speed vehicles under federal safety standards and allowing their operation on roads with specified speed limits, regulators have reduced ambiguity for manufacturers, fleet operators, and end users. This regulatory clarity enables vehicles to be purpose-built for compliant use, facilitating smoother commercialization and encouraging deployment in residential communities, campuses, and municipal service areas.
- At the state and local level, the adoption and alignment of complementary rules—such as registration pathways, equipment requirements, and roadway permissions—have further reinforced the practical usability of low-speed vehicles. Where regulatory frameworks are clearly articulated and consistently enforced, low-speed vehicles transition from experimental or niche transport options into recognized mobility solutions. This classification-driven legitimacy continues to play a critical role in shaping market confidence, investment decisions, and long-term planning within the U.S. low-speed vehicle ecosystem.
- As codified in the 2025 Florida Statutes effective January 2025, the state authorizes the operation of low-speed vehicles on streets with posted speed limits of 35 mph or less, requires specific safety equipment and valid driver licensing, and integrates federal LSV criteria into state traffic law, reinforcing coordinated federal-to-state regulation.
- The favorable federal and state-level classification of low-speed vehicles in the U.S. has established a stable and clearly defined regulatory framework that supports their lawful use and commercialization across designated road networks. By formally recognizing LSVs as a distinct vehicle category with specific safety, speed, and equipment requirements, regulators have reduced compliance uncertainty for manufacturers and operators while enabling consistent vehicle design and certification. As more states align their traffic codes and registration systems with federal definitions, regulatory clarity continues to strengthen market confidence, facilitating structured adoption of low-speed vehicles in residential, institutional, and municipal mobility applications
Restraints/Challenges
“Fragmented State And Local Regulatory Interpretations”
- Fragmented state and local regulatory interpretations present a significant challenge for the U.S. low-speed vehicle market, creating complexity and uncertainty for manufacturers, fleet operators, and end users. While low-speed vehicles are recognized at the federal level, variations in state statutes and municipal ordinances related to vehicle classification, roadway access, registration requirements, and operational zones result in inconsistent adoption conditions across regions. This lack of regulatory uniformity makes it difficult for stakeholders to develop standardized products, scale deployments, or implement multi-city fleet strategies.
- Moreover, frequent policy updates and differing enforcement approaches at the local level further complicate market expansion, particularly in urban environments where regulatory clarity is critical. Operators must often navigate city-specific approvals, usage restrictions, and infrastructure limitations, increasing compliance costs and delaying deployment timelines. As a result, fragmented regulatory interpretation continues to constrain market scalability and limits the ability of low-speed vehicles to achieve broader, nationwide penetration.
- As reported by Manistee News in April 2025, Michigan golf carts are legal on public roads only in municipalities that have passed local ordinances permitting them, with individual cities such as Manistee, Ludington, Bad Axe, Port Austin, Caseville, and Ubly each adopting their own distinct regulations for operation, registration, and permissible road segments, highlighting local variation in rules despite the same state framework.
- As highlighted in SmartCitiesDive reporting in February 2025, Denver city officials were considering stricter local regulations on electric scooters and e‑bikes in response to rising injuries, despite existing city and state laws, showing how local jurisdictions engage in unique regulatory action beyond broader statewide frameworks
- Fragmented state and local regulatory interpretations continue to pose a significant challenge for the U.S. low-speed vehicle market. Despite overarching federal or state guidelines, variations in municipal ordinances, enforcement practices, and roadway access rules create an inconsistent regulatory environment across cities and counties. This patchwork of regulations increases compliance complexity, raises operational costs, and slows fleet deployment, particularly for operators seeking multi-city or statewide expansion. Until there is greater harmonization of vehicle classification, usage permissions, and safety requirements, manufacturers and fleet operators will face ongoing uncertainty, limiting the market’s ability to scale efficiently and consistently across diverse urban and suburban regions
U.S. Low Speed Vehicle Market Scope
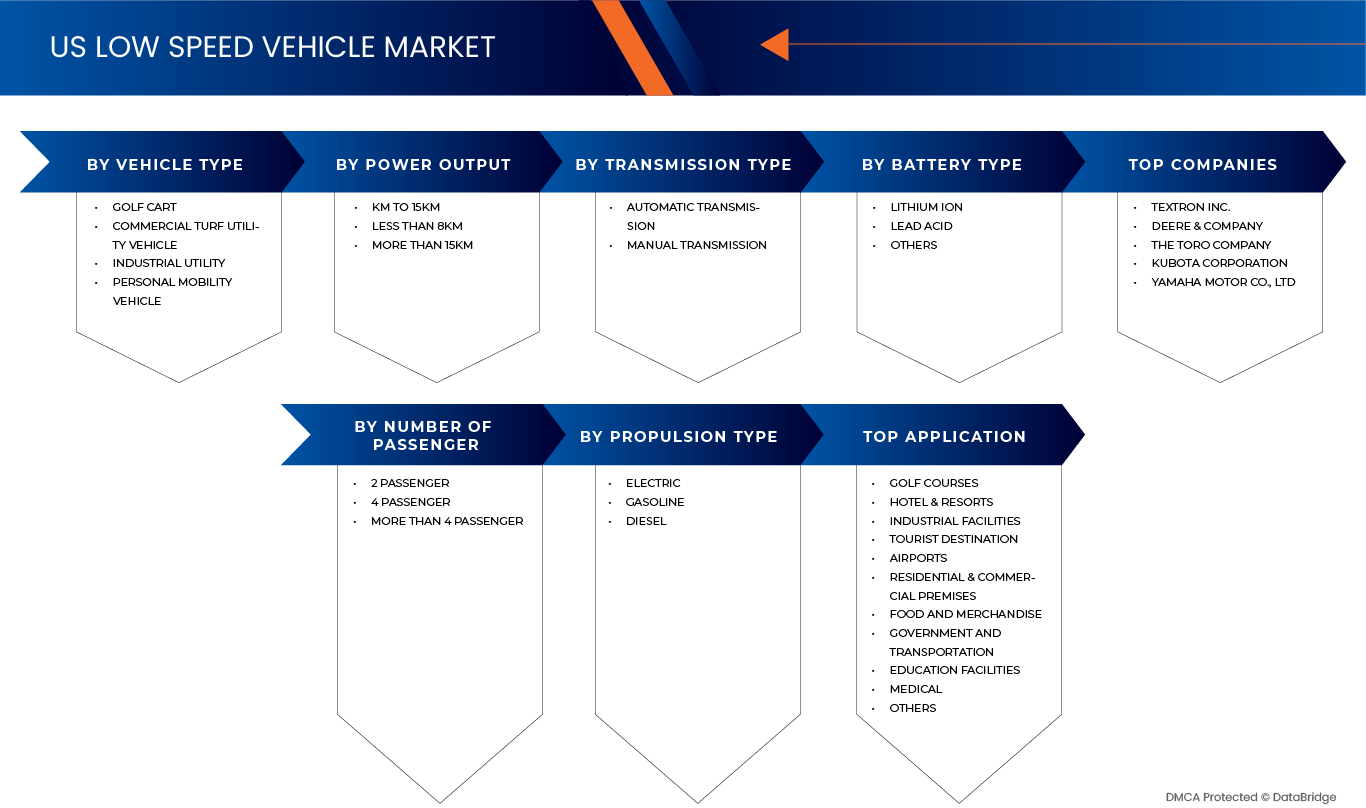
The U.S. low speed vehicle market is segmented into seven notable segments based on the vehicle type, power output, number of passengers, transmission type, propulsion type, battery type, and application.
- By Vehicle Type
On the basis of vehicle type, the U.S. low-speed vehicle market is segmented into golf cart, commercial turf utility vehicle, industrial utility vehicle, and personal mobility vehicle. In 2026, the Golf Cart segment is expected to dominate the market with a 39.25% market share, driven by its extensive use across golf courses, resorts, gated communities, campuses, and recreational facilities. Strong replacement demand, expansion of applications beyond traditional golf use, and growing adoption of electric-powered golf carts for short-distance mobility are further reinforcing the segment’s market leadership
The Golf Cart segment is the fastest-growing in the North America U.S. Low Speed Vehicle Market, with a CAGR of 7.75%, driven by rising demand for versatile, energy-efficient, and low-maintenance vehicles, increasing use in residential, commercial, and institutional settings, and the expansion of fleet leasing, rental, and direct-to-consumer sales channels. Technological advancements in battery efficiency, vehicle connectivity, and modular design are expected to further accelerate adoption across key North American markets
- By Power Output
On the basis of power output, the U.S. low-speed vehicle market is segmented into Less Than 8KM, 8KM to 15KM, and More Than 15KM. In 2026, the 8KM to 15KM segment is expected to dominate with a 50.97% market share, driven by its widespread use in residential communities, golf courses, resorts, and short-distance personal mobility applications. Its popularity is supported by moderate energy consumption, lower operating costs, and growing adoption of electric-powered vehicles for local transportation needs.
The 8KM to 15KM segment is the fastest-growing segment in the North America U.S. Low Speed Vehicle Market, with a CAGR of 7.76%, driven by increasing demand for efficient, reliable, and low-maintenance vehicles suitable for everyday short-distance travel, along with rising adoption of electric drivetrains and improved battery technologies. Expansion of direct-to-consumer channels, fleet leasing programs, and smart community mobility initiatives is expected to further accelerate segment growth across key North American market.
- By Number of Passengers
On the basis of number of passengers, the U.S. low-speed vehicle market is segmented into 2 Passenger, 4 Passenger, and More Than 4 Passenger vehicles. In 2026, the 2 Passenger segment is expected to dominate the market with 58.77% market share, driven by its suitability for personal and short-distance transportation. Its compact design, ease of maneuverability, lower operating and maintenance costs, and widespread use across residential communities, golf courses, campuses, and resorts contribute to its leading position in the market
2 Passenger is the fastest-growing segment with a CAGR of 7.34% in the North America U.S. Low Speed Vehicle Market driven by increasing adoption of compact electric LSVs for personal mobility, recreational purposes, and first-mile/last-mile transport in commercial and institutional environments. Rising preference for eco-friendly, low-maintenance vehicles and expansion of fleet-sharing programs further accelerate demand across key North American markets.
- By Transmission Type
On the basis of transmission type, the U.S. Low-speed vehicle market is segmented into automatic transmission and manual transmission. In 2026, the Automatic Transmission segment is expected to dominate the market with 79.50% market share, driven by its ease of operation, reduced driver effort, and growing preference for user-friendly mobility solutions. Automatic LSVs are widely adopted across residential communities, university campuses, resorts, airports, and commercial facilities, where short-distance travel, frequent stop-and-go movement, and enhanced safety are critical requirements.
Automatic Transmission is the fastest-growing segment with CAGR of 7.28% in the North America U.S. Low Speed Vehicle Market driven by increasing demand for convenient and low-learning-curve vehicles among first-time users, elderly populations, and commercial fleet operators. Expanding deployment of LSVs in shared mobility, hospitality, and institutional applications, along with continuous improvements in transmission reliability and efficiency, is further accelerating adoption of automatic transmission low-speed vehicles across the U.S. market.
- By Propulsion Type
On the basis of propulsion type, the U.S. low-speed vehicle market is segmented into Electric, Gasoline, and Diesel vehicles. In 2026, the Electric segment is expected to dominate the market with 60.12% market share, driven by stringent environmental regulations, rising demand for zero-emission mobility solutions, and significantly lower operating and maintenance costs compared to internal combustion alternatives. Increasing adoption of electric LSVs across residential communities, gated townships, university campuses, resorts, airports, and commercial facilities, along with continuous advancements in battery efficiency and charging infrastructure, is reinforcing the segment’s market leadership.
Electric is the fastest-growing segment with CAGR of 7.46% in the U.S. Low Speed Vehicle Market driven by declining battery costs, favorable government incentives for electric vehicles, expanding charging networks, and growing institutional preference for sustainable and noise-free transportation solutions. Fleet electrification initiatives across hospitality, industrial, and municipal sectors are further accelerating the penetration of electric low-speed vehicles across the U.S. market.
- By Battery Type
On the basis of battery type, the U.S. low-speed vehicle market is segmented into Lithium-Ion, Lead Acid, and Others. In 2026, the Lithium-Ion segment is expected to dominate the market with 56.19% market share, driven by its higher energy density, longer service life, faster charging capability, and lower maintenance requirements compared to conventional lead-acid batteries. The growing adoption of electric low-speed vehicles across residential communities, commercial campuses, golf courses, and recreational facilities is significantly strengthening demand for Lithium-Ion battery systems.
Lithium-Ion is the fastest-growing segment with CAGR of 7.60% in the U.S. Low Speed Vehicle Market driven by declining battery costs, advancements in battery management systems, increasing focus on sustainability, and rising preference for lightweight, high-performance energy storage solutions. Supportive government incentives for electric mobility and expanding charging infrastructure across the U.S. are further accelerating the penetration of Lithium-Ion batteries in the low-speed vehicle market.
- By Application
On the basis of application, the U.S. low-speed vehicle market is segmented into Golf Courses, Hotel & Resorts, Industrial Facilities, Tourist Destinations, Airports, Residential & Commercial Premises, Food and Merchandise, Government & Transportation, Education Facilities, Medical, and Others. In 2026, the Golf Courses segment is expected to dominate the market with 24.43% market share, driven by the extensive deployment of low-speed vehicles for on-course transportation, maintenance activities, and facility operations. Factors such as ease of operation, low maintenance requirements, and the increasing preference for electric-powered vehicles that reduce emissions and operating costs in recreational environments are supporting segment leadership.
Golf Courses is the fastest-growing segment with CAGR of 8.87% in the U.S. Low Speed Vehicle Market driven by expansion of golf infrastructure, rising investments in sustainable course management, and growing adoption of electric and lithium-ion battery–based vehicles to enhance operational efficiency, meet environmental regulations, and improve the overall golfer experience across the U.S.
The Major Market Leaders Operating in the Market Are:
- Textron Inc. (U.S.)
- Deere & Company (U.S.)
- Club Car (U.S.)
- KUBOTA Corporation (Japan)
- The Toro Company (U.S.)
- Yamaha Motor Co., Ltd (Japan)
- Polaris Inc. (U.S.)
- Kandi America (U.S.)
- American Landmaster (U.S.)
- Columbia Vehicle Group Inc. (U.S.)
- AYRO (U.S.)
- Evolution Electric Vehicles (U.S.)
- MOTO ELECTRIC VEHICLES (U.S.)
- STAR EV (U.S.)
- ICON Electric Vehicle (U.S.)
- Sierra LSV (U.S.)
- AGT Electric Cars (Canada)
- EV Titan, LLC (U.S.)
- Vantage Vehicle International Inc. (U.S.)
- Waev Inc. (U.S.)
Latest Developments in U.S. Low Speed Vehicle
- In February 2025, AYRO, Inc. launched a new Robotics Division focused on AI‑driven, automated manufacturing of electric vehicles and high‑technology EV support products, and received its first purchase order for precision‑assembled EV chargers, marking a strategic expansion of its production capabilities.
- In March 2025, EV Titan, LLC introduced its updated 2025 electric low-speed vehicle lineup, including enhanced Xtreme Luxe and FFX forward-facing models, featuring improved electric performance, upgraded comfort features, and expanded customization options. This development strengthened the company’s positioning in the U.S. Low Speed Vehicle market by addressing growing demand for street-legal, premium, and versatile electric mobility solutions across residential, resort, and commercial applications.
- In January, Evolution Electric Vehicles unveiled its new models at the PGA Show 2025 in Orlando, using the platform to debut product innovations and enhance brand exposure among dealers and industry stakeholders, reinforcing its commitment to expanding its presence in the electric vehicle and golf cart market.
- In October 2025, ICON EV will showcase its latest innovations at the Ft. Lauderdale International Boat Show from October 29 to November 2, including the world debut of two new EPIC FX Series models: the two-seater EPIC E20FX and six-seater EPIC E60FX, both featuring premium tires, marine-grade sound systems, and adjustable suspension options. ICON will also provide complimentary shuttles for attendees, reinforcing its role as the official golf cart of the marine industry. This exposure will boost brand recognition, attract new customers, and strengthen ICON EV’s market presence.
- In May 2025, Kandi Technologies Group, Inc. launched operations at its Garland, Texas manufacturing facility, producing its first U.S.-assembled electric golf cart under the “Made in North America” initiative. The 74,758-square-foot facility on a 4.56-acre site will manufacture Kandi’s full range of electric off-road vehicles, including UTVs and recreational models, improving delivery speed, operational efficiency, and customer responsiveness in the U.S. market. This localized production strengthens Kandi’s competitiveness, supports faster market growth, and enhances its ability to serve North American customers.
SKU-

- Interactive Data Analysis Dashboard
- Company Analysis Dashboard for high growth potential opportunities
- Research Analyst Access for customization & queries
- Competitor Analysis with Interactive dashboard
- Latest News, Updates & Trend analysis
- Harness the Power of Benchmark Analysis for Comprehensive Competitor Tracking
Table of Content
1 INTRODUCTION
1.1 OBJECTIVES OF THE STUDY
1.2 MARKET DEFINITION
1.3 OVERVIEW OF U.S. LOW SPEED VEHICLE MARKET
1.4 LIMITATIONS
1.5 MARKETS COVERED
2 MARKET SEGMENTATION
2.1 MARKETS COVERED
2.2 GEOGRAPHICAL SCOPE
2.3 YEARS CONSIDERED FOR THE STUDY
2.4 CURRENCY AND PRICING
2.5 DBMR TRIPOD DATA VALIDATION MODEL
2.6 MULTIVARIATE MODELING
2.7 PRIMARY INTERVIEWS WITH KEY OPINION LEADERS
2.8 DBMR MARKET POSITION GRID
2.9 MARKET END USER COVERAGE GRID
2.1 VENDOR SHARE ANALYSIS
2.11 SECONDARY SOURCES
2.12 ASSUMPTIONS
3 EXECUTIVE SUMMARY
4 PREMIUM INSIGHTS
4.1 PORTER’S FIVE FORCES ANALYSIS
4.1.1 INTENSITY OF COMPETITIVE RIVALRY – HIGH
4.1.2 BARGAINING POWER OF BUYERS – HIGH
4.1.3 THREAT OF NEW ENTRANTS – LOW TO MODERATE
4.1.4 THREAT OF SUBSTITUTES – MODERATE TO HIGH
4.1.5 BARGAINING POWER OF SUPPLIERS – MODERATE
4.1.6 CONCLUSION
4.2 CONSUMER BEHAVIOR
4.2.1 INTRODUCTION
4.2.2 RESIDENTIAL AND COMMUNITY-BASED CONSUMERS
4.2.3 RECREATIONAL AND LEISURE-ORIENTED CONSUMERS
4.2.4 COMMERCIAL, INSTITUTIONAL, AND CAMPUS BUYERS
4.2.5 ENVIRONMENTAL AND SUSTAINABILITY INFLUENCE
4.2.6 REGULATORY AWARENESS AND CONSUMER CONFIDENCE
4.2.7 KEY PURCHASE DECISION FACTORS
4.2.8 BARRIERS TO ADOPTION
4.2.9 EMERGING CONSUMER BEHAVIOUR TRENDS
4.2.10 CONCLUSION
4.3 CURRENT VS FUTURISTIC SCENERIO
4.3.1 INTRODUCTION
4.3.2 CURRENT MARKET SCENARIO
4.3.3 CURRENT CONSUMER AND INSTITUTIONAL MINDSET
4.3.4 TRANSITION DRIVERS SHAPING THE FUTURE SCENARIO
4.3.5 FUTURISTIC MARKET SCENARIO
4.3.6 FUTURE CONSUMER BEHAVIOUR OUTLOOK
4.3.7 CONCLUSION
4.4 TECHNOLOGY TREND
4.4.1 ELECTRIFICATION AND ADVANCED BATTERY TECHNOLOGY
4.4.2 SMART AND CONNECTED VEHICLE TECHNOLOGIES
4.4.3 AUTONOMY AND ADVANCED DRIVER ASSISTANCE
4.4.4 MODULAR, LIGHTWEIGHT DESIGN AND CUSTOMIZATION
4.4.5 SUSTAINABILITY ENHANCEMENTS
4.4.6 EXPANDING USE CASES AND MARKET SEGMENTS
4.5 USE CASE ANALYSIS
4.5.1 CASE STUDY: COMMUNITY PUBLIC MOBILITY USING ON-DEMAND, LOW-SPEED ELECTRIC VEHICLES IN DOWNTOWN ST. LOUIS, MISSOURI
4.5.2 CASE STUDY: LOW-SPEED VEHICLES GAINING MOMENTUM IN U.S. URBAN MOBILITY (2025)
4.6 COMPANY COMPARITIVE ANALYSIS
4.7 PRICING ANALYSIS
4.8 SUPPLY CHAIN ANALYSIS
4.8.1 RAW MATERIAL SOURCING & PROCUREMENT
4.8.2 PROCESSING & PRODUCT MANUFACTURING (PRODUCTION)
4.8.3 SUPPLY CHAIN & DISTRIBUTION LOGISTICS (TRANSPORTATION)
4.8.4 RETAIL & COMMERCIAL BUYER CHANNELS (DISTRIBUTION & SALES)
4.8.5 CONCLUSION
5 REGULATORY FRAMEWORK
5.1 FEDERAL LEGAL AUTHORITY
5.1.1 NATIONAL TRAFFIC AND MOTOR VEHICLE SAFETY ACT:
5.1.2 NHTSA AND SELF‑CERTIFICATION:
5.1.3 FEDERAL DEFINITION OF LOW‑SPEED VEHICLES
5.2 FEDERAL SAFETY EQUIPMENT REQUIREMENTS
5.2.1 FMVSS NO. 500 MANDATORY EQUIPMENT:
5.2.2 DISTINCTION FROM OTHER VEHICLES
5.3 FEDERAL RESTRICTIONS ON USE
5.3.1 ROADWAY LIMITS
5.3.2 VIN, REGISTRATION, AND LICENSING
5.3.3 STATE REGULATORY ARCHITECTURE
6 MARKET OVERVIEW
6.1 DRIVERS
6.1.1 EXPANSION OF MASTER-PLANNED COMMUNITIES AND GATED RESIDENTIAL DEVELOPMENTS
6.1.2 FAVOURABLE FEDERAL AND STATE-LEVEL CLASSIFICATION OF LOW-SPEED VEHICLES
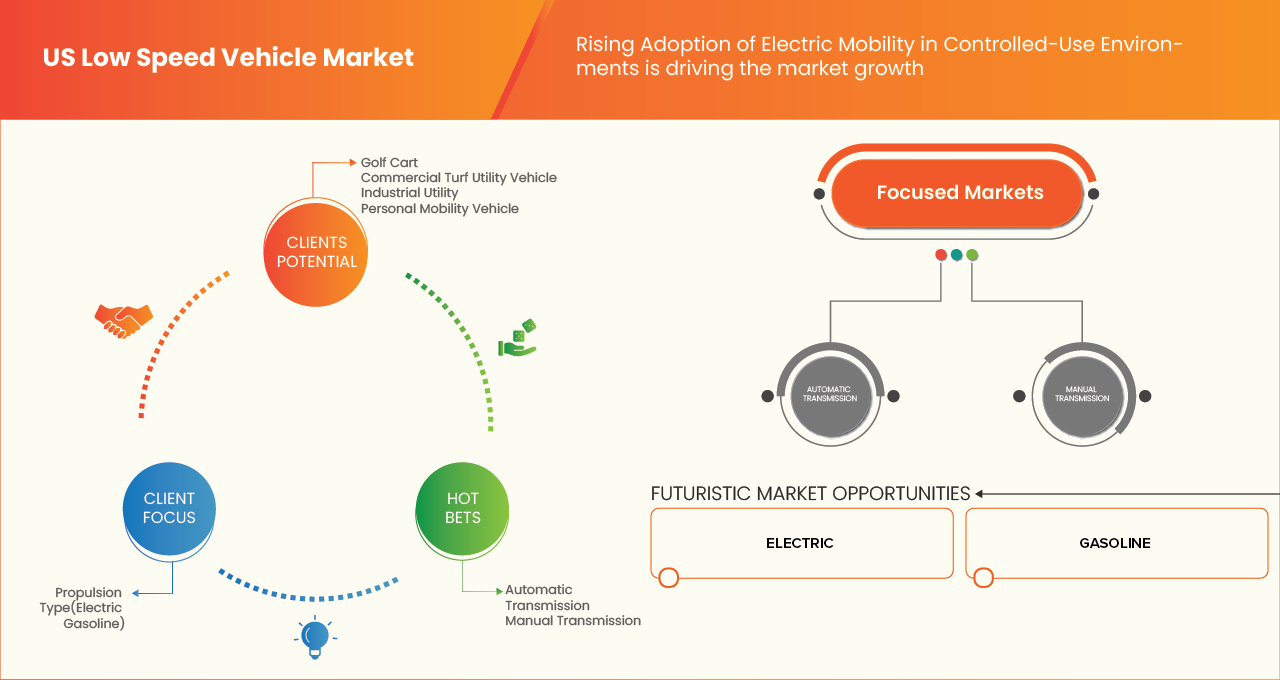
6.1.3 RISING ADOPTION OF ELECTRIC MOBILITY IN CONTROLLED-USE ENVIRONMENTS
6.1.4 COST-EFFICIENT FLEET SOLUTIONS FOR COMMERCIAL AND INSTITUTIONAL USERS.
6.2 RESTRAINTS
6.2.1 ROADWAY ACCESS LIMITATIONS DUE TO SPEED AND INFRASTRUCTURE CONSTRAINTS
6.2.2 SAFETY PERCEPTION GAPS AMONG URBAN CONSUMERS
6.3 OPPORTUNITIES
6.3.1 MUNICIPAL ADOPTION FOR SMART CITY AND LAST-MILE PUBLIC SERVICES
6.3.2 ELECTRIFICATION OF UNIVERSITY, HEALTHCARE, AND CORPORATE CAMPUSES
6.3.3 GROWTH OF SHARED MOBILITY MODELS IN TOURIST AND URBAN DISTRICTS
6.4 CHALLENGES
6.4.1 FRAGMENTED STATE AND LOCAL REGULATORY INTERPRETATIONS
6.4.2 LIMITED CONSUMER AWARENESS AND MISCLASSIFICATION RISK
7 U.S. LOW SPEED VEHICLE MARKET, BY VEHICLE TYPE
7.1 OVERVIEW
7.2 GOLF CART
7.3 COMMERCIAL TURF UTILITY VEHICLE
7.4 INDUSTRIAL UTILITY
7.5 PERSONAL MOBILITY VEHICLE
7.5.1 PERSONAL TRANSPORTATION VEHICLES (PTV) ( SPEED < 20 MPH)
7.5.2 LOW SPEED VEHICLES (LSV) (SPEED 20–25 MPH)
7.5.2.1 CALIFORNIA
7.5.2.2 TEXAS
7.5.2.3 FLORIDA
7.5.2.4 NEW YORK
7.5.2.5 ARIZONA
7.5.2.6 GEORGIA
7.5.2.7 NORTH CAROLINA
7.5.2.8 WASHINGTON
7.5.2.9 MICHIGAN
7.5.2.10 COLORADO
7.5.2.11 SOUTH CAROLINA
7.5.2.12 NEW JERSEY
7.5.2.13 MASSACHUSETTS
7.5.2.14 ILLINOIS
7.5.2.15 PENNSYLVANIA
7.5.2.16 VIRGINIA
7.5.2.17 TENNESSEE
7.5.2.18 ALABAMA
7.5.2.19 MISSISSIPPI
7.5.2.20 LOUISIANA
7.5.2.21 NEVADA
7.5.2.22 OHIO
7.5.2.23 INDIANA
7.5.2.24 MISSOURI
7.5.2.25 MARYLAND
7.5.2.26 OREGON
7.5.2.27 UTAH
7.5.2.28 MINNESOTA
7.5.2.29 WISCONSIN
7.5.2.30 KENTUCKY
7.5.2.31 ARKANSAS
7.5.2.32 OKLAHOMA
7.5.2.33 IOWA
7.5.2.34 KANSAS
7.5.2.35 NEBRASKA
7.5.2.36 SOUTH DAKOTA
7.5.2.37 NORTH DAKOTA
7.5.2.38 MONTANA
7.5.2.39 IDAHO
7.5.2.40 WYOMING
7.5.2.41 NEW MEXICO
7.5.2.42 MAINE
7.5.2.43 NEW HAMPSHIRE
7.5.2.44 VERMONT
7.5.2.45 RHODE ISLAND
7.5.2.46 DELAWARE
7.5.2.47 WEST VIRGINIA
7.5.2.48 ALASKA
7.5.2.49 HAWAII
7.5.2.50 CONNECTICUT
8 U.S. LOW SPEED VEHICLE MARKET, BY POWER OUTPUT
8.1 OVERVIEW
8.2 8KM TO 15KM
8.3 LESS THAN 8KM
8.4 MORE THAN 15KM
9 U.S. LOW SPEED VEHICLE MARKET, BY NUMBER OF PASSENGER
9.1 OVERVIEW
9.2 2 PASSENGER
9.3 4 PASSENGER
9.3.1 4 FORWARD-FACING SEATING CONFIGURATION
9.3.2 2+2 SEATING CONFIGURATION
9.4 MORE THAN 4 PASSENGER
10 U.S. LOW SPEED VEHICLE MARKET, BY TRANSMISSION TYPE
10.1 OVERVIEW
10.2 AUTOMATIC TRANSMISSION
10.3 MANUAL TRANSMISSION
11 U.S. LOW SPEED VEHICLE MARKET, BY PROPULSION TYPE
11.1 OVERVIEW
11.2 ELECTRIC
11.3 GASOLINE
11.4 DIESEL
12 U.S. LOW SPEED VEHICLE MARKET, BY BATTERY TYPE
12.1 OVERVIEW
12.2 LITHIUM ION
12.3 LEAD ACID
12.4 OTHERS
13 U.S. LOW SPEED VEHICLE MARKET, BY APPLICATION
13.1 OVERVIEW
13.2 GOLF COURSES
13.2.1 U.S. GOLF COURSES IN LOW SPEED VEHICLE MARKET, BY TYPE
13.2.1.1 8KM TO 15KM
13.2.1.2 LESS THAN 8KM
13.2.1.3 MORE THAN 15KM
13.3 HOTEL & RESORTS
13.3.1 U.S. HOTEL & RESORTS IN LOW SPEED VEHICLE MARKET, BY TYPE
13.3.1.1 8KM TO 15KM
13.3.1.2 LESS THAN 8KM
13.3.1.3 MORE THAN 15KM
13.4 INDUSTRIAL FACILITIES
13.4.1 U.S. INDUSTRIAL FACILITIES IN LOW SPEED VEHICLE MARKET, BY TYPE
13.4.1.1 8KM TO 15KM
13.4.1.2 LESS THAN 8KM
13.4.1.3 MORE THAN 15KM
13.5 TOURIST DESTINATION
13.5.1 U.S. TOURIST DESTINATION IN LOW SPEED VEHICLE MARKET, BY TYPE
13.5.1.1 8KM TO 15KM
13.5.1.2 LESS THAN 8KM
13.5.1.3 MORE THAN 15KM
13.6 AIRPORTS
13.6.1 U.S. AIRPORTS IN LOW SPEED VEHICLE MARKET, BY TYPE
13.6.1.1 8KM TO 15KM
13.6.1.2 LESS THAN 8KM
13.6.1.3 MORE THAN 15KM
13.7 RESIDENTIAL & COMMERCIAL PREMISES
13.7.1 U.S. RESIDENTIAL & COMMERCIAL PREMISES IN LOW SPEED VEHICLE MARKET, BY TYPE
13.7.1.1 8KM TO 15KM
13.7.1.2 LESS THAN 8KM
13.7.1.3 MORE THAN 15KM
13.8 FOOD AND MERCHANDISE
13.8.1 U.S. FOOD AND MERCHANDISE IN LOW SPEED VEHICLE MARKET, BY TYPE
13.8.1.1 8KM TO 15KM
13.8.1.2 LESS THAN 8KM
13.8.1.3 MORE THAN 15KM
13.9 GOVERNMENT AND TRANSPORTATION
13.9.1 U.S. GOVERNMENT AND TRANSPORTATION IN LOW SPEED VEHICLE MARKET, BY TYPE
13.9.1.1 8KM TO 15KM
13.9.1.2 LESS THAN 8KM
13.9.1.3 MORE THAN 15KM
13.1 EDUCATION FACILITIES
13.10.1 U.S. EDUCATION FACILITIES IN LOW SPEED VEHICLE MARKET, BY TYPE
13.10.1.1 8KM TO 15KM
13.10.1.2 LESS THAN 8KM
13.10.1.3 MORE THAN 15KM
13.11 MEDICAL
13.11.1 U.S. MEDICAL IN LOW SPEED VEHICLE MARKET, BY TYPE
13.11.1.1 8KM TO 15KM
13.11.1.2 LESS THAN 8KM
13.11.1.3 MORE THAN 15KM
13.12 OTHERS
13.12.1 U.S. OTHERS IN LOW SPEED VEHICLE MARKET, BY TYPE
13.12.1.1 8KM TO 15KM
13.12.1.2 LESS THAN 8KM
13.12.1.3 MORE THAN 15KM
14 U.S. LOW SPEED VEHICLE MARKET, COMPANY LANDSCAPE
14.1 COMPANY SHARE ANALYSIS: U.S.
15 U.S. LOW SPEED VEHICLE MARKET - SWOT ANALYSIS
16 COMPANY PROFILE
16.1 TEXTRON INC.
16.1.1 COMPANY SNAPSHOT
16.1.2 REVENUE ANALYSIS
16.1.3 PRODUCT PORTFOLIO
16.1.4 RECENT DEVELOPMENT
16.2 DEERE & COMPANY
16.2.1 COMPANY SNAPSHOT
16.2.2 REVENUE ANALYSIS
16.2.3 PRODUCT PORTFOLIO
16.2.4 RECENT DEVELOPMENT
16.3 CLUB CAR
16.3.1 COMPANY SNAPSHOT
16.3.2 PRODUCT PORTFOLIO
16.3.3 RECENT DEVELOPMENT
16.4 KUBOTA CORPORATION
16.4.1 COMPANY SNAPSHOT
16.4.2 REVENUE ANALYSIS
16.4.3 PRODUCT PORTFOLIO
16.4.4 RECENT DEVELOPMENT
16.5 THE TORO COMPANY
16.5.1 COMPANY SNAPSHOT
16.5.2 REVENUE ANALYSIS
16.5.3 PRODUCT PORTFOLIO
16.5.4 RECENT DEVELOPMENT
16.6 AGT ELECTRIC CARS.
16.6.1 COMPANY SNAPSHOT
16.6.2 PRODUCT PORTFOLIO
16.6.3 RECENT DEVELOPMENT
16.7 AMERICAN LANDMASTER
16.7.1 COMPANY SNAPSHOT
16.7.2 PRODUCT PORTFOLIO
16.7.3 RECENT DEVELOPMENT
16.8 AYRO
16.8.1 COMPANY SNAPSHOT
16.8.2 REVENUE ANALYSIS
16.8.3 PRODUCT PORTFOLIO
16.8.4 RECENT DEVELOPMENT
16.9 COLUMBIA VEHICLE GROUP INC.
16.9.1 COMPANY SNAPSHOT
16.9.2 PRODUCT PORTFOLIO
16.9.3 RECENT DEVELOPMENT
16.1 EV TITAN, LLC
16.10.1 COMPANY SNAPSHOT
16.10.2 PRODUCT PORTFOLIO
16.10.3 RECENT DEVELOPMENT
16.11 EVOLUTION ELECTRIC VEHICLES.
16.11.1 COMPANY SNAPSHOT
16.11.2 PRODUCT PORTFOLIO
16.11.3 RECENT DEVELOPMENT
16.12 ICON ELECTRIC VEHICLES
16.12.1 COMPANY SNAPSHOT
16.12.2 PRODUCT PORTFOLIO
16.12.3 RECENT DEVELOPMENT
16.13 KANDI AMERICA
16.13.1 COMPANY SNAPSHOT
16.13.2 PRODUCT PORTFOLIO
16.13.3 RECENT DEVELOPMENT
16.14 MOTO ELECTRIC VEHICLES.
16.14.1 COMPANY SNAPSHOT
16.14.2 PRODUCT PORTFOLIO
16.14.3 RECENT DEVELOPMENT
16.15 POLARIS INC.
16.15.1 COMPANY SNAPSHOT
16.15.2 REVENUE ANALYSIS
16.15.3 PRODUCT PORTFOLIO
16.15.4 RECENT DEVELOPMENT
16.16 SIERRA LSV
16.16.1 COMPANY SNAPSHOT
16.16.2 PRODUCT PORTFOLIO
16.16.3 RECENT DEVELOPMENT
16.17 STAR EV.
16.17.1 COMPANY SNAPSHOT
16.17.2 PRODUCT PORTFOLIO
16.17.3 RECENT DEVELOPMENT
16.18 VANTAGE VEHICLE INTERNATIONAL INC.
16.18.1 COMPANY SNAPSHOT
16.18.2 PRODUCT PORTFOLIO
16.18.3 RECENT DEVELOPMENT
16.19 WAEV INC.
16.19.1 COMPANY SNAPSHOT
16.19.2 PRODUCT PORTFOLIO
16.19.3 RECENT DEVELOPMENT
16.2 YAMAHA MOTOR CO., LTD
16.20.1 COMPANY SNAPSHOT
16.20.2 REVENUE ANALYSIS
16.20.3 PRODUCT PORTFOLIO
16.20.4 RECENT DEVELOPMENT
17 QUESTIONNAIRE
18 RELATED REPORT
List of Table
TABLE 1 CHALLENGES & CONSIDERATIONS
TABLE 2 COMPARATIVE ANALYSIS OF KEY PLAYERS IN THE U.S. LOW-SPEED VEHICLE MARKET
TABLE 3 U.S. LOW-SPEED VEHICLE (LSV) MARKET: SUPPLY CHAIN OVERVIEW
TABLE 4 U.S. LOW SPEED VEHICLE MARKET, BY VEHICLE TYPE, 2018-2033 (USD THOUSAND)
TABLE 5 U.S. LOW SPEED VEHICLE MARKET, BY VEHICLE TYPE, 2018-2033 (UNITS)
TABLE 6 PRICE PER UNIT (USD)
TABLE 7 U.S. PERSONAL MOBILITY VEHICLE IN LOW SPEED VEHICLE MARKET, BY TYPE, 2018-2033 (USD THOUSAND)
TABLE 8 U.S. PERSONAL MOBILITY VEHICLE IN LOW SPEED VEHICLE MARKET, BY TYPE, 2018-2033 (UNITS)
TABLE 9 PRICE PER UNIT (USD )
TABLE 10 U.S PERSONAL TRANSPORTATION VEHICLES (PTV) ( SPEED < 20 MPH) IN LOW SPEED VEHICLE MARKET, BY STATE, 2018-2033 (UNITS)
TABLE 11 U.S LOW SPEED VEHICLES (LSV) (SPEED 20–25 MPH) IN LOW SPEED VEHICLE MARKET, BY STATE, 2018-2033 (UNITS)
TABLE 12 U.S. LOW SPEED VEHICLE MARKET, BY POWER OUTPUT, 2018-2033 (USD THOUSAND)
TABLE 13 U.S. LOW SPEED VEHICLE MARKET, BY NUMBER OF PASSENGER, 2018-2033 (USD THOUSAND)
TABLE 14 U.S. 4 PASSENGER IN LOW SPEED VEHICLE MARKET, BY TYPE, 2018-2033 (USD THOUSAND)
TABLE 15 U.S. LOW SPEED VEHICLE MARKET, BY TRANSMISSION TYPE, 2018-2033 (USD THOUSAND)
TABLE 16 U.S. LOW SPEED VEHICLE MARKET, BY PROPULSION TYPE, 2018-2033 (USD THOUSAND)
TABLE 17 U.S. LOW SPEED VEHICLE MARKET, BY BATTERY TYPE, 2018-2033 (USD THOUSAND)
TABLE 18 U.S. LOW SPEED VEHICLE MARKET, BY APPLICATION, 2018-2033 (USD THOUSAND)
TABLE 19 U.S. GOLF COURSES IN LOW SPEED VEHICLE MARKET, BY TYPE, 2018-2033 (USD THOUSAND)
TABLE 20 U.S. HOTEL & RESORTS IN LOW SPEED VEHICLE MARKET, BY TYPE, 2018-2033 (USD THOUSAND)
TABLE 21 U.S. INDUSTRIAL FACILITIES IN LOW SPEED VEHICLE MARKET, BY TYPE, 2018-2033 (USD THOUSAND)
TABLE 22 U.S. TOURIST DESTINATION IN LOW SPEED VEHICLE MARKET, BY TYPE, 2018-2033 (USD THOUSAND)
TABLE 23 U.S. AIRPORTS IN LOW SPEED VEHICLE MARKET, BY TYPE, 2018-2033 (USD THOUSAND)
TABLE 24 U.S. RESIDENTIAL & COMMERCIAL PREMISES IN LOW SPEED VEHICLE MARKET, BY TYPE, 2018-2033 (USD THOUSAND)
TABLE 25 U.S. FOOD AND MERCHANDISE IN LOW SPEED VEHICLE MARKET, BY TYPE, 2018-2033 (USD THOUSAND)
TABLE 26 U.S. GOVERNMENT AND TRANSPORTATION IN LOW SPEED VEHICLE MARKET, BY TYPE, 2018-2033 (USD THOUSAND)
TABLE 27 U.S. EDUCATION FACILITIES IN LOW SPEED VEHICLE MARKET, BY TYPE, 2018-2033 (USD THOUSAND)
TABLE 28 U.S. MEDICAL IN LOW SPEED VEHICLE MARKET, BY TYPE, 2018-2033 (USD THOUSAND)
TABLE 29 U.S. OTHERS IN LOW SPEED VEHICLE MARKET, BY TYPE, 2018-2033 (USD THOUSAND)
List of Figure
FIGURE 1 U.S. LOW SPEED VEHICLE MARKET: SEGMENTATION
FIGURE 2 U.S. LOW SPEED VEHICLE MARKET: DATA TRIANGULATION
FIGURE 3 U.S. LOW SPEED VEHICLE MARKET: DROC ANALYSIS
FIGURE 4 U.S. LOW SPEED VEHICLE MARKET: GLOBAL VS U.S. MARKET ANALYSIS
FIGURE 5 U.S. LOW SPEED VEHICLE MARKET: COMPANY RESEARCH ANALYSIS
FIGURE 6 U.S. LOW SPEED VEHICLE MARKET: MULTIVARIATE MODELLING
FIGURE 7 U.S. LOW SPEED VEHICLE MARKET: INTERVIEW DEMOGRAPHICS
FIGURE 8 U.S. LOW SPEED VEHICLE MARKET: DBMR MARKET POSITION GRID
FIGURE 9 U.S. LOW SPEED VEHICLE MARKET: MARKET APPLICATION COVERAGE GRID
FIGURE 10 U.S. LOW SPEED VEHICLE MARKET: VENDOR SHARE ANALYSIS
FIGURE 11 U.S. LOW SPEED VEHICLE MARKET: SEGMENTATION
FIGURE 12 EXECUTIVE SUMMARY
FIGURE 13 TWO SEGMENTS COMPRISE THE U.S. LOW SPEED VEHICLE MARKET, BY PRODUCT TYPE (2025)
FIGURE 14 STRATEGIC DECISIONS
FIGURE 15 EXPANSION OF MASTER-PLANNED COMMUNITIES AND GATED RESIDENTIAL DEVELOPMENTS DRIVING THE U.S. LOW SPEED VEHICLE MARKET FROM 2026 TO 2033
FIGURE 16 GOLF CART SEGMENT IS EXPECTED TO ACCOUNT FOR THE LARGEST SHARE OF THE U.S. LOW SPEED VEHICLE MARKET IN 2026 & 2033
FIGURE 17 PORTER’S FIVE FORCE MODEL
FIGURE 18 U.S. LOW SPEED VEHICLE MARKET, 2018-2033, AVERAGE PRICE (USD/UNIT)
FIGURE 19 SUPPLY CHAIN ANALYSIS
FIGURE 20 DRIVERS, RESTRAINS, OPPORTUNITY AND CHALLENGES OF U.S. LOW SPEED VEHICLE MARKET
FIGURE 21 U.S. LOW SPEED VEHICLE MARKET: BY VEHICLE TYPE, 2025
FIGURE 22 U.S. LOW SPEED VEHICLE MARKET: BY POWER OUTPUT, 2025
FIGURE 23 U.S. LOW SPEED VEHICLE MARKET: BY NUMBER OF PASSENGER, 2025
FIGURE 24 U.S. LOW SPEED VEHICLE MARKET: BY TRANSMISSION TYPE, 2025
FIGURE 25 U.S. LOW SPEED VEHICLE MARKET: BY PROPULSION TYPE, 2025
FIGURE 26 U.S. LOW SPEED VEHICLE MARKET: BY BATTERY TYPE, 2025
FIGURE 27 U.S. LOW SPEED VEHICLE MARKET: BY APPLICATION, 2025
FIGURE 28 U.S. LOW SPEED VEHICLE MARKET: COMPANY SHARE 2025 (%)
Data collection and base year analysis are done using data collection modules with large sample sizes. The stage includes obtaining market information or related data through various sources and strategies. It includes examining and planning all the data acquired from the past in advance. It likewise envelops the examination of information inconsistencies seen across different information sources. The market data is analysed and estimated using market statistical and coherent models. Also, market share analysis and key trend analysis are the major success factors in the market report. To know more, please request an analyst call or drop down your inquiry.
The key research methodology used by DBMR research team is data triangulation which involves data mining, analysis of the impact of data variables on the market and primary (industry expert) validation. Data models include Vendor Positioning Grid, Market Time Line Analysis, Market Overview and Guide, Company Positioning Grid, Patent Analysis, Pricing Analysis, Company Market Share Analysis, Standards of Measurement, Global versus Regional and Vendor Share Analysis. To know more about the research methodology, drop in an inquiry to speak to our industry experts.
Data Bridge Market Research is a leader in advanced formative research. We take pride in servicing our existing and new customers with data and analysis that match and suits their goal. The report can be customized to include price trend analysis of target brands understanding the market for additional countries (ask for the list of countries), clinical trial results data, literature review, refurbished market and product base analysis. Market analysis of target competitors can be analyzed from technology-based analysis to market portfolio strategies. We can add as many competitors that you require data about in the format and data style you are looking for. Our team of analysts can also provide you data in crude raw excel files pivot tables (Fact book) or can assist you in creating presentations from the data sets available in the report.


