U.S. Stationery Products Market Overview
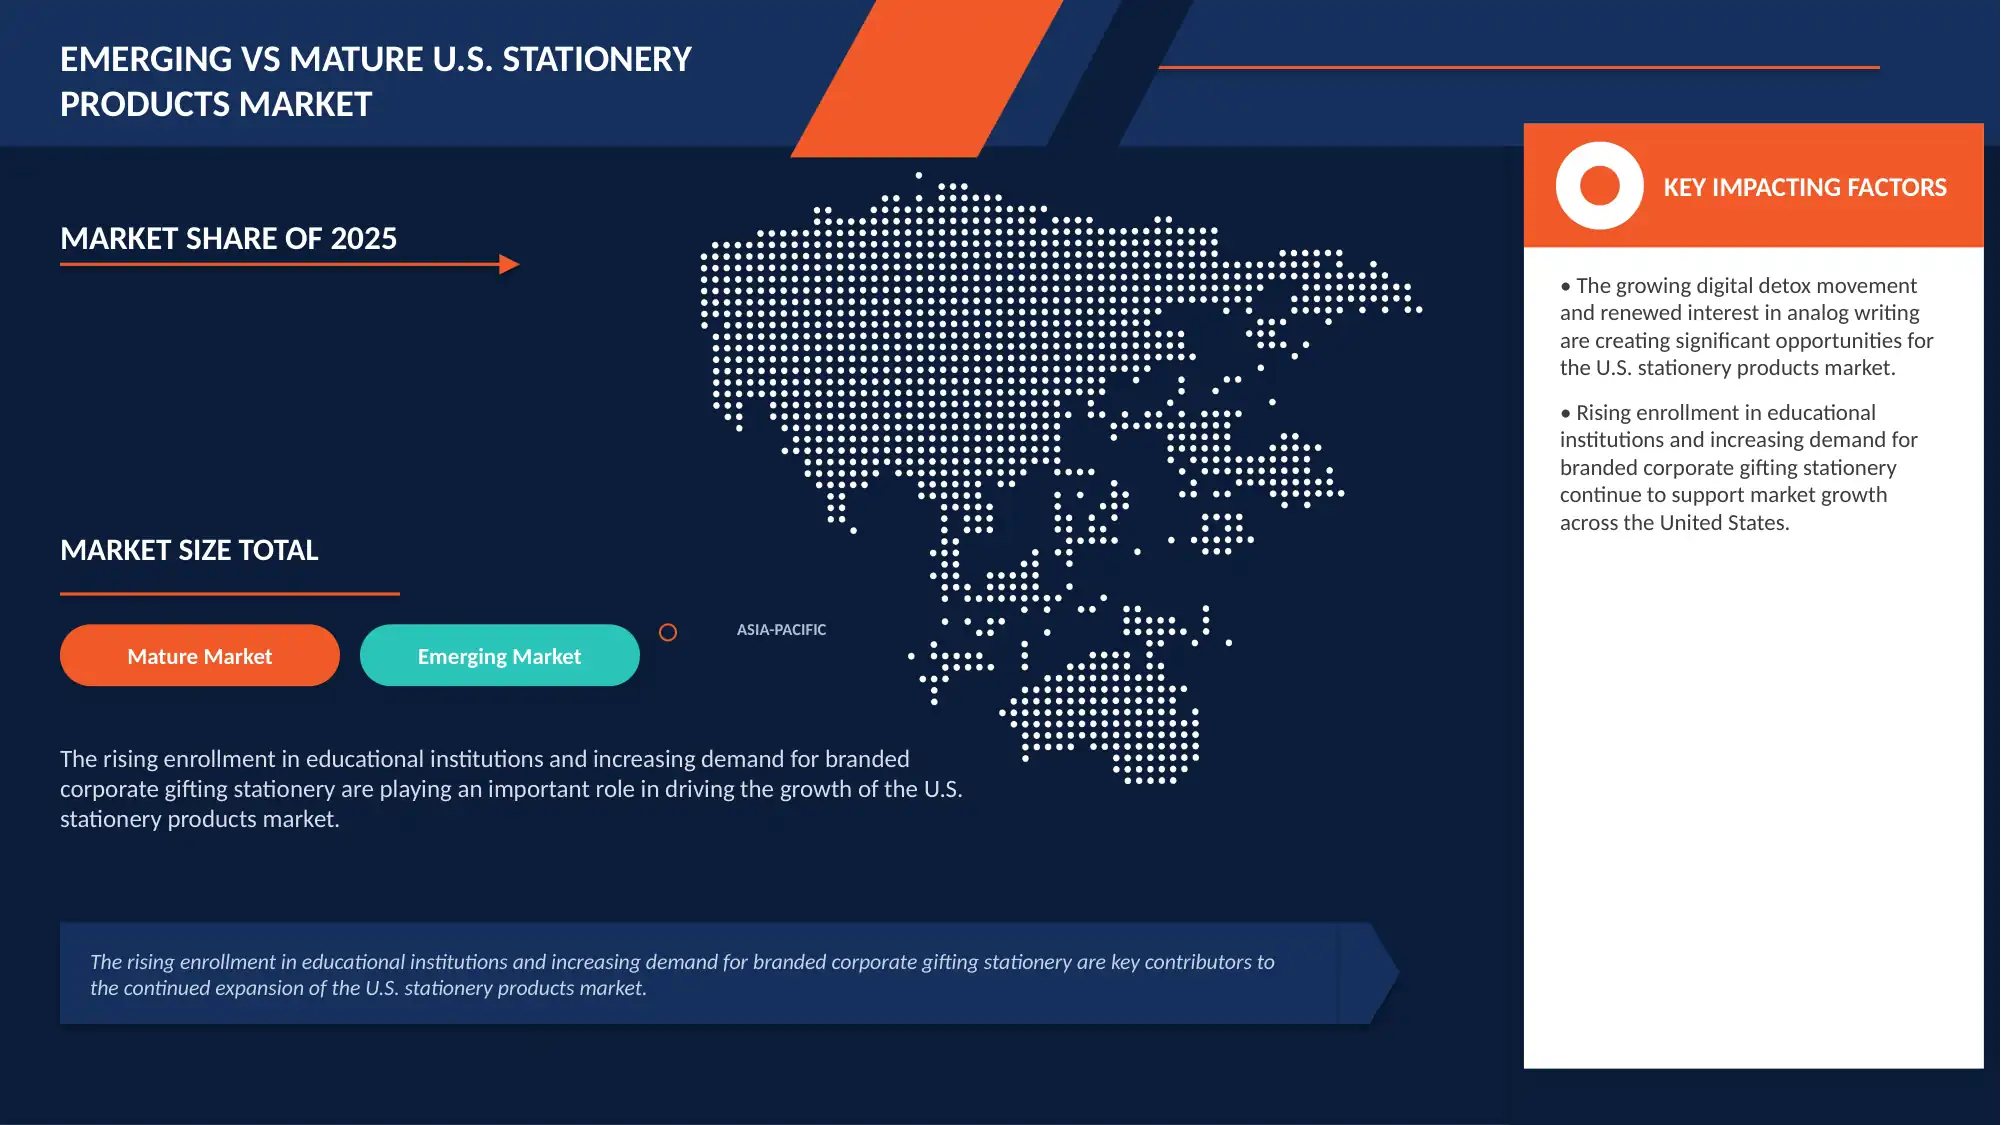
The U.S. Stationery Products Market is expected to reach USD 54.29 billion by 2033 from USD 38.55 billion in 2025, growing with a substantial CAGR of 4.34% in the forecast period of 2026 to 2033.
The U.S. Stationery Products Market is witnessing steady growth, driven by increasing demand for premium writing instruments, personalized stationery, creative paper products, and office supplies across educational, corporate, and home-office segments. The continued expansion of remote and hybrid work models, rising enrollment in educational institutions, and growing consumer interest in journaling, crafting, and artistic activities are significantly supporting market expansion. Additionally, the increasing preference for sustainable and eco-friendly stationery products, including recycled paper, biodegradable materials, and refillable writing tools, is accelerating product innovation and market development across the country.
Market growth is further supported by strong demand for aesthetically designed and customized stationery products, particularly among students, professionals, and creative consumers seeking enhanced productivity and self-expression. The rapid expansion of e-commerce platforms and direct-to-consumer sales channels has improved product accessibility and brand visibility, contributing to higher sales volumes. Continuous advancements in product design, smart stationery solutions, premium packaging, and sustainable manufacturing practices are enhancing consumer appeal and operational efficiency. Moreover, increasing investments by leading manufacturers in product diversification, brand collaborations, and digital marketing initiatives are driving innovation and supporting the long-term growth of the U.S. Stationery Products Market.
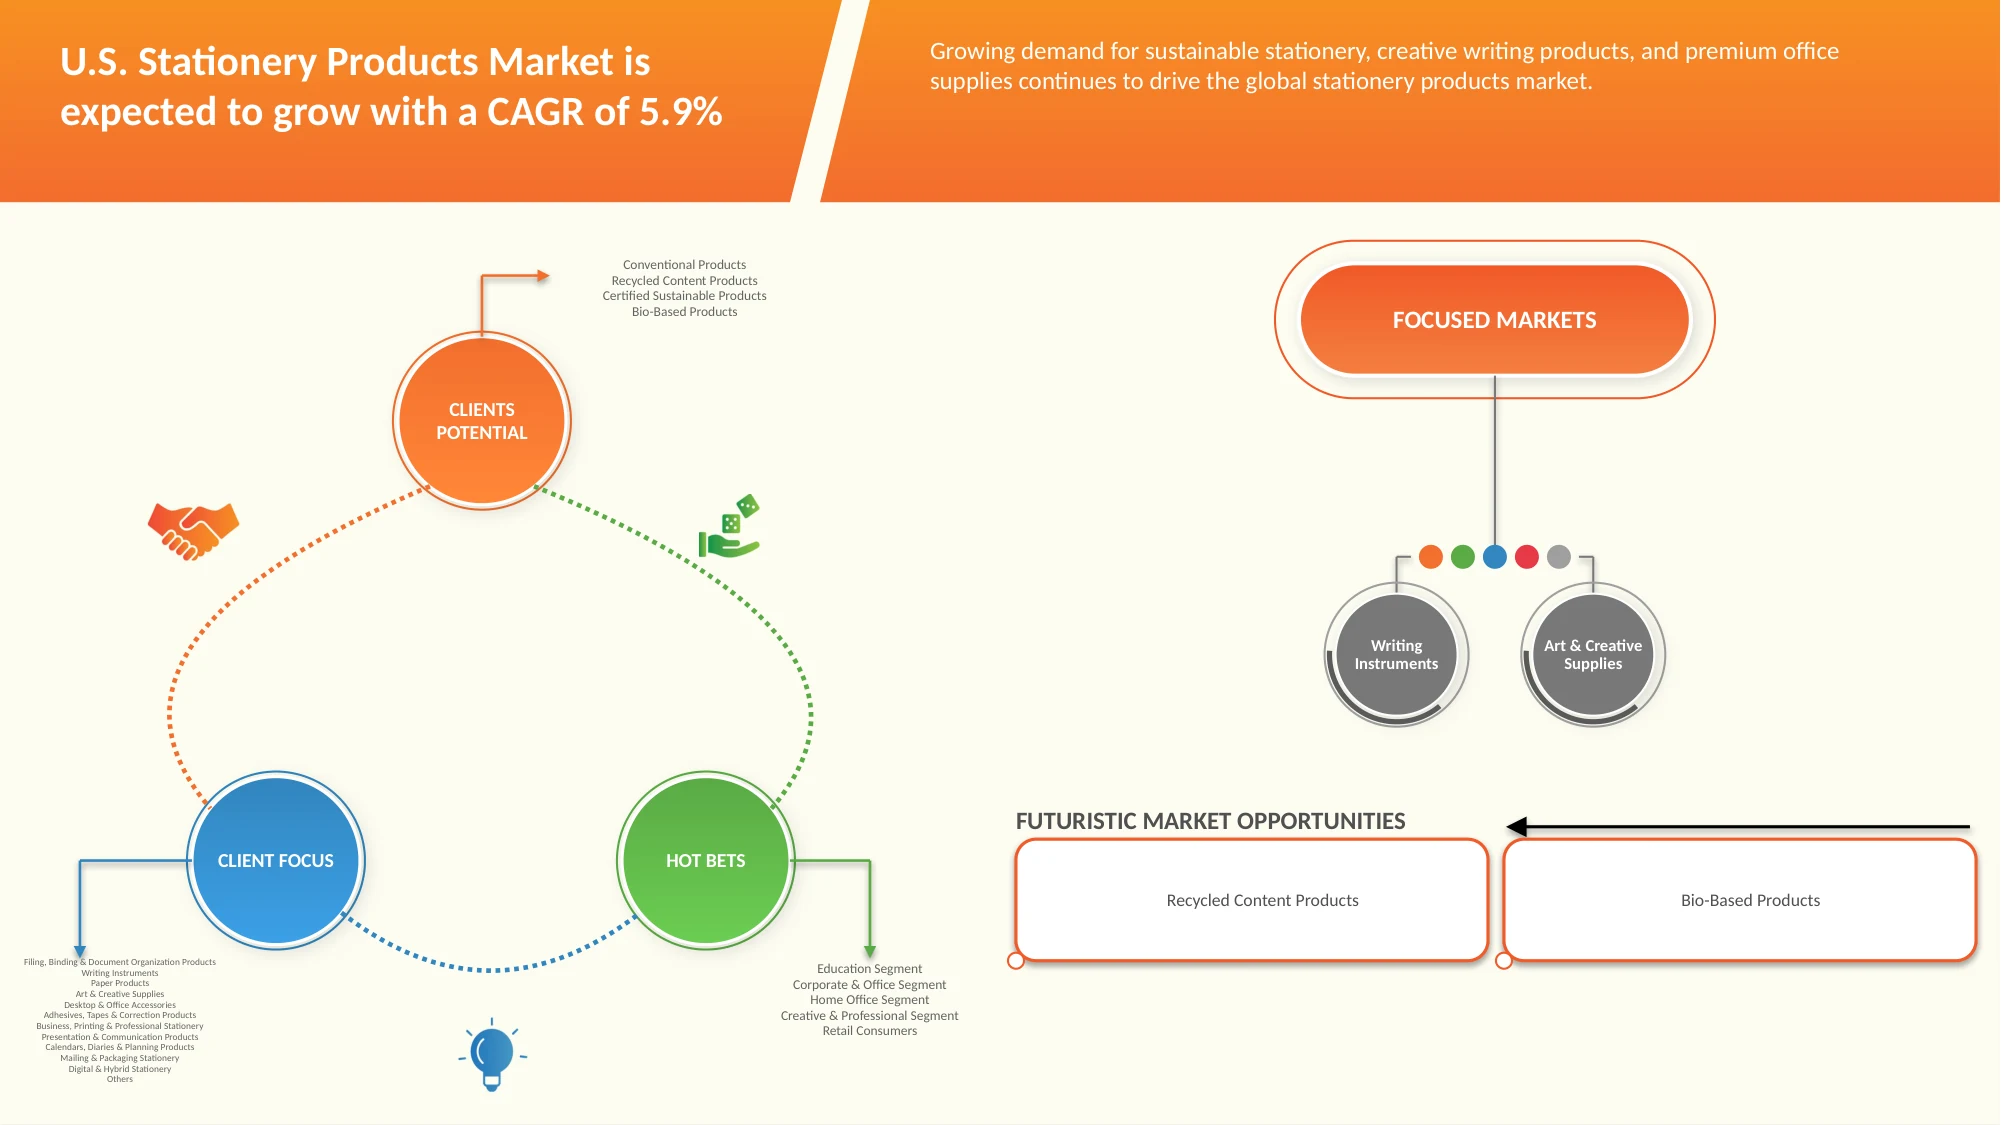
Market Size & Forecast
- Global Market Value (2025): USD 38.55 Billion
- Expected Market Value (2033): USD 54.29 Billion
- Forecast CAGR (2026–2033): 4.34%
Key Market Trends & Insights
- The Paper Products segment led the market with a 22.29% share in 2025, driven by widespread usage across offices, educational institutions, and households, along with strong demand for notebooks, printing paper, envelopes, and other essential consumables supported by steady institutional procurement and e-commerce distribution.
- Art & Creative Supplies are the fastest-growing product type, projected to register a CAGR of 5.56%, due to rising participation in hobby crafting, DIY culture, art education programs, and strong influence from social media-driven creative trends among both children and adults.
- The Economy segment dominates the Price Segment category with a 41.38% revenue share in 2025, led by cost-conscious consumers and bulk institutional buyers such as schools and offices that prioritize affordability, value packs, and consistent replenishment of basic stationery items.
- Conventional Products account for 68.37% of the market, preferred by traditional consumers and institutional purchasers due to their lower cost, easy availability, established supply chains, and familiarity compared to newer sustainable or premium alternatives.
- The Bio-Based Products segment is the fastest-growing category, with a CAGR of 5.45%, driven by increasing demand for sustainable and eco-friendly stationery solutions, including biodegradable materials, recycled paper products, and plant-based inks, supported by corporate sustainability goals and green procurement policies.
Report Scope and Stationery products Market Segmentation
|
Attributes |
Stationery products Key Market Insights |
|
Segments Covered |
|
|
Countries Covered |
U.S. |
|
Key Market Players |
|
|
Market Opportunities |
|
|
Value Added Data Infosets |
In addition to the insights on market scenarios such as market value, growth rate, segmentation, geographical coverage, and major players, the market reports curated by the Data Bridge Market Research also include import export analysis, production capacity overview, production consumption analysis, price trend analysis, climate change scenario, supply chain analysis, value chain analysis, raw material/consumables overview, vendor selection criteria, PESTLE Analysis, Porter Analysis, and regulatory framework. |
Stationery Products Market Trends
Trend: Rising demand for Immersive, Sustainable, and Experience-Led Luxury Countryside Hospitality
The steady expansion of experiential and nature-based tourism across the U.S. is a major factor driving the increased demand for luxury farm resorts and countryside hospitality offerings. As traveler preferences shift toward authentic, low-density, and wellness-oriented destinations, hospitality providers are increasingly developing premium rural and estate-based experiences that offer exclusivity, privacy, and deep cultural engagement across high-value tourism segments.
Luxury farm resorts and experiential countryside hospitality play a critical role in enhancing guest satisfaction, brand differentiation, and destination appeal. By offering curated experiences such as farm-to-table dining, agri-tourism activities, wildlife interactions, and wellness retreats, these properties enable personalized and meaningful stays, improve guest retention, and elevate overall service quality across diverse hospitality environments.
Stationery Products Market Dynamics
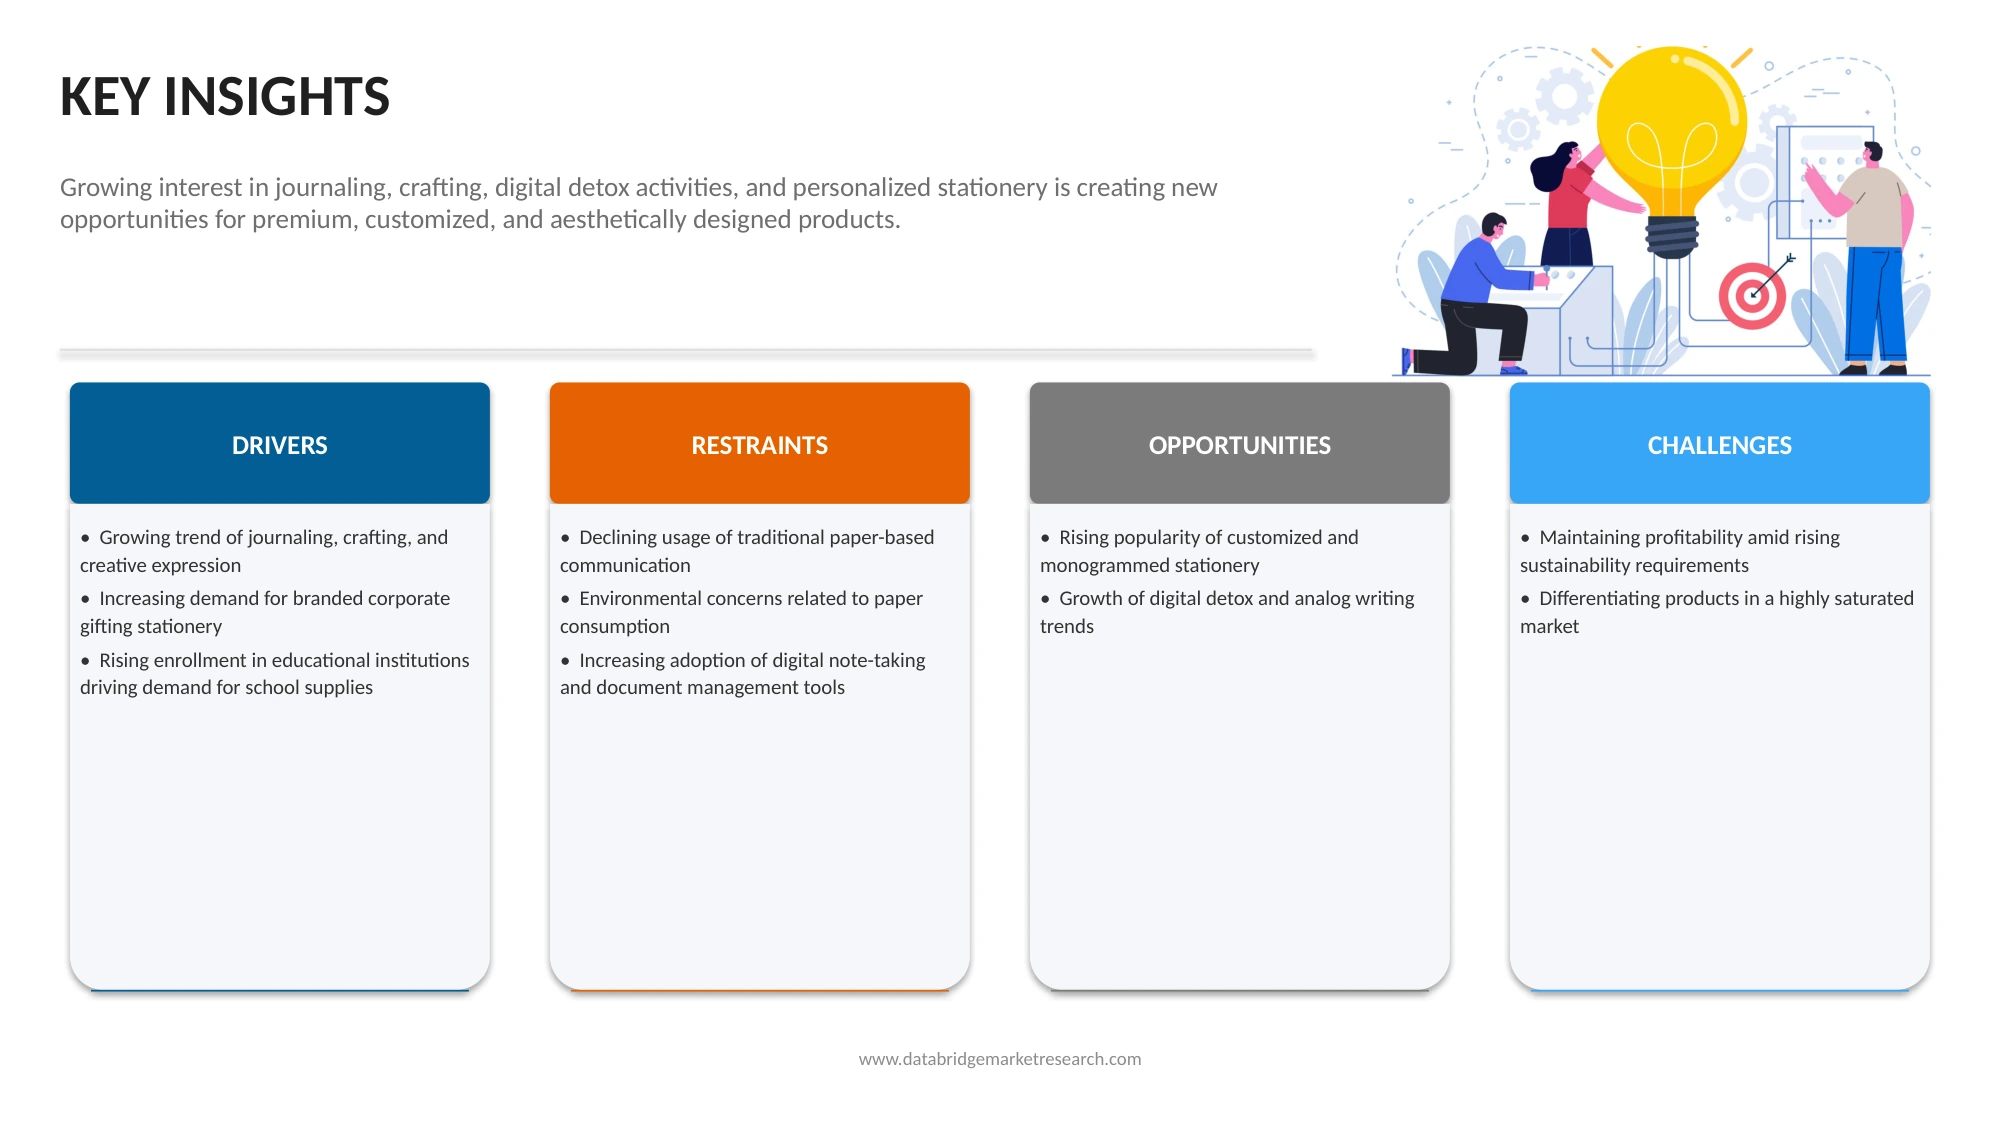
Driver
Key Market Driver: Growing Demand for Creative Expression, Organization, and Productivity Solutions
The U.S. Stationery Products Market has been experiencing a significant shift toward products that support creativity, personal organization, and productivity enhancement. Beyond traditional educational and office applications, consumers are increasingly using stationery products for journaling, habit tracking, planning, artistic activities, and personal branding. This trend has broadened the role of stationery from basic functional tools to lifestyle-oriented products that contribute to personal development and creative expression.
Simultaneously, evolving workplace and educational environments have reinforced demand for premium and specialized stationery solutions. The expansion of hybrid work models, digital learning environments, and entrepreneurial activities has increased the need for notebooks, planners, writing instruments, filing products, and desk organization accessories that improve efficiency and workflow management. Premium stationery products offering enhanced durability, design aesthetics, and ergonomic features often command higher price points and stronger customer loyalty compared to standard alternatives.
Key Restraint/Challenge: Digitalization and Declining Paper-Based Workflows Limit Market Expansion
The U.S. Stationery Products Market faces increasing challenges from the rapid adoption of digital technologies across educational, corporate, and personal environments. Digital note-taking applications, cloud-based document management systems, e-signature platforms, tablets, and productivity software have reduced dependence on traditional paper-based stationery products. As organizations continue to digitize workflows, demand for certain conventional stationery categories is experiencing slower growth.
Educational institutions and businesses are increasingly implementing paperless initiatives aimed at improving operational efficiency, reducing storage requirements, and supporting sustainability objectives. Digital classrooms, online assignments, virtual collaboration tools, and electronic documentation systems have gradually decreased consumption of notebooks, printing paper, filing products, and other traditional stationery items. This transition creates long-term demand pressures for manufacturers heavily dependent on conventional product segments.
Key Market Opportunity: Rising Demand for Sustainable, Premium, and Personalized Stationery Products Fuels Market Growth
The U.S. Stationery Products Market presents significant growth opportunities driven by increasing consumer preference for sustainable, eco-friendly, and premium stationery solutions. Growing environmental awareness among individuals, educational institutions, and corporate buyers is accelerating demand for recycled paper products, biodegradable materials, plant-based inks, and plastic-free packaging. Companies adopting ESG goals and green procurement policies are further supporting the shift toward bio-based and environmentally responsible stationery offerings. In addition, the expanding culture of personalization and creative expression is boosting demand for customized notebooks, planners, journals, and art supplies. Consumers—particularly students, young professionals, and hobbyists—are increasingly seeking aesthetically appealing, branded, and personalized stationery items that reflect individual identity and lifestyle preferences.
The rise of hybrid work and learning environments is also creating opportunities for innovative stationery formats that blend physical and digital use cases, such as smart notebooks, reusable writing systems, and organizational tools designed for productivity enhancement. Furthermore, strong growth in e-commerce and direct-to-consumer channels is enabling niche brands and premium stationery manufacturers to reach wider audiences, enhancing product visibility and market penetration. Overall, these evolving consumer preferences and sustainability-driven shifts are opening new revenue streams and supporting premiumization across the U.S. Stationery Products Market.
Stationery Products Market Scope
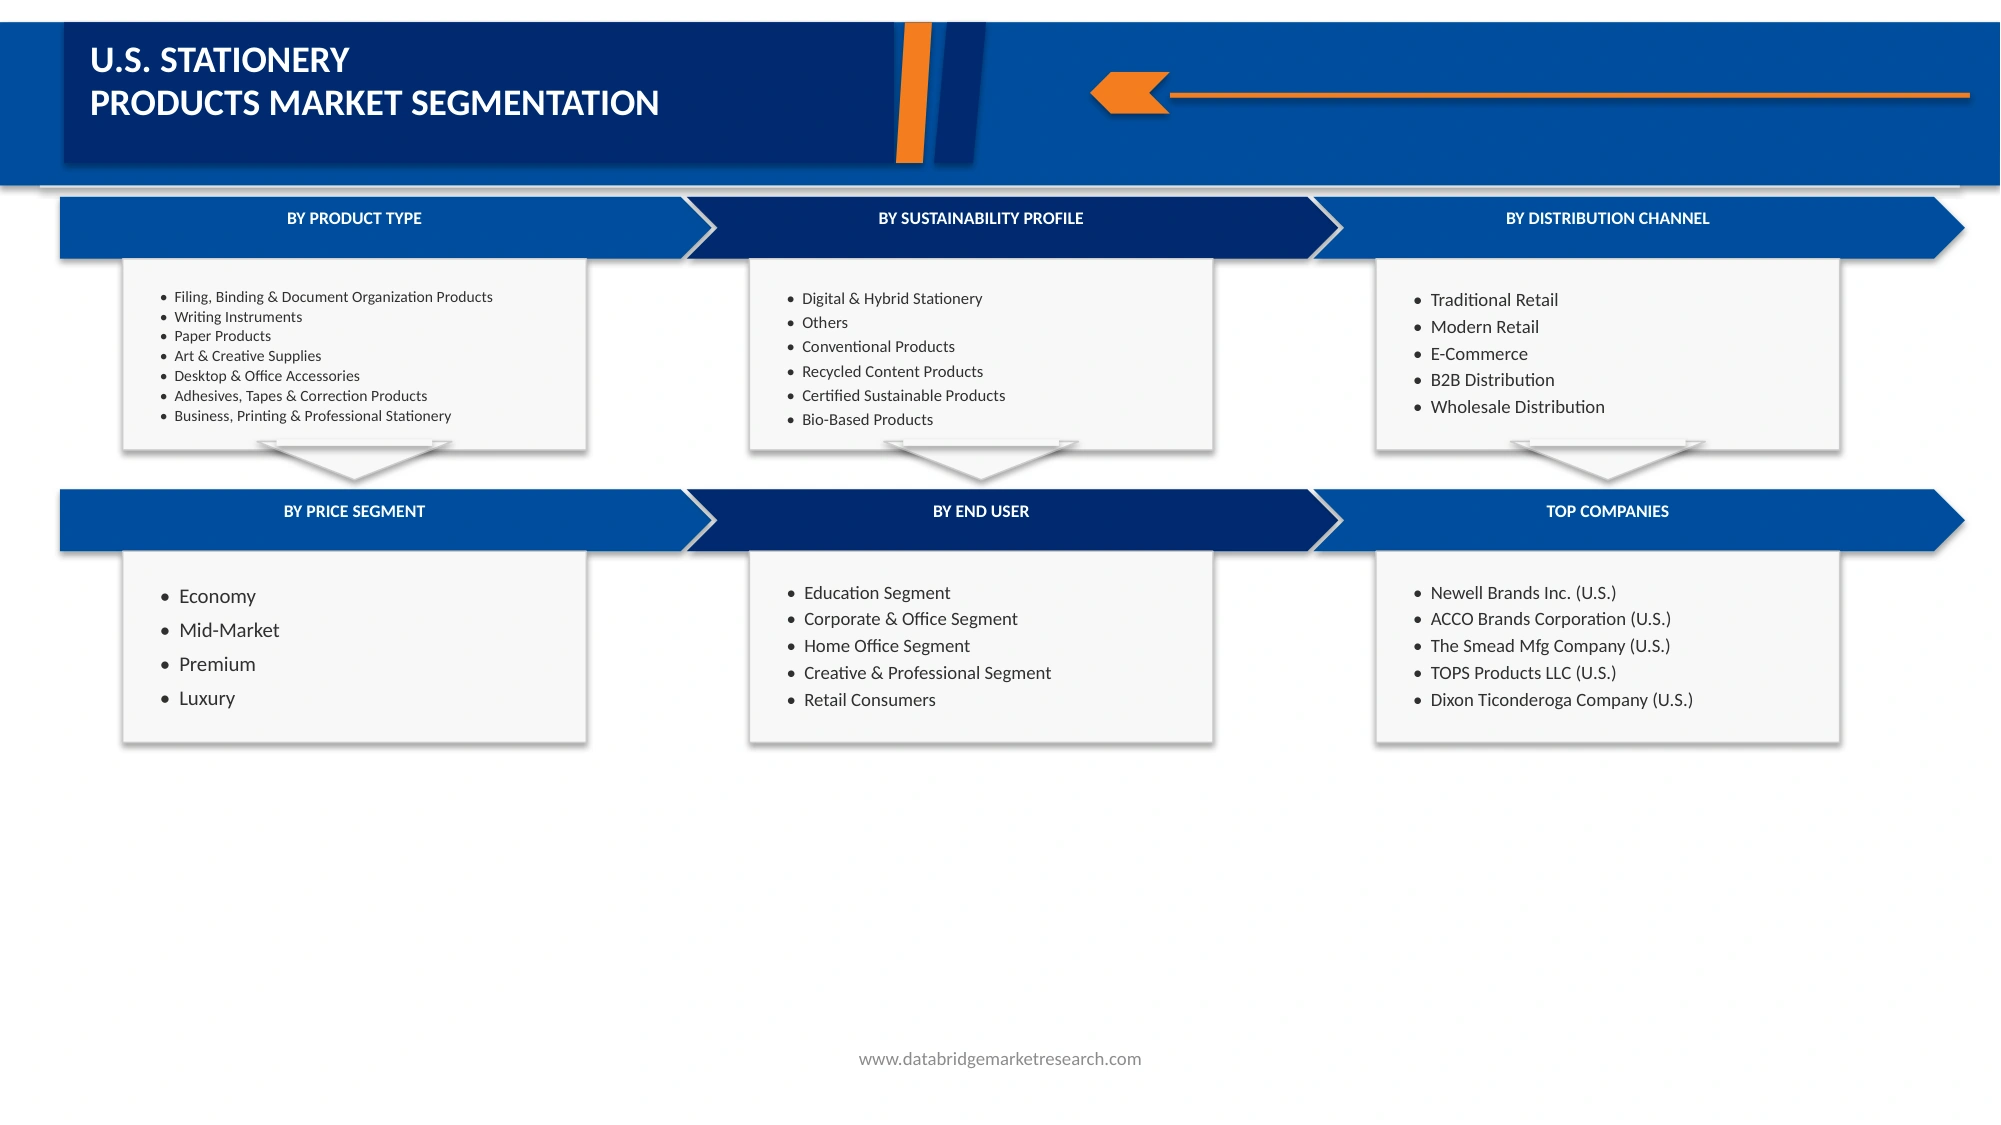
The U.S. Stationery Products Market segmented ten notable segments based on product type, price segment, sustainability profile, end user and distribution channel.
- By Product Type
On the basis of product type, the market is segmented into filing, binding & document organization products, writing instruments, paper products, art & creative supplies, desktop & office accessories, adhesives, tapes & correction products, business, printing & professional stationery, presentation & communication products, calendars, diaries & planning products, mailing & packaging stationery, digital & hybrid stationery, and others. The paper products segment dominated the largest market revenue share of 22.15% in 2026, driven by sustained demand for notebooks, copier paper, notepads, sticky notes, and printing paper across educational institutions, corporate offices, and households. The segment also benefits from increasing office activities, documentation needs, and continued use of paper-based organizational tools despite digital transformation.
The Mailing & Packaging Stationery segment is anticipated to witness the fastest CAGR of 4.81% from 2026 to 2033, fueled by the continued expansion of e-commerce activities, rising demand for shipping and fulfillment solutions, and increasing usage of packaging materials across retail, logistics, and business-to-business operations. Growth in online shopping has significantly increased the need for envelopes, mailing labels, corrugated packaging accessories, protective wraps, and other stationery-related packaging products.
- By Price Segment
On the basis of price segment, the U.S. Stationery Products Market is segmented into economy, mid-market, premium, and luxury. The economy segment dominated the largest market revenue share of 41.17% in 2026, driven by widespread demand from price-sensitive consumers, educational institutions, and small businesses seeking cost-effective stationery solutions. This segment benefits from bulk purchasing for schools and offices, high-volume consumption of basic products such as notebooks, pens, paper, and filing supplies, and strong availability across traditional retail, wholesale, and mass-market distribution channels. The focus on affordability, combined with consistent replacement cycles and large-scale procurement by institutional buyers, continues to reinforce the dominance of the economy segment.
The luxury segment is anticipated to witness the fastest CAGR of 5.35% from 2026 to 2033, fueled by rising demand for premium, design-led stationery products that emphasize aesthetics, personalization, and brand prestige. Growth is supported by increasing consumer interest in high-quality writing instruments, designer notebooks, customized gifting stationery, and executive office accessories. Expanding corporate gifting trends, growing appreciation for artisanal and limited-edition products, and the influence of lifestyle branding are further accelerating demand. Additionally, higher disposable income among affluent consumers and the rising popularity of stationery as a lifestyle and status symbol are contributing to the segment’s strong growth trajectory during the forecast period.
- By Sustainability Profile
On the basis of sustainability profile, the U.S. Stationery Products Market is segmented into conventional products, recycled content products, certified sustainable products, and bio-based products. The conventional products segment dominated the largest market revenue share of 68.23% in 2026, driven by consistent demand for stationery products across corporate offices, government agencies, financial institutions, healthcare organizations, and other commercial establishments. Businesses continue to rely on notebooks, printing paper, writing instruments, filing supplies, planners, and organizational products for daily administrative and operational activities. The segment also benefits from ongoing office-based work requirements, procurement contracts, and regular replenishment cycles for workplace supplies.
The Bio-Based Products segment is anticipated to witness the fastest CAGR of 5.45% from 2026 to 2033, fueled by fueled by increasing consumer preference for environmentally sustainable stationery products, growing corporate commitments toward sustainability, and rising adoption of eco-friendly materials across educational and office environments. Demand for stationery products manufactured from recycled paper, biodegradable materials, sustainably sourced wood, and plant-based components is expanding as environmental awareness continues to grow.
- End User
On the basis of experience category, the U.S. Stationery Products Market is segmented into education segment, corporate & office segment, home office segment, creative & professional segment, and retail consumers . The corporate & office segment dominated the largest market revenue share of 32.43% in 2026, driven by.
The Home Office Segment is anticipated to witness the fastest CAGR of 9.3% from 2026 to 2033, fueled by the continued adoption of remote and hybrid work models, increasing investments in home-based workspaces, and growing demand for office supplies among professionals working outside traditional corporate environments. As more employees, freelancers, and entrepreneurs establish dedicated home offices, demand for notebooks, writing instruments, planners, filing products, printer paper, and organizational stationery continues to rise.
- By Distribution Channel
On the basis of distribution channel, the U.S. Stationery Products Market is segmented into traditional retail, modern retail, e-commerce, B2B distribution, and wholesale distribution. The traditional retail segment dominated the largest market revenue share of 35.82% in 2026, driven by the extensive presence of stationery stores, office supply retailers, supermarkets, and local convenience outlets across the country. Consumers continue to prefer traditional retail channels for stationery purchases due to the ability to physically evaluate product quality, compare options in-store, and make immediate purchases without delivery wait times. Strong demand from students, educational institutions, small businesses, and individual consumers further supports sales through brick-and-mortar outlets.
The E-Commerce segment is anticipated to witness the fastest CAGR of 5.35% from 2026 to 2033, fueled by the growing preference for online shopping, increasing internet penetration, and the expanding availability of stationery products across digital marketplaces and brand-owned websites. Consumers are increasingly turning to e-commerce platforms for their convenience, wider product selection, competitive pricing, and doorstep delivery services.
- By End-User
On the basis of end user, the U.S. Stationery Products Market is segmented into individual travelers, couples & honeymooners, families & groups, corporate clients, special interest groups (wellness, eco, art, etc.), and others. The families & groups segment dominated the largest market revenue share of 31.70% in 2026, driven by the higher booking volumes per transaction and increasing demand for spacious accommodations across luxury countryside destinations. Families & groups, including multi-generational travelers, group vacationers, and social gatherings, are increasingly essential for sustaining occupancy and revenue growth. The segment benefits from rising preference for shared travel experiences, private villas, and multi-room accommodations that cater to group needs. Hospitality providers are enhancing offerings with customized packages, group-oriented activities, and bundled experiences to maximize guest engagement. Growing inclination toward experiential travel, including farm activities, outdoor recreation, and cultural interactions, further drives adoption. Integration of flexible accommodation layouts and personalized services enhances comfort and satisfaction, supporting repeat bookings. Strong demand for celebration-based travel such as reunions, anniversaries, and destination events also contributes to growth. Increasing focus on safety, privacy, and exclusive group experiences continues to strengthen market penetration.
The individual travelers segment is anticipated to witness the fastest CAGR of 9.5% from 2026 to 2033, fueled by the rising adoption of solo and experience-driven travel across luxury farm resort destinations. Individual travelers include solo leisure travelers, digital nomads, and independent explorers seeking privacy, personalized experiences, and meaningful engagement with destinations. Increasing demand for customized stays, wellness retreats, and self-paced travel contributes to growth. Technological advancements, including personalized itinerary planning and digital concierge services, are enhancing guest experience. Rising interest in solo travel for self-discovery and flexible travel planning supports long-term demand. Growing investments in tailored accommodation options and individualized service offerings are expanding market opportunities. Hospitality providers are focusing on creating safe, immersive, and enriching experiences to attract this segment. Expanding U.S. travel trends toward independent and experiential journeys further accelerates growth in this segment.
- By Estate Size
On the basis of estate size, the U.S. Stationery Products Market is segmented into up to 50 acres, 50–150 acres, 150–500 acres, and above 500 acres. The 50–150 acres segment dominated the largest market revenue share of 33.42% in 2026, driven by the optimal balance between land utilization efficiency and operational scalability across luxury countryside hospitality properties. Estates within the 50–150 acres range, including mid-sized farm resorts and experiential hospitality developments, are increasingly essential for delivering diversified guest experiences without excessive capital intensity. The segment benefits from the ability to accommodate a mix of accommodations, agricultural activities, wellness facilities, and recreational spaces within a manageable footprint. Operators are leveraging this estate size to optimize resource allocation, staffing efficiency, and infrastructure investments. Growing demand for properties that offer both exclusivity and a wide range of experiences further supports adoption. Integration of sustainable practices, including organic farming and eco-friendly infrastructure, enhances operational value and guest appeal. Balanced development costs and revenue generation potential contribute to higher profitability and scalability. Increasing investor preference for mid-sized estates continues to strengthen market penetration.
The 150–500 acres segment is anticipated to witness the fastest CAGR of 9.5% from 2026 to 2033, fueled by the rising demand for expansive yet operationally efficient luxury farm resorts offering large-scale immersive experiences. Estates within the 150–500 acres range enable the development of diversified hospitality ecosystems, including multiple accommodation formats, agricultural activities, and recreational offerings within a balanced land footprint. Increasing interest in destination-style tourism and mid-to-large format experiential properties contributes to growth. Technological advancements, including smart land management and sustainable resource utilization, are enhancing operational efficiency. Rising investments in integrated resort developments and scalable luxury infrastructure support expansion. Growing preference for privacy, exclusivity, and access to varied experiences further drives demand. Operators are focusing on creating well-planned environments with premium amenities and curated offerings. Expanding U.S. tourism trends toward unique and experience-driven countryside destinations accelerate growth in this segment.
- By Price Category
On the basis of price category, the U.S. Stationery Products Market is segmented into ultra-luxury, luxury, and upper upscale. The luxury segment dominated the largest market revenue share of 42.22% in 2026, driven by its ability to offer a strong balance between premium pricing and diverse experiential offerings across countryside hospitality destinations. Luxury properties, including high-end farm resorts, boutique countryside retreats, and experience-driven accommodations, are increasingly essential for attracting a broad yet affluent customer base. The segment benefits from rising demand for premium travel experiences that combine comfort, exclusivity, and value-driven services. Hospitality operators are continuously enhancing offerings through curated experiences, personalized services, and upgraded infrastructure to maintain competitive positioning. Growing preference for experiential stays, wellness-focused tourism, and nature-based luxury further drives adoption. Integration of modern amenities with authentic rural experiences enhances guest satisfaction, supporting higher occupancy rates. Strong brand positioning and competitive pricing strategies also contribute to segment growth. Increasing accessibility of luxury travel to upper-middle-income consumers continues to strengthen market penetration.
The upper upscale segment is anticipated to witness the fastest CAGR of 9.1% from 2026 to 2033, fueled by the rising demand for premium yet accessible luxury hospitality offerings that balance comfort, quality, and value-driven experiences. Upper upscale properties include high-end resorts, boutique countryside accommodations, and experience-focused stays offering enhanced amenities and personalized services at relatively competitive pricing. Increasing demand from affluent and upper-middle-income travelers seeking elevated yet cost-effective experiences contributes to growth. Technological advancements, including smart room features and digital concierge services, are enhancing guest experiences. Rising focus on comfort, service quality, and differentiated offerings supports long-term demand. Growing investments in premium infrastructure and curated experiences are expanding market opportunities. Hospitality providers are focusing on delivering consistent service standards and strong value propositions to attract a broader customer base. Expanding U.S. travel trends toward affordable luxury and experiential tourism further accelerate growth in this segment.
- By Length of Stay
On the basis of length of stay, the U.S. Stationery Products Market is segmented into short stay (1–2 nights), leisure stay (3–5 nights), and extended retreat (6+ nights). The leisure stay (3–5 nights) segment dominated the largest market revenue share of 49.92% in 2026, driven by the optimal balance between duration, affordability, and comprehensive experience consumption across luxury countryside hospitality properties. Leisure stay durations, including mid-length vacations and experiential getaways, are increasingly essential for maximizing guest engagement and property utilization. The segment benefits from the ability to offer a complete range of activities such as agri-tourism, wellness programs, and outdoor experiences within a manageable timeframe. Hospitality providers are designing curated packages and bundled experiences tailored to 3–5 night stays to enhance value perception. Growing preference for short vacations that allow relaxation without extended time commitments further drives adoption. Integration of flexible itineraries and personalized services enhances guest satisfaction, supporting repeat bookings. Strong demand from working professionals and urban travelers seeking quick escapes also contributes to growth. Increasing focus on experience-driven travel continues to strengthen market penetration.
The leisure stay (3–5 nights) segment is anticipated to witness the fastest CAGR of 9.3% from 2026 to 2033, fueled by the rising adoption of mid-duration, experience-rich travel that balances flexibility, engagement, and convenience across luxury countryside destinations. Leisure stay durations include curated vacations and experiential getaways designed to deliver diverse activities within an optimal timeframe. Increasing demand for flexible travel plans and well-structured itineraries contributes to growth. Technological advancements, including digital itinerary planning and personalized guest services, are enhancing the overall experience. Rising interest in combining relaxation with curated activities such as agri-tourism, wellness sessions, and cultural experiences supports long-term demand. Growing investments in package-based offerings and mid-stay infrastructure are expanding market opportunities. Hospitality providers are focusing on designing balanced and immersive experiences to maximize guest satisfaction. Expanding U.S. travel trends toward short yet meaningful escapes further accelerate growth in this segment.
- By Ownership / Management Model
On the basis of ownership/management model, the U.S. Stationery Products Market is segmented into independent owner-operated resorts, brand-managed resorts, franchised resorts, private estate hospitality operations, institutionally owned/asset-managed resorts, and others. The independent owner-operated resorts segment dominated the largest market revenue share of 30.32% in 2026, driven by greater flexibility in experience design, localized offerings, and the uniqueness of property positioning across countryside hospitality destinations. Independent owner-operated resorts, including privately managed farm resorts and boutique experiential properties, are increasingly essential for delivering highly personalized and authentic guest experiences. The segment benefits from the ability to quickly adapt to changing consumer preferences and incorporate region-specific cultural, culinary, and agricultural elements. Operators are leveraging creative freedom to design distinctive experiences that differentiate their properties in a competitive market. Growing demand for unique, non-standardized hospitality offerings further drives adoption. Integration of local resources, artisanal collaborations, and customized services enhances guest engagement, supporting higher satisfaction and repeat visits. Strong emphasis on storytelling, authenticity, and experiential value also contributes to segment growth. Increasing preference for independent and niche hospitality brands continues to strengthen market penetration.
The brand-managed resorts segment is anticipated to witness the fastest CAGR of 9.4% from 2026 to 2033, fueled by the rising adoption of standardized luxury services combined with U.S. brand recognition and operational expertise. Brand-managed resorts include properties operated under established hospitality brands that offer consistent service quality and U.S. marketing reach. Increasing demand for reliability, quality assurance, and structured service delivery contributes to growth. Technological advancements, including centralized reservation systems and customer relationship management platforms, are enhancing operational efficiency. Rising investments from U.S. hospitality chains in countryside and experiential tourism segments support expansion. Growing preference among international travelers for trusted brand experiences further drives demand. Operators are focusing on blending brand standards with localized experiences to enhance appeal. Expanding U.S. tourism and cross-border travel trends further accelerate growth in this segment.
Stationery Products Market Regional Analysis
The U.S. stationary products market accounted for the largest revenue share in North America in 2025, supported by a well-established education sector, strong corporate and commercial demand, and a large consumer base that continues to utilize paper-based products for academic, professional, and personal applications. The market benefits from extensive distribution networks, widespread availability through retail and e-commerce channels, and ongoing demand for office supplies, notebooks, writing instruments, and organizational products. Growing interest in premium, customized, and environmentally sustainable stationery products, coupled with rising adoption of innovative designs and value-added features, continues to support market growth. Additionally, consistent spending by educational institutions, businesses, and government organizations reinforces the U.S.'s leading position in the stationary products market.
U.S. Stationery Products Market Insight
The U.S. Stationery Products Market is gaining strong momentum due to increasing demand for premium, personalized, and sustainable stationery solutions across educational, corporate, and consumer segments. Students, professionals, artists, and creative enthusiasts are increasingly seeking high-quality writing instruments, notebooks, planners, journals, and office supplies that enhance productivity, organization, and self-expression. The growing popularity of journaling, creative hobbies, hybrid work environments, and personalized stationery products is further supporting market expansion. Manufacturers and retailers across the U.S. emphasize product innovation, ergonomic design, sustainability, and customization capabilities, driving consistent demand for value-added stationery offerings. Additionally, increasing adoption of eco-friendly materials, expansion of e-commerce distribution channels, integration of smart stationery solutions, and investments in premium product development are accelerating the evolution of the U.S. Stationery Products Market as a highly innovative, consumer-centric, and growth-oriented sector within the North American region.
Stationery Products Market Share
The stationery products industry is primarily led by well-established companies, including:
- ACCO Brands Corporation (U.S.)
- 3M Company (U.S.)
- T. Cross Company, LLC (U.S.)
- Appointed Co. (U.S.)
- Chartpak, Inc. (U.S.)
- Tops Products LLC (U.S.)
- Roaring Spring Paper Products (U.S.)
- Crane & Co., Inc. (U.S.)
- Crayola LLC (U.S.)
- Dixon Ticonderoga Company (U.S.)
- Erin Condren Design, Inc. (U.S.)
- The Smead Manufacturing Company (U.S.)
- General Pencil Company, Inc. (U.S.)
- Levenger Company (U.S.)
- Newell Brands Inc. (U.S.)
Latest Developments in the U.S. Stationery Products Market
- In May 2026, Newell Brands launched a limited-edition collection of creative tools under its Sharpie brand in collaboration with Disney and Pixar's "Toy Story 5". The launch expanded the brand's catalog of writing instruments, featuring specially designed Permanent Markers and Sharpie S-Note Creative Highlighters that showcase the film's iconic colors and character-driven packaging.
- In March 2026, ACCO Brands has officially completed its acquisition of EPOS, a provider of premium technology accessories and workplace productivity portfolio. The acquisition strengthens ACCO’s presence in the growing enterprise communications market by integrating EPOS’s advanced audio technologies, widely used in unified communications and hybrid work environments, into its global brand ecosystem. The deal supports ACCO Brands’ strategy to shift toward higher-growth workplace technology categories.
- In July 2023, Dixon Ticonderoga Company has donated 2 million pencils to the Kids In Need Foundation, reinforcing its long-standing commitment to supporting underserved students and teachers across the United States. The initiative is part of the company’s ongoing education-focused philanthropy, aimed at ensuring classrooms are equipped with essential learning tools, particularly in under-resourced schools where basic supplies remain a critical need. This donation strengthens Dixon Ticonderoga’s position as a leading educational supplies brand.
- In July 2025, A.T. Cross Company has announced an exclusive partnership with HIRSCH, appointing the company as its dedicated distributor in the promotional products channel. Through this collaboration, HIRSCH will manage the distribution of Cross writing instruments and premium gift sets, enabling broader access to the brand’s iconic pens across corporate gifting and promotional markets. The partnership reinforces Cross’s long-standing positioning in the premium writing instruments segment by expanding its reach within branded merchandise and corporate gifting channels.
- In February 2026, Crayola has announced its 2026 innovation lineup, unveiling a range of new creative products designed to expand imaginative play and artistic expression for children and adults. The launch highlights new additions across its Scribble Scrubbie franchise, Color Wonder range, Clicks stationery line, and Crayola Story Creator platform, along with new sensory and interactive play products such as Glow-based toys, scented playsets, and AI-assisted creative storytelling tools. The 2026 product strategy reflects Crayola’s continued focus on combining hands-on creativity with interactive and experience-driven learning.
- Interactive Data Analysis Dashboard
- Company Analysis Dashboard for high growth potential opportunities
- Research Analyst Access for customization & queries
- Competitor Analysis with Interactive dashboard
- Latest News, Updates & Trend analysis
- Harness the Power of Benchmark Analysis for Comprehensive Competitor Tracking
Table of Content
1 INTRODUCTION
1.1 OBJECTIVES OF THE STUDY
1.2 MARKET DEFINITION
1.3 OVERVIEW OF U.S. STATIONARY PRODUCTS MARKET
1.4 LIMITATIONS
1.5 MARKETS COVERED
2 MARKET SEGMENTATION
2.1 MARKETS COVERED
2.2 GEOGRAPHICAL SCOPE
2.3 YEARS CONSIDERED FOR THE STUDY
2.4 CURRENCY AND PRICING
2.5 DBMR TRIPOD DATA VALIDATION MODEL
2.6 MULTIVARIATE MODELING
2.7 PRIMARY INTERVIEWS WITH KEY OPINION LEADERS
2.8 DBMR MARKET POSITION GRID
2.9 MARKET END USER COVERAGE GRID
2.1 VENDOR SHARE ANALYSIS
2.11 SECONDARY SOURCES
2.12 ASSUMPTIONS
3 EXECUTIVE SUMMARY
4 PREMIUM INSIGHTS
4.1 RAW MATERIAL COVERAGE
4.1.1 PAPER AND PAPERBOARD
4.1.2 WOOD PULP AND RECYCLED FIBER
4.1.3 PLASTICS AND POLYMER RESINS
4.1.4 INKS AND PIGMENTS
4.1.5 ADHESIVES AND BINDING CHEMICALS
4.1.6 FILLERS, COATINGS, AND SPECIALTY MINERALS
4.1.7 METALS AND MECHANICAL COMPONENTS
4.1.8 RUBBER AND ELASTOMER MATERIALS
4.2 VALUE CHAIN ANALYSIS:
4.2.1 RAW MATERIAL SUPPLY (25%–30%)
4.2.2 MANUFACTURING & PRODUCT DEVELOPMENT (20%–25%)
4.2.3 PROCESSING, PRINTING & PACKAGING (15%–20%)
4.2.4 DISTRIBUTION & END-USE APPLICATION (25% – 30%)
4.2.5 CONCLUSION
4.3 PORTER’S FIVE FORCES ANALYSIS
4.3.1 INTRODUCTION
4.3.2 INTENSITY OF COMPETITIVE RIVALRY (HIGH)
4.3.3 BARGAINING POWER OF BUYERS – MODERATE TO HIGH
4.3.4 THREAT OF NEW ENTRANTS – MODERATE
4.3.5 THREAT OF SUBSTITUTE PRODUCTS – MODERATE TO HIGH
4.3.6 BARGAINING POWER OF SUPPLIERS – MODERATE
4.3.7 CONCLUSION
4.4 PROFIT MARGINS SCENARIO
4.4.1 INDUSTRY MARGIN OVERVIEW
4.4.2 COST STRUCTURE BREAKDOWN
4.4.3 PRODUCT-LEVEL MARGIN ANALYSIS
4.4.4 DISTRIBUTION & RETAIL MARGIN DYNAMICS
4.4.5 SUSTAINABILITY & PRICING IMPACT
4.4.6 FUTURE PROFITABILITY OUTLOOK
4.5 INNOVATION TRACKER AND STRATEGIC ANALYSIS
4.5.1 MAJOR DEALS AND STRATEGIC ALLIANCES ANALYSIS
4.5.1.1 JOINT VENTURES
4.5.1.2 MERGERS AND ACQUISITIONS
4.5.1.3 LICENSING AND PARTNERSHIP
4.5.1.4 TECHNOLOGY COLLABORATIONS
4.5.1.5 STRATEGIC DIVESTMENTS
4.5.2 NUMBER OF PRODUCTS IN DEVELOPMENT
4.5.3 STAGE OF DEVELOPMENT
4.5.3.1 EARLY-STAGE INNOVATION
4.5.3.2 MID-STAGE COMMERCIALIZATION
4.5.3.3 MATURE COMMERCIAL EXPANSION
4.5.4 TIMELINES AND MILESTONES
4.5.5 INNOVATION STRATEGIES AND METHODOLOGIES
4.5.6 RISK ASSESSMENT AND MITIGATION
4.5.6.1 DIGITAL SUBSTITUTION RISK
4.5.6.2 RAW MATERIAL VOLATILITY
4.5.6.3 COMPETITIVE PRICING PRESSURE
4.5.6.4 RETAIL CHANNEL DISRUPTION
4.5.6.5 SUSTAINABILITY COMPLIANCE RISK
4.5.7 FUTURE OUTLOOK
4.6 CLIMATE CHANGE AND SUSTAINABILITY SCENARIO
4.6.1 ENVIRONMENTAL CONCERNS
4.6.2 INDUSTRY RESPONSE
4.6.3 GOVERNMENT’S ROLE
4.6.4 ANALYST RECOMMENDATIONS
4.7 INDUSTRY ECOSYSTEM ANALYSIS
4.7.1 PROMINENT COMPANIES
4.7.2 SMALL & MEDIUM SIZE COMPANIES
4.7.3 END USERS
4.8 IMPACT OF WAR ON SUPPLY CHAIN, GEOGRAPHIC FOOTPRINT & STRUCTURAL SHIFTS AND ADAPTIVE STRATEGIES
4.8.1 SUPPLY CHAIN RESILIENCE
4.8.1.1 STRATEGIC DECISIONS
4.8.1.1.1 DIVERSIFICATION OF RAW MATERIAL AND COMPONENT SOURCING ACROSS MULTIPLE GEOGRAPHIC REGIONS
4.8.1.1.2 REDUCTION OF DEPENDENCY ON SINGLE-COUNTRY SUPPLIERS FOR CRITICAL INPUTS AND COMMODITIES
4.8.1.1.3 STRATEGIC PARTNERSHIPS WITH REGIONAL AND GLOBAL SUPPLIERS TO ENSURE STABLE SUPPLY CONTINUITY
4.8.1.1.4 DEVELOPMENT OF ALTERNATIVE LOGISTICS ROUTES AND TRANSPORTATION CORRIDORS TO MITIGATE SHIPPING DISRUPTIONS
4.8.1.1.5 EXPANSION OF REGIONAL MANUFACTURING, PROCESSING, AND STORAGE FACILITIES TO STRENGTHEN SUPPLY SECURITY
4.8.1.1.6 STRENGTHENING SUPPLIER NETWORKS AND INCREASING SAFETY STOCK LEVELS FOR CRITICAL INPUTS
4.8.2 ENERGY & OPERATIONAL COST RISK
4.8.2.1 STRATEGIC DECISIONS
4.8.2.1.1 VOLATILITY IN FUEL, ELECTRICITY, AND NATURAL GAS PRICES IMPACTING PRODUCTION AND PROCESSING COSTS
4.8.2.1.2 INCREASED OPERATIONAL EXPENSES FOR ENERGY-INTENSIVE MANUFACTURING AND INDUSTRIAL OPERATIONS
4.8.2.1.3 LONG-TERM ENERGY PROCUREMENT AGREEMENTS TO STABILIZE PRODUCTION AND OPERATIONAL COSTS
4.8.2.1.4 OPTIMIZATION OF PRODUCTION PROCESSES TO REDUCE ENERGY CONSUMPTION AND IMPROVE EFFICIENCY
4.8.2.1.5 INVESTMENT IN ENERGY-EFFICIENT TECHNOLOGIES, EQUIPMENT, AND PROCESS IMPROVEMENTS
4.8.2.1.6 INTEGRATION OF RENEWABLE AND ALTERNATIVE ENERGY SOURCES INTO INDUSTRIAL OPERATIONS
4.8.3 GEOGRAPHIC FOOTPRINT REASSESSMENT
4.8.3.1 STRATEGIC DECISIONS
4.8.3.1.1 EXPANSION OF PRODUCTION AND MANUFACTURING FACILITIES IN POLITICALLY STABLE REGIONS
4.8.3.1.2 RELOCATION OF MANUFACTURING CLOSER TO RAW MATERIAL SOURCES AND KEY END-USE MARKETS
4.8.3.1.3 DIVERSIFICATION OF GLOBAL PRODUCTION HUBS ACROSS ASIA-PACIFIC, NORTH AMERICA, EUROPE, AND THE MIDDLE EAST
4.8.3.1.4 DEVELOPMENT OF REGIONAL SUPPLY AND DISTRIBUTION HUBS TO REDUCE CROSS-BORDER DEPENDENCY
4.8.3.1.5 ADOPTION OF DECENTRALIZED MANUFACTURING STRATEGIES TO REDUCE GEOPOLITICAL AND TRADE RISKS
4.8.4 SCENARIO PLANNING & RISK MANAGEMENT
4.8.4.1.1 STRATEGIC DECISIONS
4.8.4.1.2 CREATION OF STRATEGIC RESERVES FOR CRITICAL RAW MATERIALS, COMMODITIES, AND INDUSTRIAL INPUTS
4.8.4.1.3 IMPLEMENTATION OF REAL-TIME SUPPLY CHAIN MONITORING AND RISK ASSESSMENT SYSTEMS
4.8.4.1.4 MULTI-SOURCE PROCUREMENT STRATEGIES FOR KEY PRODUCTION INPUTS AND MATERIALS
4.8.4.1.5 DEVELOPMENT OF CONTINGENCY LOGISTICS PLANS TO ADDRESS TRANSPORTATION AND TRADE DISRUPTIONS
4.8.4.1.6 STRENGTHENING REGULATORY COMPLIANCE, SAFETY PROTOCOLS, AND OPERATIONAL RISK MANAGEMENT FRAMEWORKS
4.8.5 CASH & FINANCIAL PROTECTION
4.8.5.1 STRATEGIC DECISIONS
4.8.5.1.1 HEDGING STRATEGIES TO MITIGATE VOLATILITY IN COMMODITY, RAW MATERIAL, AND ENERGY PRICES
4.8.5.1.2 DIVERSIFICATION OF REVENUE STREAMS ACROSS MULTIPLE MARKETS AND END-USE INDUSTRIES
4.8.5.1.3 COST OPTIMIZATION THROUGH AUTOMATION, OPERATIONAL EFFICIENCY, AND DIGITALIZATION INITIATIVES
4.8.5.1.4 LONG-TERM SUPPLY AGREEMENTS WITH KEY CUSTOMERS AND STRATEGIC PARTNERS
4.8.5.1.5 IMPROVED WORKING CAPITAL MANAGEMENT AND INVENTORY OPTIMIZATION STRATEGIES
4.8.6 TECHNOLOGY ADOPTION & INDUSTRIAL AUTOMATION
4.8.6.1 STRATEGIC DECISIONS
4.8.6.1.1 ADOPTION OF AUTOMATION TECHNOLOGIES TO IMPROVE EFFICIENCY IN MANUFACTURING, PROCESSING, AND PRODUCTION OPERATIONS
4.8.6.1.2 INTEGRATION OF SMART MANUFACTURING SYSTEMS AND INDUSTRIAL IOT (IIOT) FOR REAL-TIME MONITORING AND OPERATIONAL CONTROL
4.8.6.1.3 IMPLEMENTATION OF ADVANCED PROCESS CONTROL SYSTEMS TO ENHANCE PRODUCTIVITY AND REDUCE DOWNTIME
4.8.6.1.4 DEPLOYMENT OF ROBOTICS AND AUTOMATED HANDLING SYSTEMS IN MANUFACTURING PLANTS, WAREHOUSES, AND DISTRIBUTION CENTERS
4.8.6.1.5 INVESTMENT IN PREDICTIVE MAINTENANCE TECHNOLOGIES TO IMPROVE EQUIPMENT RELIABILITY AND REDUCE OPERATIONAL DISRUPTIONS
4.8.6.1.6 DIGITAL INTEGRATION OF SUPPLY CHAIN, PRODUCTION, AND LOGISTICS OPERATIONS THROUGH CENTRALIZED MANAGEMENT PLATFORMS
4.8.6.1.7 IMPLEMENTATION OF DIGITAL TWIN TECHNOLOGIES TO SIMULATE PRODUCTION PROCESSES AND OPTIMIZE OPERATIONAL PERFORMANCE
4.8.6.1.8 ADOPTION OF AI-DRIVEN QUALITY CONTROL AND INSPECTION SYSTEMS TO IMPROVE PRODUCT CONSISTENCY AND REDUCE DEFECTS
4.8.6.1.9 INTEGRATION OF AUTOMATED WAREHOUSE MANAGEMENT AND SMART LOGISTICS SYSTEMS TO ENHANCE DISTRIBUTION EFFICIENCY
4.8.7 NEW BUSINESS & EMERGING REVENUE OPPORTUNITIES & FUTURE OUTLOOK
4.8.7.1 STRATEGIC DECISIONS
4.8.7.1.1 GROWTH IN REGIONAL MANUFACTURING ECOSYSTEMS AND LOCALIZED SUPPLY CHAINS
4.8.7.1.2 EXPANSION OF SUSTAINABLE AND LOW-CARBON PRODUCTION TECHNOLOGIES
4.8.7.1.3 RISING DEMAND FOR RESOURCE-EFFICIENT PRODUCTS, MATERIALS, AND INDUSTRIAL SOLUTIONS
4.8.7.1.4 INCREASED INVESTMENT IN RECYCLING TECHNOLOGIES AND CIRCULAR ECONOMY INITIATIVES
4.8.7.1.5 DEVELOPMENT OF ALTERNATIVE RAW MATERIALS AND NEXT-GENERATION INDUSTRIAL PRODUCTS
4.8.7.1.6 GROWING DEMAND DRIVEN BY INFRASTRUCTURE DEVELOPMENT, ENERGY TRANSITION, AND INDUSTRIAL MODERNIZATION
4.9 PRICING ANALYSIS
4.1 TARIFFS & IMPACT ON THE MARKET
4.10.1 CURRENT TARIFF RATE
4.10.2 OUTLOOK: LOCAL PRODUCTION VS IMPORT RELIANCE
4.10.3 VENDOR SELECTION CRITERIA DYNAMICS
4.10.4 IMPACT ON SUPPLY CHAIN
4.10.4.1 RAW MATERIAL PROCUREMENT
4.10.4.2 MANUFACTURING AND PRODUCTION
4.10.4.3 LOGISTICS AND DISTRIBUTION
4.10.4.4 PRICE PITCHING AND POSITION OF MARKET
4.10.5 INDUSTRY PARTICIPANTS: PROACTIVE MOVES
4.10.5.1 SUPPLY CHAIN OPTIMIZATION
4.10.5.2 JOINT VENTURE ESTABLISHMENTS
4.10.6 IMPACT ON PRICES
4.10.7 REGULATORY INCLINATION
4.10.7.1 GEOPOLITICAL SITUATION
4.10.7.2 TRADE PARTNERSHIPS BETWEEN COUNTRIES
4.10.7.2.1 FREE TRADE AGREEMENTS
4.10.7.2.2 ALLIANCES ESTABLISHMENTS
4.10.7.3 STATUS ACCREDITATION (INCLUDING MFN)
4.10.7.4 DOMESTIC COURSE OF CORRECTION
4.10.7.4.1 INCENTIVE SCHEMES TO BOOST PRODUCTION OUTPUTS
4.10.7.4.2 ESTABLISHMENT OF SEZS / INDUSTRIAL PARKS
5 REGULATION COVERAGE
5.1 INTRODUCTION
5.2 PRODUCT CODES
5.3 CERTIFIED STANDARDS
5.4 SAFETY STANDARDS
5.4.1 MATERIAL HANDLING & STORAGE
5.4.2 TRANSPORT & PRECAUTIONS
5.4.3 HAZARD IDENTIFICATION
5.5 CONCLUSION
6 MARKET OVERVIEW
6.1 DRIVERS
6.1.1 GROWING TREND OF JOURNALING, CRAFTING, AND CREATIVE EXPRESSION
6.1.2 INCREASING DEMAND FOR BRANDED CORPORATE GIFTING STATIONERY
6.1.3 RISING ENROLLMENT IN EDUCATIONAL INSTITUTIONS DRIVING DEMAND FOR SCHOOL SUPPLIES
6.2 RESTRAINTS
6.2.1 DECLINING USAGE OF TRADITIONAL PAPER-BASED COMMUNICATION
6.2.2 ENVIRONMENTAL CONCERNS RELATED TO PAPER CONSUMPTION
6.2.3 INCREASING ADOPTION OF DIGITAL NOTE-TAKING AND DOCUMENT MANAGEMENT TOOLS
6.3 OPPORTUNITIES
6.3.1 RISING POPULARITY OF CUSTOMIZED AND MONOGRAMMED STATIONERY
6.3.2 GROWTH OF DIGITAL DETOX AND ANALOG WRITING TRENDS
6.4 CHALLENGES
6.4.1 MAINTAINING PROFITABILITY AMID RISING SUSTAINABILITY REQUIREMENTS
6.4.2 DIFFERENTIATING PRODUCTS IN A HIGHLY SATURATED MARKET
7 U.S. STATIONERY PRODUCTS MARKET, BY PRODUCT TYPE
7.1 OVERVIEW
7.2 U.S. STATIONERY PRODUCTS MARKET, BY PRODUCT TYPE, 2018-2033 (USD THOUSAND)
7.2.1 PAPER PRODUCTS
7.2.2 WRITING INSTRUMENTS
7.2.3 ART & CREATIVE SUPPLIES
7.2.4 DESKTOP & OFFICE ACCESSORIES
7.2.5 FILING, BINDING & DOCUMENT ORGANIZATION PRODUCTS
7.2.6 ADHESIVES, TAPES & CORRECTION PRODUCTS
7.2.7 CALENDARS, DIARIES & PLANNING PRODUCTS
7.2.8 DIGITAL & HYBRID STATIONERY
7.2.9 BUSINESS, PRINTING & PROFESSIONAL STATIONERY
7.2.10 PRESENTATION & COMMUNICATION PRODUCTS
7.2.11 MAILING & PACKAGING STATIONERY
7.2.12 OTHERS
7.3 U.S. PAPER PRODUCTS IN STATIONERY PRODUCTS MARKET, BY TYPE, 2018-2033 (USD THOUSAND)
7.3.1 NOTEBOOKS & WRITING PADS
7.3.2 PRINTING & COPY PAPER
7.3.3 STICKY NOTES & MEMO PRODUCTS
7.3.4 LOOSE PAPER
7.4 U.S. NOTEBOOKS & WRITING PADS IN STATIONERY PRODUCTS MARKET, BY TYPE, 2018-2033 (USD THOUSAND)
7.4.1 SPIRAL NOTEBOOKS
7.4.2 EXERCISE BOOKS
7.4.3 JOURNALS
7.4.4 COMPOSITION BOOKS
7.4.5 MEMO PADS
7.4.6 LEGAL PADS
7.5 U.S. PRINTING & COPY PAPER IN STATIONERY PRODUCTS MARKET, BY TYPE, 2018-2033 (USD THOUSAND)
7.5.1 COPIER PAPER
7.5.2 PRINTER PAPER
7.5.3 SPECIALTY PAPER
7.5.4 RECYCLED PAPER
7.5.5 PHOTO PAPER
7.6 U.S. STICKY NOTES & MEMO PRODUCTS IN STATIONERY PRODUCTS MARKET, BY TYPE, 2018-2033 (USD THOUSAND)
7.6.1 STANDARD STICKY NOTES
7.6.2 PAGE MARKERS
7.6.3 MEMO CUBES
7.7 U.S. LOOSE PAPER IN STATIONERY PRODUCTS MARKET, BY TYPE, 2018-2033 (USD THOUSAND)
7.7.1 COPIER PAPER
7.7.2 PRINTER PAPER
7.7.3 SPECIALTY PAPER
7.7.4 PHOTO PAPER
7.8 U.S. WRITING INSTRUMENTS IN STATIONERY PRODUCTS MARKET, BY TYPE, 2018-2033 (USD THOUSAND)
7.8.1 PENS
7.8.2 PENCILS
7.8.3 MARKERS & HIGHLIGHTERS
7.8.4 REFILLS & INK CARTRIDGES
7.9 U.S. PENS IN STATIONERY PRODUCTS MARKET, BY TYPE, 2018-2033 (USD THOUSAND)
7.9.1 BALLPOINT PENS
7.9.2 GEL PENS
7.9.3 ROLLERBALL PENS
7.9.4 FOUNTAIN PENS
7.9.5 MULTIFUNCTION PENS
7.9.6 REFILLABLE PENS
7.9.7 LUXURY PENS
7.1 U.S. PENCILS IN STATIONERY PRODUCTS MARKET, BY TYPE, 2018-2033 (USD THOUSAND)
7.10.1 GRAPHITE PENCILS
7.10.2 MECHANICAL PENCILS
7.10.3 DRAFTING PENCILS
7.11 U.S. MARKERS & HIGHLIGHTERS IN STATIONERY PRODUCTS MARKET, BY TYPE, 2018-2033 (USD THOUSAND)
7.11.1 PERMANENT MARKERS
7.11.2 HIGHLIGHTERS
7.11.3 WHITEBOARD MARKERS
7.12 U.S. ART & CREATIVE SUPPLIES IN STATIONERY PRODUCTS MARKET, BY TYPE, 2018-2033 (USD THOUSAND)
7.12.1 DRAWING & COLORING SUPPLIES
7.12.2 CRAFT MATERIALS
7.12.3 PAINTING SUPPLIES
7.12.4 CANVAS & PROFESSIONAL ART SUPPLIES
7.13 U.S. DRAWING & COLORING SUPPLIES IN STATIONERY PRODUCTS MARKET, BY TYPE, 2018-2033 (USD THOUSAND)
7.13.1 COLORED PENCILS
7.13.2 SKETCHBOOKS
7.13.3 ART MARKERS
7.13.4 DRAWING PADS
7.13.5 TECHNICAL PENS
7.13.6 PAINT MARKERS
7.13.7 CHARCOAL PENCILS
7.14 U.S. CRAFT MATERIALS IN STATIONERY PRODUCTS MARKET, BY TYPE, 2018-2033 (USD THOUSAND)
7.14.1 COLORED PAPER
7.14.2 CLAY & MODELING COMPOUNDS
7.14.3 FOAM SHEETS
7.14.4 GLITTER PRODUCTS
7.14.5 CRAFT SCISSORS
7.15 U.S. PAINTING SUPPLIES IN STATIONERY PRODUCTS MARKET, BY TYPE, 2018-2033 (USD THOUSAND)
7.15.1 ACRYLIC PAINTS
7.15.2 PAINT BRUSHES
7.15.3 WATERCOLORS
7.15.4 PAINTING ACCESSORIES
7.15.5 OIL PAINTS
7.16 U.S. CANVAS & PROFESSIONAL ART SUPPLIES IN STATIONERY PRODUCTS MARKET, BY TYPE, 2018-2033 (USD THOUSAND)
7.16.1 CANVAS BOARDS
7.16.2 EASELS
7.16.3 PORTFOLIO CASES
7.17 U.S. DESKTOP & OFFICE ACCESSORIES IN STATIONERY PRODUCTS MARKET, BY TYPE, 2018-2033 (USD THOUSAND)
7.17.1 WORKSPACE ORGANIZATION PRODUCTS
7.17.2 OFFICE UTILITY PRODUCTS
7.17.3 FASTENING & CUTTING ACCESSORIES
7.17.4 MEASURING & DRAFTING TOOLS
7.18 U.S. WORKSPACE ORGANIZATION PRODUCTS IN STATIONERY PRODUCTS MARKET, BY TYPE, 2018-2033 (USD THOUSAND)
7.18.1 DESK ORGANIZERS
7.18.2 DRAWER ORGANIZERS
7.18.3 PEN STANDS
7.18.4 DESK CADDIES
7.18.5 LETTER TRAYS
7.19 U.S. OFFICE UTILITY PRODUCTS IN STATIONERY PRODUCTS MARKET, BY TYPE, 2018-2033 (USD THOUSAND)
7.19.1 TAPE DISPENSERS
7.19.2 SEALS & STAMPS
7.2 U.S. FASTENING & CUTTING ACCESSORIES IN STATIONERY PRODUCTS MARKET, BY TYPE, 2018-2033 (USD THOUSAND)
7.20.1 STAPLERS
7.20.2 STAPLES
7.20.3 SCISSORS
7.20.4 PAPER CLIPS
7.20.5 BINDER CLIPS
7.20.6 HOLE PUNCHES
7.20.7 RUBBER BANDS
7.21 U.S. MEASURING & DRAFTING TOOLS IN STATIONERY PRODUCTS MARKET, BY TYPE, 2018-2033 (USD THOUSAND)
7.21.1 RULERS
7.21.2 MEASURING TAPES
7.21.3 SET SQUARES
7.21.4 PROTRACTORS
7.22 U.S. FILING, BINDING & DOCUMENT ORGANIZATION PRODUCTS IN STATIONERY PRODUCTS MARKET, BY TYPE, 2018-2033 (USD THOUSAND)
7.22.1 FILING PRODUCTS
7.22.2 BINDERS
7.22.3 SHEET PROTECTORS & DISPLAY PRODUCTS
7.22.4 EXPANDING FILES
7.22.5 DIVIDERS & INDEXING PRODUCTS
7.22.6 ARCHIVE BOXES
7.22.7 REPORT & PRESENTATION COVERS
7.22.8 BINDING SUPPLIES
7.22.9 BINDER ACCESSORIES
7.23 U.S. FILING PRODUCTS IN STATIONERY PRODUCTS MARKET, BY TYPE, 2018-2033 (USD THOUSAND)
7.23.1 FILE FOLDERS
7.23.2 HANGING FOLDERS
7.23.3 MANILA FOLDERS
7.23.4 POCKET FOLDERS
7.23.5 COLORED FOLDERS
7.23.6 CLASSIFICATION FOLDERS
7.24 U.S. BINDERS IN STATIONERY PRODUCTS MARKET, BY TYPE, 2018-2033 (USD THOUSAND)
7.24.1 RING BINDERS
7.24.2 VIEW BINDERS
7.24.3 PRESENTATION BINDERS
7.24.4 ZIPPER BINDERS
7.24.5 EXPANDING BINDERS
7.24.6 SOFT COVER BINDERS
7.24.7 SPIRAL BINDERS
7.24.8 SPRING BINDERS
7.24.9 PUNCHLESS BINDERS
7.24.10 OTHERS
7.25 U.S. RING BINDERS IN STATIONERY PRODUCTS MARKET, BY TYPE, 2018-2033 (USD THOUSAND)
7.25.1 D-RING
7.25.2 O-RING
7.25.3 SLANT D-RING
7.26 U.S. SHEET PROTECTORS & DISPLAY PRODUCTS IN STATIONERY PRODUCTS MARKET, BY TYPE, 2018-2033 (USD THOUSAND)
7.26.1 CLEAR SHEET PROTECTORS
7.26.2 HEAVY-DUTY SHEET PROTECTORS
7.26.3 TOP-LOADING SHEET PROTECTORS
7.26.4 PRESENTATION SLEEVES
7.26.5 DISPLAY BOOKS
7.26.6 SIDE-LOADING SHEET PROTECTORS
7.26.7 PORTFOLIO BOOKS
7.26.8 DOCUMENT JACKETS
7.26.9 ARCHIVAL-QUALITY SHEET PROTECTORS
7.27 U.S. EXPANDING FILES IN STATIONERY PRODUCTS MARKET, BY TYPE, 2018-2033 (USD THOUSAND)
7.27.1 ACCORDION FILES
7.27.2 EXPANDING WALLETS
7.27.3 PORTABLE FILE CASES
7.28 U.S. DIVIDERS & INDEXING PRODUCTS IN STATIONERY PRODUCTS MARKET, BY TYPE, 2018-2033 (USD THOUSAND)
7.28.1 PLASTIC DIVIDERS
7.28.2 CARDSTOCK DIVIDERS
7.28.3 COLORED DIVIDERS
7.28.4 INDEX TABS
7.28.5 SUBJECT DIVIDERS
7.28.6 REINFORCED DIVIDERS
7.28.7 ADHESIVE TABS
7.28.8 PRINTABLE TABS
7.28.9 ALPHABETICAL DIVIDERS
7.28.10 NUMERIC DIVIDERS
7.29 U.S. ARCHIVE BOXES IN STATIONERY PRODUCTS MARKET, BY TYPE, 2018-2033 (USD THOUSAND)
7.29.1 ARCHIVE BOXES
7.29.2 RECORD BOXES
7.29.3 STORAGE CARTONS
7.29.4 DOCUMENT CASES
7.3 U.S. REPORT & PRESENTATION COVERS IN STATIONERY PRODUCTS MARKET, BY TYPE, 2018-2033 (USD THOUSAND)
7.30.1 PRESENTATION FOLDERS
7.30.2 CLEAR-FRONT REPORT COVERS
7.30.3 PROPOSAL FOLDERS
7.30.4 CONFERENCE FOLDERS
7.30.5 CLIP REPORT COVERS
7.30.6 SLIDING BAR COVERS
7.30.7 THERMAL REPORT COVERS
7.31 U.S. BINDING SUPPLIES IN STATIONERY PRODUCTS MARKET, BY TYPE, 2018-2033 (USD THOUSAND)
7.31.1 COMB BINDING SUPPLIES
7.31.2 WIRE BINDING SUPPLIES
7.31.3 COIL BINDING SUPPLIES
7.31.4 BINDING COVERS
7.31.5 THERMAL BINDING SUPPLIES
7.31.6 BINDING STRIPS
7.32 U.S. BINDER ACCESSORIES IN STATIONERY PRODUCTS MARKET, BY TYPE, 2018-2033 (USD THOUSAND)
7.32.1 BINDER POCKETS
7.32.2 BINDER INSERTS
7.32.3 BINDER LABELS
7.32.4 BINDER SPINES
7.33 U.S. ADHESIVES, TAPES & CORRECTION PRODUCTS IN STATIONERY PRODUCTS MARKET, BY TYPE, 2018-2033 (USD THOUSAND)
7.33.1 TAPES
7.33.2 ADHESIVES
7.33.3 CORRECTION PRODUCTS
7.34 U.S. TAPES IN STATIONERY PRODUCTS MARKET, BY TYPE, 2018-2033 (USD THOUSAND)
7.34.1 PACKING TAPE
7.34.2 TRANSPARENT TAPE
7.34.3 DOUBLE-SIDED TAPE
7.34.4 MASKING TAPE
7.34.5 DECORATIVE TAPE
7.35 U.S. ADHESIVES IN STATIONERY PRODUCTS MARKET, BY TYPE, 2018-2033 (USD THOUSAND)
7.35.1 GLUE STICKS
7.35.2 LIQUID GLUE
7.35.3 CRAFT GLUE
7.35.4 HOT MELT GLUE
7.35.5 SPRAY ADHESIVES
7.36 U.S. CORRECTION PRODUCTS IN STATIONERY PRODUCTS MARKET, BY TYPE, 2018-2033 (USD THOUSAND)
7.36.1 ERASERS
7.36.2 CORRECTION TAPES
7.36.3 CORRECTION FLUID
7.36.4 CORRECTION PENS
7.36.5 INK ERADICATORS
7.37 U.S. CALENDARS, DIARIES & PLANNING PRODUCTS IN STATIONERY PRODUCTS MARKET, BY TYPE, 2018-2033 (USD THOUSAND)
7.37.1 PLANNERS
7.37.2 DIARIES
7.37.3 CALENDARS
7.37.4 ORGANIZERS
7.37.5 TO-DO PADS
7.37.6 GOAL PLANNERS
7.37.7 APPOINTMENT BOOKS
7.37.8 PROJECT PLANNERS
7.38 U.S. DIGITAL & HYBRID STATIONERY IN STATIONERY PRODUCTS MARKET, BY TYPE, 2018-2033 (USD THOUSAND)
7.38.1 HYBRID & REUSABLE PRODUCTS
7.38.2 DIGITAL WRITING PRODUCTS
7.39 U.S. HYBRID & REUSABLE PRODUCTS IN STATIONERY PRODUCTS MARKET, BY TYPE, 2018-2033 (USD THOUSAND)
7.39.1 REUSABLE NOTEBOOKS
7.39.2 CLOUD-SYNC NOTEBOOKS
7.39.3 QR-ENABLED PLANNERS
7.4 U.S. DIGITAL WRITING PRODUCTS IN STATIONERY PRODUCTS MARKET, BY TYPE, 2018-2033 (USD THOUSAND)
7.40.1 STYLUS PENS
7.40.2 WRITING TABLETS
7.40.3 SMART NOTEBOOKS
7.40.4 DIGITAL PLANNERS
7.41 U.S. BUSINESS, PRINTING & PROFESSIONAL STATIONERY IN STATIONERY PRODUCTS MARKET, BY TYPE, 2018-2033 (USD THOUSAND)
7.41.1 BUSINESS STATIONERY
7.41.2 COMMERCIAL PRINTING PRODUCTS
7.41.3 PERSONALIZED STATIONERY
7.41.4 CORPORATE GIFTING KITS
7.41.5 WRITING GIFT SETS
7.42 U.S. BUSINESS STATIONERY IN STATIONERY PRODUCTS MARKET, BY TYPE, 2018-2033 (USD THOUSAND)
7.42.1 BUSINESS CARDS
7.42.2 LETTERHEADS
7.42.3 NOTEPADS
7.42.4 CORPORATE FOLDERS
7.42.5 REGISTERS
7.42.6 INVOICE BOOKS
7.42.7 LOG BOOKS
7.42.8 RECEIPT BOOKS
7.42.9 VISITOR BOOKS
7.43 U.S. COMMERCIAL PRINTING PRODUCTS IN STATIONERY PRODUCTS MARKET, BY TYPE, 2018-2033 (USD THOUSAND)
7.43.1 FLYERS
7.43.2 BROCHURES
7.43.3 PRINTED FORMS
7.43.4 CATALOGS
7.44 U.S. PRESENTATION & COMMUNICATION PRODUCTS IN STATIONERY PRODUCTS MARKET, BY TYPE, 2018-2033 (USD THOUSAND)
7.44.1 PRESENTATION BOARDS
7.44.2 DISPLAY & COMMUNICATION PRODUCTS
7.45 U.S. PRESENTATION BOARDS IN STATIONERY PRODUCTS MARKET, BY TYPE, 2018-2033 (USD THOUSAND)
7.45.1 WHITEBOARDS
7.45.2 NOTICE BOARDS
7.45.3 CORK BOARDS
7.45.4 FLIP CHARTS
7.46 U.S. DISPLAY & COMMUNICATION PRODUCTS IN STATIONERY PRODUCTS MARKET, BY TYPE, 2018-2033 (USD THOUSAND)
7.46.1 SIGN HOLDERS
7.46.2 DISPLAY STANDS
7.46.3 LANYARDS
7.46.4 NAME BADGES
7.47 U.S. MAILING & PACKAGING STATIONERY IN STATIONERY PRODUCTS MARKET, BY TYPE, 2018-2033 (USD THOUSAND)
7.47.1 PACKAGING STATIONERY
7.47.2 MAILING SUPPLIES
7.48 U.S. PACKAGING STATIONERY IN STATIONERY PRODUCTS MARKET, BY TYPE, 2018-2033 (USD THOUSAND)
7.48.1 CORRUGATED BOXES
7.48.2 BUBBLE MAILERS
7.48.3 PACKAGING LABELS
7.48.4 WRAPPING PAPER
7.49 U.S. MAILING SUPPLIES IN STATIONERY PRODUCTS MARKET, BY TYPE, 2018-2033 (USD THOUSAND)
7.49.1 ENVELOPES
7.49.2 ADDRESS LABELS
7.49.3 MAILING TUBES
7.49.4 ADDRESS BOOKS
8 U.S. STATIONERY PRODUCTS MARKET, BY PRICE SEGMENT
8.1 OVERVIEW
8.2 U.S. STATIONERY PRODUCTS MARKET, BY PRICE SEGMENT, 2018-2033 (USD THOUSAND)
8.2.1 ECONOMY
8.2.2 MID-MARKET
8.2.3 PREMIUM
8.2.4 LUXURY
8.3 U.S. ECONOMY IN STATIONERY PRODUCTS MARKET, BY TYPE, 2018-2033 (USD THOUSAND)
8.3.1 MASS-MARKET STATIONERY
8.3.2 LOW-COST PRODUCTS
8.4 U.S. MID-MARKET IN STATIONERY PRODUCTS MARKET, BY TYPE, 2018-2033 (USD THOUSAND)
8.4.1 MAINSTREAM OFFICE SUPPLIES
8.4.2 STANDARD BRANDED PRODUCTS
8.5 U.S. PREMIUM IN STATIONERY PRODUCTS MARKET, BY TYPE, 2018-2033 (USD THOUSAND)
8.5.1 HIGHER-QUALITY MATERIALS
8.5.2 DESIGNER STATIONERY
8.6 U.S. LUXURY IN STATIONERY PRODUCTS MARKET, BY TYPE, 2018-2033 (USD THOUSAND)
8.6.1 EXECUTIVE WRITING INSTRUMENTS
8.6.2 GIFT COLLECTIONS
8.6.3 LUXURY JOURNALS
9 U.S. STATIONERY PRODUCTS MARKET, BY SUSTAINABILITY PROFILE
9.1 OVERVIEW
9.2 U.S. STATIONERY PRODUCTS MARKET, BY SUSTAINABILITY PROFILE, 2018-2033 (USD THOUSAND)
9.2.1 CONVENTIONAL PRODUCTS
9.2.2 RECYCLED CONTENT PRODUCTS
9.2.3 CERTIFIED SUSTAINABLE PRODUCTS
9.2.4 BIO-BASED PRODUCTS
10 U.S. STATIONERY PRODUCTS MARKET, BY END USER
10.1 OVERVIEW
10.2 U.S. STATIONERY PRODUCTS MARKET, BY END USER, 2018-2033 (USD THOUSAND)
10.2.1 CORPORATE & OFFICE SEGMENT
10.2.2 EDUCATION SEGMENT
10.2.3 RETAIL CONSUMERS
10.2.4 HOME OFFICE SEGMENT
10.2.5 CREATIVE & PROFESSIONAL SEGMENT
10.3 U.S. CORPORATE & OFFICE SEGMENT IN STATIONERY PRODUCTS MARKET, BY OFFICE TYPES, 2018-2033 (USD THOUSAND)
10.3.1 LARGE ENTERPRISES
10.3.2 SMES
10.3.3 GOVERNMENT OFFICES
10.4 U.S. CORPORATE & OFFICE SEGMENT IN STATIONERY PRODUCTS MARKET, BY PRODUCT TYPE, 2018-2033 (USD THOUSAND)
10.4.1 PAPER PRODUCTS
10.4.2 WRITING INSTRUMENTS
10.4.3 FILING, BINDING & DOCUMENT ORGANIZATION PRODUCTS
10.4.4 DESKTOP & OFFICE ACCESSORIES
10.4.5 BUSINESS, PRINTING & PROFESSIONAL STATIONERY
10.4.6 ADHESIVES, TAPES & CORRECTION PRODUCTS
10.4.7 MAILING & PACKAGING STATIONERY
10.4.8 PRESENTATION & COMMUNICATION PRODUCTS
10.4.9 CALENDARS, DIARIES & PLANNING PRODUCTS
10.4.10 ART & CREATIVE SUPPLIES
10.4.11 DIGITAL & HYBRID STATIONERY
10.4.12 OTHERS
10.5 U.S. FILING, BINDING & DOCUMENT ORGANIZATION PRODUCTS IN STATIONERY PRODUCTS MARKET, BY TYPE, 2018-2033 (USD THOUSAND)
10.5.1 RING BINDERS
10.5.2 VIEW BINDERS
10.5.3 PRESENTATION BINDERS
10.5.4 EXPANDING BINDERS
10.5.5 ZIPPER BINDERS
10.5.6 SOFT COVER BINDERS
10.5.7 SPIRAL BINDERS
10.5.8 BINDER ACCESSORIES
10.5.9 PUNCHLESS BINDERS
10.5.10 SPRING BINDERS
10.5.11 OTHERS
10.6 U.S. RING BINDERS IN STATIONERY PRODUCTS MARKET, BY TYPE, 2018-2033 (USD THOUSAND)
10.6.1 D-RING
10.6.2 O-RING
10.6.3 SLANT D-RING
10.7 U.S. BINDER ACCESSORIES IN STATIONERY PRODUCTS MARKET, BY TYPE, 2018-2033 (USD THOUSAND)
10.7.1 SHEET PROTECTORS
10.7.2 DIVIDERS
10.8 U.S. FILING, BINDING & DOCUMENT ORGANIZATION PRODUCTS IN STATIONERY PRODUCTS MARKET, BY MATERIAL TYPE, 2018-2033 (USD THOUSAND)
10.8.1 POLYPROPYLENE
10.8.2 VINYL-COATED BOARD
10.8.3 RECYCLED MATERIAL
10.8.4 PAPER BASED
10.8.5 OTHERS
10.9 U.S. FILING, BINDING & DOCUMENT ORGANIZATION PRODUCTS IN STATIONERY PRODUCTS MARKET, BY SIZE, 2018-2033 (USD THOUSAND)
10.9.1 LETTER SIZE
10.9.2 LEGAL SIZE
10.9.3 A4
10.9.4 OTHERS
10.1 U.S. FILING, BINDING & DOCUMENT ORGANIZATION PRODUCTS IN STATIONERY PRODUCTS MARKET, BY PURCHASE CHANNEL, 2018-2033 (USD THOUSAND)
10.10.1 OFFLINE
10.10.2 ONLINE
10.10.3 BOPIS (BUY ONLINE PICKUP IN STORE)
10.11 U.S. OFFLINE IN STATIONERY PRODUCTS MARKET, BY TYPE, 2018-2033 (USD THOUSAND)
10.11.1 OFFICE SUPPLY STORES
10.11.2 SPECIALTY STORES
10.11.3 HYPERMARKET AND SUPERMARKET
10.11.4 OTHERS
10.12 U.S. ONLINE IN STATIONERY PRODUCTS MARKET, BY TYPE, 2018-2033 (USD THOUSAND)
10.12.1 E-COMMERCE
10.12.2 COMPANY OWNED WEBSITE
10.13 U.S. FILING, BINDING & DOCUMENT ORGANIZATION PRODUCTS IN STATIONERY PRODUCTS MARKET, BY END USER, 2018-2033 (USD THOUSAND)
10.13.1 CORPORATE OFFICE
10.13.2 EDUCATION INSTITUTION
10.13.3 GOVERNMENT ORGANIZATION
10.13.4 PERSONAL USE
10.13.5 OTHERS
10.14 U.S. EDUCATION SEGMENT IN STATIONERY PRODUCTS MARKET, BY INSTITUTE TYPE, 2018-2033 (USD THOUSAND)
10.14.1 SCHOOLS
10.14.2 COLLEGES
10.14.3 UNIVERSITIES
10.14.4 COACHING INSTITUTES
10.15 U.S. EDUCATION SEGMENT IN STATIONERY PRODUCTS MARKET, BY PRODUCT TYPE, 2018-2033 (USD THOUSAND)
10.15.1 PAPER PRODUCTS
10.15.2 WRITING INSTRUMENTS
10.15.3 ART & CREATIVE SUPPLIES
10.15.4 DIGITAL & HYBRID STATIONERY
10.15.5 ADHESIVES, TAPES & CORRECTION PRODUCTS
10.15.6 FILING, BINDING & DOCUMENT ORGANIZATION PRODUCTS
10.15.7 DESKTOP & OFFICE ACCESSORIES
10.15.8 PRESENTATION & COMMUNICATION PRODUCTS
10.15.9 CALENDARS, DIARIES & PLANNING PRODUCTS
10.15.10 BUSINESS, PRINTING & PROFESSIONAL STATIONERY
10.15.11 MAILING & PACKAGING STATIONERY
10.15.12 OTHERS
10.16 U.S. RETAIL CONSUMERS IN STATIONERY PRODUCTS MARKET, BY TYPE, 2018-2033 (USD THOUSAND)
10.16.1 PERSONAL STATIONERY USERS
10.16.2 HOBBYISTS
10.16.3 GIFT BUYERS
10.17 U.S. RETAIL CONSUMERS IN STATIONERY PRODUCTS MARKET, BY PRODUCT TYPE, 2018-2033 (USD THOUSAND)
10.17.1 WRITING INSTRUMENTS
10.17.2 PAPER PRODUCTS
10.17.3 ART & CREATIVE SUPPLIES
10.17.4 CALENDARS, DIARIES & PLANNING PRODUCTS
10.17.5 DESKTOP & OFFICE ACCESSORIES
10.17.6 FILING, BINDING & DOCUMENT ORGANIZATION PRODUCTS
10.17.7 ADHESIVES, TAPES & CORRECTION PRODUCTS
10.17.8 BUSINESS, PRINTING & PROFESSIONAL STATIONERY
10.17.9 MAILING & PACKAGING STATIONERY
10.17.10 PRESENTATION & COMMUNICATION PRODUCTS
10.17.11 DIGITAL & HYBRID STATIONERY
10.17.12 OTHERS
10.18 U.S. HOME OFFICE SEGMENT IN STATIONERY PRODUCTS MARKET, BY TYPE, 2018-2033 (USD THOUSAND)
10.18.1 REMOTE WORKERS
10.18.2 FREELANCERS
10.18.3 HOME BUSINESSES
10.19 U.S. HOME OFFICE SEGMENT IN STATIONERY PRODUCTS MARKET, BY PRODUCT TYPE, 2018-2033 (USD THOUSAND)
10.19.1 WRITING INSTRUMENTS
10.19.2 PAPER PRODUCTS
10.19.3 DESKTOP & OFFICE ACCESSORIES
10.19.4 CALENDARS, DIARIES & PLANNING PRODUCTS
10.19.5 FILING, BINDING & DOCUMENT ORGANIZATION PRODUCTS
10.19.6 BUSINESS, PRINTING & PROFESSIONAL STATIONERY
10.19.7 DIGITAL & HYBRID STATIONERY
10.19.8 ADHESIVES, TAPES & CORRECTION PRODUCTS
10.19.9 MAILING & PACKAGING STATIONERY
10.19.10 PRESENTATION & COMMUNICATION PRODUCTS
10.19.11 ART & CREATIVE SUPPLIES
10.19.12 OTHERS
10.2 U.S. CREATIVE & PROFESSIONAL SEGMENT IN STATIONERY PRODUCTS MARKET, BY TYPE, 2018-2033 (USD THOUSAND)
10.20.1 DESIGNERS
10.20.2 ARTISTS
10.20.3 ENGINEERS
10.20.4 ARCHITECTS
10.21 U.S. CREATIVE & PROFESSIONAL SEGMENT IN STATIONERY PRODUCTS MARKET, BY PRODUCT TYPE, 2018-2033 (USD THOUSAND)
10.21.1 ART & CREATIVE SUPPLIES
10.21.2 WRITING INSTRUMENTS
10.21.3 PAPER PRODUCTS
10.21.4 DIGITAL & HYBRID STATIONERY
10.21.5 PRESENTATION & COMMUNICATION PRODUCTS
10.21.6 DESKTOP & OFFICE ACCESSORIES
10.21.7 CALENDARS, DIARIES & PLANNING PRODUCTS
10.21.8 FILING, BINDING & DOCUMENT ORGANIZATION PRODUCTS
10.21.9 BUSINESS, PRINTING & PROFESSIONAL STATIONERY
10.21.10 ADHESIVES, TAPES & CORRECTION PRODUCTS
10.21.11 MAILING & PACKAGING STATIONERY
10.21.12 OTHERS
11 U.S. STATIONERY PRODUCTS MARKET, BY DISTRIBUTION CHANNEL
11.1 OVERVIEW
11.2 U.S. STATIONERY PRODUCTS MARKET, BY DISTRIBUTION CHANNEL, 2018-2033 (USD THOUSAND)
11.2.1 TRADITIONAL RETAIL
11.2.2 MODERN RETAIL
11.2.3 E-COMMERCE
11.2.4 B2B DISTRIBUTION
11.2.5 WHOLESALE DISTRIBUTION
11.3 U.S. TRADITIONAL RETAIL IN STATIONERY PRODUCTS MARKET, BY TYPE, 2018-2033 (USD THOUSAND)
11.3.1 STATIONERY STORES
11.3.2 OFFICE SUPPLY STORES
11.3.3 BOOKSTORES
11.4 U.S. MODERN RETAIL IN STATIONERY PRODUCTS MARKET, BY TYPE, 2018-2033 (USD THOUSAND)
11.4.1 HYPERMARKETS
11.4.2 SUPERMARKETS
11.4.3 DEPARTMENT STORES
11.5 U.S. E-COMMERCE IN STATIONERY PRODUCTS MARKET, BY TYPE, 2018-2033 (USD THOUSAND)
11.5.1 ONLINE MARKETPLACES
11.5.2 DIRECT-TO-CONSUMER WEBSITES
11.6 U.S. B2B DISTRIBUTION IN STATIONERY PRODUCTS MARKET, BY TYPE, 2018-2033 (USD THOUSAND)
11.6.1 CORPORATE PROCUREMENT
11.6.2 INSTITUTIONAL SALES
11.6.3 GOVERNMENT TENDERS
11.7 U.S. WHOLESALE DISTRIBUTION IN STATIONERY PRODUCTS MARKET, BY TYPE, 2018-2033 (USD THOUSAND)
11.7.1 REGIONAL DISTRIBUTORS
11.7.2 CASH-AND-CARRY WHOLESALERS
12 U.S. STATIONERY PRODUCTS MARKET: COMPANY LANDSCAPE
12.1 COMPANY SHARE ANALYSIS: US
13 U.S. STATIONERY PRODUCTS MARKET: COMPANY LANDSCAPE
13.1 COMPANY SHARE ANALYSIS: US
14 SWOT ANALYSIS
15 COMPANY PROFILES GLOBAL
15.1 ZEBRA CO., LTD.
15.1.1 COMPANY SNAPSHOT
15.1.2 PRODUCT PORTFOLIO
15.1.3 RECENT DEVELOPMENT
15.2 FABER-CASTELL AG
15.2.1 COMPANY SNAPSHOT
15.2.2 PRODUCT PORTFOLIO
15.2.3 RECENT UPDATES
15.3 STAEDTLER SE
15.3.1 COMPANY SNAPSHOT
15.3.2 PRODUCT PORTFOLIO
15.3.3 RECENT DEVELOPMENT
15.4 AMERICAN CRAFTS
15.4.1 COMPANY SNAPSHOT
15.4.2 PRODUCT PORTFOLIO
15.4.3 RECENT UPDATE
15.5 BIC
15.5.1 COMPANY SNAPSHOT
15.5.2 REVENUE ANALYSIS
15.5.3 PRODUCT PORTFOLIO
15.5.4 RECENT DEVELOPMENT
15.6 CARAN D'ACHE SA
15.6.1 COMPANY SNAPSHOT
15.6.2 PRODUCT PORTFOLIO
15.6.3 RECENT UPDATES
15.7 CLAIREFONTAINE RHODIA S.A
15.7.1 COMPANY SNAPSHOT
15.7.2 PRODUCT PORTFOLIO
15.7.3 RECENT UPDATES
15.8 HAMELIN GROUP
15.8.1 COMPANY SNAPSHOT
15.8.2 PRODUCT PORTFOLIO
15.8.3 RECENT UPDATES
15.9 HERLITZ PBS AG
15.9.1 COMPANY SNAPSHOT
15.9.2 PRODUCT PORTFOLIO
15.9.3 RECENT UPDATES
15.1 KOKUYO CO., LTD.
15.10.1 COMPANY SNAPSHOT
15.10.2 REVENUE ANALYSIS
15.10.3 PRODUCT PORTFOLIO
15.10.4 RECENT UPDATES
15.11 MAPED GROUP
15.11.1 COMPANY SNAPSHOT
15.11.2 PRODUCT PORTFOLIO
15.11.3 RECENT DEVELOPMENT
15.12 PEN COMPANY OF AMERICA
15.12.1 COMPANY SNAPSHOT
15.12.2 PRODUCT PORTFOLIO
15.12.3 RECENT DEVELOPMENT
15.13 STABILO INTERNATIONAL GMBH
15.13.1 COMPANY SNAPSHOT
15.13.2 PRODUCT PORTFOLIO
15.13.3 RECENT DEVELOPMENT
15.14 TOMBOW USA
15.14.1 COMPANY SNAPSHOT
15.14.2 PRODUCT PORTFOLIO
15.14.3 RECENT DEVELOPMENT
15.15 UNI BRANDS CORPORATION (MITSUBISHI PENCIL CO., LTD.)
15.15.1 COMPANY SNAPSHOT
15.15.2 REVENUE ANALYSIS
15.15.3 PRODUCT PORTFOLIO
15.15.4 RECENT DEVELOPMENT
16 COMPANY PROFILES LOCAL
16.1 NEWELL BRANDS
16.1.1 COMPANY SNAPSHOT
16.1.2 REVENUE ANALYSIS
16.1.3 PRODUCT PORTFOLIO
16.1.4 RECENT UPDATE
16.2 ACCO BRANDS CORPORATION
16.2.1 COMPANY SNAPSHOT
16.2.2 REVENUE ANALYSIS
16.2.3 PRODUCT PORTFOLIO
16.2.4 RECENT DEVELOPMENT
16.3 SMEAD
16.3.1 COMPANY SNAPSHOT
16.3.2 PRODUCT PORTFOLIO
16.3.3 RECENT UPDATE
16.4 TOPS PRODUCTS LLC
16.4.1 COMPANY SNAPSHOT
16.4.2 PRODUCT PORTFOLIO
16.4.3 RECENT DEVELOPMENT
16.5 DIXON TICONDEROGA COMPANY
16.5.1 COMPANY SNAPSHOT
16.5.2 PRODUCT PORTFOLIO
16.5.3 RECENT DEVELOPMENT
16.6 3M CO
16.6.1 COMPANY SNAPSHOT
16.6.2 REVENUE ANALYSIS
16.6.3 PRODUCT PORTFOLIO
16.6.4 RECENT DEVELOPMENT
16.7 APPOINTED, LLC
16.7.1 COMPANY SNAPSHOT
16.7.2 PRODUCT PORTFOLIO
16.7.3 RECENT DEVELOPMENT
16.8 A. T. CROSS COMPANY
16.8.1 COMPANY SNAPSHOT
16.8.2 PRODUCT PORTFOLIO
16.8.3 RECENT DEVELOPMENT
16.9 CHARTPAK, INC.
16.9.1 COMPANY SNAPSHOT
16.9.2 PRODUCT PORTFOLIO
16.9.3 RECENT DEVELOPMENT
16.1 CRANE CO INC.
16.10.1 COMPANY SNAPSHOT
16.10.2 REVENUE ANALYSIS
16.10.3 PRODUCT PORTFOLIO
16.10.4 RECENT DEVELOPMENT
16.11 CRAYOLA LLC
16.11.1 COMPANY SNAPSHOT
16.11.2 PRODUCT PORTFOLIO
16.11.3 RECENT DEVELOPMENT
16.12 ERIN CONDREN
16.12.1 COMPANY SNAPSHOT
16.12.2 PRODUCT PORTFOLIO
16.12.3 RECENT UPDATE
16.13 GENERAL PENCIL COMPANY INC.
16.13.1 COMPANY SNAPSHOT
16.13.2 PRODUCT PORTFOLIO
16.13.3 RECENT UPDATE
16.14 LEVENGER COMPANY
16.14.1 COMPANY SNAPSHOT
16.14.2 PRODUCT PORTFOLIO
16.14.3 RECENT UPDATE
16.15 ROARING SPRING PAPER PRODUCTS
16.15.1 COMPANY SNAPSHOT
16.15.2 PRODUCT PORTFOLIO
16.15.3 RECENT DEVELOPMENT
17 QUESTIONNAIRE
18 RELATED REPORT
List of Table
TABLE 1 U.S. STATIONERY PRODUCTS MARKET, BY PRODUCT TYPE, 2018-2033 (USD THOUSAND)
TABLE 2 U.S. STATIONERY PRODUCTS MARKET, BY PRODUCT TYPE, 2018-2033 (UNITS)
TABLE 3 U.S. PAPER PRODUCTS IN STATIONERY PRODUCTS MARKET, BY TYPE, 2018-2033 (USD THOUSAND)
TABLE 4 U.S. NOTEBOOKS & WRITING PADS IN STATIONERY PRODUCTS MARKET, BY TYPE, 2018-2033 (USD THOUSAND)
TABLE 5 U.S. PRINTING & COPY PAPER IN STATIONERY PRODUCTS MARKET, BY TYPE, 2018-2033 (USD THOUSAND)
TABLE 6 U.S. STICKY NOTES & MEMO PRODUCTS IN STATIONERY PRODUCTS MARKET, BY TYPE, 2018-2033 (USD THOUSAND)
TABLE 7 U.S. LOOSE PAPER IN STATIONERY PRODUCTS MARKET, BY TYPE, 2018-2033 (USD THOUSAND)
TABLE 8 U.S. WRITING INSTRUMENTS IN STATIONERY PRODUCTS MARKET, BY TYPE, 2018-2033 (USD THOUSAND)
TABLE 9 U.S. PENS IN STATIONERY PRODUCTS MARKET, BY TYPE, 2018-2033 (USD THOUSAND)
TABLE 10 U.S. PENCILS IN STATIONERY PRODUCTS MARKET, BY TYPE, 2018-2033 (USD THOUSAND)
TABLE 11 U.S. MARKERS & HIGHLIGHTERS IN STATIONERY PRODUCTS MARKET, BY TYPE, 2018-2033 (USD THOUSAND)
TABLE 12 U.S. ART & CREATIVE SUPPLIES IN STATIONERY PRODUCTS MARKET, BY TYPE, 2018-2033 (USD THOUSAND)
TABLE 13 U.S. DRAWING & COLORING SUPPLIES IN STATIONERY PRODUCTS MARKET, BY TYPE, 2018-2033 (USD THOUSAND)
TABLE 14 U.S. CRAFT MATERIALS IN STATIONERY PRODUCTS MARKET, BY TYPE, 2018-2033 (USD THOUSAND)
TABLE 15 U.S. PAINTING SUPPLIES IN STATIONERY PRODUCTS MARKET, BY TYPE, 2018-2033 (USD THOUSAND)
TABLE 16 U.S. CANVAS & PROFESSIONAL ART SUPPLIES IN STATIONERY PRODUCTS MARKET, BY TYPE, 2018-2033 (USD THOUSAND)
TABLE 17 U.S. DESKTOP & OFFICE ACCESSORIES IN STATIONERY PRODUCTS MARKET, BY TYPE, 2018-2033 (USD THOUSAND)
TABLE 18 U.S. WORKSPACE ORGANIZATION PRODUCTS IN STATIONERY PRODUCTS MARKET, BY TYPE, 2018-2033 (USD THOUSAND)
TABLE 19 U.S. OFFICE UTILITY PRODUCTS IN STATIONERY PRODUCTS MARKET, BY TYPE, 2018-2033 (USD THOUSAND)
TABLE 20 U.S. FASTENING & CUTTING ACCESSORIES IN STATIONERY PRODUCTS MARKET, BY TYPE, 2018-2033 (USD THOUSAND)
TABLE 21 U.S. MEASURING & DRAFTING TOOLS IN STATIONERY PRODUCTS MARKET, BY TYPE, 2018-2033 (USD THOUSAND)
TABLE 22 U.S. FILING, BINDING & DOCUMENT ORGANIZATION PRODUCTS IN STATIONERY PRODUCTS MARKET, BY TYPE, 2018-2033 (USD THOUSAND)
TABLE 23 U.S. FILING PRODUCTS IN STATIONERY PRODUCTS MARKET, BY TYPE, 2018-2033 (USD THOUSAND)
TABLE 24 U.S. BINDERS IN STATIONERY PRODUCTS MARKET, BY TYPE, 2018-2033 (USD THOUSAND)
TABLE 25 U.S. RING BINDERS IN STATIONERY PRODUCTS MARKET, BY TYPE, 2018-2033 (USD THOUSAND)
TABLE 26 U.S. SHEET PROTECTORS & DISPLAY PRODUCTS IN STATIONERY PRODUCTS MARKET, BY TYPE, 2018-2033 (USD THOUSAND)
TABLE 27 U.S. EXPANDING FILES IN STATIONERY PRODUCTS MARKET, BY TYPE, 2018-2033 (USD THOUSAND)
TABLE 28 U.S. DIVIDERS & INDEXING PRODUCTS IN STATIONERY PRODUCTS MARKET, BY TYPE, 2018-2033 (USD THOUSAND)
TABLE 29 U.S. ARCHIVE BOXES IN STATIONERY PRODUCTS MARKET, BY TYPE, 2018-2033 (USD THOUSAND)
TABLE 30 U.S. REPORT & PRESENTATION COVERS IN STATIONERY PRODUCTS MARKET, BY TYPE, 2018-2033 (USD THOUSAND)
TABLE 31 U.S. BINDING SUPPLIES IN STATIONERY PRODUCTS MARKET, BY TYPE, 2018-2033 (USD THOUSAND)
TABLE 32 U.S. BINDER ACCESSORIES IN STATIONERY PRODUCTS MARKET, BY TYPE, 2018-2033 (USD THOUSAND)
TABLE 33 U.S. ADHESIVES, TAPES & CORRECTION PRODUCTS IN STATIONERY PRODUCTS MARKET, BY TYPE, 2018-2033 (USD THOUSAND)
TABLE 34 U.S. TAPES IN STATIONERY PRODUCTS MARKET, BY TYPE, 2018-2033 (USD THOUSAND)
TABLE 35 U.S. ADHESIVES IN STATIONERY PRODUCTS MARKET, BY TYPE, 2018-2033 (USD THOUSAND)
TABLE 36 U.S. CORRECTION PRODUCTS IN STATIONERY PRODUCTS MARKET, BY TYPE, 2018-2033 (USD THOUSAND)
TABLE 37 U.S. CALENDARS, DIARIES & PLANNING PRODUCTS IN STATIONERY PRODUCTS MARKET, BY TYPE, 2018-2033 (USD THOUSAND)
TABLE 38 U.S. DIGITAL & HYBRID STATIONERY IN STATIONERY PRODUCTS MARKET, BY TYPE, 2018-2033 (USD THOUSAND)
TABLE 39 U.S. HYBRID & REUSABLE PRODUCTS IN STATIONERY PRODUCTS MARKET, BY TYPE, 2018-2033 (USD THOUSAND)
TABLE 40 U.S. DIGITAL WRITING PRODUCTS IN STATIONERY PRODUCTS MARKET, BY TYPE, 2018-2033 (USD THOUSAND)
TABLE 41 U.S. BUSINESS, PRINTING & PROFESSIONAL STATIONERY IN STATIONERY PRODUCTS MARKET, BY TYPE, 2018-2033 (USD THOUSAND)
TABLE 42 U.S. BUSINESS STATIONERY IN STATIONERY PRODUCTS MARKET, BY TYPE, 2018-2033 (USD THOUSAND)
TABLE 43 U.S. COMMERCIAL PRINTING PRODUCTS IN STATIONERY PRODUCTS MARKET, BY TYPE, 2018-2033 (USD THOUSAND)
TABLE 44 U.S. PRESENTATION & COMMUNICATION PRODUCTS IN STATIONERY PRODUCTS MARKET, BY TYPE, 2018-2033 (USD THOUSAND)
TABLE 45 U.S. PRESENTATION BOARDS IN STATIONERY PRODUCTS MARKET, BY TYPE, 2018-2033 (USD THOUSAND)
TABLE 46 U.S. DISPLAY & COMMUNICATION PRODUCTS IN STATIONERY PRODUCTS MARKET, BY TYPE, 2018-2033 (USD THOUSAND)
TABLE 47 U.S. MAILING & PACKAGING STATIONERY IN STATIONERY PRODUCTS MARKET, BY TYPE, 2018-2033 (USD THOUSAND)
TABLE 48 U.S. PACKAGING STATIONERY IN STATIONERY PRODUCTS MARKET, BY TYPE, 2018-2033 (USD THOUSAND)
TABLE 49 U.S. MAILING SUPPLIES IN STATIONERY PRODUCTS MARKET, BY TYPE, 2018-2033 (USD THOUSAND)
TABLE 50 U.S. STATIONERY PRODUCTS MARKET, BY PRICE SEGMENT, 2018-2033 (USD THOUSAND)
TABLE 51 U.S. ECONOMY IN STATIONERY PRODUCTS MARKET, BY TYPE, 2018-2033 (USD THOUSAND)
TABLE 52 U.S. MID-MARKET IN STATIONERY PRODUCTS MARKET, BY TYPE, 2018-2033 (USD THOUSAND)
TABLE 53 U.S. PREMIUM IN STATIONERY PRODUCTS MARKET, BY TYPE, 2018-2033 (USD THOUSAND)
TABLE 54 U.S. LUXURY IN STATIONERY PRODUCTS MARKET, BY TYPE, 2018-2033 (USD THOUSAND)
TABLE 55 U.S. STATIONERY PRODUCTS MARKET, BY SUSTAINABILITY PROFILE, 2018-2033 (USD THOUSAND)
TABLE 56 U.S. STATIONERY PRODUCTS MARKET, BY END USER, 2018-2033 (USD THOUSAND)
TABLE 57 U.S. CORPORATE & OFFICE SEGMENT IN STATIONERY PRODUCTS MARKET, BY OFFICE TYPES, 2018-2033 (USD THOUSAND)
TABLE 58 U.S. CORPORATE & OFFICE SEGMENT IN STATIONERY PRODUCTS MARKET, BY PRODUCT TYPE, 2018-2033 (USD THOUSAND)
TABLE 59 U.S. FILING, BINDING & DOCUMENT ORGANIZATION PRODUCTS IN STATIONERY PRODUCTS MARKET, BY TYPE, 2018-2033 (USD THOUSAND)
TABLE 60 U.S. RING BINDERS IN STATIONERY PRODUCTS MARKET, BY TYPE, 2018-2033 (USD THOUSAND)
TABLE 61 U.S. BINDER ACCESSORIES IN STATIONERY PRODUCTS MARKET, BY TYPE, 2018-2033 (USD THOUSAND)
TABLE 62 U.S. FILING, BINDING & DOCUMENT ORGANIZATION PRODUCTS IN STATIONERY PRODUCTS MARKET, BY MATERIAL TYPE, 2018-2033 (USD THOUSAND)
TABLE 63 U.S. FILING, BINDING & DOCUMENT ORGANIZATION PRODUCTS IN STATIONERY PRODUCTS MARKET, BY SIZE, 2018-2033 (USD THOUSAND)
TABLE 64 U.S. FILING, BINDING & DOCUMENT ORGANIZATION PRODUCTS IN STATIONERY PRODUCTS MARKET, BY PURCHASE CHANNEL, 2018-2033 (USD THOUSAND)
TABLE 65 U.S. OFFLINE IN STATIONERY PRODUCTS MARKET, BY TYPE, 2018-2033 (USD THOUSAND)
TABLE 66 U.S. ONLINE IN STATIONERY PRODUCTS MARKET, BY TYPE, 2018-2033 (USD THOUSAND)
TABLE 67 U.S. FILING, BINDING & DOCUMENT ORGANIZATION PRODUCTS IN STATIONERY PRODUCTS MARKET, BY END USER, 2018-2033 (USD THOUSAND)
TABLE 68 U.S. EDUCATION SEGMENT IN STATIONERY PRODUCTS MARKET, BY INSTITUTE TYPE, 2018-2033 (USD THOUSAND)
TABLE 69 U.S. EDUCATION SEGMENT IN STATIONERY PRODUCTS MARKET, BY PRODUCT TYPE, 2018-2033 (USD THOUSAND)
TABLE 70 U.S. RETAIL CONSUMERS IN STATIONERY PRODUCTS MARKET, BY TYPE, 2018-2033 (USD THOUSAND)
TABLE 71 U.S. RETAIL CONSUMERS IN STATIONERY PRODUCTS MARKET, BY PRODUCT TYPE, 2018-2033 (USD THOUSAND)
TABLE 72 U.S. HOME OFFICE SEGMENT IN STATIONERY PRODUCTS MARKET, BY TYPE, 2018-2033 (USD THOUSAND)
TABLE 73 U.S. HOME OFFICE SEGMENT IN STATIONERY PRODUCTS MARKET, BY PRODUCT TYPE, 2018-2033 (USD THOUSAND)
TABLE 74 U.S. CREATIVE & PROFESSIONAL SEGMENT IN STATIONERY PRODUCTS MARKET, BY TYPE, 2018-2033 (USD THOUSAND)
TABLE 75 U.S. CREATIVE & PROFESSIONAL SEGMENT IN STATIONERY PRODUCTS MARKET, BY PRODUCT TYPE, 2018-2033 (USD THOUSAND)
TABLE 76 U.S. STATIONERY PRODUCTS MARKET, BY DISTRIBUTION CHANNEL, 2018-2033 (USD THOUSAND)
TABLE 77 U.S. TRADITIONAL RETAIL IN STATIONERY PRODUCTS MARKET, BY TYPE, 2018-2033 (USD THOUSAND)
TABLE 78 U.S. MODERN RETAIL IN STATIONERY PRODUCTS MARKET, BY TYPE, 2018-2033 (USD THOUSAND)
TABLE 79 U.S. E-COMMERCE IN STATIONERY PRODUCTS MARKET, BY TYPE, 2018-2033 (USD THOUSAND)
TABLE 80 U.S. B2B DISTRIBUTION IN STATIONERY PRODUCTS MARKET, BY TYPE, 2018-2033 (USD THOUSAND)
TABLE 81 U.S. WHOLESALE DISTRIBUTION IN STATIONERY PRODUCTS MARKET, BY TYPE, 2018-2033 (USD THOUSAND)
List of Figure
FIGURE 1 U.S. STATIONARY PRODUCTS MARKET: SEGMENTATION
FIGURE 2 U.S. STATIONARY PRODUCTS MARKET: DATA TRIANGULATION
FIGURE 3 U.S. STATIONARY PRODUCTS MARKET: DRIVERS, RESTRAINS, OPPORTUNITY AND CHALLENGES (DROC) ANALYSIS
FIGURE 4 U.S. STATIONARY PRODUCTS MARKET: GLOBAL VS REGIONAL MARKET ANALYSIS
FIGURE 5 U.S. STATIONARY PRODUCTS MARKET: COMPANY RESEARCH ANALYSIS
FIGURE 6 U.S. STATIONARY PRODUCTS MARKET: MULTIVARIATE MODELLING
FIGURE 7 U.S. STATIONARY PRODUCTS MARKET: INTERVIEW DEMOGRAPHICS
FIGURE 8 U.S. STATIONARY PRODUCTS MARKET: DBMR MARKET POSITION GRID
FIGURE 9 U.S. STATIONARY PRODUCTS MARKET: MARKET END USER COVERAGE GRID
FIGURE 10 U.S. STATIONARY PRODUCTS MARKET: VENDOR SHARE ANALYSIS
FIGURE 11 U.S. STATIONARY PRODUCTS MARKET: SEGMENTATION
FIGURE 12 EXECUTIVE SUMMARY
FIGURE 13 TWELEVE SEGMENTS COMPRISE THE U.S. STATIONARY PRODUCTS MARKET, BY PRODUCT TYPE (2025)
FIGURE 14 STRATEGIC DECISIONS
FIGURE 15 GROWING TREND OF JOURNALING, CRAFTING, AND CREATIVE EXPRESSION IS DRIVING THE U.S. STATIONARY PRODUCTS MARKET FROM 2026 TO 2033
FIGURE 16 PAPER PRODUCTS SEGMENT IS EXPECTED TO ACCOUNT FOR THE LARGEST SHARE OF THE U.S. STATIONARY PRODUCTS MARKET IN 2026 & 2033
FIGURE 17 VALUE CHAIN ANALYSIS
FIGURE 18 DROC ANALYSIS
FIGURE 19 U.S. STATIONERY PRODUCTS MARKET: BY PRODUCT TYPE, 2025 (USD THOUSAND)
FIGURE 20 U.S. STATIONERY PRODUCTS MARKET: BY PRICE SEGMENT, 2025 (USD THOUSAND)
FIGURE 21 U.S. STATIONERY PRODUCTS MARKET: BY SUSTAINABILITY PROFILE, 2025 (USD THOUSAND)
FIGURE 22 U.S. STATIONERY PRODUCTS MARKET: BY END USER, 2025 (USD THOUSAND)
FIGURE 23 U.S. STATIONERY PRODUCTS MARKET: BY DISTRIBUTION CHANNEL, 2025 (USD THOUSAND)
FIGURE 24 U.S. STATIONERY PRODUCTS MARKET SIZE : COMPANY SHARE 2025 (%)
FIGURE 25 U.S. STATIONERY PRODUCTS MARKET SIZE : COMPANY SHARE 2025 (%)

Data collection and base year analysis are done using data collection modules with large sample sizes. The stage includes obtaining market information or related data through various sources and strategies. It includes examining and planning all the data acquired from the past in advance. It likewise envelops the examination of information inconsistencies seen across different information sources. The market data is analysed and estimated using market statistical and coherent models. Also, market share analysis and key trend analysis are the major success factors in the market report. To know more, please request an analyst call or drop down your inquiry.
The key research methodology used by DBMR research team is data triangulation which involves data mining, analysis of the impact of data variables on the market and primary (industry expert) validation. Data models include Vendor Positioning Grid, Market Time Line Analysis, Market Overview and Guide, Company Positioning Grid, Patent Analysis, Pricing Analysis, Company Market Share Analysis, Standards of Measurement, Global versus Regional and Vendor Share Analysis. To know more about the research methodology, drop in an inquiry to speak to our industry experts.
Data Bridge Market Research is a leader in advanced formative research. We take pride in servicing our existing and new customers with data and analysis that match and suits their goal. The report can be customized to include price trend analysis of target brands understanding the market for additional countries (ask for the list of countries), clinical trial results data, literature review, refurbished market and product base analysis. Market analysis of target competitors can be analyzed from technology-based analysis to market portfolio strategies. We can add as many competitors that you require data about in the format and data style you are looking for. Our team of analysts can also provide you data in crude raw excel files pivot tables (Fact book) or can assist you in creating presentations from the data sets available in the report.