Global Corrugated Boxes Market
Marktgröße in Milliarden USD
CAGR :
% 
 USD
148.97 Billion
USD
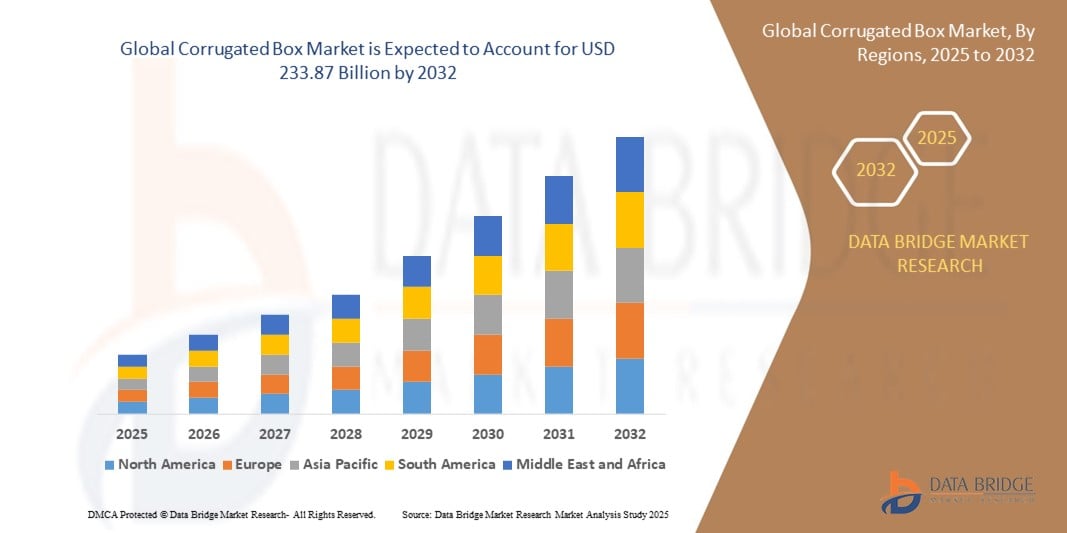
233.87 Billion
2024
2032
USD
148.97 Billion
USD
233.87 Billion
2024
2032
| 2025 –2032 | |
| USD 148.97 Billion | |
| USD 233.87 Billion | |
| % | |
|
Globaler Markt für Wellpappkartons nach Typ (einphasige Wellpappe, einwandige Wellpappe, doppelwellige und dreiwellige Wellpappe), Material (recycelte Wellpappe und Neuwellpappe), Welle (Welle Typ A, Welle Typ B, Welle Typ C, Welle Typ E und Welle Typ F), Stil (Regular Slotted Container (RSC), Full Overlap Container (FOL), Half Slotted Type, Telescope Type, Fold Type und Tray und andere), Druck (Lithografie, Flexodruck, Digitaldruck, Tiefdruck, Siebdruck und andere) und Endverbraucher (Lebensmittel und Getränke, Haushaltsprodukte, Kosmetik, Gesundheitswesen und Pharmazeutika, Körperpflege, Versand und Logistik, Elektronik, Textilien, E-Commerce und andere) – Branchentrends und Prognose bis 2032.
Marktgröße für Wellpappkartons
- Der globale Markt für Wellpappe wurde im Jahr 2024 auf 148,97 Milliarden US-Dollar geschätzt und soll bis 2032 233,87 Milliarden US-Dollar erreichen , bei einer CAGR von 5,80 % im Prognosezeitraum.
- Das Marktwachstum wird vor allem durch den Anstieg des E-Commerce, die steigende Nachfrage nach nachhaltigen Verpackungslösungen und Fortschritte bei Drucktechnologien vorangetrieben, die Branding und Personalisierung verbessern.
- Die steigende Vorliebe der Verbraucher für umweltfreundliche und recycelbare Verpackungen sowie das Wachstum von Branchen wie der Lebensmittel- und Getränkeindustrie, der Elektronikindustrie und der Logistik beschleunigen die Einführung von Wellpappkartons als vielseitige und kostengünstige Verpackungslösung.
Marktanalyse für Wellpappkartons
- Wellpappkartons sind für ihre Haltbarkeit, ihr geringes Gewicht und ihre Recyclingfähigkeit bekannt und stellen aufgrund ihrer Fähigkeit, Produkte während des Transports und der Lagerung zu schützen, eine wichtige Verpackungslösung in verschiedenen Branchen dar, darunter im E-Commerce, in der Lebensmittel- und Getränkeindustrie sowie in der Elektronikindustrie.
- Die steigende Nachfrage nach Wellpappkartons wird durch die rasante Expansion des E-Commerce, das wachsende Umweltbewusstsein und den Bedarf an effizienten, anpassbaren Verpackungslösungen für verschiedene Branchen vorangetrieben.
- Der asiatisch-pazifische Raum dominierte den Markt für Wellpappe mit dem größten Umsatzanteil von 45,12 % im Jahr 2024, angetrieben durch die schnelle Industrialisierung, einen boomenden E-Commerce-Sektor und die Massenproduktion in Ländern wie China und Indien.
- Europa dürfte im Prognosezeitraum die am schnellsten wachsende Region sein, was auf strenge Vorschriften zur Förderung nachhaltiger Verpackungen, die zunehmende Verwendung von Recyclingmaterialien und Fortschritte in der Verpackungstechnologie zurückzuführen ist.
- Das Segment der einwelligen Wellpappkartons dominierte im Jahr 2024 den größten Marktumsatzanteil von 48,2 %, was auf seine weit verbreitete Verwendung im E-Commerce und bei Einzelhandelsverpackungen aufgrund seiner Kosteneffizienz, seines geringen Gewichts und seiner ausreichenden Festigkeit für die meisten Standardanwendungen zurückzuführen ist.
Berichtsumfang und Marktsegmentierung für Wellpappenkartons
|
Eigenschaften |
Wichtige Markteinblicke zu Wellpappkartons |
|
Abgedeckte Segmente |
|
|
Abgedeckte Länder |
Nordamerika
Europa
Asien-Pazifik
Naher Osten und Afrika
Südamerika
|
|
Wichtige Marktteilnehmer |
|
|
Marktchancen |
|
|
Wertschöpfungsdaten-Infosets |
Zusätzlich zu den Einblicken in Marktszenarien wie Marktwert, Wachstumsrate, Segmentierung, geografische Abdeckung und wichtige Akteure enthalten die von Data Bridge Market Research kuratierten Marktberichte auch ausführliche Expertenanalysen, Preisanalysen, Markenanteilsanalysen, Verbraucherumfragen, demografische Analysen, Lieferkettenanalysen, Wertschöpfungskettenanalysen, eine Übersicht über Rohstoffe/Verbrauchsmaterialien, Kriterien für die Lieferantenauswahl, PESTLE-Analysen, Porter-Analysen und regulatorische Rahmenbedingungen. |
Markttrends für Wellpappkartons
„Zunehmende Nutzung nachhaltiger Verpackungen und fortschrittlicher Drucktechnologien“
- Der globale Markt für Wellpappe verzeichnet einen deutlichen Trend zu nachhaltigen Verpackungen, angetrieben durch die wachsende Nachfrage der Verbraucher und der Regulierungsbehörden nach umweltfreundlichen Lösungen.
- Recycelte Wellpappe wird aufgrund ihrer Umweltvorteile und des geringeren Energieverbrauchs im Vergleich zu neuer Wellpappe zunehmend bevorzugt
- Fortschrittliche Drucktechnologien wie Digitaldruck und Flexodruck gewinnen an Bedeutung, da sie hochwertige, anpassbare Branding-Optionen auf Wellpappkartons ermöglichen.
- Diese Technologien ermöglichen präzise Designs, QR-Codes und interaktive Elemente und verbessern so die Kundenbindung und die Rückverfolgbarkeit der Lieferkette.
- Beispielsweise integrieren Unternehmen intelligente Verpackungsfunktionen wie RFID-Tags und fälschungssichere Designs, um den E-Commerce- und hochwertigen Produktsektor zu bedienen.
- Dieser Trend macht Wellpappkartons für Branchen wie E-Commerce, Lebensmittel und Getränke sowie Kosmetik attraktiver und fördert das Marktwachstum
Marktdynamik für Wellpappkartons
Treiber
„Steigende Nachfrage nach E-Commerce und nachhaltigen Verpackungslösungen“
- Der Anstieg des E-Commerce, insbesondere im asiatisch-pazifischen Raum, ist ein wichtiger Treiber für den globalen Wellpappenmarkt. Länder wie China und Indien sind aufgrund der schnellen Urbanisierung und der steigenden Verbraucherausgaben führend.
- Wellpappkartons werden aufgrund ihrer Haltbarkeit, ihres geringen Gewichts und ihrer Recyclingfähigkeit bevorzugt und eignen sich daher ideal für den Versand einer breiten Produktpalette, von Elektronik bis hin zu Frischwaren.
- Regierungsinitiativen wie Plastikverbote in Ländern wie Indien drängen die Industrie in Richtung papierbasierter Verpackungen, was die Nachfrage nach Wellpappkartons weiter erhöht
- Das Wachstum von Branchen wie der Lebensmittel- und Getränkeindustrie, dem Gesundheitswesen und der Elektronikbranche treibt den Bedarf an schützenden und individuell anpassbaren Verpackungslösungen voran
- Große Unternehmen investieren in nachhaltige Innovationen wie recycelbare Kraftliner und Soja-basierte Tinten, um den Verbraucherpräferenzen und gesetzlichen Anforderungen gerecht zu werden.
Einschränkung/Herausforderung
„Hohe Rohstoffkosten und Umweltbedenken“
- Die schwankenden Kosten für Rohstoffe wie Kraftpapier und Wellpappenkarton stellen eine erhebliche Herausforderung für den Wellpappenmarkt dar, bedingt durch Schwankungen der Zellstoffpreise und Unterbrechungen der Lieferkette.
- Die Produktion von Wellpappekartons ist empfindlich gegenüber Umweltfaktoren wie Feuchtigkeit, die die Festigkeit und Qualität von papierbasierten Materialien beeinträchtigen können.
- Umweltbedenken hinsichtlich der Abholzung von Wäldern und des CO2-Fußabdrucks bei der Produktion von Wellpappe führen zu strengeren Vorschriften und drängen die Hersteller zu recycelten Materialien.
- Die Komplexität der Einhaltung unterschiedlicher regionaler Vorschriften zur Recyclingfähigkeit und Abfallbewirtschaftung stellt globale Hersteller vor zusätzliche betriebliche Herausforderungen
- Diese Faktoren können die Produktionskosten erhöhen und das Marktwachstum begrenzen, insbesondere in kostensensiblen Regionen oder dort, wo das Umweltbewusstsein hoch ist.
Marktumfang für Wellpappkartons
Der Markt ist nach Typ, Material, Welle, Stil, Druck und Endbenutzer segmentiert.
- Nach Typ
Der globale Markt für Wellpappkartons ist nach Typ in einwellige, einwellige, doppelwellige und dreiwellige Wellpappe unterteilt. Das Segment der einwelligen Wellpappe hatte im Jahr 2024 mit 48,2 % den größten Marktanteil. Dies ist auf die weit verbreitete Verwendung im E-Commerce und Einzelhandel zurückzuführen, da sie kostengünstig, leicht und für die meisten Standardanwendungen ausreichend robust ist.
Das Segment der Dreifachwandplatten wird voraussichtlich zwischen 2025 und 2032 mit einer Wachstumsrate von 8,7 % die höchste Wachstumsrate aufweisen. Grund dafür ist die steigende Nachfrage nach Hochleistungsverpackungslösungen in Branchen wie der Elektronik-, Automobil- und Schifffahrtsindustrie, in denen verbesserte Haltbarkeit und Schutz entscheidend sind.
- Nach Material
Der globale Markt für Wellpappe ist nach Material in Recyclingwellpappe und Neuware unterteilt. Das Segment Recyclingwellpappe dominierte mit einem Marktanteil von 62,3 % im Jahr 2024, angetrieben durch wachsendes Umweltbewusstsein, Nachhaltigkeitsinitiativen und Kostenvorteile gegenüber Neuware. Vorschriften zur Förderung umweltfreundlicher Verpackungen fördern die Akzeptanz zusätzlich.
Für das Segment der Wellpappe wird zwischen 2025 und 2032 ein deutliches Wachstum erwartet. Der Grund dafür ist die Nachfrage nach hochwertigen Premiumverpackungen in Branchen wie der Kosmetik- und Pharmaindustrie, in denen Produktsicherheit und Ästhetik an erster Stelle stehen.
- Von Flute
Der globale Markt für Wellpappe ist nach Wellenart in die Wellentypen A, B, C, E und F unterteilt. Das Segment C hatte im Jahr 2024 mit 35,8 % den größten Marktanteil. Dies ist auf seine Vielseitigkeit zurückzuführen: Es bietet ein ausgewogenes Verhältnis von Festigkeit und Polsterung und eignet sich daher ideal für eine Vielzahl von Anwendungen, darunter Lebensmittel- und Getränkeverpackungen sowie E-Commerce-Verpackungen.
Das Segment der Wellenart E wird voraussichtlich zwischen 2025 und 2032 das schnellste Wachstum verzeichnen, was auf das dünne Profil und die Eignung für hochwertigen Druck zurückzuführen ist und der steigenden Nachfrage nach kompakten, optisch ansprechenden Verpackungen im Einzelhandel und E-Commerce gerecht wird.
- Nach Stil
Der globale Markt für Wellpappkartons ist nach Stil in Standard-Schlitzkartons (RSC), Vollüberlappungskartons (FOL), Halbschlitzkartons, Teleskopkartons, Faltkartons und Tablettkartons unterteilt. Das Segment der Standard-Schlitzkartons (RSC) hatte im Jahr 2024 mit 50,4 % den größten Marktanteil, was auf seine Einfachheit, Kosteneffizienz und weite Verbreitung in Versand und Logistik verschiedener Branchen zurückzuführen ist.
Das Segment der Teleskoptypen wird Prognosen zufolge zwischen 2025 und 2032 stark wachsen, was auf das anpassbare Design und die Robustheit zurückzuführen ist. Dadurch eignen sie sich ideal für hochwertige Produkte wie Elektronik und Textilien, bei denen eine sichere und maßgeschneiderte Verpackung unerlässlich ist.
- Durch Drucken
Der globale Markt für Wellpappe ist nach Druckverfahren in Lithografie, Flexodruck, Digitaldruck, Tiefdruck, Siebdruck und weitere Verfahren unterteilt. Der Flexodruck hatte im Jahr 2024 mit 44,7 % den größten Marktanteil, was auf seine Kosteneffizienz und die hohen Druckgeschwindigkeiten zurückzuführen ist, die häufig für Großverpackungen in der Lebensmittel- und Getränkebranche sowie im E-Commerce-Bereich eingesetzt werden.
Das Segment Digitaldruck wird voraussichtlich zwischen 2025 und 2032 mit 9,3 % die höchste Wachstumsrate aufweisen. Grund dafür ist die steigende Nachfrage nach individuell angepassten und hochwertig bedruckten Verpackungen, insbesondere in den Bereichen Kosmetik, Körperpflege und E-Commerce, wo Markenbildung und optische Attraktivität von entscheidender Bedeutung sind.
- Nach Endbenutzer
Der globale Markt für Wellpappkartons ist nach Endverbrauchern in die Bereiche Lebensmittel und Getränke, Haushaltsprodukte, Kosmetik, Gesundheit und Pharmazeutika, Körperpflege, Versand und Logistik, Elektronik, Textilien, E-Commerce und andere unterteilt. Das Segment Lebensmittel und Getränke dominierte mit einem Marktanteil von 38,6 % im Jahr 2024, angetrieben durch die hohe Nachfrage nach sicheren, nachhaltigen und kostengünstigen Verpackungslösungen für verderbliche Waren und verzehrfertige Produkte.
Für das E-Commerce-Segment wird von 2025 bis 2032 mit einer Rate von 10,2 % die höchste Wachstumsrate erwartet. Diese wird durch den weltweiten Anstieg des Online-Shoppings, den steigenden Bedarf an langlebigen und leichten Verpackungen sowie die Einführung maßgeschneiderter Verpackungslösungen zur Verbesserung des Kundenerlebnisses vorangetrieben.
Regionale Analyse des Wellpappenmarktes
- Der asiatisch-pazifische Raum dominierte den Markt für Wellpappe mit dem größten Umsatzanteil von 45,12 % im Jahr 2024, angetrieben durch die schnelle Industrialisierung, einen boomenden E-Commerce-Sektor und die Massenproduktion in Ländern wie China und Indien.
- Verbraucher und Industrie bevorzugen Wellpappkartons aufgrund ihrer Haltbarkeit, Umweltfreundlichkeit und Vielseitigkeit als Verpackungslösungen in Branchen wie Lebensmittel und Getränke, Elektronik und E-Commerce.
- Das Marktwachstum wird durch Fortschritte in der Drucktechnologie und die steigende Nachfrage nach nachhaltigen Verpackungslösungen wie recycelter Wellpappe sowie durch die zunehmende Akzeptanz sowohl im Ein- als auch im Doppelwandkartonsegment vorangetrieben.
Einblicke in den US - Wellpappenmarkt
Der US-Wellpappenmarkt wird voraussichtlich deutlich wachsen, angetrieben von der starken Nachfrage aus dem E-Commerce-Sektor und der zunehmenden Präferenz für nachhaltige Verpackungen. Unterstützt wird das Wachstum durch den Einsatz moderner Drucktechniken wie Lithografie und Digitaldruck sowie durch die Verwendung von Recyclingwellpappe. Der regulatorische Schwerpunkt auf umweltfreundliche Verpackungen und die zunehmende Nachfrage nach maßgeschneiderten Verpackungslösungen treiben das Marktwachstum weiter voran.
Einblicke in den europäischen Wellpappenmarkt
Der europäische Markt für Wellpappe wird voraussichtlich das schnellste Wachstum verzeichnen, angetrieben durch strenge Vorschriften zur Förderung nachhaltiger Verpackungen und die steigende Nachfrage nach leichten, langlebigen Verpackungslösungen. Länder wie Deutschland und Großbritannien verzeichnen aufgrund des Wachstums des E-Commerce und der Lebensmittel- und Getränkeindustrie eine deutliche Nachfrage. Die Einführung von Wellen des Typs B und Typ E für verbesserte Festigkeit und Bedruckbarkeit unterstützt das Marktwachstum.
Einblicke in den britischen Wellpappenmarkt
Der britische Markt für Wellpappkartons wird voraussichtlich rasant wachsen, angetrieben vom boomenden E-Commerce-Sektor und der steigenden Nachfrage nach nachhaltigen Verpackungen in der Lebensmittel-, Getränke- und Körperpflegeindustrie. Die Vorliebe für Standard-Faltkartons (RSC) und Faltschachteln, kombiniert mit modernen Drucktechniken wie Flexo- und Digitaldruck, treibt das Marktwachstum voran. Das wachsende Umweltbewusstsein fördert zudem die Verwendung von Recyclingwellpappe.
Markteinblicke für Wellpappekartons in Deutschland
In Deutschland wird ein deutliches Wachstum des Wellpappenmarktes erwartet, was auf die fortschrittliche Fertigungsindustrie und den Fokus auf nachhaltige Verpackungslösungen zurückzuführen ist. Die deutsche Industrie bevorzugt Wellpappe der Typen C und E aufgrund ihrer hohen Festigkeit und ihres geringen Gewichts. Die Verwendung von Doppel- und Dreifachkarton in Premiumverpackungen für die Elektronik- und Automobilindustrie unterstützt ein nachhaltiges Marktwachstum.
Markteinblicke für Wellpappekartons im Asien-Pazifik-Raum
Der asiatisch-pazifische Raum dominiert den globalen Markt für Wellpappe. Begünstigt wird dies durch die expandierende Produktion, die rasante Urbanisierung und den Aufstieg des E-Commerce in Ländern wie China, Indien und Japan. Die steigende Nachfrage nach nachhaltigen Verpackungslösungen, wie beispielsweise recycelter Wellpappe, und Fortschritte in der Drucktechnologie (z. B. Flexo- und Digitaldruck) kurbeln das Marktwachstum an. Staatliche Initiativen zur Förderung umweltfreundlicher Verpackungen tragen zusätzlich zur Akzeptanz bei.
Einblicke in den japanischen Wellpappenmarkt
Der japanische Wellpappenmarkt wird voraussichtlich aufgrund der starken Nachfrage nach hochwertigen, nachhaltigen Verpackungen in der Elektronik- sowie der Lebensmittel- und Getränkebranche ein rasantes Wachstum verzeichnen. Die bevorzugte Verwendung von Wellpappe der Typen B und E, kombiniert mit modernen Drucktechniken wie Tiefdruck und Digitaldruck, treibt die Marktdurchdringung voran. Die Integration von Wellpappe in OEM-Verpackungen und die individuelle Anpassung an den Kundenbedarf unterstützen das Wachstum zusätzlich.
Markteinblicke für Wellpappekartons in China
China hält den größten Anteil am Wellpappenmarkt im asiatisch-pazifischen Raum. Dies ist auf die rasante Urbanisierung, den zunehmenden E-Commerce und die steigende Nachfrage nach nachhaltigen Verpackungslösungen zurückzuführen. Die wachsende Mittelschicht des Landes und der Fokus auf kostengünstige, umweltfreundliche Verpackungen fördern die Einführung von einwelligen und doppelwelligen Kartons. Starke inländische Produktionskapazitäten und wettbewerbsfähige Preise verbessern die Marktzugänglichkeit.
Marktanteil von Wellpappkartons
Die Wellpappkartonindustrie wird hauptsächlich von etablierten Unternehmen geführt, darunter:
- Mondi (Österreich)
- WestRock Company (USA)
- Internationales Papier (USA)
- Stora Enso (Finnland)
- Rengo Co., Ltd. (Japan)
- Klabin SA (Brasilien)
- Cascades Inc. (Kanada)
- Neway Packaging (USA)
- Emenac Packaging (USA)
- Klingele Papierwerke GmbH & Co. KG (Deutschland)
- Smurfit Kappa (Irland)
- DS Smith (Großbritannien)
- Georgia-Pazifik (USA)
- VPK Packaging Group (Belgien)
- Packaging Corporation of America (USA)
Was sind die jüngsten Entwicklungen auf dem globalen Markt für Wellpappkartons?
- Im Oktober 2024 gab die Mondi Gruppe die Übernahme der Wellpappenverarbeitungs- und Vollpappenaktivitäten von Schumacher Packaging in Deutschland, den Benelux-Ländern und Großbritannien bekannt. Dieser strategische Schritt erweitert Mondis Präsenz im Bereich Wellpappenverpackungen in Westeuropa deutlich, erweitert die Kapazität um sieben Quadratmeter und integriert sieben Wellpappenwerke, zwei Vollpappenwerke und vier Verarbeitungsstandorte. Die Übernahme stärkt Mondis Fähigkeit, den E-Commerce- und FMCG-Sektor mit nachhaltigen, faserbasierten Verpackungslösungen zu bedienen. Sie unterstützt zudem Mondis Strategie der vertikalen Integration, der operativen Effizienz und der Innovation im Bereich umweltfreundlicher Verpackungen.
- Im Mai 2024 kooperierte WestRock mit Liberty Coca-Cola Beverages, um ein Multipack-System aus erneuerbaren Kartonringen einzuführen, das herkömmliche Kunststoffringe in Getränkeflaschen ersetzt. Im Mittelpunkt der Zusammenarbeit steht PETCollar™ Shield Plus, ein langlebiger, recycelbarer Kartonträger, der Plastikmüll reduziert und gleichzeitig Produktintegrität und Verbraucherkomfort gewährleistet. Das im Liberty-Werk in Philadelphia installierte System soll jährlich 90.000 Kilogramm Plastik im gesamten bundesstaatlichen Vertriebsnetz einsparen. Diese Initiative unterstreicht das Engagement beider Unternehmen für Nachhaltigkeit und fördert den Wandel hin zu umweltfreundlichen Verpackungslösungen in der Getränkeindustrie.
- Im April 2024 schloss International Paper die Übernahme von 66,3 % des britischen Unternehmens DS Smith im Wert von 7,2 Milliarden US-Dollar ab und schuf damit einen weltweit führenden Anbieter nachhaltiger, faserbasierter Verpackungslösungen. Die Transaktion kombiniert die starke europäische Präsenz von DS Smith mit der nordamerikanischen Dominanz von International Paper und erweitert so die Reichweite des Unternehmens in zwei der attraktivsten Verpackungsmärkte. Die Fusion soll Synergien in Höhe von über 500 Millionen US-Dollar generieren, die vertikale Integration verbessern und Kunden ein breiteres Portfolio an umweltfreundlichen Verpackungsoptionen bieten. Dieser Schritt spiegelt den anhaltenden Konsolidierungstrend in der Verpackungsbranche wider, da Unternehmen nach Größe, Innovation und Nachhaltigkeitsführerschaft streben.
- Im Januar 2024 kündigte die WestRock Company Pläne zum Bau einer hochmodernen Produktionsanlage für Wellpappe in Pleasant Prairie, Wisconsin, mit einer geschätzten Investition von 140 Millionen US-Dollar an. Das neue Werk wird über fortschrittliche Automatisierung, erweiterte digitale Funktionen und auf Nachhaltigkeit ausgerichtete Technologien verfügen, um Energieverbrauch und Produktionsabfälle zu reduzieren. Nach seiner Inbetriebnahme im Jahr 2025 wird es das bestehende Werk des Unternehmens in North Chicago ersetzen und steht im Einklang mit der Strategie von WestRock, den Betrieb zu modernisieren, die Kosteneffizienz zu verbessern und die Kunden in der Region der Großen Seen besser zu bedienen. Dieser Schritt unterstreicht das Engagement des Unternehmens für Innovation und langfristiges Wachstum im Verpackungssektor.
- Im November 2023 ging die Velvin Group, ein führender indischer Hersteller nachhaltiger papierbasierter Verpackungen, ein strategisches Joint Venture mit Rengo Co., Ltd. ein, einem weltweit führenden Hersteller von Wellpappenverpackungen mit Sitz in Japan. Aus der Partnerschaft entstand die Velvin Rengo Containers Private Limited, an der Rengo einen Anteil von 30 % erwarb. Gemeinsam errichten sie eine neue Wellpappenanlage in Cheyyar, Tamil Nadu, strategisch günstig gelegen, um die wachsende Nachfrage nach umweltfreundlichen Wellpappenverpackungen in Indien zu bedienen. Die Inbetriebnahme eines Teilbetriebs der Anlage war für März 2024 geplant und markiert einen bedeutenden Schritt zum Ausbau der Marktreichweite und Innovationsfähigkeit beider Unternehmen.
SKU-
Erhalten Sie Online-Zugriff auf den Bericht zur weltweit ersten Market Intelligence Cloud

- Interaktives Datenanalyse-Dashboard
- Unternehmensanalyse-Dashboard für Chancen mit hohem Wachstumspotenzial
- Zugriff für Research-Analysten für Anpassungen und Abfragen
- Konkurrenzanalyse mit interaktivem Dashboard
- Aktuelle Nachrichten, Updates und Trendanalyse
- Nutzen Sie die Leistungsfähigkeit der Benchmark-Analyse für eine umfassende Konkurrenzverfolgung
Inhaltsverzeichnis
- Einführung
- ZIELE DER STUDIE
- MARKTDEFINITION
- Überblick über den globalen Wellpappenmarkt
- EINSCHRÄNKUNG
- ABGEDECKTE MÄRKTE
- Marktsegmentierung
- ABGEDECKTE MÄRKTE
- Geografischer Umfang
- Jahre, die für die Studie berücksichtigt wurden
- Währung und Preisgestaltung
- DBMR-Dreibeindatenvalidierungsmodell
- MATERIALLEBENSLINIENKURVE
- MULTIVARIATE MODELLIERUNG
- Primärinterviews mit wichtigen Meinungsführern
- DBMR-Marktpositionsraster
- MARKT-ENDBENUTZER-ABDECKUNGSRASTER
- DBMR-MARKT-HERAUSFORDERUNGSMATRIX
- Lieferantenanteilsanalyse
- IMPORT-EXPORT-DATEN
- Sekundärquellen
- Annahmen
- ZUSAMMENFASSUNG
- Premium-Einblicke
- Marktübersicht
- Treiber
- Zunehmende Verwendung von kleinen und mittelgroßen Wellpappkartons in der Lebensmittel- und Getränkeverpackungsindustrie
- Zunehmende Präferenz für recycelte Wellpappeprodukte in der Verpackungsindustrie
- Wachsender E-Commerce und Kurierdienste für die Lieferung von Produkten
- Bewegung der Verpackungsindustrie hin zu Leichtverpackungsmethoden
- Zunehmende Verwendung großer Wellpappkartons in der Versandbranche
- Einschränkungen
- Schwankungen bei den Preisen für Holzzellstoff
- Schäden an verpackten Produkten aufgrund schlechter Wetterbedingungen
- Hohe Wartungskosten für Wellpappenverpackungsmaschinen verringern die Gewinnmargen
- Gelegenheiten
- Steigende Nachfrage nach Fit-to-go-Verpackungen in der Lebensmittelindustrie
- Verbot von Kunststoffverpackungsprodukten auf dem Weltmarkt
- steigende Pandemie-Bedingungen haben die Gewinnmargen für Wellpappe Box erhöht
- Herausforderungen
- Feuchtes und feuchtes Wetter verringert die Festigkeit und Stärke von Wellpappe
- Zunehmender Einsatz umweltfreundlicher Ersatzstoffe in der Verpackungsindustrie
- Auswirkungen von COVID-19 auf den globalen Wellpappenmarkt
- ANALYSE der Auswirkungen von COVID-19 auf den globalen Wellpappenmarkt
- NACHWIRKUNGEN VON COVID-19 UND REGIERUNGSINITIATIVE ZUR BELEBUNG DES WELTWEITEN MARKT FÜR WELLPAPPE
- STRATEGISCHE ENTSCHEIDUNGEN FÜR HERSTELLER NACH COVID-19, UM WETTBEWERBSFÄHIGE MARKTANTEILE ZU GEWINNEN
- AUSWIRKUNGEN AUF DEN PREIS
- AUSWIRKUNGEN AUF DIE NACHFRAGE
- AUSWIRKUNGEN AUF DIE LIEFERKETTE
- ABSCHLUSS
- Globaler Markt für Wellpappe, nach Typ
- Überblick
- Einwandige Wellpappschachtel
- Doppelwandplatte
- Einphasige Wellpappe
- Dreifache Wandplatte
- Globaler Markt für Wellpappekartons, nach Material
- Überblick
- Recycelte Wellpappe
- Virgin Wellpappe
- Globaler Markt für Wellpappe, nach Flute
- Überblick
- Typ C Flöte
- Flöte Typ B
- Typ A Flöte
- Typ E Flöte
- Typ F Flöte
- Globaler Markt für Wellpappekartons, nach Stil
- Überblick
- Normaler Schlitzcontainer (RSC)
- Vollüberlappender Container (Fol)
- Halbgeschlitzter Typ
- Teleskoptyp
- Falzart und Ablage
- Sonstiges
- Globaler Markt für Wellpappekartons, nach Druck
- Überblick
- Lithografie
- Flexo
- Digitaldruck
- Tiefdruck
- Siebdruck
- andere
- Globaler Markt für Wellpappekartons, nach Endverbraucher
- Überblick
- Essen und Getränke
- Essen
- MILCHPRODUKTE
- SPEISEÖL
- ESSIG
- FLÜSSIGE EIER
- SUPPEN & SAUCEN
- ANDERE
- Alkoholfreie Getränke
- TEE & KAFFEE
- ERFRISCHUNGSGETRÄNKE
- AROMATISIERTE GETRÄNKE
- FRUCHTSÄFTE & -KONZENTRATE
- ANDERE
- Alkoholische Getränke
- BIER
- WEIN
- ANDERE
- Nach Lebensmitteln und Getränken, NACH Typ
- EINWALLIGE WELLPAPPENKARTONS
- DOPPELTE WANDPLATTE
- EINPHASIG GEWELLT
- DREIFACH-WANDBOARD
- Gesundheitswesen und Pharma
- Nach GESUNDHEITSWESEN & PHARMAZEUTIKA, NACH Typ
- EINWALLIGE WELLPAPPENKARTONS
- DOPPELTE WANDPLATTE
- EINPHASIG GEWELLT
- DREIFACH-WANDBOARD
- Versand & Logistik
- Nach Versand und Logistik, NACH Typ
- EINWALLIGE WELLPAPPENKARTONS
- DOPPELTE WANDPLATTE
- EINPHASIG GEWELLT
- DREIFACH-WANDBOARD
- E-Commerce
- Nach E-Commerce, NACH Typ
- EINWALLIGE WELLPAPPENKARTONS
- DOPPELTE WANDPLATTE
- EINPHASIG GEWELLT
- DREIFACH-WANDBOARD
- Haushaltsprodukte
- Haushaltsprodukte sind in Haushaltsreiniger, Flüssigseifen und Handwaschmittel, Flüssigwaschmittel und Sonstiges unterteilt
- Haushaltsreiniger
- Flüssigseifen & Handwaschmittel
- Flüssigwaschmittel
- Sonstiges
- Nach Haushaltsprodukten, NACH Typ
- EINWALLIGE WELLPAPPENKARTONS
- DOPPELTE WANDPLATTE
- EINPHASIG GEWELLT
- DREIFACH-WANDBOARD
- Elektronik
- Nach Elektronik, NACH Typ
- EINWALLIGE WELLPAPPENKARTONS
- DOPPELTE WANDPLATTE
- EINPHASIG GEWELLT
- DREIFACH-WANDBOARD
- Kosmetika
- Kosmetika sind in Creme & Lotion, Shampoo, Spülung, Reinigungsmittel und andere unterteilt
- Creme & Lotion
- Shampoo
- Spülung
- Reinigungsmittel
- ANDERE
- Nach KOSMETIK, NACH Typ
- EINWALLIGE WELLPAPPENKARTONS
- DOPPELTE WANDPLATTE
- EINPHASIG GEWELLT
- DREIFACH-WANDBOARD
- Körperpflege
- Nach Körperpflege, NACH Typ
- EINWALLIGE WELLPAPPENKARTONS
- DOPPELTE WANDPLATTE
- EINPHASIG GEWELLT
- DREIFACH-WANDBOARD
- Textil-
- Nach Textil, NACH Typ
- EINWALLIGE WELLPAPPENKARTONS
- DOPPELTE WANDPLATTE
- EINPHASIG GEWELLT
- DREIFACH-WANDBOARD
- ANDERE
- Nach anderen, nach Typ
- EINWALLIGE WELLPAPPENKARTONS
- DOPPELTE WANDPLATTE
- EINPHASIG GEWELLT
- DREIFACH-WANDBOARD
- GLOBALER Markt für Wellpappkartons, NACH GEOGRAFIE
- Überblick
- Nordamerika
- UNS
- KANADA
- Mexiko
- Europa
- Deutschland
- Vereinigtes Königreich
- Frankreich
- Italien
- Spanien
- Niederlande
- Belgien
- Russland
- Truthahn
- Schweiz
- Restliches Europa
- Asien-Pazifik
- China
- Indien
- Japan
- Südkorea
- Australien und Neuseeland
- Indonesien
- Singapur
- Malaysia
- Thailand
- Philippinen
- Restlicher Asien-Pazifik-Raum
- Naher Osten und Afrika
- Vereinigte Arabische Emirate
- SAUDI-ARABIEN
- Südafrika
- Ägypten
- Israel
- Rest des Nahen Ostens und Afrikas
- Südamerika
- BRASILIEN
- ARGENTINIEN
- Restliches Südamerika
- GLOBALER MARKT FÜR WELLPAPPE: UNTERNEHMENSLANDSCHAFT
- Unternehmensaktienanalyse: GLOBAL
- Unternehmensaktienanalyse: Nordamerika
- Unternehmensaktienanalyse: EUROPA
- Unternehmensaktienanalyse: Asien-Pazifik
- Fusionen und Übernahmen
- ERWEITERUNGEN
- neue Produktentwicklungen
- Partnerschaft
- SWOT-Analyse
- Unternehmensprofil
- Internationale Zeitung
- UNTERNEHMENSÜBERSICHT
- Umsatzanalyse
- Unternehmensaktienanalyse
- PRODUKTPORTFOLIO
- LETZTE UPDATES
- Klingele Papierwerke GmbH & Co. KG
- UNTERNEHMENSÜBERSICHT
- Unternehmensaktienanalyse
- PRODUKTPORTFOLIO
- LETZTE UPDATES
- Klabin SA
- UNTERNEHMENSÜBERSICHT
- Unternehmensaktienanalyse
- PRODUKTPORTFOLIO
- JÜNGSTES UPDATE
- VPK Group NV
- UNTERNEHMENSÜBERSICHT
- Unternehmensaktienanalyse
- PRODUKTPORTFOLIO
- LETZTE UPDATES
- WestRock Company
- UNTERNEHMENSÜBERSICHT
- Umsatzanalyse
- Lieferantenanteilsanalyse
- PRODUKTPORTFOLIO
- LETZTE UPDATES
- Industrieentwicklungsgesellschaft sal
- UNTERNEHMENSÜBERSICHT
- PRODUKTPORTFOLIO
- JÜNGSTES UPDATE
- Smurfit Kappa
- UNTERNEHMENSÜBERSICHT
- Umsatzanalyse
- PRODUKTPORTFOLIO
- LETZTE UPDATES
- Arabian Packaging Co LLC
- UNTERNEHMENSÜBERSICHT
- PRODUKTPORTFOLIO
- JÜNGSTES UPDATE
- Nine Dragons Worldwide (China) Investment Group Co., Ltd.
- UNTERNEHMENSÜBERSICHT
- PRODUKTPORTFOLIO
- JÜNGSTES UPDATE
- Western Container Corporation
- UNTERNEHMENSÜBERSICHT
- LEISTUNGSPORTFOLIO
- JÜNGSTES UPDATE
- Neway Verpackung
- UNTERNEHMENSÜBERSICHT
- PRODUKTPORTFOLIO
- JÜNGSTES UPDATE
- Cascades Inc.
- UNTERNEHMENSÜBERSICHT
- Umsatzanalyse
- PRODUKTPORTFOLIO
- JÜNGSTES UPDATE
- DS Smith
- UNTERNEHMENSÜBERSICHT
- Umsatzanalyse
- PRODUKTPORTFOLIO
- LETZTE UPDATES
- EmenacVerpackung
- UNTERNEHMENSÜBERSICHT
- PRODUKTPORTFOLIO
- JÜNGSTES UPDATE
- Georgia-Pazifik
- UNTERNEHMENSÜBERSICHT
- PRODUKTPORTFOLIO
- LETZTE UPDATES
- Mondi
- UNTERNEHMENSÜBERSICHT
- Umsatzanalyse
- PRODUKTPORTFOLIO
- LETZTE UPDATES
- Oji Holdings Corporation
- UNTERNEHMENSÜBERSICHT
- Umsatzanalyse
- PRODUKTPORTFOLIO
- LETZTE UPDATES
- Packaging Corporation of America
- UNTERNEHMENSÜBERSICHT
- Umsatzanalyse
- PRODUKTPORTFOLIO
- JÜNGSTES UPDATE
- Rengo Co., Ltd.
- UNTERNEHMENSÜBERSICHT
- Umsatzanalyse
- PRODUKTPORTFOLIO
- JÜNGSTES UPDATE
- Stora Enso
- UNTERNEHMENSÜBERSICHT
- Umsatzanalyse
- PRODUKTPORTFOLIO
- LETZTE UPDATES
- Wertheimer Box Corp.
- UNTERNEHMENSÜBERSICHT
- PRODUKTPORTFOLIO
- JÜNGSTES UPDATE
- FRAGEBOGEN
- zugehörige Berichte
Tabellenverzeichnis
TABELLE 1 IMPORTDATEN für Kartons, Schachteln und Kisten aus Wellpapier oder Wellpappe; HS-Code – 481910 (in Tausend USD)
TABELLE 2: EXPORTDATEN FÜR KARTONS, SCHACHTELN UND KÄSTEN AUS WELLPAPPE ODER -PAPPE; HS-CODE – 481910 (TAUSEND USD)
TABELLE 3 Kapazität von Wellpappkartons nach Traggewicht (LBS)
TABELLE 4 Zeit, die Müll benötigt, um in der Umwelt zu verrotten (2015)
TABELLE 5: Weltweiter Markt für Wellpappkartons, nach Typ, 2019–2028 (Millionen USD)
TABELLE 6: Weltweiter Markt für Wellpappkartons, nach Typ, 2019–2028 (MILLIONEN EINHEITEN)
TABELLE 7: Globaler Markt für einwellige Wellpappkartons, NACH Regionen, 2019–2028 (Mio. USD)
TABELLE 8: Globaler Markt für einwellige Wellpappkartons, NACH Regionen, 2019–2028 (MILLIONEN EINHEITEN)
TABELLE 9 – Globaler Markt für Doppelwandkartons in Wellpappe, NACH Regionen, 2019–2028 (Mio. USD)
TABELLE 10 Globaler Markt für Doppelwandplatten in Wellpappe, NACH Regionen, 2019–2028 (MILLIONEN EINHEITEN)
TABELLE 11. Globaler Markt für einphasige Wellpappe in Wellpappenschachteln, NACH Regionen, 2019–2028 (Mio. USD)
TABELLE 12 – Globaler Markt für einphasige Wellpappe in Wellpappenschachteln, NACH Regionen, 2019–2028 (MILLIONEN EINHEITEN)
TABELLE 13 Weltweiter Markt für Dreifachkartons in Wellpappe, NACH Regionen, 2019–2028 (Mio. USD)
TABELLE 14 – Globaler Markt für Dreifachwandplatten in Wellpappe, nach Regionen, 2019–2028 (MILLIONEN EINHEITEN)
TABELLE 15: Weltweiter Markt für Wellpappekartons, nach Material, 2019–2028 (in Mio. USD)
TABELLE 16: Globaler Markt für recycelte Wellpappe in Wellpappekartons, nach Regionen, 2019–2028 (Mio. USD)
TABELLE 17: Weltweiter Markt für Wellpappe aus Neuware in Wellpappekartons, nach Regionen, 2019–2028 (Mio. USD)
TABELLE 18 Weltweiter Markt für WELLPAPPKARTONS, NACH FLUORESZIERUNG, 2019–2028 (Mio. USD)
TABELLE 19 – Globaler Markt für Wellpappe Typ C, NACH Regionen, 2019–2028 (Mio. USD)
TABELLE 20: Weltweiter Markt für Wellpappe Typ B, NACH Regionen, 2019–2028 (Mio. USD)
TABELLE 21 – Globaler Markt für Wellpappe Typ A, NACH Regionen, 2019–2028 (Mio. USD)
TABELLE 22. Globaler Markt für Wellpappe Typ E, NACH Regionen, 2019–2028 (Mio. USD)
TABELLE 23. Globaler Markt für Wellpappe Typ F, NACH Regionen, 2019–2028 (Mio. USD)
TABELLE 24 Weltweiter Markt für Wellpappekartons, nach Stil, 2019–2028 (in Mio. USD)
TABELLE 25 Globaler Markt für Standard-Schlitzbehälter (RSC) in Wellpappekartons, NACH Regionen, 2019–2028 (Mio. USD)
TABELLE 26 Globaler Markt für Full Overlap Container (Fol) in WELLPAPPENKARTONS, NACH Regionen, 2019–2028 (Mio. USD)
TABELLE 27 Globaler Markt für Wellpappekartons mit halben Schlitzen, NACH Regionen, 2019–2028 (Mio. USD)
TABELLE 28 Globaler Markt für Teleskoptypen in Wellpappe, NACH Regionen, 2019–2028 (Mio. USD)
TABELLE 29 Globaler Markt für Faltarten und Tabletts im Wellpappenmarkt, NACH Regionen, 2019–2028 (Mio. USD)
TABELLE 30: Sonstige Akteure weltweit auf dem Markt für Wellpappe, NACH Regionen, 2019–2028 (in Mio. USD)
TABELLE 31: Weltweiter Markt für Wellpappekartons, nach Druckverfahren, 2019–2028 (in Mio. USD)
TABELLE 32 Globaler Markt für Lithografie in Wellpappe, NACH Regionen, 2019–2028 (Mio. USD)
TABELLE 33 Weltweiter Flexodruckmarkt für Wellpappe, NACH Regionen, 2019–2028 (Mio. USD)
TABELLE 34 – Globaler Markt für Digitaldruck in Wellpappe, NACH Regionen, 2019–2028 (Mio. USD)
TABELLE 35 – Globaler Markt für Tiefdruck in Wellpappe, nach Regionen, 2019–2028 (Mio. USD)
TABELLE 36: Globaler Markt für Siebdruck in Wellpappe, nach Regionen, 2019–2028 (Mio. USD)
TABELLE 37 Sonstige Akteure weltweit auf dem Markt für Wellpappe, NACH Regionen, 2019–2028 (Mio. USD)
TABELLE 38 Weltweiter Markt für Wellpappekartons, nach Endverbraucher, 2019–2028 (in Mio. USD)
TABELLE 39 Weltweiter Markt für Lebensmittel und Getränke in Wellpappe, NACH Regionen, 2019–2028 (Mio. USD)
TABELLE 40 Weltweiter Markt für Lebensmittel und Getränke in Wellpappe, nach Endverbraucher, 2019–2028 (Mio. USD)
TABELLE 41 Weltweiter Markt für Lebensmittel und Getränke in Wellpappe, nach Lebensmittelendverbraucher, 2019–2028 (Mio. USD)
TABELLE 42 Weltweiter Markt für Lebensmittel und Getränke in Wellpappe, nach Endverbraucher alkoholfreier Getränke, 2019–2028 (Mio. USD)
TABELLE 43 Weltweiter Markt für Lebensmittel und Getränke in Wellpappe, nach Endverbraucher alkoholischer Getränke, 2019–2028 (Mio. USD)
TABELLE 44 Weltweiter Markt für Lebensmittel und Getränke in Wellpappe, nach Typ, 2019–2028 (Mio. USD)
TABELLE 45 Weltweiter Markt für Gesundheitswesen und Pharmazeutika in Wellpappe, nach Regionen, 2019–2028 (Mio. USD)
TABELLE 46 Weltweiter Markt für GESUNDHEITS- UND PHARMAZEUTIKA IN WELLPAPPE, NACH Typ, 2019–2028 (Mio. USD)
TABELLE 47 Weltweiter Markt für Versand und Logistik in Wellpappe, nach Regionen, 2019–2028 (Mio. USD)
TABELLE 48 Globaler Markt für Versand und Logistik in Wellpappe, nach Typ, 2019–2028 (Mio. USD)
TABELLE 49 Weltweiter E-Commerce-Markt für Wellpappe, NACH Regionen, 2019–2028 (Mio. USD)
TABELLE 50 Weltweiter E-Commerce-Markt für Wellpappe, nach Typ, 2019–2028 (Mio. USD)
TABELLE 51 – Globaler Markt für Haushaltsprodukte in Wellpappe, nach Regionen, 2019–2028 (Mio. USD)
TABELLE 52 Weltweiter Markt für Haushaltsprodukte in Wellpappe, nach Endverbraucher von Haushaltsprodukten, 2019–2028 (Mio. USD)
TABELLE 53 Weltweiter Markt für Haushaltsprodukte in Wellpappe, nach Typ, 2019–2028 (Mio. USD)
TABELLE 54 Weltweiter Markt für Elektronik in Wellpappe, NACH Regionen, 2019–2028 (Mio. USD)
TABELLE 55: Globaler Markt für Elektronik in Wellpappe, nach Typ, 2019–2028 (Mio. USD)
TABELLE 56 Weltweiter Markt für Kosmetika in Wellpappe, NACH Regionen, 2019–2028 (Mio. USD)
TABELLE 57 Weltweiter Markt für Kosmetika in Wellpappe, nach Kosmetik-Endverbraucher, 2019–2028 (Mio. USD)
TABELLE 58 Weltweiter Markt für Kosmetika in Wellpappe, nach Typ, 2019–2028 (Mio. USD)
TABELLE 59 Weltweiter Markt für Körperpflegeprodukte in Wellpappe, NACH Regionen, 2019–2028 (Mio. USD)
TABELLE 60 Weltweiter Markt für Körperpflegeprodukte IN WELLPAPPKARTONS, NACH Typ, 2019–2028 (Mio. USD)
TABELLE 61 Weltweiter Markt für Textilien in Wellpappe, NACH Regionen, 2019–2028 (Mio. USD)
TABELLE 62 Weltweiter Markt für Textilien in Wellpappe, nach Typ, 2019–2028 (Mio. USD)
TABELLE 63 Globaler Markt für sonstige Wellpappekartons, NACH Regionen, 2019–2028 (Mio. USD)
TABELLE 64 – Globaler Markt für sonstige Wellpappekartons, nach Typ, 2019–2028 (Mio. USD)
TABELLE 65 GLOBALER Markt für Wellpappkartons, nach Regionen, 2019–2028 (in Mio. USD)
TABELLE 66 Weltweiter Markt für Wellpappkartons, 2019–2028 (Millionen Einheiten)
TABELLE 67: Nordamerikanischer Markt für Wellpappkartons, NACH LAND, 2019–2028 (in Mio. USD)
TABELLE 68 Nordamerikanischer Markt für Wellpappkartons, NACH LAND, 2019–2028 (Millionen Einheiten)
TABELLE 69 Nordamerikanischer Markt für Wellpappkartons, nach Typ, 2019–2028 (in Mio. USD)
TABELLE 70: Nordamerikanischer Markt für Wellpappkartons, nach Typ, 2019–2028 (Millionen Einheiten)
TABELLE 71: Nordamerikanischer Markt für Wellpappkartons, nach Material, 2019–2028 (in Mio. USD)
TABELLE 72: Nordamerikanischer Markt für Wellpappekartons, nach Flöten, 2019–2028 (in Mio. USD)
TABELLE 73 Nordamerikanischer Markt für Wellpappkartons, nach Stil, 2019–2028 (in Mio. USD)
TABELLE 74: Nordamerikanischer Markt für Wellpappkartons, nach Druckverfahren, 2019–2028 (in Mio. USD)
TABELLE 75: Nordamerikanischer Markt für Wellpappkartons, nach Endverbraucher, 2019–2028 (in Mio. USD)
TABELLE 76: Nordamerikanischer Markt für Lebensmittel und Getränke in Wellpappe, nach Endverbraucher, 2019–2028 (in Mio. USD)
TABELLE 77: Nordamerikanischer Markt für Lebensmittel in Wellpappe, nach Lebensmittelendverbraucher, 2019–2028 (in Mio. USD)
TABELLE 78: Nordamerikanischer Markt für alkoholfreie Getränke in Wellpappe, nach Endverbraucher alkoholfreier Getränke, 2019–2028 (in Mio. USD)
TABELLE 79: Nordamerikanischer Markt für alkoholische Getränke in Wellpappe, nach Endverbraucher alkoholischer Getränke, 2019–2028 (in Mio. USD)
TABELLE 80: Nordamerikanischer Markt für Lebensmittel und Getränke in Wellpappe, nach Typ, 2019–2028 (in Mio. USD)
TABELLE 81: Nordamerikanischer Markt für Gesundheitswesen und Pharmazeutika im Wellpappenmarkt, nach Typ, 2019–2028 (in Mio. USD)
TABELLE 82: Versand und Logistik im nordamerikanischen Markt für Wellpappkartons, nach Typ, 2019–2028 (in Mio. USD)
TABELLE 83 Nordamerikanischer E-Commerce-Markt für Wellpappkartons, nach Typ, 2019–2028 (in Mio. USD)
TABELLE 84: Nordamerikanischer Markt für Haushaltsprodukte in Wellpappe, nach Endverbraucher von Haushaltsprodukten, 2019–2028 (in Mio. USD)
TABELLE 85: Nordamerikanischer Markt für Haushaltsprodukte in Wellpappe, nach Typ, 2019–2028 (in Mio. USD)
TABELLE 86 Nordamerikanischer Markt für Elektronik in Wellpappe, nach Typ, 2019–2028 (in Mio. USD)
TABELLE 87 Nordamerikanischer Markt für Kosmetika in Wellpappe, nach Kosmetik-Endverbraucher, 2019–2028 (in Mio. USD)
TABELLE 88 Nordamerikanischer Markt für Kosmetika in Wellpappe, nach Typ, 2019–2028 (in Mio. USD)
TABELLE 89 Nordamerikanischer Markt für Körperpflegeprodukte in Wellpappe, nach Typ, 2019–2028 (in Mio. USD)
TABELLE 90 Nordamerikanischer Markt für Textilien in Wellpappe, nach Typ, 2019–2028 (in Mio. USD)
TABELLE 91: Sonstige Akteure im Wellpappenmarkt in Nordamerika, nach Typ, 2019–2028 (in Mio. USD)
TABELLE 92 – US-Markt für Wellpappkartons, nach Typ, 2019–2028 (in Mio. USD)
TABELLE 93 US-Markt für Wellpappkartons, nach Typ, 2019–2028 (Millionen Einheiten)
TABELLE 94 – US-Markt für Wellpappe, nach Material, 2019–2028 (in Mio. USD)
TABELLE 95 – US-Markt für Wellpappe, nach Wellenart, 2019–2028 (in Mio. USD)
TABELLE 96 – US-Markt für Wellpappkartons, nach Stil, 2019–2028 (in Mio. USD)
TABELLE 97 – US-Markt für Wellpappekartons, nach Druckverfahren, 2019–2028 (in Mio. USD)
TABELLE 98 – US-Markt für Wellpappkartons nach Endverbraucher, 2019–2028 (in Mio. USD)
TABELLE 99 – US-Markt für Lebensmittel und Getränke in Wellpappe, nach Endverbraucher, 2019–2028 (in Mio. USD)
TABELLE 100 – US-Markt für Lebensmittel in Wellpappe, nach Lebensmittelendverbraucher, 2019–2028 (in Mio. USD)
TABELLE 101 – US-Markt für alkoholfreie Getränke in Wellpappe, nach Endverbraucher alkoholfreier Getränke, 2019–2028 (in Mio. USD)
TABELLE 102 – US-Markt für alkoholische Getränke in Wellpappe, nach Endverbraucher alkoholischer Getränke, 2019–2028 (in Mio. USD)
TABELLE 103 – US-Markt für Lebensmittel und Getränke in Wellpappe, nach Typ, 2019–2028 (in Mio. USD)
TABELLE 104 – US-Markt für Gesundheitswesen und Pharmazeutika im Wellpappenmarkt, nach Typ, 2019–2028 (in Mio. USD)
TABELLE 105 – US-Markt für Versand und Logistik im Wellpappkartonmarkt, nach Typ, 2019–2028 (in Mio. USD)
TABELLE 106 – E-Commerce im Wellpappenmarkt in den USA, nach Typ, 2019–2028 (in Mio. USD)
TABELLE 107 – US-Markt für Haushaltsprodukte in Wellpappe, nach Endverbraucher von Haushaltsprodukten, 2019–2028 (in Mio. USD)
TABELLE 108 – US-Markt für Haushaltsprodukte in Wellpappe, nach Typ, 2019–2028 (in Mio. USD)
TABELLE 109 – US-Markt für Elektronik in Wellpappe, nach Typ, 2019–2028 (in Mio. USD)
TABELLE 110 US-Markt für Kosmetika in Wellpappe, nach Kosmetik-Endverbraucher, 2019–2028 (in Mio. USD)
TABELLE 111 – US-Markt für Kosmetika in Wellpappe, nach Typ, 2019–2028 (in Mio. USD)
TABELLE 112 – US-Markt für Körperpflegeprodukte in Wellpappe, nach Typ, 2019–2028 (in Mio. USD)
TABELLE 113 – US-Markt für Textilien in Wellpappe, nach Typ, 2019–2028 (in Mio. USD)
TABELLE 114 Sonstige Anbieter im Wellpappenmarkt in den USA, nach Typ, 2019–2028 (in Mio. USD)
TABELLE 115 – KANADISCHER Markt für Wellpappkartons, nach Typ, 2019–2028 (in Mio. USD)
TABELLE 116 KANADISCHER Markt für Wellpappkartons, nach Typ, 2019–2028 (Millionen Einheiten)
TABELLE 117 – KANADISCHER Markt für Wellpappkartons, nach Material, 2019–2028 (in Mio. USD)
TABELLE 118 KANADISCHER Markt für Wellpappekartons, nach Flöten, 2019–2028 (in Mio. USD)
TABELLE 119 – KANADISCHER Markt für Wellpappkartons, nach Stil, 2019–2028 (in Mio. USD)
TABELLE 120 KANADISCHER Markt für Wellpappkartons, nach Druckverfahren, 2019–2028 (in Mio. USD)
TABELLE 121 – KANADISCHER Markt für Wellpappkartons, nach Endverbraucher, 2019–2028 (in Mio. USD)
TABELLE 122 KANADISCHER Markt für Lebensmittel und Getränke in Wellpappe, nach Endverbraucher, 2019–2028 (in Mio. USD)
TABELLE 123 KANADA – Markt für Lebensmittel in Wellpappe, nach Lebensmittelendverbraucher, 2019–2028 (in Mio. USD)
TABELLE 124 KANADAS Markt für alkoholfreie Getränke in Wellpappe, nach Endverbraucher alkoholfreier Getränke, 2019–2028 (in Mio. USD)
TABELLE 125 – KANADISCHER Markt für alkoholische Getränke in Wellpappe, nach Endverbraucher alkoholischer Getränke, 2019–2028 (in Mio. USD)
TABELLE 126 KANADISCHER Markt für Lebensmittel und Getränke in Wellpappe, nach Typ, 2019–2028 (in Mio. USD)
TABELLE 127 KANADA – Gesundheitswesen und Pharmazeutika im Wellpappenmarkt, nach Typ, 2019–2028 (in Mio. USD)
TABELLE 128 KANADA – Versand und Logistik im Wellpappkartonmarkt, nach Typ, 2019–2028 (in Mio. USD)
TABELLE 129 KANADA E-Commerce im Wellpappenmarkt, nach Typ, 2019–2028 (in Mio. USD)
TABELLE 130 KANADA – Markt für Haushaltsprodukte in Wellpappe, nach Endverbraucher von Haushaltsprodukten, 2019–2028 (in Mio. USD)
TABELLE 131 KANADA – Markt für Haushaltsprodukte in Wellpappe, nach Typ, 2019–2028 (in Mio. USD)
TABELLE 132 KANADA – Markt für Elektronik in Wellpappe, nach Typ, 2019–2028 (in Mio. USD)
TABELLE 133 KANADA – Markt für Kosmetika in Wellpappe, nach Kosmetik-Endverbraucher, 2019–2028 (in Mio. USD)
TABELLE 134 KANADA – Markt für Kosmetika in Wellpappe, nach Typ, 2019–2028 (in Mio. USD)
TABELLE 135 KANADA – Markt für Körperpflegeprodukte in Wellpappe, nach Typ, 2019–2028 (in Mio. USD)
TABELLE 136 KANADA – Markt für Textilien in Wellpappe, nach Typ, 2019–2028 (in Mio. USD)
TABELLE 137 KANADA Sonstige Anbieter im Wellpappenmarkt, nach Typ, 2019–2028 (in Mio. USD)
TABELLE 138: Mexikanischer Markt für Wellpappkartons, nach Typ, 2019–2028 (in Mio. USD)
TABELLE 139 – Mexikanischer Markt für Wellpappkartons, nach Typ, 2019–2028 (Millionen Einheiten)
TABELLE 140: Mexikanischer Markt für Wellpappkartons, nach Material, 2019–2028 (in Mio. USD)
TABELLE 141: Mexikanischer Markt für Wellpappekartons, nach Flöten, 2019–2028 (in Mio. USD)
TABELLE 142: Mexikanischer Markt für Wellpappkartons, nach Stil, 2019–2028 (in Mio. USD)
TABELLE 143: Mexikanischer Markt für Wellpappkartons, nach Druckverfahren, 2019–2028 (in Mio. USD)
TABELLE 144: Mexikanischer Markt für Wellpappkartons, nach Endverbraucher, 2019–2028 (in Mio. USD)
TABELLE 145 – Mexikanischer Markt für Lebensmittel und Getränke in Wellpappe, nach Endverbraucher, 2019–2028 (in Mio. USD)
TABELLE 146 – Mexikanischer Markt für Lebensmittel in Wellpappe, nach Lebensmittelendverbraucher, 2019–2028 (in Mio. USD)
TABELLE 147 – Markt für alkoholfreie Getränke in Wellpappe in Mexiko, nach Endverbrauchern alkoholfreier Getränke, 2019–2028 (in Mio. USD)
TABELLE 148 – Mexikanischer Markt für alkoholische Getränke in Wellpappe, nach Endverbraucher alkoholischer Getränke, 2019–2028 (in Mio. USD)
TABELLE 149 – Mexikanischer Markt für Lebensmittel und Getränke in Wellpappe, nach Typ, 2019–2028 (in Mio. USD)
TABELLE 150: Mexiko – Markt für Gesundheitswesen und Pharmazeutika im Wellpappenkarton, nach Typ, 2019–2028 (in Mio. USD)
TABELLE 151: Versand und Logistik im mexikanischen Markt für Wellpappkartons, nach Typ, 2019–2028 (in Mio. USD)
TABELLE 152 E-Commerce im mexikanischen Markt für Wellpappkartons, nach Typ, 2019–2028 (in Mio. USD)
TABELLE 153: Mexikanischer Markt für Haushaltsprodukte in Wellpappe, nach Endverbraucher von Haushaltsprodukten, 2019–2028 (in Mio. USD)
TABELLE 154: Mexikanischer Markt für Haushaltsprodukte in Wellpappe, nach Typ, 2019–2028 (in Mio. USD)
TABELLE 155 – Mexikanischer Markt für Elektronik in Wellpappe, nach Typ, 2019–2028 (in Mio. USD)
TABELLE 156: Mexiko – Markt für Kosmetika in Wellpappe, nach Kosmetik-Endverbraucher, 2019–2028 (in Mio. USD)
TABELLE 157: Mexiko – Markt für Kosmetika in Wellpappe, nach Typ, 2019–2028 (in Mio. USD)
TABELLE 158 – Mexiko: Markt für Körperpflegeprodukte in Wellpappe, nach Typ, 2019–2028 (in Mio. USD)
TABELLE 159 – Mexiko: Markt für Textilien in Wellpappe, nach Typ, 2019–2028 (in Mio. USD)
TABELLE 160 Sonstige Akteure im mexikanischen Wellpappkartonmarkt, nach Typ, 2019–2028 (in Mio. USD)
TABELLE 161 Europäischer Markt für Wellpappkartons, NACH LAND, 2019–2028 (in Mio. USD)
TABELLE 162 Europäischer Markt für Wellpappkartons, NACH LÄNDERN, 2019–2028 (Millionen Einheiten)
TABELLE 163 Europäischer Markt für Wellpappkartons, nach Typ, 2019–2028 (in Mio. USD)
TABELLE 164 – Europäischer Markt für Wellpappkartons, nach Typ, 2019–2028 (Millionen Einheiten)
TABELLE 165: Europäischer Markt für Wellpappkartons, nach Material, 2019–2028 (in Mio. USD)
TABELLE 166 Europäischer Markt für Wellpappekartons, nach Flöten, 2019–2028 (in Mio. USD)
TABELLE 167 Europäischer Markt für Wellpappkartons, nach Stil, 2019–2028 (in Mio. USD)
TABELLE 168 Europäischer Markt für Wellpappekartons, nach Druckverfahren, 2019–2028 (in Mio. USD)
TABELLE 169 Europäischer Markt für Wellpappkartons, nach Endverbraucher, 2019–2028 (in Mio. USD)
TABELLE 170 – Europäischer Markt für Lebensmittel und Getränke in Wellpappe, nach Endverbraucher, 2019–2028 (in Mio. USD)
TABELLE 171 – Europäischer Markt für Lebensmittel in Wellpappe, nach Lebensmittelendverbraucher, 2019–2028 (in Mio. USD)
TABELLE 172 – Europäischer Markt für alkoholfreie Getränke in Wellpappe, nach Endverbraucher alkoholfreier Getränke, 2019–2028 (in Mio. USD)
TABELLE 173 – Europäischer Markt für alkoholische Getränke in Wellpappe, nach Endverbraucher alkoholischer Getränke, 2019–2028 (in Mio. USD)
TABELLE 174 – Europäischer Markt für Lebensmittel und Getränke in Wellpappe, nach Typ, 2019–2028 (in Mio. USD)
TABELLE 175 – Europäischer Markt für Gesundheitswesen und Pharmazeutika im Wellpappenmarkt, nach Typ, 2019–2028 (in Mio. USD)
TABELLE 176 – Europäischer Markt für Versand und Logistik im Wellpappkartonmarkt, nach Typ, 2019–2028 (in Mio. USD)
TABELLE 177 – Europäischer E-Commerce-Markt für Wellpappe, nach Typ, 2019–2028 (in Mio. USD)
TABELLE 178 – Europäischer Markt für Haushaltsprodukte in Wellpappe, nach Endverbraucher von Haushaltsprodukten, 2019–2028 (in Mio. USD)
TABELLE 179 – Europäischer Markt für Haushaltsprodukte in Wellpappe, nach Typ, 2019–2028 (in Mio. USD)
TABELLE 180 – Europäischer Markt für Elektronik in Wellpappe, nach Typ, 2019–2028 (in Mio. USD)
TABELLE 181 – Europäischer Markt für Kosmetika in Wellpappe, nach Kosmetik-Endverbraucher, 2019–2028 (in Mio. USD)
TABELLE 182 – Europäischer Markt für Kosmetika in Wellpappe, nach Typ, 2019–2028 (in Mio. USD)
TABELLE 183 Europäischer Markt für Körperpflegeprodukte in Wellpappe, nach Typ, 2019–2028 (in Mio. USD)
TABELLE 184 – Europäischer Markt für Textilien in Wellpappe, nach Typ, 2019–2028 (in Mio. USD)
TABELLE 185: Sonstige Akteure im europäischen Wellpappenmarkt, nach Typ, 2019–2028 (in Mio. USD)
TABELLE 186 Deutscher Markt für Wellpappkartons, nach Typ, 2019–2028 (in Mio. USD)
TABELLE 187 Deutscher Markt für Wellpappkartons, nach Typ, 2019–2028 (Millionen Einheiten)
TABELLE 188 Deutscher Markt für Wellpappkartons, nach Material, 2019–2028 (in Mio. USD)
TABELLE 189 Deutscher Markt für Wellpappekartons, nach Flöten, 2019–2028 (in Mio. USD)
TABELLE 190 Deutscher Markt für Wellpappkartons, nach Stil, 2019–2028 (in Mio. USD)
TABELLE 191 Deutscher Markt für Wellpappkartons, nach Druckverfahren, 2019–2028 (in Mio. USD)
TABELLE 192 Deutscher Markt für Wellpappkartons, nach Endverbraucher, 2019–2028 (in Mio. USD)
TABELLE 193 Deutscher Markt für Lebensmittel und Getränke in Wellpappe, nach Endverbraucher, 2019–2028 (in Mio. USD)
TABELLE 194 Deutscher Markt für Lebensmittel in Wellpappe, nach Lebensmittelendverbraucher, 2019–2028 (in Mio. USD)
TABELLE 195: Deutscher Markt für alkoholfreie Getränke in Wellpappe, nach Endverbraucher alkoholfreier Getränke, 2019–2028 (in Mio. USD)
TABELLE 196 Deutscher Markt für alkoholische Getränke in Wellpappe, nach Endverbraucher alkoholischer Getränke, 2019–2028 (in Mio. USD)
TABELLE 197 Deutscher Markt für Lebensmittel und Getränke in Wellpappe, nach Typ, 2019–2028 (in Mio. USD)
TABELLE 198: Deutscher Markt für Gesundheitswesen und Pharmazeutika im Wellpappenmarkt, nach Typ, 2019–2028 (in Mio. USD)
TABELLE 199 Deutschland: Versand und Logistik im Wellpappkartonmarkt, nach Typ, 2019–2028 (in Mio. USD)
TABELLE 200: E-Commerce im Wellpappkartonmarkt in Deutschland, nach Typ, 2019–2028 (in Mio. USD)
TABELLE 201 Deutscher Markt für Haushaltsprodukte in Wellpappe, nach Endverbraucher von Haushaltsprodukten, 2019–2028 (in Mio. USD)
TABELLE 202 Deutscher Markt für Haushaltsprodukte in Wellpappe, nach Typ, 2019–2028 (in Mio. USD)
TABELLE 203 Deutscher Markt für Elektronik in Wellpappe, nach Typ, 2019–2028 (in Mio. USD)
TABELLE 204 Deutscher Markt für Kosmetika in Wellpappe, nach Kosmetik-Endverbraucher, 2019–2028 (in Mio. USD)
TABELLE 205 Deutscher Markt für Kosmetika in Wellpappe, nach Typ, 2019–2028 (in Mio. USD)
TABELLE 206 Deutscher Markt für Körperpflegeprodukte in Wellpappe, nach Typ, 2019–2028 (in Mio. USD)
TABELLE 207 Deutscher Markt für Textilien in Wellpappe, nach Typ, 2019–2028 (in Mio. USD)
TABELLE 208 Sonstige Anbieter im deutschen Wellpappkartonmarkt, nach Typ, 2019–2028 (in Mio. USD)
TABELLE 209 Britischer Markt für Wellpappkartons, nach Typ, 2019–2028 (in Mio. USD)
TABELLE 210 – Britischer Markt für Wellpappkartons, nach Typ, 2019–2028 (Millionen Einheiten)
TABELLE 211 Britischer Markt für Wellpappkartons, nach Material, 2019–2028 (in Mio. USD)
TABELLE 212 – Britischer Markt für Wellpappekartons, nach Flöten, 2019–2028 (in Mio. USD)
TABELLE 213 Britischer Markt für Wellpappkartons, nach Stil, 2019–2028 (in Mio. USD)
TABELLE 214 Britischer Markt für Wellpappkartons, nach Druckverfahren, 2019–2028 (in Mio. USD)
TABELLE 215: Britischer Markt für Wellpappkartons, nach Endverbraucher, 2019–2028 (in Mio. USD)
TABELLE 216 – Britischer Markt für Lebensmittel und Getränke in Wellpappe, nach Endverbraucher, 2019–2028 (in Mio. USD)
TABELLE 217 – Britischer Markt für Lebensmittel in Wellpappe, nach Lebensmittelendverbraucher, 2019–2028 (in Mio. USD)
TABELLE 218 – Britischer Markt für alkoholfreie Getränke in Wellpappe, nach Endverbrauchern alkoholfreier Getränke, 2019–2028 (in Mio. USD)
TABELLE 219 Britischer Markt für alkoholische Getränke in Wellpappe, nach Endverbraucher alkoholischer Getränke, 2019–2028 (in Mio. USD)
TABELLE 220 – Britischer Markt für Lebensmittel und Getränke in Wellpappe, nach Typ, 2019–2028 (in Mio. USD)
TABELLE 221 – Britischer Markt für Gesundheitswesen und Pharmazeutika im Wellpappenmarkt, nach Typ, 2019–2028 (in Mio. USD)
TABELLE 222 – Versand und Logistik im britischen Markt für Wellpappkartons, nach Typ, 2019–2028 (in Mio. USD)
TABELLE 223 E-Commerce im britischen Markt für Wellpappe, nach Typ, 2019–2028 (in Mio. USD)
TABELLE 224 – Britischer Markt für Haushaltsprodukte in Wellpappe, nach Endverbraucher von Haushaltsprodukten, 2019–2028 (in Mio. USD)
TABELLE 225 – Britischer Markt für Haushaltsprodukte in Wellpappe, nach Typ, 2019–2028 (in Mio. USD)
TABELLE 226 – Britischer Markt für Elektronik in Wellpappe, nach Typ, 2019–2028 (in Mio. USD)
TABELLE 227 – Britischer Markt für Kosmetika in Wellpappe, nach Kosmetik-Endverbraucher, 2019–2028 (in Mio. USD)
TABELLE 228 – Britischer Markt für Kosmetika in Wellpappe, nach Typ, 2019–2028 (in Mio. USD)
TABELLE 229 – Britischer Markt für Körperpflegeprodukte in Wellpappe, nach Typ, 2019–2028 (in Mio. USD)
TABELLE 230 – Britischer Markt für Textilien in Wellpappe, nach Typ, 2019–2028 (in Mio. USD)
TABELLE 231 Sonstige Anbieter im britischen Wellpappenmarkt, nach Typ, 2019–2028 (in Mio. USD)
TABELLE 232: Französischer Markt für Wellpappkartons, nach Typ, 2019–2028 (in Mio. USD)
TABELLE 233: Französischer Markt für Wellpappkartons, nach Typ, 2019–2028 (Millionen Einheiten)
TABELLE 234: Französischer Markt für Wellpappkartons, nach Material, 2019–2028 (in Mio. USD)
TABELLE 235: Französischer Markt für Wellpappekartons, nach Flöten, 2019–2028 (in Mio. USD)
TABELLE 236: Französischer Markt für Wellpappkartons, nach Stil, 2019–2028 (in Mio. USD)
TABELLE 237: Französischer Markt für Wellpappekartons, nach Druckverfahren, 2019–2028 (in Mio. USD)
TABELLE 238: Französischer Markt für Wellpappkartons, nach Endverbraucher, 2019–2028 (in Mio. USD)
TABELLE 239 – Französischer Markt für Lebensmittel und Getränke in Wellpappe, nach Endverbraucher, 2019–2028 (in Mio. USD)
TABELLE 240: Französischer Markt für Lebensmittel in Wellpappe, nach Lebensmittelendverbraucher, 2019–2028 (in Mio. USD)
TABELLE 241 – Markt für alkoholfreie Getränke in Wellpappe in Frankreich, nach Endverbrauchern alkoholfreier Getränke, 2019–2028 (in Mio. USD)
TABELLE 242 Französischer Markt für alkoholische Getränke in Wellpappe, nach Endverbraucher alkoholischer Getränke, 2019–2028 (in Mio. USD)
TABELLE 243 – Französischer Markt für Lebensmittel und Getränke in Wellpappe, nach Typ, 2019–2028 (in Mio. USD)
TABELLE 244: Französischer Markt für Gesundheitswesen und Pharmazeutika im Wellpappenmarkt, nach Typ, 2019–2028 (in Mio. USD)
TABELLE 245: Versand und Logistik im französischen Markt für Wellpappkartons, nach Typ, 2019–2028 (in Mio. USD)
TABELLE 246: E-Commerce im französischen Markt für Wellpappe, nach Typ, 2019–2028 (in Mio. USD)
TABELLE 247: Französischer Markt für Haushaltsprodukte in Wellpappe, nach Endverbraucher von Haushaltsprodukten, 2019–2028 (in Mio. USD)
TABELLE 248: Französischer Markt für Haushaltsprodukte in Wellpappe, nach Typ, 2019–2028 (in Mio. USD)
TABELLE 249 – Französischer Markt für Elektronik in Wellpappe, nach Typ, 2019–2028 (in Mio. USD)
TABELLE 250: Markt für Kosmetika in Wellpappe in Frankreich, nach Kosmetik-Endverbraucher, 2019–2028 (in Mio. USD)
TABELLE 251: Markt für Kosmetika in Wellpappe in Frankreich, nach Typ, 2019–2028 (in Mio. USD)
TABELLE 252: Französischer Markt für Körperpflegeprodukte in Wellpappe, nach Typ, 2019–2028 (in Mio. USD)
TABELLE 253 – Französischer Markt für Textilien in Wellpappe, nach Typ, 2019–2028 (in Mio. USD)
TABELLE 254: Sonstige Akteure auf dem französischen Markt für Wellpappkartons, nach Typ, 2019–2028 (in Mio. USD)
TABELLE 255: Italienischer Markt für Wellpappkartons, nach Typ, 2019–2028 (in Mio. USD)
TABELLE 256: Italienischer Markt für Wellpappkartons, nach Typ, 2019–2028 (Millionen Einheiten)
TABELLE 257: Italienischer Markt für Wellpappkartons, nach Material, 2019–2028 (in Mio. USD)
TABELLE 258 Italienischer Markt für Wellpappekartons, nach Flöten, 2019–2028 (in Mio. USD)
TABELLE 259 Italienischer Markt für Wellpappkartons, nach Stil, 2019–2028 (in Mio. USD)
TABELLE 260 Italienischer Markt für Wellpappkartons, nach Druckverfahren, 2019–2028 (in Mio. USD)
TABELLE 261: Italienischer Markt für Wellpappkartons, nach Endverbraucher, 2019–2028 (in Mio. USD)
TABELLE 262 Italienischer Markt für Lebensmittel und Getränke in Wellpappe, nach Endverbraucher, 2019–2028 (in Mio. USD)
TABELLE 263 Italienischer Markt für Lebensmittel in Wellpappe, nach Lebensmittelendverbraucher, 2019–2028 (in Mio. USD)
TABELLE 264: Italienischer Markt für alkoholfreie Getränke in Wellpappe, nach Endverbraucher alkoholfreier Getränke, 2019–2028 (in Mio. USD)
TABELLE 265 – Italienischer Markt für alkoholische Getränke in Wellpappe, nach Endverbraucher alkoholischer Getränke, 2019–2028 (in Mio. USD)
TABELLE 266 – Italienischer Markt für Lebensmittel und Getränke in Wellpappe, nach Typ, 2019–2028 (in Mio. USD)
TABELLE 267: Italienischer Markt für Gesundheitswesen und Pharmazeutika im Wellpappenmarkt, nach Typ, 2019–2028 (in Mio. USD)
TABELLE 268: Versand und Logistik in Italien auf dem Markt für Wellpappkartons, nach Typ, 2019–2028 (in Mio. USD)
TABELLE 269: Italienischer E-Commerce-Markt für Wellpappkartons, nach Typ, 2019–2028 (in Mio. USD)
TABELLE 270 Italienischer Markt für Haushaltsprodukte im Wellpappkarton, nach Endverbraucher von Haushaltsprodukten, 2019–2028 (in Mio. USD)
TABELLE 271 – Italienischer Markt für Haushaltsprodukte in Wellpappe, nach Typ, 2019–2028 (in Mio. USD)
TABELLE 272 – Italienischer Markt für Elektronik in Wellpappe, nach Typ, 2019–2028 (in Mio. USD)
TABELLE 273 Italienischer Markt für Kosmetika in Wellpappe, nach Kosmetik-Endverbraucher, 2019–2028 (in Mio. USD)
TABELLE 274: Italienischer Markt für Kosmetika in Wellpappe, nach Typ, 2019–2028 (in Mio. USD)
TABELLE 275 – Italienischer Markt für Körperpflegeprodukte in Wellpappe, nach Typ, 2019–2028 (in Mio. USD)
TABELLE 276 – Italienischer Markt für Textilien in Wellpappe, nach Typ, 2019–2028 (in Mio. USD)
TABELLE 277 Sonstige Akteure auf dem italienischen Markt für Wellpappkartons, nach Typ, 2019–2028 (in Mio. USD)
TABELLE 278 Spanischer Markt für Wellpappkartons, nach Typ, 2019–2028 (in Mio. USD)
TABELLE 279 Spanischer Markt für Wellpappkartons, nach Typ, 2019–2028 (Millionen Einheiten)
TABELLE 280 Spanischer Markt für Wellpappkartons, nach Material, 2019–2028 (in Mio. USD)
TABELLE 281 Spanischer Markt für Wellpappekartons, nach Flöten, 2019–2028 (in Mio. USD)
TABELLE 282 Spanischer Markt für Wellpappkartons, nach Stil, 2019–2028 (in Mio. USD)
TABELLE 283 Spanischer Markt für Wellpappekartons, nach Druckverfahren, 2019–2028 (in Mio. USD)
TABELLE 284 Spanischer Markt für Wellpappkartons, nach Endverbraucher, 2019–2028 (in Mio. USD)
TABELLE 285 – Spanischer Markt für Lebensmittel und Getränke in Wellpappe, nach Endverbraucher, 2019–2028 (in Mio. USD)
TABELLE 286 Spanischer Markt für Lebensmittel in Wellpappe, nach Lebensmittelendverbraucher, 2019–2028 (in Mio. USD)
TABELLE 287 Spanischer Markt für alkoholfreie Getränke in Wellpappe, nach Endverbraucher alkoholfreier Getränke, 2019–2028 (in Mio. USD)
TABELLE 288 Spanischer Markt für alkoholische Getränke in Wellpappe, nach Endverbraucher alkoholischer Getränke, 2019–2028 (in Mio. USD)
TABELLE 289 – Spanischer Markt für Lebensmittel und Getränke in Wellpappe, nach Typ, 2019–2028 (in Mio. USD)
TABELLE 290: Spanien – Gesundheitswesen und Pharmazeutika im Wellpappenmarkt, nach Typ, 2019–2028 (in Mio. USD)
TABELLE 291 Spanien – Versand und Logistik im Wellpappkartonmarkt, nach Typ, 2019–2028 (in Mio. USD)
TABELLE 292 E-Commerce im spanischen Markt für Wellpappe, nach Typ, 2019–2028 (in Mio. USD)
TABELLE 293 Spanischer Markt für Haushaltsprodukte in Wellpappe, nach Endverbraucher von Haushaltsprodukten, 2019–2028 (in Mio. USD)
TABELLE 294: Spanischer Markt für Haushaltsprodukte in Wellpappe, nach Typ, 2019–2028 (in Mio. USD)
TABELLE 295 – Spanischer Markt für Elektronik in Wellpappe, nach Typ, 2019–2028 (in Mio. USD)
TABELLE 296: Spanien – Markt für Kosmetika in Wellpappe, nach Kosmetik-Endverbraucher, 2019–2028 (in Mio. USD)
TABELLE 297 – Spanischer Markt für Kosmetika in Wellpappe, nach Typ, 2019–2028 (in Mio. USD)
TABELLE 298 Spanischer Markt für Körperpflegeprodukte in Wellpappe, nach Typ, 2019–2028 (in Mio. USD)
TABELLE 299 Spanischer Markt für Textilien in Wellpappe, nach Typ, 2019–2028 (in Mio. USD)
TABELLE 300 Sonstige Akteure im spanischen Wellpappenmarkt, nach Typ, 2019–2028 (in Mio. USD)
TABELLE 301 Niederländischer Markt für Wellpappkartons, nach Typ, 2019–2028 (in Mio. USD)
TABELLE 302 Niederländischer Markt für Wellpappkartons, nach Typ, 2019–2028 (Millionen Einheiten)
TABELLE 303 Niederländischer Markt für Wellpappkartons, nach Material, 2019–2028 (in Mio. USD)
TABELLE 304 Niederländischer Markt für Wellpappekartons, nach Flöten, 2019–2028 (in Mio. USD)
TABELLE 305 Niederländischer Markt für Wellpappkartons, nach Stil, 2019–2028 (in Mio. USD)
TABELLE 306 Niederländischer Markt für Wellpappkartons, nach Druckverfahren, 2019–2028 (in Mio. USD)
TABELLE 307 Niederländischer Markt für Wellpappkartons, nach Endverbraucher, 2019–2028 (in Mio. USD)
TABELLE 308 Niederländischer Markt für Lebensmittel und Getränke in Wellpappe, nach Endverbraucher, 2019–2028 (in Mio. USD)
TABELLE 309 Niederländischer Markt für Lebensmittel in Wellpappe, nach Lebensmittelendverbraucher, 2019–2028 (in Mio. USD)
TABELLE 310 Niederländischer Markt für alkoholfreie Getränke in Wellpappe, nach Endverbraucher alkoholfreier Getränke, 2019–2028 (in Mio. USD)
TABELLE 311 Niederländischer Markt für alkoholische Getränke in Wellpappe, nach Endverbraucher alkoholischer Getränke, 2019–2028 (in Mio. USD)
TABELLE 312 Niederländischer Markt für Lebensmittel und Getränke in Wellpappe, nach Typ, 2019–2028 (in Mio. USD)
TABELLE 313 Niederländischer Markt für Gesundheitswesen und Pharmazeutika im Wellpappenmarkt, nach Typ, 2019–2028 (in Mio. USD)
TABELLE 314: Versand und Logistik im niederländischen Markt für Wellpappkartons, nach Typ, 2019–2028 (in Mio. USD)
TABELLE 315: Niederländischer E-Commerce-Markt für Wellpappkartons, nach Typ, 2019–2028 (in Mio. USD)
TABELLE 316 Niederländischer Markt für Haushaltsprodukte in Wellpappe, nach Endverbraucher von Haushaltsprodukten, 2019–2028 (in Mio. USD)
TABELLE 317 Niederländischer Markt für Haushaltsprodukte in Wellpappe, nach Typ, 2019–2028 (in Mio. USD)
TABELLE 318 Niederländischer Markt für Elektronik in Wellpappe, nach Typ, 2019–2028 (in Mio. USD)
TABELLE 319 Niederländischer Markt für Kosmetika in Wellpappe, nach Kosmetik-Endverbraucher, 2019–2028 (in Mio. USD)
TABELLE 320 Niederländischer Markt für Kosmetika in Wellpappe, nach Typ, 2019–2028 (in Mio. USD)
TABELLE 321 Niederländischer Markt für Körperpflegeprodukte in Wellpappe, nach Typ, 2019–2028 (in Mio. USD)
TABELLE 322 Niederländischer Markt für Textilien in Wellpappe, nach Typ, 2019–2028 (in Mio. USD)
TABELLE 323 Sonstige niederländische Anbieter im Wellpappenmarkt, nach Typ, 2019–2028 (in Mio. USD)
TABELLE 324 Belgischer Markt für Wellpappkartons, nach Typ, 2019–2028 (in Mio. USD)
TABELLE 325 Belgischer Markt für Wellpappkartons, nach Typ, 2019–2028 (Millionen Einheiten)
TABELLE 326 Belgischer Markt für Wellpappkartons, nach Material, 2019–2028 (in Mio. USD)
TABELLE 327 Belgischer Markt für Wellpappkartons, nach Flöten, 2019–2028 (in Mio. USD)
TABELLE 328 Belgischer Markt für Wellpappkartons, nach Stil, 2019–2028 (in Mio. USD)
TABELLE 329 Belgischer Markt für Wellpappkartons, nach Druckverfahren, 2019–2028 (in Mio. USD)
TABELLE 330 Belgischer Markt für Wellpappkartons, nach Endverbraucher, 2019–2028 (in Mio. USD)
TABELLE 331 Belgischer Markt für Lebensmittel und Getränke in Wellpappe, nach Endverbraucher, 2019–2028 (in Mio. USD)
TABELLE 332 Belgischer Markt für Lebensmittel in Wellpappe, nach Lebensmittelendverbraucher, 2019–2028 (in Mio. USD)
TABELLE 333 – Belgischer Markt für alkoholfreie Getränke in Wellpappe, nach Endverbrauchern alkoholfreier Getränke, 2019–2028 (in Mio. USD)
TABELLE 334 – Belgischer Markt für alkoholische Getränke in Wellpappe, nach Endverbraucher alkoholischer Getränke, 2019–2028 (in Mio. USD)
TABELLE 335 – Belgischer Markt für Lebensmittel und Getränke in Wellpappe, nach Typ, 2019–2028 (in Mio. USD)
TABELLE 336 – Belgischer Markt für Gesundheitswesen und Pharmazeutika im Wellpappenmarkt, nach Typ, 2019–2028 (in Mio. USD)
TABELLE 337 Belgien – Versand und Logistik im Wellpappkartonmarkt, nach Typ, 2019–2028 (in Mio. USD)
TABELLE 338 Belgischer E-Commerce-Markt für Wellpappkartons, nach Typ, 2019–2028 (in Mio. USD)
TABELLE 339 – Belgischer Markt für Haushaltsprodukte in Wellpappe, nach Endverbraucher von Haushaltsprodukten, 2019–2028 (in Mio. USD)
TABELLE 340 – Belgischer Markt für Haushaltsprodukte in Wellpappe, nach Typ, 2019–2028 (in Mio. USD)
TABELLE 341 Belgischer Markt für Elektronik in Wellpappe, nach Typ, 2019–2028 (in Mio. USD)
TABELLE 342 Belgischer Markt für Kosmetika in Wellpappe, nach Kosmetik-Endverbraucher, 2019–2028 (in Mio. USD)
TABELLE 343 Belgischer Markt für Kosmetika in Wellpappe, nach Typ, 2019–2028 (in Mio. USD)
TABELLE 344 Belgischer Markt für Körperpflegeprodukte in Wellpappe, nach Typ, 2019–2028 (in Mio. USD)
TABELLE 345 – Belgischer Markt für Textilien in Wellpappkartons, nach Typ, 2019–2028 (in Mio. USD)
TABELLE 346: Sonstige Akteure auf dem belgischen Markt für Wellpappkartons, nach Typ, 2019–2028 (in Mio. USD)
TABELLE 347 Russischer Markt für Wellpappkartons, nach Typ, 2019–2028 (in Mio. USD)
TABELLE 348 Russischer Markt für Wellpappkartons, nach Typ, 2019–2028 (Millionen Einheiten)
TABELLE 349 Russischer Markt für Wellpappkartons, nach Material, 2019–2028 (in Mio. USD)
TABELLE 350 Russischer Markt für Wellpappekartons, nach Flöten, 2019–2028 (in Mio. USD)
TABELLE 351 Russischer Markt für Wellpappkartons, nach Stil, 2019–2028 (in Mio. USD)
TABELLE 352 Russischer Markt für Wellpappekartons, nach Druckverfahren, 2019–2028 (in Mio. USD)
TABELLE 353 Russischer Markt für Wellpappkartons, nach Endverbraucher, 2019–2028 (in Mio. USD)
TABELLE 354 – Russischer Markt für Lebensmittel und Getränke in Wellpappe, nach Endverbraucher, 2019–2028 (in Mio. USD)
TABELLE 355 – Russischer Markt für Lebensmittel in Wellpappe, nach Lebensmittelendverbraucher, 2019–2028 (in Mio. USD)
TABELLE 356 – Markt für alkoholfreie Getränke in Wellpappe in Russland, nach Endverbrauchern alkoholfreier Getränke, 2019–2028 (in Mio. USD)
TABELLE 357 Russischer Markt für alkoholische Getränke in Wellpappe, nach Endverbraucher alkoholischer Getränke, 2019–2028 (in Mio. USD)
TABELLE 358 – Russischer Markt für Lebensmittel und Getränke in Wellpappe, nach Typ, 2019–2028 (in Mio. USD)
TABELLE 359 – Russischer Markt für Gesundheitswesen und Pharmazeutika im Wellpappenmarkt, nach Typ, 2019–2028 (in Mio. USD)
TABELLE 360 – Russland: Versand und Logistik im Wellpappkartonmarkt, nach Typ, 2019–2028 (in Mio. USD)
TABELLE 361 Russland: E-Commerce im Wellpappenmarkt, nach Typ, 2019–2028 (in Mio. USD)
TABELLE 362 Russischer Markt für Haushaltsprodukte in Wellpappe, nach Endverbraucher von Haushaltsprodukten, 2019–2028 (in Mio. USD)
TABELLE 363 – Russischer Markt für Haushaltsprodukte in Wellpappe, nach Typ, 2019–2028 (in Mio. USD)
TABELLE 364 Russland: Markt für Elektronik in Wellpappe, nach Typ, 2019–2028 (in Mio. USD)
TABELLE 365: Russischer Markt für Kosmetika in Wellpappe, nach Kosmetik-Endverbraucher, 2019–2028 (in Mio. USD)
TABELLE 366 – Russischer Markt für Kosmetika in Wellpappe, nach Typ, 2019–2028 (in Mio. USD)
TABELLE 367 – Russischer Markt für Körperpflegeprodukte in Wellpappe, nach Typ, 2019–2028 (in Mio. USD)
TABELLE 368 Russischer Markt für Textilien in Wellpappe, nach Typ, 2019–2028 (in Mio. USD)
TABELLE 369 Russland – Sonstige Akteure auf dem Wellpappkartonmarkt, nach Typ, 2019–2028 (in Mio. USD)
TABELLE 370: Türkischer Markt für Wellpappkartons, nach Typ, 2019–2028 (in Mio. USD)
TABELLE 371: Türkischer Markt für Wellpappkartons, nach Typ, 2019–2028 (Millionen Einheiten)
TABELLE 372 Markt für Wellpappkartons in der Türkei, nach Material, 2019–2028 (in Mio. USD)
TABELLE 373 Türkischer Markt für Wellpappekartons, nach Flöten, 2019–2028 (in Mio. USD)
TABELLE 374: Türkischer Markt für Wellpappkartons, nach Stil, 2019–2028 (in Mio. USD)
TABELLE 375: Türkischer Markt für Wellpappkartons, nach Druckverfahren, 2019–2028 (in Mio. USD)
TABELLE 376: Türkischer Markt für Wellpappkartons, nach Endverbraucher, 2019–2028 (in Mio. USD)
TABELLE 377: Markt für Lebensmittel und Getränke in der Türkei in Wellpappe, nach Endverbraucher, 2019–2028 (in Mio. USD)
TABELLE 378 Markt für Putenfutter in Wellpappe, nach Lebensmittelendverbraucher, 2019–2028 (in Mio. USD)
TABELLE 379 Türkischer Markt für alkoholfreie Getränke in Wellpappe, nach Endverbraucher alkoholfreier Getränke, 2019–2028 (in Mio. USD)
TABELLE 380 Türkischer Markt für alkoholische Getränke in Wellpappe, nach Endverbraucher alkoholischer Getränke, 2019–2028 (in Mio. USD)
TABELLE 381 Markt für Lebensmittel und Getränke in der Türkei in Wellpappe, nach Typ, 2019–2028 (in Mio. USD)
TABELLE 382: Türkischer Markt für Gesundheitswesen und Pharmazeutika im Wellpappenmarkt, nach Typ, 2019–2028 (in Mio. USD)
TABELLE 383 Türkei – Versand und Logistik im Wellpappkartonmarkt, nach Typ, 2019–2028 (in Mio. USD)
TABELLE 384 E-Commerce im türkischen Markt für Wellpappkartons, nach Typ, 2019–2028 (in Mio. USD)
TABELLE 385: Türkischer Markt für Haushaltsprodukte im Wellpappkarton, nach Endverbraucher von Haushaltsprodukten, 2019–2028 (in Mio. USD)
TABELLE 386: Türkischer Markt für Haushaltsprodukte in Wellpappe, nach Typ, 2019–2028 (in Mio. USD)
TABELLE 387 Türkischer Markt für Elektronik in Wellpappe, nach Typ, 2019–2028 (in Mio. USD)
TABELLE 388: Markt für Kosmetika in Wellpappe in der Türkei, nach Kosmetik-Endverbraucher, 2019–2028 (in Mio. USD)
TABELLE 389: Markt für Kosmetika in Wellpappe in der Türkei, nach Typ, 2019–2028 (in Mio. USD)
TABELLE 390 – Markt für Körperpflegeprodukte in Wellpappe in der Türkei, nach Typ, 2019–2028 (in Mio. USD)
TABELLE 391 – Markt für Textilien in Wellpappe in der Türkei, nach Typ, 2019–2028 (in Mio. USD)
TABELLE 392 Sonstige Anbieter im Wellpappenmarkt der Türkei, nach Typ, 2019–2028 (in Mio. USD)
TABELLE 393 Schweizer Markt für Wellpappkartons, nach Typ, 2019–2028 (in Mio. USD)
TABELLE 394 Schweizer Markt für Wellpappkartons, nach Typ, 2019–2028 (Millionen Einheiten)
TABELLE 395 Schweizer Markt für Wellpappkartons, nach Material, 2019–2028 (in Mio. USD)
TABELLE 396 Schweizer Markt für Wellpappekartons, nach Flöten, 2019–2028 (in Mio. USD)
TABELLE 397 Schweizer Markt für Wellpappkartons, nach Stil, 2019–2028 (in Mio. USD)
TABELLE 398 Schweizer Markt für Wellpappekartons, nach Druckverfahren, 2019–2028 (in Mio. USD)
TABELLE 399 Schweizer Markt für Wellpappkartons, nach Endverbraucher, 2019–2028 (in Mio. USD)
TABELLE 400 – Schweizer Markt für Lebensmittel und Getränke in Wellpappe, nach Endverbraucher, 2019–2028 (in Mio. USD)
TABELLE 401 Schweizer Markt für Lebensmittel in Wellpappe, nach Lebensmittelendverbraucher, 2019–2028 (in Mio. USD)
TABELLE 402 Schweizer Markt für alkoholfreie Getränke in Wellpappe, nach Endverbrauchern alkoholfreier Getränke, 2019–2028 (in Mio. USD)
TABELLE 403 Schweizer Markt für alkoholische Getränke in Wellpappe, nach Endverbraucher alkoholischer Getränke, 2019–2028 (in Mio. USD)
TABELLE 404 Schweizer Markt für Lebensmittel und Getränke in Wellpappe, nach Typ, 2019–2028 (in Mio. USD)
TABELLE 405 – Schweizer Markt für Gesundheitswesen und Pharmazeutika im Wellpappenmarkt, nach Typ, 2019–2028 (in Mio. USD)
TABELLE 406 Schweiz – Versand und Logistik im Wellpappkartonmarkt, nach Typ, 2019–2028 (in Mio. USD)
TABELLE 407 Schweizer E-Commerce-Markt für Wellpappe, nach Typ, 2019–2028 (in Mio. USD)
TABELLE 408 Schweizer Markt für Haushaltsprodukte in Wellpappe, nach Endverbraucher von Haushaltsprodukten, 2019–2028 (in Mio. USD)
TABELLE 409 Schweizer Markt für Haushaltsprodukte in Wellpappe, nach Typ, 2019–2028 (in Mio. USD)
TABELLE 410 Schweizer Markt für Elektronik in Wellpappe, nach Typ, 2019–2028 (in Mio. USD)
TABELLE 411 Schweizer Markt für Kosmetika in Wellpappe, nach Kosmetik-Endverbraucher, 2019–2028 (in Mio. USD)
TABELLE 412 Schweizer Markt für Kosmetika in Wellpappe, nach Typ, 2019–2028 (in Mio. USD)
TABELLE 413 Schweizer Markt für Körperpflegeprodukte in Wellpappe, nach Typ, 2019–2028 (in Mio. USD)
TABELLE 414 Schweizer Markt für Textilien in Wellpappe, nach Typ, 2019–2028 (in Mio. USD)
TABELLE 415 Sonstige Anbieter im Wellpappenmarkt der Schweiz, nach Typ, 2019–2028 (in Mio. USD)
TABELLE 416 Markt für Wellpappkartons im übrigen Europa, nach Typ, 2019–2028 (in Mio. USD)
TABELLE 417 Markt für Wellpappkartons im übrigen Europa, nach Typ, 2019–2028 (Millionen Einheiten)
TABELLE 418 Markt für Wellpappkartons im asiatisch-pazifischen Raum, NACH LAND, 2019–2028 (in Mio. USD)
TABELLE 419 Markt für Wellpappkartons im asiatisch-pazifischen Raum, NACH LAND, 2019–2028 (Millionen Einheiten)
TABELLE 420 Markt für Wellpappekartons im asiatisch-pazifischen Raum, nach Typ, 2019–2028 (in Mio. USD)
TABELLE 421 Markt für Wellpappekartons im asiatisch-pazifischen Raum, nach Typ, 2019–2028 (Millionen Einheiten)
TABELLE 422 Markt für Wellpappe im asiatisch-pazifischen Raum, nach Material, 2019–2028 (in Mio. USD)
TABELLE 423 Markt für Wellpappe im asiatisch-pazifischen Raum, nach Flöten, 2019–2028 (in Mio. USD)
TABELLE 424 Markt für Wellpappekartons im asiatisch-pazifischen Raum, nach Stil, 2019–2028 (in Mio. USD)
TABELLE 425 Markt für Wellpappekartons im asiatisch-pazifischen Raum, nach Druckverfahren, 2019–2028 (in Mio. USD)
TABELLE 426 Markt für Wellpappe im asiatisch-pazifischen Raum, nach Endverbraucher, 2019–2028 (in Mio. USD)
TABELLE 427 Markt für Lebensmittel und Getränke in Wellpappe im asiatisch-pazifischen Raum, nach Endverbraucher, 2019–2028 (in Mio. USD)
TABELLE 428 Markt für Lebensmittel in Wellpappe im asiatisch-pazifischen Raum, nach Lebensmittelendverbraucher, 2019–2028 (in Mio. USD)
TABELLE 429 Markt für alkoholfreie Getränke in Wellpappe im asiatisch-pazifischen Raum, nach Endverbraucher alkoholfreier Getränke, 2019–2028 (in Mio. USD)
TABELLE 430 Markt für alkoholische Getränke in Wellpappe im asiatisch-pazifischen Raum, nach Endverbraucher alkoholischer Getränke, 2019–2028 (in Mio. USD)
TABELLE 431 Markt für Lebensmittel und Getränke in Wellpappe im asiatisch-pazifischen Raum, nach Typ, 2019–2028 (in Mio. USD)
TABELLE 432 – Markt für Gesundheitswesen und Pharmazeutika im asiatisch-pazifischen Raum im Wellpappenmarkt, nach Typ, 2019–2028 (in Mio. USD)
TABELLE 433 Versand und Logistik im asiatisch-pazifischen Markt für Wellpappkartons, nach Typ, 2019–2028 (in Mio. USD)
TABELLE 434 E-Commerce im Markt für Wellpappe im asiatisch-pazifischen Raum, nach Typ, 2019–2028 (in Mio. USD)
TABELLE 435 Markt für Haushaltsprodukte in Wellpappe im asiatisch-pazifischen Raum, nach Endverbraucher von Haushaltsprodukten, 2019–2028 (in Mio. USD)
TABELLE 436 Markt für Haushaltsprodukte in Wellpappe im asiatisch-pazifischen Raum, nach Typ, 2019–2028 (in Mio. USD)
TABELLE 437 Markt für Elektronik in Wellpappe im asiatisch-pazifischen Raum, nach Typ, 2019–2028 (in Mio. USD)
TABELLE 438 Markt für Kosmetik in Wellpappe im asiatisch-pazifischen Raum, nach Kosmetik-Endverbraucher, 2019–2028 (in Mio. USD)
TABELLE 439 Markt für Kosmetik in Wellpappe im asiatisch-pazifischen Raum, nach Typ, 2019–2028 (in Mio. USD)
TABELLE 440 Markt für Körperpflegeprodukte in Wellpappe im asiatisch-pazifischen Raum, nach Typ, 2019–2028 (in Mio. USD)
TABELLE 441 Markt für Textilien in Wellpappe im asiatisch-pazifischen Raum, nach Typ, 2019–2028 (in Mio. USD)
TABELLE 442 Sonstige Akteure im Markt für Wellpappe im asiatisch-pazifischen Raum, nach Typ, 2019–2028 (in Mio. USD)
TABELLE 443 Chinesischer Markt für Wellpappkartons, nach Typ, 2019–2028 (in Mio. USD)
TABELLE 444 Chinesischer Markt für Wellpappkartons, nach Typ, 2019–2028 (Millionen Einheiten)
TABELLE 445 Chinesischer Markt für Wellpappkartons, nach Material, 2019–2028 (in Mio. USD)
TABELLE 446 Chinesischer Markt für Wellpappekartons, nach Flöten, 2019–2028 (in Mio. USD)
TABELLE 447 Chinesischer Markt für Wellpappkartons, nach Stil, 2019–2028 (in Mio. USD)
TABELLE 448 Chinesischer Markt für Wellpappekartons, nach Druckverfahren, 2019–2028 (in Mio. USD)
TABELLE 449 Chinesischer Markt für Wellpappkartons, nach Endverbraucher, 2019–2028 (in Mio. USD)
TABELLE 450 – Chinesischer Markt für Lebensmittel und Getränke in Wellpappe, nach Endverbraucher, 2019–2028 (in Mio. USD)
TABELLE 451 Chinesischer Markt für Lebensmittel in Wellpappe, nach Lebensmittelendverbraucher, 2019–2028 (in Mio. USD)
TABELLE 452 Chinesischer Markt für alkoholfreie Getränke in Wellpappe, nach Endverbraucher alkoholfreier Getränke, 2019–2028 (in Mio. USD)
TABELLE 453 Chinesischer Markt für alkoholische Getränke in Wellpappe, nach Endverbraucher alkoholischer Getränke, 2019–2028 (in Mio. USD)
TABELLE 454 Chinesischer Markt für Lebensmittel und Getränke in Wellpappe, nach Typ, 2019–2028 (in Mio. USD)
TABELLE 455 – Chinesischer Markt für Gesundheitswesen und Pharmazeutika im Wellpappenmarkt, nach Typ, 2019–2028 (in Mio. USD)
TABELLE 456 – Chinesischer Markt für Versand und Logistik im Wellpappenmarkt, nach Typ, 2019–2028 (in Mio. USD)
TABELLE 457 Chinesischer E-Commerce-Markt für Wellpappe, nach Typ, 2019–2028 (in Mio. USD)
TABELLE 458 Chinesischer Markt für Haushaltsprodukte in Wellpappe, nach Endverbraucher von Haushaltsprodukten, 2019–2028 (in Mio. USD)
TABELLE 459 – Chinesischer Markt für Haushaltsprodukte in Wellpappe, nach Typ, 2019–2028 (in Mio. USD)
TABELLE 460 Chinesischer Markt für Elektronik in Wellpappe, nach Typ, 2019–2028 (in Mio. USD)
TABELLE 461 Chinesischer Markt für Kosmetika in Wellpappe, nach Kosmetik-Endverbraucher, 2019–2028 (in Mio. USD)
TABELLE 462 Chinesischer Markt für Kosmetika in Wellpappe, nach Typ, 2019–2028 (in Mio. USD)
TABELLE 463 Chinesischer Markt für Körperpflegeprodukte in Wellpappe, nach Typ, 2019–2028 (in Mio. USD)
TABELLE 464 – Chinesischer Markt für Textilien in Wellpappe, nach Typ, 2019–2028 (in Mio. USD)
TABELLE 465 Sonstige Anbieter im chinesischen Wellpappenmarkt, nach Typ, 2019–2028 (in Mio. USD)
TABELLE 466 Indischer Markt für Wellpappkartons, nach Typ, 2019–2028 (in Mio. USD)
TABELLE 467 Indischer Markt für Wellpappkartons, nach Typ, 2019–2028 (Millionen Einheiten)
TABELLE 468 Indischer Markt für Wellpappkartons, nach Material, 2019–2028 (in Mio. USD)
TABELLE 469 Indischer Markt für Wellpappekartons, nach Flöten, 2019–2028 (in Mio. USD)
TABELLE 470 Indischer Markt für Wellpappkartons, nach Stil, 2019–2028 (in Mio. USD)
TABELLE 471 Indischer Markt für Wellpappkartons, nach Druckverfahren, 2019–2028 (in Mio. USD)
TABELLE 472: Indischer Markt für Wellpappkartons, nach Endverbraucher, 2019–2028 (in Mio. USD)
TABELLE 473 Indischer Markt für Lebensmittel und Getränke in Wellpappe, nach Endverbraucher, 2019–2028 (in Mio. USD)
TABELLE 474 Indischer Markt für Lebensmittel in Wellpappe, nach Lebensmittelendverbraucher, 2019–2028 (in Mio. USD)
TABELLE 475: Markt für alkoholfreie Getränke in Wellpappe in Indien, nach Endverbraucher alkoholfreier Getränke, 2019–2028 (in Mio. USD)
TABELLE 476: Markt für alkoholische Getränke in Wellpappe in Indien, nach Endverbraucher alkoholischer Getränke, 2019–2028 (in Mio. USD)
TABELLE 477 – Indischer Markt für Lebensmittel und Getränke in Wellpappe, nach Typ, 2019–2028 (in Mio. USD)
TABELLE 478 – Indischer Markt für Gesundheitswesen und Pharmazeutika im Wellpappenmarkt, nach Typ, 2019–2028 (in Mio. USD)
TABELLE 479 – Versand und Logistik im indischen Markt für Wellpappkartons, nach Typ, 2019–2028 (in Mio. USD)
TABELLE 480 E-Commerce im indischen Markt für Wellpappkartons, nach Typ, 2019–2028 (in Mio. USD)
TABELLE 481 Indischer Markt für Haushaltsprodukte in Wellpappe, nach Endverbraucher von Haushaltsprodukten, 2019–2028 (in Mio. USD)
TABELLE 482 Indischer Markt für Haushaltsprodukte in Wellpappe, nach Typ, 2019–2028 (in Mio. USD)
TABELLE 483 – Indischer Markt für Elektronik in Wellpappe, nach Typ, 2019–2028 (in Mio. USD)
TABELLE 484: Indischer Markt für Kosmetika in Wellpappe, nach Kosmetik-Endverbraucher, 2019–2028 (in Mio. USD)
TABELLE 485: Indischer Markt für Kosmetika in Wellpappe, nach Typ, 2019–2028 (in Mio. USD)
TABELLE 486 Indischer Markt für Körperpflegeprodukte in Wellpappe, nach Typ, 2019–2028 (in Mio. USD)
TABELLE 487 Indischer Markt für Textilien in Wellpappe, nach Typ, 2019–2028 (in Mio. USD)
TABELLE 488 Sonstige Anbieter im indischen Wellpappenmarkt, nach Typ, 2019–2028 (in Mio. USD)
TABELLE 489 Japanischer Markt für Wellpappkartons, nach Typ, 2019–2028 (in Mio. USD)
TABELLE 490 Japanischer Markt für Wellpappkartons, nach Typ, 2019–2028 (Millionen Einheiten)
TABELLE 491 Japanischer Markt für Wellpappkartons, nach Material, 2019–2028 (in Mio. USD)
TABELLE 492 Japanischer Markt für Wellpappekartons, nach Flöten, 2019–2028 (in Mio. USD)
TABELLE 493 Japanischer Markt für Wellpappkartons, nach Stil, 2019–2028 (in Mio. USD)
TABELLE 494 Japanischer Markt für Wellpappekartons, nach Druckverfahren, 2019–2028 (in Mio. USD)
TABELLE 495 Japanischer Markt für Wellpappkartons, nach Endverbraucher, 2019–2028 (in Mio. USD)
TABELLE 496 Japanischer Markt für Lebensmittel und Getränke in Wellpappe, nach Endverbraucher, 2019–2028 (in Mio. USD)
TABELLE 497 Japanischer Markt für Lebensmittel in Wellpappe, nach Lebensmittelendverbraucher, 2019–2028 (in Mio. USD)
TABELLE 498 Japanischer Markt für alkoholfreie Getränke in Wellpappe, nach Endverbraucher alkoholfreier Getränke, 2019–2028 (in Mio. USD)
TABELLE 499 Japanischer Markt für alkoholische Getränke in Wellpappe, nach Endverbraucher alkoholischer Getränke, 2019–2028 (in Mio. USD)
TABELLE 500 – Japanischer Markt für Lebensmittel und Getränke in Wellpappe, nach Typ, 2019–2028 (in Mio. USD)
TABELLE 501 Japanischer Markt für Gesundheitswesen und Pharmazeutika im Wellpappenmarkt, nach Typ, 2019–2028 (in Mio. USD)
TABELLE 502 Japanischer Markt für Versand und Logistik im Wellpappkartonmarkt, nach Typ, 2019–2028 (in Mio. USD)
TABELLE 503 Japanischer E-Commerce-Markt für Wellpappkartons, nach Typ, 2019–2028 (in Mio. USD)
TABELLE 504 Japanischer Markt für Haushaltsprodukte im Wellpappkarton, nach Endverbraucher von Haushaltsprodukten, 2019–2028 (in Mio. USD)
TABELLE 505 Japanischer Markt für Haushaltsprodukte in Wellpappe, nach Typ, 2019–2028 (in Mio. USD)
TABELLE 506 Japanischer Markt für Elektronik in Wellpappe, nach Typ, 2019–2028 (in Mio. USD)
TABELLE 507 Japanischer Markt für Kosmetika in Wellpappe, nach Kosmetik-Endverbraucher, 2019–2028 (in Mio. USD)
TABELLE 508 Japanischer Markt für Kosmetika in Wellpappe, nach Typ, 2019–2028 (in Mio. USD)
TABELLE 509 Japanischer Markt für Körperpflegeprodukte in Wellpappe, nach Typ, 2019–2028 (in Mio. USD)
TABELLE 510 Japanischer Markt für Textilien in Wellpappe, nach Typ, 2019–2028 (in Mio. USD)
TABELLE 511 Sonstige Anbieter im japanischen Wellpappenmarkt, nach Typ, 2019–2028 (in Mio. USD)
TABELLE 512 Südkoreanischer Markt für Wellpappkartons, nach Typ, 2019–2028 (in Mio. USD)
TABELLE 513 Südkoreanischer Markt für Wellpappkartons, nach Typ, 2019–2028 (Millionen Einheiten)
TABELLE 514 Südkoreanischer Markt für Wellpappkartons, nach Material, 2019–2028 (in Mio. USD)
TABELLE 515 Südkoreanischer Markt für Wellpappekartons, nach Flöten, 2019–2028 (in Mio. USD)
TABELLE 516 Südkoreanischer Markt für Wellpappkartons, nach Stil, 2019–2028 (in Mio. USD)
TABELLE 517 Südkoreanischer Markt für Wellpappkartons, nach Druckverfahren, 2019–2028 (in Mio. USD)
TABELLE 518 Südkoreanischer Markt für Wellpappkartons, nach Endverbraucher, 2019–2028 (in Mio. USD)
TABELLE 519 Südkoreanischer Markt für Lebensmittel und Getränke in Wellpappe, nach Endverbraucher, 2019–2028 (in Mio. USD)
TABELLE 520 Südkoreanischer Markt für Lebensmittel in Wellpappe, nach Lebensmittelendverbraucher, 2019–2028 (in Mio. USD)
TABELLE 521 Südkoreanischer Markt für alkoholfreie Getränke in Wellpappe, nach Endverbraucher alkoholfreier Getränke, 2019–2028 (in Mio. USD)
TABELLE 522 Südkoreanischer Markt für alkoholische Getränke in Wellpappe, nach Endverbraucher alkoholischer Getränke, 2019–2028 (in Mio. USD)
TABELLE 523 Südkoreanischer Markt für Lebensmittel und Getränke in Wellpappe, nach Typ, 2019–2028 (in Mio. USD)
TABELLE 524 Südkoreanischer Markt für Gesundheitswesen und Pharmazeutika im Wellpappenmarkt, nach Typ, 2019–2028 (in Mio. USD)
TABELLE 525 Südkoreanischer Markt für Versand und Logistik im Wellpappkartonmarkt, nach Typ, 2019–2028 (in Mio. USD)
TABELLE 526 Südkoreanischer E-Commerce-Markt für Wellpappkartons, nach Typ, 2019–2028 (in Mio. USD)
TABELLE 527 Südkoreanischer Markt für Haushaltsprodukte im Wellpappkarton, nach Endverbraucher von Haushaltsprodukten, 2019–2028 (in Mio. USD)
TABELLE 528 Südkoreanischer Markt für Haushaltsprodukte im Wellpappkarton, nach Typ, 2019–2028 (in Mio. USD)
TABELLE 529 Südkoreanischer Markt für Elektronik in Wellpappe, nach Typ, 2019–2028 (in Mio. USD)
TABELLE 530 Südkoreanischer Markt für Kosmetika in Wellpappe, nach Kosmetik-Endverbraucher, 2019–2028 (in Mio. USD)
TABELLE 531 Südkoreanischer Markt für Kosmetika in Wellpappe, nach Typ, 2019–2028 (in Mio. USD)
TABELLE 532 Südkoreanischer Markt für Körperpflegeprodukte in Wellpappe, nach Typ, 2019–2028 (in Mio. USD)
TABELLE 533 Südkoreanischer Markt für Textilien in Wellpappe, nach Typ, 2019–2028 (in Mio. USD)
TABELLE 534 Sonstige Akteure im Wellpappenmarkt in Südkorea, nach Typ, 2019–2028 (in Mio. USD)
TABELLE 535: Markt für Wellpappkartons in Australien und Neuseeland, nach Typ, 2019–2028 (in Mio. USD)
TABELLE 536 Markt für Wellpappkartons in Australien und Neuseeland, nach Typ, 2019–2028 (Millionen Einheiten)
TABELLE 537 Markt für Wellpappkartons in Australien und Neuseeland, nach Material, 2019–2028 (in Mio. USD)
TABELLE 538 Markt für Wellpappekartons in Australien und Neuseeland, nach Flöten, 2019–2028 (in Mio. USD)
TABELLE 539 Markt für Wellpappkartons in Australien und Neuseeland, nach Stil, 2019–2028 (in Mio. USD)
TABELLE 540 Markt für Wellpappkartons in Australien und Neuseeland, nach Druckverfahren, 2019–2028 (in Mio. USD)
TABELLE 541: Markt für Wellpappkartons in Australien und Neuseeland, nach Endverbraucher, 2019–2028 (in Mio. USD)
TABELLE 542 – Australischer und neuseeländischer Markt für Lebensmittel und Getränke in Wellpappe, nach Endverbraucher, 2019–2028 (in Mio. USD)
TABELLE 543 Australischer und neuseeländischer Markt für Lebensmittel in Wellpappe, nach Lebensmittelendverbraucher, 2019–2028 (in Mio. USD)
TABELLE 544 – Markt für alkoholfreie Getränke in Wellpappe in Australien und Neuseeland, nach Endverbraucher alkoholfreier Getränke, 2019–2028 (in Mio. USD)
TABELLE 545 Markt für alkoholische Getränke in Wellpappe in Australien und Neuseeland, nach Endverbraucher alkoholischer Getränke, 2019–2028 (in Mio. USD)
TABELLE 546 – Australischer und neuseeländischer Markt für Lebensmittel und Getränke in Wellpappe, nach Typ, 2019–2028 (in Mio. USD)
TABELLE 547 Australien und Neuseeland – Gesundheitswesen und Pharmazeutika im Wellpappenmarkt, nach Typ, 2019–2028 (in Mio. USD)
TABELLE 548 Versand und Logistik im Wellpappkartonmarkt in Australien und Neuseeland, nach Typ, 2019–2028 (in Mio. USD)
TABELLE 549 E-Commerce im Wellpappkartonmarkt in Australien und Neuseeland, nach Typ, 2019–2028 (in Mio. USD)
TABELLE 550: Australischer und neuseeländischer Markt für Haushaltsprodukte in Wellpappe, nach Endverbraucher von Haushaltsprodukten, 2019–2028 (in Mio. USD)
TABELLE 551: Australischer und neuseeländischer Markt für Haushaltsprodukte in Wellpappe, nach Typ, 2019–2028 (in Mio. USD)
TABELLE 552 Australien und Neuseeland – Markt für Elektronik in Wellpappe, nach Typ, 2019–2028 (in Mio. USD)
TABELLE 553: Markt für Kosmetika in Wellpappe in Australien und Neuseeland, nach Kosmetik-Endverbraucher, 2019–2028 (in Mio. USD)
TABELLE 554: Australischer und neuseeländischer Markt für Kosmetika in Wellpappe, nach Typ, 2019–2028 (in Mio. USD)
TABELLE 555 – Markt für Körperpflegeprodukte in Wellpappe in Australien und Neuseeland, nach Typ, 2019–2028 (in Mio. USD)
TABELLE 556 – Australischer und neuseeländischer Markt für Textilien in Wellpappe, nach Typ, 2019–2028 (in Mio. USD)
TABELLE 557 Australien und Neuseeland – Sonstige Akteure auf dem Markt für Wellpappkartons, nach Typ, 2019–2028 (in Mio. USD)
TABELLE 558 Indonesischer Markt für Wellpappkartons, nach Typ, 2019–2028 (in Mio. USD)
TABELLE 559 Indonesischer Markt für Wellpappkartons, nach Typ, 2019–2028 (Millionen Einheiten)
TABELLE 560 Indonesischer Markt für Wellpappkartons, nach Material, 2019–2028 (in Mio. USD)
TABELLE 561 Indonesischer Markt für Wellpappekartons, nach Flöten, 2019–2028 (in Mio. USD)
TABELLE 562 Indonesischer Markt für Wellpappkartons, nach Stil, 2019–2028 (in Mio. USD)
TABELLE 563 Indonesischer Markt für Wellpappkartons, nach Druckverfahren, 2019–2028 (in Mio. USD)
TABELLE 564 Indonesischer Markt für Wellpappkartons, nach Endverbraucher, 2019–2028 (in Mio. USD)
TABELLE 565 Indonesischer Markt für Lebensmittel und Getränke in Wellpappe, nach Endverbraucher, 2019–2028 (in Mio. USD)
TABELLE 566 Indonesischer Markt für Lebensmittel in Wellpappe, nach Lebensmittelendverbraucher, 2019–2028 (in Mio. USD)
TABELLE 567 Indonesischer Markt für alkoholfreie Getränke in Wellpappe, nach Endverbraucher alkoholfreier Getränke, 2019–2028 (in Mio. USD)
TABELLE 568 Indonesischer Markt für alkoholische Getränke in Wellpappe, nach Endverbraucher alkoholischer Getränke, 2019–2028 (in Mio. USD)
TABELLE 569 Indonesischer Markt für Lebensmittel und Getränke in Wellpappe, nach Typ, 2019–2028 (in Mio. USD)
TABELLE 570 Indonesischer Markt für Gesundheitswesen und Pharmazeutika im Wellpappenmarkt, nach Typ, 2019–2028 (in Mio. USD)
TABELLE 571 Indonesischer Versand und Logistik im Wellpappkartonmarkt, nach Typ, 2019–2028 (in Mio. USD)
TABELLE 572 Indonesischer E-Commerce-Markt für Wellpappe, nach Typ, 2019–2028 (in Mio. USD)
TABELLE 573 Indonesischer Markt für Haushaltsprodukte im Wellpappenkarton, nach Endverbraucher von Haushaltsprodukten, 2019–2028 (in Mio. USD)
TABELLE 574 Indonesischer Markt für Haushaltsprodukte in Wellpappe, nach Typ, 2019–2028 (in Mio. USD)
TABELLE 575 – Indonesischer Markt für Elektronik in Wellpappe, nach Typ, 2019–2028 (in Mio. USD)
TABELLE 576 Indonesischer Markt für Kosmetika in Wellpappe, nach Kosmetik-Endverbraucher, 2019–2028 (in Mio. USD)
TABELLE 577 Indonesischer Markt für Kosmetika in Wellpappe, nach Typ, 2019–2028 (in Mio. USD)
TABELLE 578 Indonesischer Markt für Körperpflegeprodukte in Wellpappe, nach Typ, 2019–2028 (in Mio. USD)
TABELLE 579 Indonesischer Markt für Textilien in Wellpappe, nach Typ, 2019–2028 (in Mio. USD)
TABELLE 580 Sonstige indonesische Unternehmen auf dem Wellpappenmarkt, nach Typ, 2019–2028 (in Mio. USD)
TABELLE 581 Markt für Wellpappkartons in Singapur, nach Typ, 2019–2028 (in Mio. USD)
TABELLE 582 Markt für Wellpappkartons in Singapur, nach Typ, 2019–2028 (Millionen Einheiten)
TABELLE 583 Markt für Wellpappekartons in Singapur, nach Material, 2019–2028 (in Mio. USD)
TABELLE 584 Markt für Wellpappekartons in Singapur, nach Flöten, 2019–2028 (in Mio. USD)
TABELLE 585: Markt für Wellpappkartons in Singapur, nach Stil, 2019–2028 (in Mio. USD)
TABELLE 586 Markt für Wellpappekartons in Singapur, nach Druckverfahren, 2019–2028 (in Mio. USD)
TABELLE 587 Markt für Wellpappkartons in Singapur, nach Endverbraucher, 2019–2028 (in Mio. USD)
TABELLE 588 Singapurischer Markt für Lebensmittel und Getränke in Wellpappe, nach Endverbraucher, 2019–2028 (in Mio. USD)
TABELLE 589 Singapurischer Markt für Lebensmittel in Wellpappe, nach Lebensmittelendverbraucher, 2019–2028 (in Mio. USD)
TABELLE 590 Markt für alkoholfreie Getränke in Wellpappe in Singapur, nach Endverbraucher alkoholfreier Getränke, 2019–2028 (in Mio. USD)
TABELLE 591 Singapurischer Markt für alkoholische Getränke in Wellpappe, nach Endverbraucher alkoholischer Getränke, 2019–2028 (in Mio. USD)
TABELLE 592 Singapurischer Markt für Lebensmittel und Getränke in Wellpappe, nach Typ, 2019–2028 (in Mio. USD)
TABELLE 593 Singapurischer Markt für Gesundheitswesen und Pharmazeutika im Wellpappenmarkt, nach Typ, 2019–2028 (in Mio. USD)
TABELLE 594 Singapur – Versand und Logistik im Wellpappkartonmarkt, nach Typ, 2019–2028 (in Mio. USD)
TABELLE 595 – Singapurischer E-Commerce-Markt für Wellpappkartons, nach Typ, 2019–2028 (in Mio. USD)
TABELLE 596: Singapurischer Markt für Haushaltsprodukte in Wellpappe, nach Endverbraucher von Haushaltsprodukten, 2019–2028 (in Mio. USD)
TABELLE 597 Singapurischer Markt für Haushaltsprodukte in Wellpappe, nach Typ, 2019–2028 (in Mio. USD)
TABELLE 598 Singapurischer Markt für Elektronik in Wellpappe, nach Typ, 2019–2028 (in Mio. USD)
TABELLE 599 Singapurischer Markt für Kosmetika in Wellpappe, nach Kosmetik-Endverbraucher, 2019–2028 (in Mio. USD)
TABELLE 600 Singapurischer Markt für Kosmetika in Wellpappe, nach Typ, 2019–2028 (in Mio. USD)
TABELLE 601 Singapurischer Markt für Körperpflegeprodukte in Wellpappe, nach Typ, 2019–2028 (in Mio. USD)
TABELLE 602 Singapurischer Markt für Textilien in Wellpappe, nach Typ, 2019–2028 (in Mio. USD)
TABELLE 603 Sonstige Anbieter im Wellpappenmarkt in Singapur, nach Typ, 2019–2028 (in Mio. USD)
TABELLE 604 Malaysischer Markt für Wellpappkartons, nach Typ, 2019–2028 (in Mio. USD)
TABELLE 605 – Malaysischer Markt für Wellpappkartons, nach Typ, 2019–2028 (Millionen Einheiten)
TABELLE 606 Malaysischer Markt für Wellpappkartons, nach Material, 2019–2028 (in Mio. USD)
TABELLE 607 Malaysischer Markt für Wellpappekartons, nach Flöten, 2019–2028 (in Mio. USD)
TABELLE 608 Malaysischer Markt für Wellpappkartons, nach Stil, 2019–2028 (in Mio. USD)
TABELLE 609 Malaysischer Markt für Wellpappkartons, nach Druckverfahren, 2019–2028 (in Mio. USD)
TABELLE 610 Malaysischer Markt für Wellpappkartons, nach Endverbraucher, 2019–2028 (in Mio. USD)
TABELLE 611 – Malaysischer Markt für Lebensmittel und Getränke in Wellpappe, nach Endverbraucher, 2019–2028 (in Mio. USD)
TABELLE 612 Malaysischer Markt für Lebensmittel in Wellpappe, nach Lebensmittelendverbraucher, 2019–2028 (in Mio. USD)
TABELLE 613 Malaysia: Markt für alkoholfreie Getränke in Wellpappe, nach Endverbraucher alkoholfreier Getränke, 2019–2028 (in Mio. USD)
TABELLE 614 Malaysia: Markt für alkoholische Getränke in Wellpappe, nach Endverbraucher alkoholischer Getränke, 2019–2028 (in Mio. USD)
TABELLE 615 – Malaysischer Markt für Lebensmittel und Getränke in Wellpappe, nach Typ, 2019–2028 (in Mio. USD)
TABELLE 616 Malaysia: Gesundheitswesen und Pharmazeutika im Wellpappenmarkt, nach Typ, 2019–2028 (in Mio. USD)
TABELLE 617 Malaysia – Versand und Logistik im Wellpappkartonmarkt, nach Typ, 2019–2028 (in Mio. USD)
TABELLE 618 Malaysia E-Commerce im Wellpappenmarkt, nach Typ, 2019–2028 (in Mio. USD)
TABELLE 619 Malaysischer Markt für Haushaltsprodukte im Wellpappkarton, nach Endverbraucher von Haushaltsprodukten, 2019–2028 (in Mio. USD)
TABELLE 620 Malaysischer Markt für Haushaltsprodukte in Wellpappe, nach Typ, 2019–2028 (in Mio. USD)
TABELLE 621 Malaysia: Markt für Elektronik in Wellpappe, nach Typ, 2019–2028 (in Mio. USD)
TABELLE 622 Malaysia: Markt für Kosmetika in Wellpappe, nach Kosmetik-Endverbraucher, 2019–2028 (in Mio. USD)
TABELLE 623 Malaysia: Markt für Kosmetika in Wellpappe, nach Typ, 2019–2028 (in Mio. USD)
TABELLE 624 Malaysischer Markt für Körperpflegeprodukte in Wellpappe, nach Typ, 2019–2028 (in Mio. USD)
TABELLE 625 – Malaysischer Markt für Textilien in Wellpappe, nach Typ, 2019–2028 (in Mio. USD)
TABELLE 626 Sonstige Akteure im malaysischen Wellpappkartonmarkt, nach Typ, 2019–2028 (in Mio. USD)
TABELLE 627 Markt für Wellpappkartons in Thailand, nach Typ, 2019–2028 (in Mio. USD)
TABELLE 628 Markt für Wellpappkartons in Thailand, nach Typ, 2019–2028 (Millionen Einheiten)
TABELLE 629 Thailand: Markt für Wellpappekartons, nach Material, 2019–2028 (in Mio. USD)
TABELLE 630 Thailand: Markt für Wellpappekartons, nach Flöten, 2019–2028 (in Mio. USD)
TABELLE 631: Thailands Markt für Wellpappkartons, nach Stil, 2019–2028 (in Mio. USD)
TABELLE 632 Markt für Wellpappekartons in Thailand, nach Druckverfahren, 2019–2028 (in Mio. USD)
TABELLE 633: Markt für Wellpappe in Thailand, nach Endverbraucher, 2019–2028 (in Mio. USD)
TABELLE 634 Thailand – Markt für Lebensmittel und Getränke in Wellpappe, nach Endverbraucher, 2019–2028 (in Mio. USD)
TABELLE 635 Thailand – Markt für Lebensmittel in Wellpappe, nach Lebensmittelendverbraucher, 2019–2028 (in Mio. USD)
TABELLE 636 Thailand: Markt für alkoholfreie Getränke in Wellpappe, nach Endverbraucher alkoholfreier Getränke, 2019–2028 (in Mio. USD)
TABELLE 637 Thailand – Markt für alkoholische Getränke in Wellpappe, nach Endverbraucher alkoholischer Getränke, 2019–2028 (in Mio. USD)
TABELLE 638 Thailand – Markt für Lebensmittel und Getränke in Wellpappe, nach Typ, 2019–2028 (in Mio. USD)
TABELLE 639 Thailand: Gesundheitswesen und Pharmazeutika im Wellpappenmarkt, nach Typ, 2019–2028 (in Mio. USD)
TABELLE 640 Thailand – Versand und Logistik im Wellpappkartonmarkt, nach Typ, 2019–2028 (in Mio. USD)
TABELLE 641 E-Commerce im thailändischen Markt für Wellpappe, nach Typ, 2019–2028 (in Mio. USD)
TABELLE 642 Markt für Haushaltsprodukte in Wellpappe in Thailand, nach Endverbraucher von Haushaltsprodukten, 2019–2028 (in Mio. USD)
TABELLE 643 Markt für Haushaltsprodukte in Wellpappe in Thailand, nach Typ, 2019–2028 (in Mio. USD)
TABELLE 644 Thailand: Markt für Elektronik in Wellpappe, nach Typ, 2019–2028 (in Mio. USD)
TABELLE 645 Thailand: Markt für Kosmetika in Wellpappe, nach Kosmetik-Endverbraucher, 2019–2028 (in Mio. USD)
TABELLE 646 Thailand: Markt für Kosmetika in Wellpappe, nach Typ, 2019–2028 (in Mio. USD)
TABELLE 647 Thailand – Markt für Körperpflegeprodukte in Wellpappe, nach Typ, 2019–2028 (in Mio. USD)
TABELLE 648 Thailand – Markt für Textilien in Wellpappe, nach Typ, 2019–2028 (in Mio. USD)
TABELLE 649 Sonstige Akteure im thailändischen Wellpappenmarkt, nach Typ, 2019–2028 (in Mio. USD)
TABELLE 650 Markt für Wellpappkartons auf den Philippinen, nach Typ, 2019–2028 (in Mio. USD)
TABELLE 651 Markt für Wellpappkartons auf den Philippinen, nach Typ, 2019–2028 (Millionen Einheiten)
TABELLE 652 Markt für Wellpappkartons auf den Philippinen, nach Material, 2019–2028 (in Mio. USD)
TABELLE 653 Markt für Wellpappekartons auf den Philippinen, nach Flöten, 2019–2028 (in Mio. USD)
TABELLE 654 Markt für Wellpappkartons auf den Philippinen, nach Stil, 2019–2028 (in Mio. USD)
TABELLE 655: Philippinischer Markt für Wellpappkartons nach Druckverfahren, 2019–2028 (in Mio. USD)
TABELLE 656: Philippinischer Markt für Wellpappkartons, nach Endverbraucher, 2019–2028 (in Mio. USD)
TABELLE 657 – Markt für Lebensmittel und Getränke in Wellpappe auf den Philippinen, nach Endverbraucher, 2019–2028 (in Mio. USD)
TABELLE 658 Philippinischer Markt für Lebensmittel in Wellpappe, nach Lebensmittelendverbraucher, 2019–2028 (in Mio. USD)
TABELLE 659 – Markt für alkoholfreie Getränke in Wellpappe auf den Philippinen, nach Endverbrauchern alkoholfreier Getränke, 2019–2028 (in Mio. USD)
TABELLE 660 Markt für alkoholische Getränke in Wellpappe auf den Philippinen, nach Endverbraucher alkoholischer Getränke, 2019–2028 (in Mio. USD)
TABELLE 661 – Markt für Lebensmittel und Getränke in Wellpappe auf den Philippinen, nach Typ, 2019–2028 (in Mio. USD)
TABELLE 662 Philippinen: Gesundheitswesen und Pharmazeutika im Wellpappenmarkt, nach Typ, 2019–2028 (in Mio. USD)
TABELLE 663 – Versand und Logistik auf den Philippinen im Markt für Wellpappkartons, nach Typ, 2019–2028 (in Mio. USD)
TABELLE 664 E-Commerce auf den Philippinen im Wellpappenmarkt, nach Typ, 2019–2028 (in Mio. USD)
TABELLE 665: Philippinischer Markt für Haushaltsprodukte im Wellpappenmarkt, nach Endverbraucher von Haushaltsprodukten, 2019–2028 (in Mio. USD)
TABELLE 666: Markt für Haushaltsprodukte in Wellpappe auf den Philippinen, nach Typ, 2019–2028 (in Mio. USD)
TABELLE 667 Philippinen: Markt für Elektronik in Wellpappe, nach Typ, 2019–2028 (in Mio. USD)
TABELLE 668: Philippinen – Markt für Kosmetika in Wellpappe, nach Kosmetik-Endverbraucher, 2019–2028 (in Mio. USD)
TABELLE 669: Philippinen: Markt für Kosmetika in Wellpappe, nach Typ, 2019–2028 (in Mio. USD)
TABELLE 670 Philippinischer Markt für Körperpflegeprodukte in Wellpappe, nach Typ, 2019–2028 (in Mio. USD)
TABELLE 671 Philippinischer Markt für Textilien in Wellpappe, nach Typ, 2019–2028 (in Mio. USD)
TABELLE 672 Sonstige Anbieter auf dem philippinischen Markt für Wellpappenkartons, nach Typ, 2019–2028 (in Mio. USD)
TABELLE 673 Restlicher Markt für Wellpappkartons im asiatisch-pazifischen Raum, nach Typ, 2019–2028 (in Mio. USD)
TABELLE 674 Restlicher Markt für Wellpappkartons im asiatisch-pazifischen Raum, nach Typ, 2019–2028 (Millionen Einheiten)
TABELLE 675 Markt für Wellpappkartons im Nahen Osten und in Afrika, NACH LÄNDERN, 2019–2028 (in Mio. USD)
TABELLE 676 Markt für Wellpappkartons im Nahen Osten und in Afrika, NACH LÄNDERN, 2019–2028 (Millionen Einheiten)
TABELLE 677 Markt für Wellpappkartons im Nahen Osten und in Afrika, nach Typ, 2019–2028 (in Mio. USD)
TABELLE 678 Markt für Wellpappkartons im Nahen Osten und in Afrika, nach Typ, 2019–2028 (Millionen Einheiten)
TABELLE 679 Markt für Wellpappe im Nahen Osten und in Afrika, nach Material, 2019–2028 (in Mio. USD)
TABELLE 680 Markt für Wellpappe im Nahen Osten und in Afrika, nach Flöten, 2019–2028 (in Mio. USD)
TABELLE 681 Markt für Wellpappkartons im Nahen Osten und in Afrika, nach Stil, 2019–2028 (in Mio. USD)
TABELLE 682 Markt für Wellpappekartons im Nahen Osten und in Afrika, nach Druckverfahren, 2019–2028 (in Mio. USD)
TABELLE 683 Markt für Wellpappekartons im Nahen Osten und in Afrika, nach Endverbraucher, 2019–2028 (in Mio. USD)
TABELLE 684 Markt für Lebensmittel und Getränke in Wellpappe im Nahen Osten und in Afrika, nach Endverbraucher, 2019–2028 (in Mio. USD)
TABELLE 685 – Markt für Lebensmittel in Wellpappe im Nahen Osten und in Afrika, nach Lebensmittelendverbraucher, 2019–2028 (in Mio. USD)
TABELLE 686 – Markt für alkoholfreie Getränke in Wellpappe im Nahen Osten und Afrika, nach Endverbrauchern alkoholfreier Getränke, 2019–2028 (in Mio. USD)
TABELLE 687 Markt für alkoholische Getränke in Wellpappe im Nahen Osten und in Afrika, nach Endverbraucher alkoholischer Getränke, 2019–2028 (in Mio. USD)
TABELLE 688 Markt für Lebensmittel und Getränke in Wellpappe im Nahen Osten und in Afrika, nach Typ, 2019–2028 (in Mio. USD)
TABELLE 689: Gesundheitswesen und Pharmazeutika im Nahen Osten und Afrika im Markt für Wellpappe, nach Typ, 2019–2028 (in Mio. USD)
TABELLE 690 Versand und Logistik im Wellpappkartonmarkt im Nahen Osten und in Afrika, nach Typ, 2019–2028 (in Mio. USD)
TABELLE 691 E-Commerce im Wellpappenmarkt im Nahen Osten und Afrika, nach Typ, 2019–2028 (in Mio. USD)
TABELLE 692 Markt für Haushaltsprodukte im Nahen Osten und Afrika in Wellpappe, nach Endverbraucher von Haushaltsprodukten, 2019–2028 (in Mio. USD)
TABELLE 693 Markt für Haushaltsprodukte im Nahen Osten und Afrika in Wellpappe, nach Typ, 2019–2028 (in Mio. USD)
TABELLE 694 Markt für Elektronik in Wellpappe im Nahen Osten und in Afrika, nach Typ, 2019–2028 (in Mio. USD)
TABELLE 695 Markt für Kosmetika in Wellpappe im Nahen Osten und in Afrika, nach Kosmetik-Endverbraucher, 2019–2028 (in Mio. USD)
TABELLE 696 Markt für Kosmetika in Wellpappe im Nahen Osten und in Afrika, nach Typ, 2019–2028 (in Mio. USD)
TABELLE 697 Markt für Körperpflegeprodukte in Wellpappe im Nahen Osten und in Afrika, nach Typ, 2019–2028 (in Mio. USD)
TABELLE 698 Markt für Textilien in Wellpappe im Nahen Osten und in Afrika, nach Typ, 2019–2028 (in Mio. USD)
TABELLE 699 Sonstige Akteure im Wellpappenmarkt im Nahen Osten und Afrika, nach Typ, 2019–2028 (in Mio. USD)
TABELLE 700 Markt für Wellpappkartons in den Vereinigten Arabischen Emiraten, nach Typ, 2019–2028 (in Mio. USD)
TABELLE 701 Markt für Wellpappkartons in den Vereinigten Arabischen Emiraten, nach Typ, 2019–2028 (Millionen Einheiten)
TABELLE 702 Markt für Wellpappkartons in den Vereinigten Arabischen Emiraten, nach Material, 2019–2028 (in Mio. USD)
TABELLE 703 Markt für Wellpappekartons in den Vereinigten Arabischen Emiraten, nach Flöten, 2019–2028 (in Mio. USD)
TABELLE 704 Markt für Wellpappkartons in den Vereinigten Arabischen Emiraten, nach Stil, 2019–2028 (in Mio. USD)
TABELLE 705 Markt für Wellpappkartons in den Vereinigten Arabischen Emiraten, nach Druckverfahren, 2019–2028 (in Mio. USD)
TABELLE 706 Markt für Wellpappkartons in den Vereinigten Arabischen Emiraten, nach Endverbraucher, 2019–2028 (in Mio. USD)
TABELLE 707 Markt für Lebensmittel und Getränke in Wellpappe in den Vereinigten Arabischen Emiraten, nach Endverbraucher, 2019–2028 (in Mio. USD)
TABELLE 708 Markt für Lebensmittel in Wellpappe in den Vereinigten Arabischen Emiraten, nach Lebensmittelendverbraucher, 2019–2028 (in Mio. USD)
TABELLE 709 Vereinigte Arabische Emirate – Markt für alkoholfreie Getränke in Wellpappe, nach Endverbrauchern alkoholfreier Getränke, 2019–2028 (in Mio. USD)
TABELLE 710 Markt für alkoholische Getränke in Wellpappe in den Vereinigten Arabischen Emiraten, nach Endverbraucher alkoholischer Getränke, 2019–2028 (in Mio. USD)
TABELLE 711 – Markt für Lebensmittel und Getränke in Wellpappe in den Vereinigten Arabischen Emiraten, nach Typ, 2019–2028 (in Mio. USD)
TABELLE 712 – Gesundheitswesen und Pharmazeutika in den Vereinigten Arabischen Emiraten im Markt für Wellpappe, nach Typ, 2019–2028 (in Mio. USD)
TABELLE 713 Versand und Logistik im Wellpappkartonmarkt der Vereinigten Arabischen Emirate, nach Typ, 2019–2028 (in Mio. USD)
TABELLE 714 E-Commerce im Wellpappenmarkt der Vereinigten Arabischen Emirate, nach Typ, 2019–2028 (in Mio. USD)
TABELLE 715 – Markt für Haushaltsprodukte in Wellpappe in den Vereinigten Arabischen Emiraten, nach Endverbraucher von Haushaltsprodukten, 2019–2028 (in Mio. USD)
TABELLE 716 – Markt für Haushaltsprodukte in Wellpappe in den Vereinigten Arabischen Emiraten, nach Typ, 2019–2028 (in Mio. USD)
TABELLE 717 – Markt für Elektronik in Wellpappe in den Vereinigten Arabischen Emiraten, nach Typ, 2019–2028 (in Mio. USD)
TABELLE 718 Markt für Kosmetika in Wellpappe in den Vereinigten Arabischen Emiraten, nach Kosmetik-Endverbraucher, 2019–2028 (in Mio. USD)
TABELLE 719 Markt für Kosmetika in Wellpappe in den Vereinigten Arabischen Emiraten, nach Typ, 2019–2028 (in Mio. USD)
TABELLE 720 Markt für Körperpflegeprodukte in Wellpappe in den Vereinigten Arabischen Emiraten, nach Typ, 2019–2028 (in Mio. USD)
TABELLE 721 – Markt für Textilien in Wellpappe in den Vereinigten Arabischen Emiraten, nach Typ, 2019–2028 (in Mio. USD)
TABELLE 722: Sonstige Akteure im Wellpappenmarkt der Vereinigten Arabischen Emirate, nach Typ, 2019–2028 (in Mio. USD)
TABELLE 723 SAUDI-ARABIEN – Markt für Wellpappkartons, nach Typ, 2019–2028 (in Mio. USD)
TABELLE 724 SAUDI-ARABIEN – Markt für Wellpappkartons, nach Typ, 2019–2028 (Millionen Einheiten)
TABELLE 725 SAUDI-ARABIEN – Markt für Wellpappkartons, nach Material, 2019–2028 (in Mio. USD)
TABELLE 726 SAUDI-ARABIEN – Markt für Wellpappekartons, nach Flöten, 2019–2028 (in Mio. USD)
TABELLE 727 SAUDI-ARABIEN – Markt für Wellpappkartons, nach Stil, 2019–2028 (in Mio. USD)
TABELLE 728 SAUDI-ARABIEN – Markt für Wellpappkartons, nach Druckverfahren, 2019–2028 (in Mio. USD)
TABELLE 729 SAUDI-ARABIEN – Markt für Wellpappkartons, nach Endverbraucher, 2019–2028 (in Mio. USD)
TABELLE 730 SAUDI-ARABIEN – Markt für Lebensmittel und Getränke in Wellpappe, nach Endverbraucher, 2019–2028 (in Mio. USD)
TABELLE 731 SAUDI-ARABIEN – Markt für Lebensmittel in Wellpappe, nach Lebensmittelendverbraucher, 2019–2028 (in Mio. USD)
TABELLE 732 SAUDI-ARABIEN – Markt für alkoholfreie Getränke in Wellpappe, nach Endverbrauchern alkoholfreier Getränke, 2019–2028 (in Mio. USD)
TABELLE 733 SAUDI-ARABIEN – Markt für alkoholische Getränke in Wellpappe, nach Endverbraucher alkoholischer Getränke, 2019–2028 (in Mio. USD)
TABELLE 734 SAUDI-ARABIEN – Markt für Lebensmittel und Getränke in Wellpappe, nach Typ, 2019–2028 (in Mio. USD)
TABELLE 735 SAUDI-ARABIEN – Gesundheitswesen und Pharmazeutika im Markt für Wellpappe, nach Typ, 2019–2028 (in Mio. USD)
TABELLE 736 SAUDI-ARABIEN – Versand und Logistik im Markt für Wellpappkartons, nach Typ, 2019–2028 (in Mio. USD)
TABELLE 737 SAUDI-ARABIEN – E-Commerce im Wellpappenmarkt, nach Typ, 2019–2028 (in Mio. USD)
TABELLE 738 SAUDI-ARABIEN – Markt für Haushaltsprodukte in Wellpappe, nach Endverbraucher von Haushaltsprodukten, 2019–2028 (in Mio. USD)
TABELLE 739 SAUDI-ARABIEN – Markt für Haushaltsprodukte in Wellpappe, nach Typ, 2019–2028 (in Mio. USD)
TABELLE 740 SAUDI-ARABIEN – Markt für Elektronik im Wellpappkarton, nach Typ, 2019–2028 (in Mio. USD)
TABELLE 741 SAUDI-ARABIEN – Markt für Kosmetika in Wellpappe, nach Kosmetik-Endverbraucher, 2019–2028 (in Mio. USD)
TABELLE 742 SAUDI-ARABIEN – Markt für Kosmetika in Wellpappe, nach Typ, 2019–2028 (in Mio. USD)
TABELLE 743 SAUDI-ARABIEN – Markt für Körperpflegeprodukte in Wellpappe, nach Typ, 2019–2028 (in Mio. USD)
TABELLE 744 SAUDI-ARABIEN – Markt für Textilien im Wellpappkarton, nach Typ, 2019–2028 (in Mio. USD)
TABELLE 745 SAUDI-ARABIEN Sonstige Akteure im Wellpappenmarkt, nach Typ, 2019–2028 (in Mio. USD)
TABELLE 746 Südafrikanischer Markt für Wellpappkartons, nach Typ, 2019–2028 (in Mio. USD)
TABELLE 747 Südafrikanischer Markt für Wellpappkartons, nach Typ, 2019–2028 (Millionen Einheiten)
TABELLE 748 Südafrikanischer Markt für Wellpappkartons, nach Material, 2019–2028 (in Mio. USD)
TABELLE 749 Südafrikanischer Markt für Wellpappekartons, nach Flöten, 2019–2028 (in Mio. USD)
TABELLE 750 Südafrikanischer Markt für Wellpappkartons, nach Stil, 2019–2028 (in Mio. USD)
TABELLE 751 Südafrikanischer Markt für Wellpappkartons, nach Druckverfahren, 2019–2028 (in Mio. USD)
TABELLE 752 Südafrikanischer Markt für Wellpappkartons, nach Endverbraucher, 2019–2028 (in Mio. USD)
TABELLE 753 Südafrikanischer Markt für Lebensmittel und Getränke in Wellpappe, nach Endverbraucher, 2019–2028 (in Mio. USD)
TABELLE 754 Südafrikanischer Markt für Lebensmittel in Wellpappe, nach Lebensmittelendverbraucher, 2019–2028 (in Mio. USD)
TABELLE 755 Südafrikanischer Markt für alkoholfreie Getränke in Wellpappe, nach Endverbraucher alkoholfreier Getränke, 2019–2028 (in Mio. USD)
TABELLE 756 Südafrikanischer Markt für alkoholische Getränke in Wellpappe, nach Endverbraucher alkoholischer Getränke, 2019–2028 (in Mio. USD)
TABELLE 757 Südafrikanischer Markt für Lebensmittel und Getränke in Wellpappe, nach Typ, 2019–2028 (in Mio. USD)
TABELLE 758 Südafrikanischer Markt für Gesundheitswesen und Pharmazeutika im Wellpappenmarkt, nach Typ, 2019–2028 (in Mio. USD)
TABELLE 759 Südafrikanischer Markt für Versand und Logistik im Wellpappkartonmarkt, nach Typ, 2019–2028 (in Mio. USD)
TABELLE 760 Südafrikanischer E-Commerce-Markt für Wellpappkartons, nach Typ, 2019–2028 (in Mio. USD)
TABELLE 761 Südafrikanischer Markt für Haushaltsprodukte in Wellpappe, nach Endverbraucher von Haushaltsprodukten, 2019–2028 (in Mio. USD)
TABELLE 762 Südafrikanischer Markt für Haushaltsprodukte in Wellpappe, nach Typ, 2019–2028 (in Mio. USD)
TABELLE 763 Südafrikanischer Markt für Elektronik in Wellpappe, nach Typ, 2019–2028 (in Mio. USD)
TABELLE 764 Südafrikanischer Markt für Kosmetika in Wellpappe, nach Kosmetik-Endverbraucher, 2019–2028 (in Mio. USD)
TABELLE 765 Südafrikanischer Markt für Kosmetika in Wellpappe, nach Typ, 2019–2028 (in Mio. USD)
TABELLE 766 Südafrikanischer Markt für Körperpflegeprodukte in Wellpappe, nach Typ, 2019–2028 (in Mio. USD)
TABELLE 767 Südafrikanischer Markt für Textilien in Wellpappe, nach Typ, 2019–2028 (in Mio. USD)
TABELLE 768 Südafrikanischer Markt für Wellpappkartons, nach Typ, 2019–2028 (in Mio. USD)
TABELLE 769 Ägyptischer Markt für Wellpappkartons, nach Typ, 2019–2028 (in Mio. USD)
TABELLE 770 Ägyptischer Markt für Wellpappkartons, nach Typ, 2019–2028 (Millionen Einheiten)
TABELLE 771 Ägyptischer Markt für Wellpappkartons, nach Material, 2019–2028 (in Mio. USD)
TABELLE 772 Ägyptischer Markt für Wellpappekartons, nach Flöten, 2019–2028 (in Mio. USD)
TABELLE 773 Ägyptischer Markt für Wellpappkartons, nach Stil, 2019–2028 (in Mio. USD)
TABELLE 774 Ägyptischer Markt für Wellpappkartons, nach Druckverfahren, 2019–2028 (in Mio. USD)
TABELLE 775 Ägyptischer Markt für Wellpappkartons, nach Endverbraucher, 2019–2028 (in Mio. USD)
TABELLE 776 – Ägyptischer Markt für Lebensmittel und Getränke in Wellpappe, nach Endverbraucher, 2019–2028 (in Mio. USD)
TABELLE 777 – Ägyptischer Markt für Lebensmittel in Wellpappe, nach Lebensmittelendverbraucher, 2019–2028 (in Mio. USD)
TABELLE 778 – Ägyptischer Markt für alkoholfreie Getränke in Wellpappe, nach Endverbrauchern alkoholfreier Getränke, 2019–2028 (in Mio. USD)
TABELLE 779 Ägyptischer Markt für alkoholische Getränke in Wellpappe, nach Endverbraucher alkoholischer Getränke, 2019–2028 (in Mio. USD)
TABELLE 780 – Ägyptischer Markt für Lebensmittel und Getränke in Wellpappe, nach Typ, 2019–2028 (in Mio. USD)
TABELLE 781 Ägyptischer Markt für Gesundheitswesen und Pharmazeutika im Wellpappenmarkt, nach Typ, 2019–2028 (in Mio. USD)
TABELLE 782 Ägypten – Versand und Logistik im Wellpappkartonmarkt, nach Typ, 2019–2028 (in Mio. USD)
TABELLE 783 E-Commerce im ägyptischen Markt für Wellpappkartons, nach Typ, 2019–2028 (in Mio. USD)
TABELLE 784 Ägyptischer Markt für Haushaltsprodukte im Wellpappkarton, nach Endverbraucher von Haushaltsprodukten, 2019–2028 (in Mio. USD)
TABELLE 785 – Ägyptischer Markt für Haushaltsprodukte in Wellpappe, nach Typ, 2019–2028 (in Mio. USD)
TABELLE 786 – Ägyptischer Markt für Elektronik in Wellpappe, nach Typ, 2019–2028 (in Mio. USD)
TABELLE 787 Ägyptischer Markt für Kosmetika in Wellpappe, nach Kosmetik-Endverbraucher, 2019–2028 (in Mio. USD)
TABELLE 788 Ägyptischer Markt für Kosmetika in Wellpappe, nach Typ, 2019–2028 (in Mio. USD)
TABELLE 789 Ägyptischer Markt für Körperpflegeprodukte in Wellpappe, nach Typ, 2019–2028 (in Mio. USD)
TABELLE 790 Ägyptischer Markt für Textilien in Wellpappe, nach Typ, 2019–2028 (in Mio. USD)
TABELLE 791 Sonstige Akteure im ägyptischen Markt für Wellpappe, nach Typ, 2019–2028 (in Mio. USD)
TABELLE 792 Israelischer Markt für Wellpappkartons, nach Typ, 2019–2028 (in Mio. USD)
TABELLE 793 Israelischer Markt für Wellpappkartons, nach Typ, 2019–2028 (Millionen Einheiten)
TABELLE 794 Israelischer Markt für Wellpappkartons, nach Material, 2019–2028 (in Mio. USD)
TABELLE 795 Israelischer Markt für Wellpappekartons, nach Flöten, 2019–2028 (in Mio. USD)
TABELLE 796 Israelischer Markt für Wellpappkartons, nach Stil, 2019–2028 (in Mio. USD)
TABELLE 797 Israelischer Markt für Wellpappkartons, nach Druckverfahren, 2019–2028 (in Mio. USD)
TABELLE 798 Israelischer Markt für Wellpappkartons, nach Endverbraucher, 2019–2028 (in Mio. USD)
TABELLE 799 Israelischer Markt für Lebensmittel und Getränke in Wellpappe, nach Endverbraucher, 2019–2028 (in Mio. USD)
TABELLE 800 Israelischer Markt für Lebensmittel in Wellpappe, nach Lebensmittelendverbraucher, 2019–2028 (in Mio. USD)
TABELLE 801 Israelischer Markt für alkoholfreie Getränke in Wellpappe, nach Endverbraucher alkoholfreier Getränke, 2019–2028 (in Mio. USD)
TABELLE 802 Israelischer Markt für alkoholische Getränke in Wellpappe, nach Endverbraucher alkoholischer Getränke, 2019–2028 (in Mio. USD)
TABELLE 803 Israelischer Markt für Lebensmittel und Getränke in Wellpappe, nach Typ, 2019–2028 (in Mio. USD)
TABELLE 804 Israelischer Markt für Gesundheitswesen und Pharmazeutika im Wellpappenmarkt, nach Typ, 2019–2028 (in Mio. USD)
TABELLE 805 Israelischer Versand und Logistik im Wellpappkartonmarkt, nach Typ, 2019–2028 (in Mio. USD)
TABELLE 806 Israelischer E-Commerce-Markt für Wellpappkartons, nach Typ, 2019–2028 (in Mio. USD)
TABELLE 807 Israelischer Markt für Haushaltsprodukte im Wellpappkarton, nach Endverbraucher von Haushaltsprodukten, 2019–2028 (in Mio. USD)
TABELLE 808 Israelischer Markt für Haushaltsprodukte in Wellpappe, nach Typ, 2019–2028 (in Mio. USD)
TABELLE 809 Israelischer Markt für Elektronik in Wellpappe, nach Typ, 2019–2028 (in Mio. USD)
TABELLE 810 Israelischer Markt für Kosmetika in Wellpappe, nach Kosmetik-Endverbraucher, 2019–2028 (in Mio. USD)
TABELLE 811 Israelischer Markt für Kosmetika in Wellpappe, nach Typ, 2019–2028 (in Mio. USD)
TABELLE 812 Israelischer Markt für Körperpflegeprodukte in Wellpappe, nach Typ, 2019–2028 (in Mio. USD)
TABELLE 813 Israelischer Markt für Textilien in Wellpappe, nach Typ, 2019–2028 (in Mio. USD)
TABELLE 814 Israelische Sonstige im Wellpappenmarkt, nach Typ, 2019–2028 (in Mio. USD)
TABELLE 815 Markt für Wellpappkartons im übrigen Nahen Osten und Afrika, nach Typ, 2019–2028 (in Mio. USD)
TABELLE 816 – Markt für Wellpappkartons im übrigen Nahen Osten und Afrika, nach Typ, 2019–2028 (Millionen Einheiten)
TABELLE 817 Südamerikanischer Markt für Wellpappkartons, NACH LAND, 2019–2028 (in Mio. USD)
TABELLE 818 Südamerikanischer Markt für Wellpappkartons, NACH LAND, 2019–2028 (Millionen Einheiten)
TABELLE 819 Südamerikanischer Markt für Wellpappkartons, nach Typ, 2019–2028 (in Mio. USD)
TABELLE 820 Südamerikanischer Markt für Wellpappkartons, nach Typ, 2019–2028 (Millionen Einheiten)
TABELLE 821 Südamerikanischer Markt für Wellpappkartons, nach Material, 2019–2028 (in Mio. USD)
TABELLE 822 Südamerikanischer Markt für Wellpappe, nach Flöten, 2019–2028 (in Mio. USD)
TABELLE 823 Südamerikanischer Markt für Wellpappkartons, nach Stil, 2019–2028 (in Mio. USD)
TABELLE 824 Südamerikanischer Markt für Wellpappkartons, nach Druckverfahren, 2019–2028 (in Mio. USD)
TABELLE 825 Südamerikanischer Markt für Wellpappkartons, nach Endverbraucher, 2019–2028 (in Mio. USD)
TABELLE 826 Südamerikanischer Markt für Lebensmittel und Getränke in Wellpappe, nach Endverbraucher, 2019–2028 (in Mio. USD)
TABELLE 827 Südamerikanischer Markt für Lebensmittel in Wellpappe, nach Lebensmittelendverbraucher, 2019–2028 (in Mio. USD)
TABELLE 828 Südamerikanischer Markt für alkoholfreie Getränke in Wellpappe, nach Endverbraucher alkoholfreier Getränke, 2019–2028 (in Mio. USD)
TABELLE 829 Südamerikanischer Markt für alkoholische Getränke in Wellpappe, nach Endverbraucher alkoholischer Getränke, 2019–2028 (in Mio. USD)
TABELLE 830 Südamerikanischer Markt für Lebensmittel und Getränke in Wellpappe, nach Typ, 2019–2028 (in Mio. USD)
TABELLE 831 Südamerikanischer Markt für Gesundheitswesen und Pharmazeutika im Wellpappenmarkt, nach Typ, 2019–2028 (in Mio. USD)
TABELLE 832 Südamerikanischer Versand und Logistik im Wellpappkartonmarkt, nach Typ, 2019–2028 (in Mio. USD)
TABELLE 833 Südamerikanischer E-Commerce-Markt für Wellpappkartons, nach Typ, 2019–2028 (in Mio. USD)
TABELLE 834 Südamerikanischer Markt für Haushaltsprodukte in Wellpappe, nach Endverbraucher von Haushaltsprodukten, 2019–2028 (in Mio. USD)
TABELLE 835 Südamerikanischer Markt für Haushaltsprodukte in Wellpappe, nach Typ, 2019–2028 (in Mio. USD)
TABELLE 836 Südamerikanischer Markt für Elektronik in Wellpappe, nach Typ, 2019–2028 (in Mio. USD)
TABELLE 837 Südamerikanischer Markt für Kosmetika in Wellpappe, nach Kosmetik-Endverbraucher, 2019–2028 (in Mio. USD)
TABELLE 838 Südamerikanischer Markt für Kosmetika in Wellpappe, nach Typ, 2019–2028 (in Mio. USD)
TABELLE 839 Südamerikanischer Markt für Körperpflegeprodukte in Wellpappe, nach Typ, 2019–2028 (in Mio. USD)
TABELLE 840 Südamerikanischer Markt für Textilien in Wellpappe, nach Typ, 2019–2028 (in Mio. USD)
TABELLE 841 Sonstige Akteure im südamerikanischen Wellpappenmarkt, nach Typ, 2019–2028 (in Mio. USD)
TABELLE 842 BRASILIEN – Markt für Wellpappkartons, nach Typ, 2019–2028 (in Mio. USD)
TABELLE 843 BRASILIEN: Markt für Wellpappkartons, nach Typ, 2019–2028 (Millionen Einheiten)
TABELLE 844 BRASILIEN – Markt für Wellpappkartons, nach Material, 2019–2028 (in Mio. USD)
TABELLE 845 BRASILIEN – Markt für Wellpappe, nach Flöten, 2019–2028 (in Mio. USD)
TABELLE 846 BRASILIEN – Markt für Wellpappkartons, nach Stil, 2019–2028 (in Mio. USD)
TABELLE 847 BRASILIEN – Markt für Wellpappekartons nach Druckverfahren, 2019–2028 (in Mio. USD)
TABELLE 848 BRASILIEN – Markt für Wellpappkartons, nach Endverbraucher, 2019–2028 (in Mio. USD)
TABELLE 849 BRASILIEN – Markt für Lebensmittel und Getränke in Wellpappe, nach Endverbraucher, 2019–2028 (in Mio. USD)
TABELLE 850 BRASILIEN – Markt für Lebensmittel in Wellpappe, nach Lebensmittelendverbraucher, 2019–2028 (in Mio. USD)
TABELLE 851 BRASILIEN: Markt für alkoholfreie Getränke in Wellpappe, nach Endverbraucher alkoholfreier Getränke, 2019–2028 (in Mio. USD)
TABELLE 852 BRASILIEN – Markt für alkoholische Getränke in Wellpappe, nach Endverbraucher alkoholischer Getränke, 2019–2028 (in Mio. USD)
TABELLE 853 BRASILIEN – Markt für Lebensmittel und Getränke in Wellpappe, nach Typ, 2019–2028 (in Mio. USD)
TABELLE 854 BRASILIEN – Gesundheitswesen und Pharmazeutika im Wellpappenmarkt, nach Typ, 2019–2028 (in Mio. USD)
TABELLE 855 BRASILIEN – Versand und Logistik im Wellpappkartonmarkt, nach Typ, 2019–2028 (in Mio. USD)
TABELLE 856 BRASILIEN E-Commerce im Wellpappenmarkt, nach Typ, 2019–2028 (in Mio. USD)
TABELLE 857 BRASILIEN – Markt für Haushaltsprodukte in Wellpappe, nach Endverbraucher von Haushaltsprodukten, 2019–2028 (in Mio. USD)
TABELLE 858 BRASILIEN – Markt für Haushaltsprodukte in Wellpappe, nach Typ, 2019–2028 (in Mio. USD)
TABELLE 859 BRASILIEN – Markt für Elektronik im Wellpappkarton, nach Typ, 2019–2028 (in Mio. USD)
TABELLE 860 BRASILIEN – Markt für Kosmetika in Wellpappe, nach Kosmetik-Endverbraucher, 2019–2028 (in Mio. USD)
TABELLE 861 BRASILIEN – Markt für Kosmetika in Wellpappe, nach Typ, 2019–2028 (in Mio. USD)
TABELLE 862 BRASILIEN – Markt für Körperpflegeprodukte in Wellpappe, nach Typ, 2019–2028 (in Mio. USD)
TABELLE 863 BRASILIEN – Markt für Textilien im Wellpappkarton, nach Typ, 2019–2028 (in Mio. USD)
TABELLE 864 BRASILIEN Sonstige Anbieter im Wellpappenmarkt, nach Typ, 2019–2028 (in Mio. USD)
TABELLE 865 – ARGENTINIEN: Markt für Wellpappkartons, nach Typ, 2019–2028 (in Mio. USD)
TABELLE 866 ARGENTINIEN: Markt für Wellpappkartons, nach Typ, 2019–2028 (Millionen Einheiten)
TABELLE 867 ARGENTINIEN: Markt für Wellpappe, nach Material, 2019–2028 (in Mio. USD)
TABELLE 868 ARGENTINIEN: Markt für Wellpappe, nach Flöten, 2019–2028 (in Mio. USD)
TABELLE 869 – ARGENTINIEN: Markt für Wellpappkartons, nach Stil, 2019–2028 (in Mio. USD)
TABELLE 870 – ARGENTINIEN – Markt für Wellpappekartons, nach Druckverfahren, 2019–2028 (in Mio. USD)
TABELLE 871 – ARGENTINISCHER Markt für Wellpappkartons, nach Endverbraucher, 2019–2028 (in Mio. USD)
TABELLE 872 ARGENTINIEN – Markt für Lebensmittel und Getränke in Wellpappe, nach Endverbraucher, 2019–2028 (in Mio. USD)
TABELLE 873 ARGENTINIEN – Markt für Lebensmittel in Wellpappe, nach Lebensmittelendverbraucher, 2019–2028 (in Mio. USD)
TABELLE 874 – ARGENTINIEN: Markt für alkoholfreie Getränke in Wellpappe, nach Endverbraucher alkoholfreier Getränke, 2019–2028 (in Mio. USD)
TABELLE 875 – ARGENTINIEN – Markt für alkoholische Getränke in Wellpappe, nach Endverbraucher alkoholischer Getränke, 2019–2028 (in Mio. USD)
TABELLE 876 ARGENTINIEN – Markt für Lebensmittel und Getränke in Wellpappe, nach Typ, 2019–2028 (in Mio. USD)
TABELLE 877 ARGENTINIEN: Gesundheitswesen und Pharmazeutika im Wellpappenmarkt, nach Typ, 2019–2028 (in Mio. USD)
TABELLE 878 ARGENTINIEN – Versand und Logistik im Wellpappkartonmarkt, nach Typ, 2019–2028 (in Mio. USD)
TABELLE 879 ARGENTINIEN E-Commerce im Wellpappenmarkt, nach Typ, 2019–2028 (in Mio. USD)
TABELLE 880 ARGENTINIEN – Markt für Haushaltsprodukte in Wellpappe, nach Endverbraucher von Haushaltsprodukten, 2019–2028 (in Mio. USD)
TABELLE 881 ARGENTINIEN – Markt für Haushaltsprodukte in Wellpappe, nach Typ, 2019–2028 (in Mio. USD)
TABELLE 882 ARGENTINIEN – Markt für Elektronik im Wellpappkarton, nach Typ, 2019–2028 (in Mio. USD)
TABELLE 883 ARGENTINIEN – Markt für Kosmetika in Wellpappe, nach Kosmetik-Endverbraucher, 2019–2028 (in Mio. USD)
TABELLE 884 ARGENTINIEN: Markt für Kosmetika in Wellpappe, nach Typ, 2019–2028 (in Mio. USD)
TABELLE 885 – ARGENTINIEN – Markt für Körperpflegeprodukte in Wellpappe, nach Typ, 2019–2028 (in Mio. USD)
TABELLE 886 ARGENTINIEN – Markt für Textilien in Wellpappe, nach Typ, 2019–2028 (in Mio. USD)
TABELLE 887 ARGENTINIEN Sonstige Anbieter im Wellpappenmarkt, nach Typ, 2019–2028 (in Mio. USD)
TABELLE 888 Markt für Wellpappkartons im übrigen Südamerika, nach Typ, 2019–2028 (in Mio. USD)
TABELLE 889 Markt für Wellpappkartons im übrigen Südamerika, nach Typ, 2019–2028 (Millionen Einheiten)
Abbildungsverzeichnis
ABBILDUNG 1 GLOBALER MARKT FÜR WELLPAPPE: Segmentierung
ABBILDUNG 2 GLOBALER MARKT FÜR WELLPAPPE: Datentriangulation
ABBILDUNG 3 GLOBALER MARKT FÜR WELLPAPPE: DROC-ANALYSE
ABBILDUNG 4 GLOBALER MARKT FÜR WELLPAPPE: Globale VS. regionale MARKTanalyse
ABBILDUNG 5 GLOBALER MARKT FÜR WELLPAPPE: Unternehmensforschungsanalyse
ABBILDUNG 6 GLOBALER MARKT FÜR WELLPAPPE: DIE MATERIALLEBENSLINIENKURVE
ABBILDUNG 7 GLOBALER MARKT FÜR WELLPAPPE: MULTIVARIATE MODELLIERUNG
ABBILDUNG 8 GLOBALER MARKT FÜR WELLPAPPE: DEMOGRAFISCHE INTERVIEWS
ABBILDUNG 9 GLOBALER MARKT FÜR WELLPAPPE: DBMR-MARKTPOSITIONSRASTER
ABBILDUNG 10 GLOBALER MARKT FÜR WELLPAPPE: MARKT-ENDBENUTZER-ABDECKUNGSRASTER
ABBILDUNG 11 GLOBALER MARKT FÜR WELLPAPPE: DIE MARKTHERAUSFORDERUNGSMATRIX
ABBILDUNG 12 GLOBALER Markt für Wellpappkartons: Analyse der Anbieteranteile
ABBILDUNG 13 GLOBALER MARKT FÜR WELLPAPPE: SEGMENTIERUNG
ABBILDUNG 14: Der asiatisch-pazifische Raum wird voraussichtlich den globalen Markt für Wellpappe dominieren und im Prognosezeitraum von 2021 bis 2028 mit der höchsten jährlichen Wachstumsrate wachsen.
ABBILDUNG 15 Die zunehmende Verwendung von kleinen und mittelgroßen Wellpappkartons in der Lebensmittel- und Getränkeverpackungsindustrie treibt den globalen Wellpappkartonmarkt im Prognosezeitraum von 2021 bis 2028 an
ABBILDUNG 16: Das Segment der einwandigen Wellpappekartons wird voraussichtlich in den Jahren 2021 und 2028 den größten Anteil am WELTWEITEN MARKT FÜR WELLPAPPENKARTONS ausmachen
ABBILDUNG 17 Der asiatisch-pazifische Raum ist im Prognosezeitraum 2021 bis 2028 der am schnellsten wachsende Markt für Hersteller von Wellpappe
ABBILDUNG 18 TREIBER, EINSCHRÄNKUNGEN, CHANCEN UND HERAUSFORDERUNGEN DES GLOBALEN MARKT FÜR WELLPAPPENKARTEN
ABBILDUNG 19: Die US-Verpackungsindustrie erzielte 2016 mit verschiedenen Verpackungsarten Umsätze
ABBILDUNG 20: US-Einzelhandelsumsätze über E-Commerce im Jahr 2019 (in Millionen USD)
ABBILDUNG 21 Umsatz von Kurier- und Expressdiensten in den USA (2012–2018) (Mio. USD)
ABBILDUNG 22 Durchschnittliches Flächengewicht von Wellpappe (Gramm/Quadratmeter)
ABBILDUNG 23 Zellstoffpreis im Jahr 2020 (USD)
ABBILDUNG 24 Weltweiter Markt für WELLPAPPENKARTONS: NACH Typ, 2020
ABBILDUNG 25 Weltweiter Markt für WELLPAPPENKARTONS: NACH Material, 2020
ABBILDUNG 26 Weltweiter Markt für WELLPAPPKARTONS: NACH FLUTE, 2020
ABBILDUNG 27 Weltweiter Markt für WELLPAPPENKARTONS: NACH Stil, 2020
ABBILDUNG 28 Weltweiter Markt für WELLPAPPENKARTONS: NACH DRUCK, 2020
ABBILDUNG 29 Weltweiter Markt für Wellpappekartons: NACH Endverbraucher, 2020
ABBILDUNG 30 GLOBALER Markt für Wellpappkartons: ÜBERSICHT (2020)
ABBILDUNG 31 GLOBALER Markt für Wellpappkartons: nach Geografie (2020)
ABBILDUNG 32 GLOBALER Markt für Wellpappkartons: nach Geografie (2021 und 2028)
ABBILDUNG 33 GLOBALER Markt für Wellpappkartons: nach Geografie (2021 und 2028)
ABBILDUNG 34 GLOBALER Markt für Wellpappkartons: nach TYP (2021 und 2028)
ABBILDUNG 35: Wellpappenmarkt in Nordamerika: ÜBERBLICK (2020)
ABBILDUNG 36: Wellpappenmarkt in Nordamerika: nach LAND (2020)
ABBILDUNG 37: Wellpappenmarkt in Nordamerika: nach LAND (2021 und 2028)
ABBILDUNG 38 NORDAMERIKANISCHER Markt für Wellpappkartons: nach LAND (2020 und 2028)
ABBILDUNG 39: Wellpappenmarkt in Nordamerika: nach TYP (2021–2028)
ABBILDUNG 40 EUROPA: Wellpappenmarkt: SNAPSHOT (2020)
ABBILDUNG 41 EUROPA: Wellpappkartonmarkt: nach LAND (2020)
ABBILDUNG 42 EUROPA: Wellpappkartonmarkt: nach LAND (2021 und 2028)
ABBILDUNG 43 EUROPA: Wellpappkartonmarkt: nach LAND (2020 und 2028)
ABBILDUNG 44 EUROPA: Wellpappkartonmarkt: nach TYP (2021–2028)
ABBILDUNG 45 ASIEN-PAZIFIK – Markt für Wellpappekartons: ÜBERBLICK (2020)
ABBILDUNG 46 ASIEN-PAZIFIK – Markt für Wellpappkartons: nach LAND (2020)
ABBILDUNG 47 ASIEN-PAZIFIK – Markt für Wellpappkartons: nach LAND (2021 und 2028)
ABBILDUNG 48 ASIEN-PAZIFIK – Markt für Wellpappkartons: nach LAND (2020 und 2028)
ABBILDUNG 49 ASIEN-PAZIFIK – Wellpappkartonmarkt: nach TYP (2021–2028)
ABBILDUNG 50 NAHER OSTEN UND AFRIKA Markt für Wellpappekartons: ÜBERBLICK (2020)
ABBILDUNG 51 NAHER OSTEN UND AFRIKA Markt für Wellpappkartons: nach LÄNDERN (2020)
ABBILDUNG 52 NAHER OSTEN UND AFRIKA Markt für Wellpappkartons: nach LÄNDERN (2021 und 2028)
ABBILDUNG 53 NAHER OSTEN UND AFRIKA Markt für Wellpappkartons: nach LAND (2020 und 2028)
ABBILDUNG 54 NAHER OSTEN UND AFRIKA – Markt für Wellpappkartons: nach TYP (2021–2028)
ABBILDUNG 55 SÜDAMERIKANISCHER Markt für Wellpappekartons: SNAPSHOT (2020)
ABBILDUNG 56 SÜDAMERIKANISCHER Markt für Wellpappkartons: nach LAND (2020)
ABBILDUNG 57 SÜDAMERIKANISCHER Markt für Wellpappkartons: nach LAND (2021 und 2028)
ABBILDUNG 58 SÜDAMERIKANISCHER Markt für Wellpappkartons: nach LAND (2020 und 2028)
ABBILDUNG 59 SÜDAMERIKANISCHER Markt für Wellpappkartons: nach TYP (2021–2028)
ABBILDUNG 60 GLOBALER MARKT FÜR WELLPAPPE: Unternehmensanteil 2020 (%)
ABBILDUNG 61 NORD-AMERIKANISCHER MARKT FÜR WELLPAPPE: UNTERNEHMENSANTEIL 2020 (%)
ABBILDUNG 62 EUROPÄISCHER MARKT FÜR WELLPAPPE: Unternehmensanteil 2020 (%)
ABBILDUNG 63 MARKT FÜR WELLPAPPENKARTONS IM ASIATISCHEN PAZIFISCHEN RAUM: UNTERNEHMENSANTEIL 2020 (%)
Forschungsmethodik
Die Datenerfassung und Basisjahresanalyse werden mithilfe von Datenerfassungsmodulen mit großen Stichprobengrößen durchgeführt. Die Phase umfasst das Erhalten von Marktinformationen oder verwandten Daten aus verschiedenen Quellen und Strategien. Sie umfasst die Prüfung und Planung aller aus der Vergangenheit im Voraus erfassten Daten. Sie umfasst auch die Prüfung von Informationsinkonsistenzen, die in verschiedenen Informationsquellen auftreten. Die Marktdaten werden mithilfe von marktstatistischen und kohärenten Modellen analysiert und geschätzt. Darüber hinaus sind Marktanteilsanalyse und Schlüsseltrendanalyse die wichtigsten Erfolgsfaktoren im Marktbericht. Um mehr zu erfahren, fordern Sie bitte einen Analystenanruf an oder geben Sie Ihre Anfrage ein.
Die wichtigste Forschungsmethodik, die vom DBMR-Forschungsteam verwendet wird, ist die Datentriangulation, die Data Mining, die Analyse der Auswirkungen von Datenvariablen auf den Markt und die primäre (Branchenexperten-)Validierung umfasst. Zu den Datenmodellen gehören ein Lieferantenpositionierungsraster, eine Marktzeitlinienanalyse, ein Marktüberblick und -leitfaden, ein Firmenpositionierungsraster, eine Patentanalyse, eine Preisanalyse, eine Firmenmarktanteilsanalyse, Messstandards, eine globale versus eine regionale und Lieferantenanteilsanalyse. Um mehr über die Forschungsmethodik zu erfahren, senden Sie eine Anfrage an unsere Branchenexperten.
Anpassung möglich
Data Bridge Market Research ist ein führendes Unternehmen in der fortgeschrittenen formativen Forschung. Wir sind stolz darauf, unseren bestehenden und neuen Kunden Daten und Analysen zu bieten, die zu ihren Zielen passen. Der Bericht kann angepasst werden, um Preistrendanalysen von Zielmarken, Marktverständnis für zusätzliche Länder (fordern Sie die Länderliste an), Daten zu klinischen Studienergebnissen, Literaturübersicht, Analysen des Marktes für aufgearbeitete Produkte und Produktbasis einzuschließen. Marktanalysen von Zielkonkurrenten können von technologiebasierten Analysen bis hin zu Marktportfoliostrategien analysiert werden. Wir können so viele Wettbewerber hinzufügen, wie Sie Daten in dem von Ihnen gewünschten Format und Datenstil benötigen. Unser Analystenteam kann Ihnen auch Daten in groben Excel-Rohdateien und Pivot-Tabellen (Fact Book) bereitstellen oder Sie bei der Erstellung von Präsentationen aus den im Bericht verfügbaren Datensätzen unterstützen.

