Serbia Romania And Bulgaria Cng Compressed Natural Gas Fuel Market
Marktgröße in Milliarden USD
CAGR :
% 
 USD
563.98 Million
USD
749.83 Million
2023
2035
USD
563.98 Million
USD
749.83 Million
2023
2035
| 2024 –2035 | |
| USD 563.98 Million | |
| USD 749.83 Million | |
| % | |
Serbia, Romania, and Bulgaria CNG (Compressed Natural Gas) Fuel Market Segmentation, By Products (CNG (Methane-Natural Gas Stored Under High Pressure and Used As Transportation Fuel) and BioCNG (Biomethane)), Source (Associated Gas and Non-Associated Gas), Kits (Sequential and Venturi), Fuel Chamber (Dual-Fuelled Vehicles and Dedicated (CNG-Fuelled) Vehicles), Vehicle Type (Private and Fleet), CNG Fuel Stations Offering (Monofuel Refuelling Stations (Offering Solely CNG) and Multifuel Refuelling Stations (Offering Conventional Fuels and CNG), CNG Fuel Stations Entity (Public Refuelling Stations (Free Access at the Station) and Private/Internal), End Use (Light Motor Vehicles, Medium Motor Vehicles, and Heavy Motor Vehicles) – Industry Trends and Forecast to 2035.
CNG (Compressed Natural Gas) Fuel Market Analysis
Serbia, Romania, and Bulgaria CNG (compressed natural gas) fuel market government policies and incentives boosting the CNG adoption by supporting cleaner energy solutions and encouraging its use as an alternative fuel. Technological advancements in Serbia, Romania, and Bulgaria CNG (compressed natural gas) fuel market enhances the performance and efficiency, making them more competitive and driving further market adoption. Growing environmental awareness is pushing the adoption of sustainable practices and eco-friendly materials in both markets. Thereby driving market growth globally.
CNG (Compressed Natural Gas) Fuel Market Size
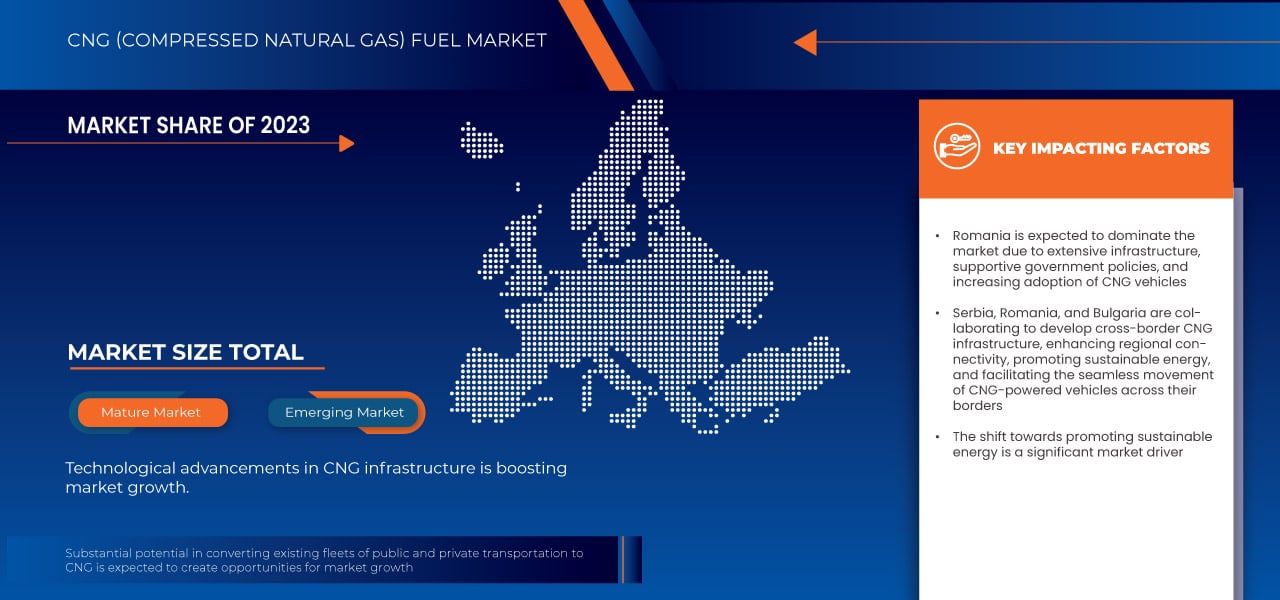
Serbia, Romania, and Bulgaria CNG (compressed natural gas) fuel market size was valued at USD 563.98 million in 2023 and is projected to reach USD 749.83 million by 2035, growing with a CAGR of 2.4% during the forecast period of 2024 to 2035. In addition to the insights on market scenarios such as market value, growth rate, segmentation, geographical coverage, and major players, the market reports curated by the Data Bridge Market Research also include depth expert analysis, patient epidemiology, pipeline analysis, pricing analysis, and regulatory framework.
CNG (Compressed Natural Gas) Fuel Market Trends
“Increasing stringent environmental policies and emission reduction targets in Serbia, Romania, and Bulgaria support the adoption of CNG”
In Serbia, Romania, and Bulgaria, strict environmental regulations and emission reduction targets are increasing the adoption of compressed natural gas as a cleaner fuel alternative to traditional options like coal, oil, propane, etc. Serbia is aligning with European Union standards by implementing policies aimed at reducing air pollution and greenhouse gas emissions. The government is supporting this shift by offering incentives for CNG vehicles and investing in the expansion of refueling infrastructure.
For Examples Romania has taken a proactive approach to incorporating CNG into its energy and transport sectors. The country’s policies focus on reducing urban air pollution and achieving EU emission targets. Romania offers subsidies and grants for CNG vehicles, leading to greater adoption, especially in public transportation and fleet operations. The growth of the CNG refueling network, supported by government initiatives, is further accelerating this transition.
Report Scope and Market Segmentation
|
Attributes |
CNG (Compressed Natural Gas) Fuel Key Market Insights |
|
Segments Covered |
By Product: CNG (Methane-Natural Gas Stored Under High Pressure and Used as Transportation Fuel) and BioCNG (Biomethane) By Source: Associated Gas and Non-Associated Gas By Kits: Sequential and Venturi By Fuel Chamber: Dual-Fuelled Vehicles and Dedicated (CNG-Fuelled) Vehicles By Vehicle Type: Private and Fleet By CNG Fuel Stations Offering: Monofuel Refuelling Stations (Offering Solely CNG) and Multifuel Refuelling Stations (Offering Conventional Fuels and CNG) By CNG Fuel Stations Entity: (Public Refuelling Stations (Free) Access at the Station) and (Private/Internal) By End Use: Light Motor Vehicles, Medium Motor Vehicles, and Heavy Motor Vehicles |
|
Countries Covered |
Bulgaria, Serbia, Romania |
|
Key Market Players |
NIS (Germany), KryoGas (Europe), Engie SA (France), Total Energies SE (France), Chevron Corporation (U.S.), and Shell PLC (U.K.) |
|
Market Opportunities |
· Substantial potential in converting existing fleets of public and private transportation to CNG · Collaborative efforts between Serbia, Romania, and Bulgaria in developing cross-border CNG infrastructure |
|
Value Added Data Infosets |
In addition to the insights on market scenarios such as market value, growth rate, segmentation, geographical coverage, and major players, the market reports curated by the Data Bridge Market Research also include in-depth expert analysis, pricing analysis, brand share analysis, consumer survey, demography analysis, supply chain analysis, value chain analysis, raw material/consumables overview, vendor selection criteria, PESTLE Analysis, Porter Analysis, and regulatory framework. |
CNG (Compressed Natural Gas) Fuel Market Definition
The CNG fuel market in Serbia, Romania, and Bulgaria covers the entire lifecycle of compressed natural gas as a transportation fuel, from production and distribution to consumption. It involves building infrastructure such as refueling stations, advancing CNG vehicle technology, and implementing regulations that support cleaner energy. The aim is to cut emissions and reduce reliance on traditional fuels, while exploring the unique economic and environmental advantages for each country.
CNG (Compressed Natural Gas) Fuel Market Dynamics
Drivers
- Increasing stringent environmental policies and emission reduction targets in Serbia, Romania, and Bulgaria support the adoption of CNG
In Serbia, Romania, and Bulgaria, strict environmental regulations and emission reduction targets are increasing the adoption of compressed natural gas as a cleaner fuel alternative to traditional options like coal, oil, propane, etc. Serbia is aligning with European Union standards by implementing policies aimed at reducing air pollution and greenhouse gas emissions. The government is supporting this shift by offering incentives for CNG vehicles and investing in the expansion of refueling infrastructure. Romania has taken a proactive approach to incorporating CNG into its energy and transport sectors. The country’s policies focus on reducing urban air pollution and achieving EU emission targets. Romania offers subsidies and grants for CNG vehicles, leading to greater adoption, especially in public transportation and fleet operations. The growth of the CNG refueling network, supported by government initiatives, is further accelerating this transition.
For instance,
- In 2021, according to the report of UNITED NATIONS ECONOMIC COMMISSION FOR EUROPE, Bulgaria’s coal-heavy power mix is limiting BEV adoption, but the existing NGV infrastructure offers potential. To advance NGV use, Bulgaria is expanding CNG/LNG refueling stations and supporting facilities, assessing demand, and evaluating investments, socio-economic, and environmental impacts
Rising economic benefits of using CNG
Compressed natural gas holds significant economic advantages, positioning it as a compelling alternative to traditional fuels like gasoline and diesel. A key benefit of CNG is its cost-effectiveness; it is generally cheaper than gasoline and diesel, resulting in lower fuel costs for consumers and businesses alike. This is especially advantageous for commercial vehicle fleets, where reduced fuel expenses can translate into substantial financial savings. CNG vehicles often incur lower maintenance costs due to their cleaner combustion, which reduces engine wear and the need for frequent repairs and oil changes. This leads to longer vehicle lifespans and additional savings. Another economic benefit of CNG is its price stability compared to the more volatile prices of oil-based fuels, offering more predictable and manageable fuel costs.
For instance,
- According to an article published by Pacific Gas and Electric Company, natural gas is a clean-burning fuel that quickly dissipates if leaked, avoiding water contamination and producing fewer greenhouse gases, helping to reduce global warming compared to other fuels
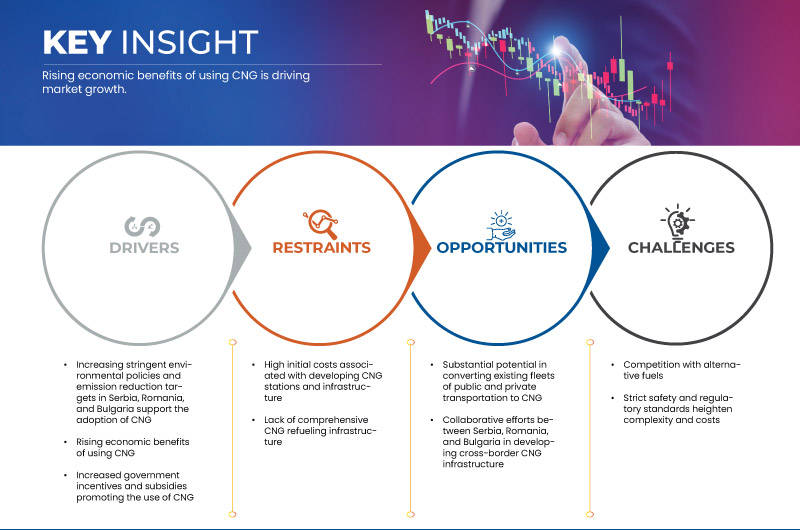
Opportunities
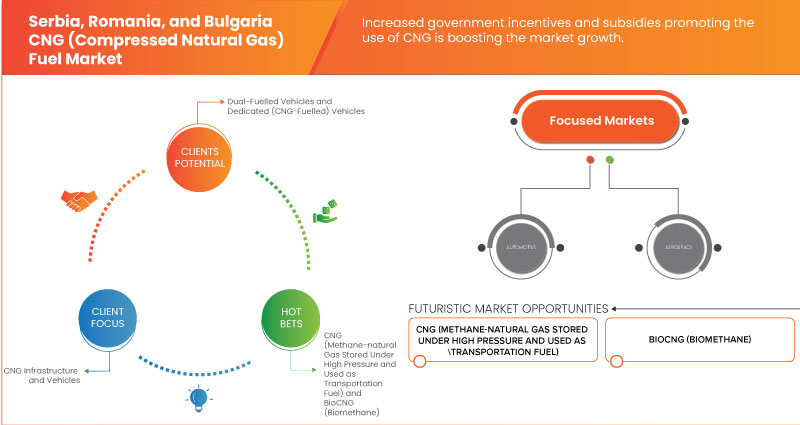
- Substantial potential in converting existing fleets of public and private transportation to CNG
Converting existing fleets of public and private transportation to Compressed Natural Gas (CNG) offers significant economic, environmental, and operational benefits. Economically, CNG is a cost-effective alternative to gasoline and diesel, leading to lower fuel costs and substantial savings for fleet operators. This is especially advantageous for large fleets, such as those used in public transit and logistics, where fuel expenses constitute a significant portion of operating budgets. CNG vehicles often incur lower maintenance costs due to their cleaner combustion, which reduces engine wear and the frequency of repairs. This results in longer vehicle lifespans and increased savings. Environmentally, CNG is a cleaner fuel that significantly reduces emissions of Nitrogen Oxides (NOx), particulate matter, and Carbon Dioxide (CO2) compared to conventional fuels. This reduction in pollutants helps improve air quality, comply with stringent emission regulations, and benefit public health.
- Collaborative efforts between Serbia, Romania, and Bulgaria in developing cross-border CNG infrastructure
The collaborative efforts of Serbia, Romania, and Bulgaria in developing cross-border Compressed Natural Gas (CNG) infrastructure represent a crucial advancement in enhancing regional energy security and promoting sustainable transportation. Recognizing the mutual benefits of a connected CNG network, these countries are working together to create an extensive and integrated refueling infrastructure that spans their borders. A central aspect of this collaboration is the development of cross-border refueling stations designed to provide uninterrupted access to CNG for vehicles traveling between these nations. By establishing a network of strategically placed refueling stations along key transportation routes, Serbia, Romania, and Bulgaria aim to facilitate the widespread adoption of CNG vehicles and streamline the movement of commercial and public transport fleets across borders.
For instance,
- According to a blog published by Vignette Bulgariia, Serbia and Bulgaria share a historical relationship shaped by periods of conflict and cooperation. Since the Yugoslav breakup in the 1990s, they have established their current internationally recognized border, with bilateral regulations for goods, people, and mutual security, including the requirement of a Bulgarian Vignette
Restraints/Challenges
- Increasing competition with alternative fuels
The rise of alternative fuels such as Electric Vehicles (EVs), hydrogen, and biofuels poses a direct competition to CNG. Electric vehicles, in particular, are gaining traction due to advances in battery technology and growing investments in charging infrastructure. Hydrogen fuel cells are also being explored for their potential to provide zero-emission transport solutions. These alternatives often benefit from strong governmental support and subsidies aimed at reducing carbon emissions. The development and expansion of refueling infrastructure for alternatives like electric vehicles and hydrogen may overshadow investments in CNG stations. Governments and private investors are increasingly focusing on these new technologies, which could divert resources and attention away from building a robust CNG network.
For instances
- In April 2024, according to news published by Green Forum, Romania is experiencing a shortage of charging stations, but the rising adoption of Electric Vehicles (EVs) underscores the increasing demand. To facilitate the transition to electric cars and support sustainable transportation, Romania needs to enhance its infrastructure and implement favorable regulations. Mihai Drăghici, partner at EY Romania, highlighted in an interview with Green that Romania anticipates an annual growth rate of 20-25% for EV sales, with the market share expected to reach nearly 30% by 2024 and possibly exceed 50% by 2027
Strict safety and regulatory standards heighten complexity and costs
Strict safety and regulatory standards significantly heighten the complexity and costs associated with various industries, presenting notable challenges. These standards, while crucial for ensuring the safety, reliability, and environmental sustainability of products and processes, introduce layers of complexity in compliance and implementation. Meeting rigorous safety and regulatory requirements often demands extensive documentation, testing, and certification processes. For manufacturers, this means investing in comprehensive testing facilities and procedures to ensure their products meet the required standards. This not only increases operational costs but also extends development timelines, which can delay market entry and impact competitive positioning.
This market report provides details of new recent developments, trade regulations, import-export analysis, production analysis, value chain optimization, market share, impact of domestic and localized market players, analyses opportunities in terms of emerging revenue pockets, changes in market regulations, strategic market growth analysis, market size, category market growths, application niches and dominance, product approvals, product launches, geographic expansions, technological innovations in the market. To gain more info on the market contact Data Bridge Market Research for an Analyst Brief, our team will help you take an informed market decision to achieve market growth.
Climate Change Scenario
Der Markt für CNG-Kraftstoffe (Compressed Natural Gas) wird oft als sauberere Alternative zu herkömmlichen fossilen Brennstoffen wie Benzin und Diesel dargestellt. Es bestehen jedoch weiterhin Umweltbedenken, insbesondere im Hinblick auf Methanlecks bei der Förderung, dem Transport und der Nutzung, die die Vorteile der Kohlenstoffreduzierung durch CNG zunichte machen können. Methan ist ein starkes Treibhausgas mit einem deutlich höheren Treibhauspotenzial als CO2, weshalb sein Umgang mit CNG für die Umweltverträglichkeit von entscheidender Bedeutung ist. Obwohl CNG sauberer verbrennt als andere fossile Brennstoffe, ist es dennoch eine nicht erneuerbare Ressource und seine langfristige Rolle in einer dekarbonisierten Wirtschaft wird diskutiert.
Regulatorischer Rahmen Inhalt
Auf dem CNG-Kraftstoffmarkt (Compressed Natural Gas) in Serbien, Rumänien und Bulgarien spielen Vorschriften eine entscheidende Rolle, da sie die Produktqualität, Sicherheit und Umweltverträglichkeit während des gesamten Herstellungsprozesses gewährleisten.
- Nachfolgend finden Sie eine Tabelle mit den verschiedenen Vorschriften, die den Markt regeln:
Ministerium für Bergbau und Energie (Republik Serbien): Das Ministerium für Bergbau und Energie hat einen neuen Regulierungsrahmen für den Gassektor eingeführt. Er schreibt dem Minister vor, Genehmigungen für verschiedene Gasinfrastrukturprojekte zu erteilen und neue Stellen für Transport und Verteilung einzurichten, um die Marktfunktionalität zu verbessern.
Regelung der Vereinten Nationen: Die Regelung Nr. 110 der Vereinten Nationen standardisiert die Zulassung von Komponenten und Fahrzeugen, die mit komprimiertem Erdgas (CNG) und verflüssigtem Erdgas (LNG) angetrieben werden, und gewährleistet einheitliche Einbau- und Sicherheitsstandards.
Bulgarischer Ministerrat: Die nationale Politik Bulgariens für alternative Kraftstoffe zielt darauf ab, sich durch den Ausbau der CNG- und LNG-Infrastruktur an die EU-Standards anzupassen. Dazu gehören reduzierte Verbrauchsteuern, Sonderparkplätze und Beschaffungsprämien. Der Plan sieht einen schrittweisen Ausbau der Infrastruktur von Verkehrskorridoren zu regionalen Netzen bis 2030 vor.
Produktionskostenszenario
Die durchschnittlichen Produktionskosten für Hersteller sind nicht konstant, sie hängen von verschiedenen Faktoren ab oder sind variabel. Laut unserer Analyse beträgt die durchschnittliche Produktion von CNG-Kraftstoff (Compressed Natural Gas) im Jahr 2023 458.708,69 Tonnen und wird voraussichtlich im Jahr 2024 460.447,76 Tonnen erreichen. Der durchschnittliche Verbrauch beträgt im Jahr 2023 421.507,42 Tonnen und wird voraussichtlich im Jahr 2024 427.111,35 Tonnen erreichen.
Auswirkungen von Rohstoffknappheit und Lieferverzögerungen und aktuelles Marktszenario
Data Bridge Market Research bietet eine umfassende Marktanalyse und liefert Informationen, indem es die Auswirkungen und das aktuelle Marktumfeld von Rohstoffknappheit und Lieferverzögerungen berücksichtigt. Dies bedeutet, dass strategische Möglichkeiten bewertet, wirksame Aktionspläne erstellt und Unternehmen bei wichtigen Entscheidungen unterstützt werden.
Neben dem Standardbericht bieten wir auch detaillierte Analysen des Beschaffungsniveaus anhand prognostizierter Lieferverzögerungen, Händlerzuordnung nach Regionen, Warenanalysen, Produktionsanalysen, Preiszuordnungstrends, Beschaffung, Kategorieleistungsanalysen, Lösungen zum Lieferkettenrisikomanagement, erweitertes Benchmarking und andere Dienste für Beschaffung und strategische Unterstützung.
Erwartete Auswirkungen der Konjunkturabschwächung auf die Preisgestaltung und Verfügbarkeit von Produkten
Wenn die Wirtschaftstätigkeit nachlässt, leiden auch die Branchen darunter. Die prognostizierten Auswirkungen des Konjunkturabschwungs auf die Preisgestaltung und Verfügbarkeit der Produkte werden in den von DBMR bereitgestellten Markteinblickberichten und Informationsdiensten berücksichtigt. Damit sind unsere Kunden ihren Konkurrenten in der Regel immer einen Schritt voraus, können ihre Umsätze und Erträge prognostizieren und ihre Gewinn- und Verlustaufwendungen abschätzen.
Marktumfang für CNG-Kraftstoff (Compressed Natural Gas)
Der Markt ist segmentiert nach Produkten, Quelle, Kits, Tankkammer, Fahrzeugtyp, CNG-Tankstellenangebot, CNG-Tankstellenunternehmen und Endverbrauch. Das Wachstum dieser Segmente hilft Ihnen bei der Analyse schwacher Wachstumssegmente in den Branchen und bietet den Benutzern einen wertvollen Marktüberblick und Markteinblicke, die ihnen bei der strategischen Entscheidungsfindung zur Identifizierung der wichtigsten Marktanwendungen helfen.
Produkte
- CNG (unter hohem Druck gespeichertes und als Kraftstoff verwendetes Methan-Erdgas)
- BioCNG (Biomethan)
Quelle
- Begleitgas
- Nichtassoziiertes Gas
Bausätze
- Sequentiell
- Venturi
Brennstoffkammer
- Fahrzeuge mit Zweistoffbetrieb
- Spezielle (mit Erdgas betriebene) Fahrzeuge
Fahrzeugtyp
- Privat
- Flotte
- Taxi/Bus
- Polizei
- Lieferung
- Sonstiges
CNG-Tankstellenangebot
- Monofuel-Tankstellen (bieten ausschließlich CNG an)
- Multifuel-Tankstellen (Angebot für konventionelle Kraftstoffe und CNG)
CNG-Tankstellen-Unternehmen
- Öffentliche Tankstellen (Kostenloser Zugang an der Station)
- Privat/Intern
Endverwendung
- Leichte Kraftfahrzeuge
- Autos
- SUVs
- MUVs
- Schräghecklimousinen
- Limousinen
- Coupés
- Cabrios
- Sonstiges
- Jeep
- Minivan
- Sonstiges
- Autos
Mittelgroße Kraftfahrzeuge
- Bus
- Tempo
- Mini-LKW
Schwere Kraftfahrzeuge
- LKW
- Trailer
- Behälter
- Mehrachsiger Bus
- Sonstiges
Regionale Analyse des CNG-Kraftstoffmarktes (Compressed Natural Gas)
Der Markt wird analysiert und es werden Einblicke in die Marktgröße und Trends nach Land, Produkten, Quelle, Kits, Tankkammer, Fahrzeugtyp, CNG-Tankstellenangebot, CNG-Tankstelleneinheit und Endnutzung wie oben angegeben bereitgestellt.
Die vom Markt abgedeckten Länder sind Bulgarien, Serbien und Rumänien.
Aufgrund seiner Umweltvorteile und Kosteneffizienz dürfte Rumänien die Nase vorn haben, und seine geringeren Emissionen und Kosten werden zunehmend anerkannt.
Der Länderabschnitt des Berichts enthält auch Angaben zu einzelnen marktbeeinflussenden Faktoren und Änderungen der Regulierung auf dem Inlandsmarkt, die sich auf die aktuellen und zukünftigen Trends des Marktes auswirken. Datenpunkte wie Downstream- und Upstream-Wertschöpfungskettenanalysen, technische Trends und Porters Fünf-Kräfte-Analyse sowie Fallstudien sind einige der Anhaltspunkte, die zur Prognose des Marktszenarios für einzelne Länder verwendet werden. Bei der Bereitstellung von Prognoseanalysen der Länderdaten werden auch die Präsenz und Verfügbarkeit regionaler Marken und ihre Herausforderungen aufgrund großer oder geringer Konkurrenz durch lokale und inländische Marken sowie die Auswirkungen inländischer Zölle und Handelsrouten berücksichtigt.
Marktanteil von CNG-Kraftstoffen (Compressed Natural Gas)
Die Wettbewerbslandschaft des Marktes liefert Einzelheiten zu den Wettbewerbern. Zu den enthaltenen Einzelheiten gehören Unternehmensübersicht, Unternehmensfinanzen, erzielter Umsatz, Marktpotenzial, Investitionen in Forschung und Entwicklung, neue Marktinitiativen, globale Präsenz, Produktionsstandorte und -anlagen, Produktionskapazitäten, Stärken und Schwächen des Unternehmens, Produkteinführung, Produktbreite und -umfang, Anwendungsdominanz. Die oben angegebenen Datenpunkte beziehen sich nur auf den Fokus der Unternehmen in Bezug auf den Markt.
Die Marktführer für CNG-Kraftstoff (Compressed Natural Gas) sind:
- NIS (Deutschland)
- KryoGas (Europa)
- Engie SA (Frankreich)
- Total Energies SE (Frankreich)
- Chevron Corporation (USA)
- Shell PLC (Großbritannien)
Neueste Entwicklungen auf dem CNG-Kraftstoffmarkt (Compressed Natural Gas)
- Laut einem Artikel von Djordje Jajcanin soll Serbien laut Energieministerin Dubravka Djedovic Handanovic bis Ende November 2023 seinen Abschnitt der serbisch-bulgarischen Erdgasverbindung fertigstellen. Die Pipeline, die jährlich 1,8 Milliarden Kubikmeter Erdgas transportieren wird, steht kurz vor der Inbetriebnahme. Serbien hat außerdem kürzlich einen Vertrag mit Aserbaidschan über den Import von 400 Millionen Kubikmetern Gas unterzeichnet und damit seine Energiequellen diversifiziert.
- Im Februar schloss Shell PLC die Übernahme von Nature Energy ab, einem führenden Produzenten von erneuerbarem Erdgas (RNG). Dieser strategische Schritt markiert eine bedeutende Erweiterung der Kapazitäten von Shell im Bereich kohlenstoffarmer Kraftstoffe und unterstreicht sein Engagement zur Beschleunigung der Energiewende. Nature Energy ist auf die Produktion von Biogas durch anaerobe Vergärung spezialisiert und wandelt organische Abfälle in erneuerbares Erdgas (RNG) um. Diese Übernahme stärkt Shells Position auf dem RNG-Markt und bietet eine nachhaltige Alternative zu fossilen Brennstoffen, die in den Bereichen Transport, Industrie und Heizung eingesetzt werden kann.
SKU-
Erhalten Sie Online-Zugriff auf den Bericht zur weltweit ersten Market Intelligence Cloud

- Interaktives Datenanalyse-Dashboard
- Unternehmensanalyse-Dashboard für Chancen mit hohem Wachstumspotenzial
- Zugriff für Research-Analysten für Anpassungen und Abfragen
- Konkurrenzanalyse mit interaktivem Dashboard
- Aktuelle Nachrichten, Updates und Trendanalyse
- Nutzen Sie die Leistungsfähigkeit der Benchmark-Analyse für eine umfassende Konkurrenzverfolgung
Inhaltsverzeichnis
1 EINLEITUNG
1.1 ZIELE DER STUDIE
1.2 MARKTDEFINITION
1.3 ÜBERBLICK
1.4 EINSCHRÄNKUNGEN
1.5 ABGEDECKTE MÄRKTE
2 MARKTSEGMENTIERUNG
2.1 ABGEDECKTE MÄRKTE
2,2 JAHRE FÜR DIE STUDIE
2.3 WÄHRUNG UND PREISE
2.4 DBMR-Dreibeindatenvalidierungsmodell
2.5 MULTIVARIATE MODELLIERUNG
2.6 PRIMÄRINTERVIEWS MIT WICHTIGEN MEINUNGSFÜHRERN
2.7 DBMR-Marktpositionsraster
2.8 Markt-Endverbrauchs-Abdeckungsraster
2.9 DBMR-Lieferantenanteilsanalyse
2.1 SEKUNDÄRQUELLEN
2.11 ANNAHMEN
3 ZUSAMMENFASSUNG
4 PREMIUM-EINBLICKE
4.1 PESTLE-ANALYSE
4.1.1 POLITISCHE FAKTOREN
4.1.2 WIRTSCHAFTLICHE FAKTOREN
4.1.3 SOZIALE FAKTOREN
4.1.4 TECHNOLOGISCHE FAKTOREN
4.1.5 RECHTLICHE FAKTOREN
4.1.6 UMWELTFAKTOREN
4.2 PORTERS FÜNF KRÄFTE
4.2.1 Bedrohung durch neue Marktteilnehmer
4.2.2 Bedrohung durch Ersatzstoffe
4.2.3 VERHANDLUNGSMACHT DER LIEFERANTEN
4.2.4 VERHANDLUNGSMACHT DER KÄUFER
4.2.5 WETTBEWERBSRIVALITÄT
4.3 PRODUKTIONS- UND VERBRAUCHSANALYSE
4.4 Kriterien für die Lieferantenauswahl
4.5 BIO-CNG-GESETZGEBUNG
4.6 CNG-BETRIEBSGESELLSCHAFTEN
4.7 SCHÄTZUNG DES CNG-EINZELHANDELSATZES PRO BETREIBERGESELLSCHAFT
4.8 SCHÄTZUNG DES GESAMTEN KRAFTSTOFF-EINZELHANDELSMARKTES UND DES CNG-EINZELHANDELSMARKTES
4.9 ANZAHL DER CNG-TANKSTELLEN
4.1 Preisanalyse
4.10.1 DURCHSCHNITTLICHER CNG-PREIS PRO LAND IN EUR/KG – HISTORIE UND PROGNOSE
4.10.2 PREISSTRUKTUR: INDUSTRIELLER CNG-PREIS/MWST./VERBRAUCHSTEUER PRO LAND IN EUR/KG – HISTORIE & PROGNOSE
4.11 ANALYSE DER GESAMTANZAHL DER TANKSTELLEN (MIT ANGEBOT ALLER KRAFTSTOFFARTEN)
4.11.1 AKTUELLE VERTEILUNG UND TRENDS
4.11.2 FOLGEN UND AUSBLICK
4.12 KLIMAWANDELSZENARIO
4.12.1 UMWELTBEDENKEN
4.12.2 Reaktion der Industrie
4.12.3 DIE ROLLE DER REGIERUNG
4.12.4 Empfehlungen des Analysten
4.13 ANALYSE DER CNG-TANKINFRASTRUKTUR
4.13.1 SERBIEN
4.13.1.1 AKTUELLER STAND DER INFRASTRUKTUR
4.13.1.2 HERAUSFORDERUNGEN
4.13.1.3 CHANCEN:
4.13.2 RUMÄNIEN:
4.13.2.1 AKTUELLER STAND DER INFRASTRUKTUR:
4.13.2.2 HERAUSFORDERUNGEN:
4.13.2.3 CHANCEN:
4.13.3 BULGARIEN:
4.13.3.1 AKTUELLER STAND DER INFRASTRUKTUR:
4.13.3.2 HERAUSFORDERUNGEN:
4.13.3.3 CHANCEN:
4.13.4 VERGLEICHENDE ZUSAMMENFASSUNG:
4.14 SCHÄTZUNG DES GESAMTEN EINZELHANDELSMARKTES FÜR KRAFTSTOFFE UND DES CNG-EINZELHANDELSMARKTES
4.14.1 INFRASTRUKTURENTWICKLUNG:
4.14.2 REGIERUNGSRICHTLINIEN:
4.14.3 UMWELTBEDENKEN:
4.14.4 MARKTANTEILSDYNAMIK
4.15 REGIERUNGS- UND LOKALES GENEHMIGUNGSVERFAHREN FÜR CNG-INFRASTRUKTUR
4.15.1 INSTALLATION DER CNG-ANLAGE
4.15.1.1 SERBIEN:
4.15.1.2 RUMÄNIEN:
4.15.1.3 BULGARIEN:
4.15.2 BEFÜLLUNG STATIONÄRER BEHÄLTER
4.15.2.1 SERBIEN:
4.15.2.2 RUMÄNIEN:
4.15.2.3 BULGARIEN:
4.15.3 Bau von Tankanlagen
4.15.3.1 SERBIEN:
4.15.3.2 RUMÄNIEN:
4.15.3.3 BULGARIEN:
4.15.4 ZUSÄTZLICHE ÜBERLEGUNGEN
4.15.4.1 SERBIEN:
4.15.4.2 RUMÄNIEN:
4.15.4.3 BULGARIEN:
4.16 MARKTANALYSE NACH FAHRZEUGTYP: PKW VS. LDV (LEICHTE BUSSE < 5 t UND LEICHTE LKW < 3,5 t) VS. HDV (SCHWERE BUSSE > 5 t UND SCHWERE FAHRZEUGE > 3,5 t)
4.16.1 Personenkraftwagen
4.16.2 LEICHTFAHRZEUGE (LDVS)
4.16.3 SCHWERE FAHRZEUGE (HDVS)
4.17 NATIONALES PROGRAMM UND STRATEGIEN ZUR STEIGERUNG DES CNG-VERBRAUCHS
4.17.1 SERBIEN
4.17.2 RUMÄNIEN
4.17.3 BULGARIEN
4.18 ANZAHL DER CNG-TANKSTELLEN UND DEREN ANTEIL
4.19 ROHSTOFFABDECKUNG
4.19.1 ERDGAS
4.19.2 QUELLEN UND LIEFERKETTE
4.19.3 Marktdynamik
4.19.4 JÜNGSTE ENTWICKLUNG
4.2 NORMEN, TECHNISCHE UND SICHERHEITSVORSCHRIFTEN FÜR DIE CNG-INFRASTRUKTUR
4.20.1 CNG-CONTAINER ZUR LAGERUNG
4.20.1.1 MATERIALSTANDARDS
4.20.1.2 ZERTIFIZIERUNG
4.20.1.3 INSPEKTION UND TEST
4.20.1.4 SICHERHEITSFUNKTIONEN
4.20.2 KOMPRESSIONSANLAGEN
4.20.2.1 DESIGNSTANDARDS
4.20.2.2 SICHERHEITSPROTOKOLLE
4.20.2.3 BETRIEBSSICHERHEIT
4.20.3 KOMPRESSORENANLAGEN
4.20.3.1 TECHNISCHE DATEN
4.20.3.2 INSTALLATIONSANFORDERUNGEN
4.20.3.3 SICHERHEITSMASSNAHMEN
4.20.4 AUSGABEANLAGEN
4.20.4.1 SPENDERDESIGN
4.20.4.2 MESSGENAUIGKEIT
4.20.4.3 BENUTZERSICHERHEIT
4.20.5 ROHRLEITUNGEN UND ARMATUREN
4.20.5.1 MATERIALSPEZIFIKATIONEN
4.20.5.2 INSTALLATIONSSTANDARDS
4.20.5.3 LECKAGE-VERHÜTUNG
4.20.6 ERGÄNZENDE ELEMENTE
4.20.6.1 VENTILE UND REGLER
4.20.6.2 STEUERSYSTEME
4.20.6.3 NOTSYSTEME
4.20.7 KONFORMITÄT UND ZERTIFIZIERUNG
4.20.7.1 NATIONALE UND INTERNATIONALE NORMEN
4.20.7.2 ZERTIFIZIERUNGSANFORDERUNGEN
4.20.7.3 REGELMÄSSIGE AUDITS UND INSPEKTIONEN
4.21 LIEFERKETTENANALYSE
4.21.1 ÜBERSICHT
4.21.2 Logistikkostenszenario
4.21.2.1 KRAFTSTOFFTRANSPORTKOSTEN
4.21.2.2 INFRASTRUKTURBEZOGENE KOSTEN
4.21.2.3 Skaleneffekte
4.21.3 Bedeutung der Logistikdienstleister
4.21.3.1 SPEZIALWISSEN UND FÄHIGKEITEN
4.21.3.2 NETZWERK UND INFRASTRUKTUR
4.21.3.3 GRENZÜBERSCHREITENDE KOORDINIERUNG
4.21.3.4 Kostenoptimierung
4.21.3.5 RISIKOMANAGEMENT
4.21.4 SCHLUSSFOLGERUNG
4.22 TECHNOLOGISCHE FORTSCHRITTE DER HERSTELLER
4.22.1 FORTGESCHRITTENE KOMPRESSIONSTECHNOLOGIE
4.22.2 VERBESSERTE SPEICHERLÖSUNGEN
4.22.3 Technologien zum Ausbau der Infrastruktur
4.22.4 DIGITALE ÜBERWACHUNGS- UND STEUERSYSTEME
5 REGULIERUNGSABDECKUNG
6 MARKTÜBERSICHT
6.1 TREIBER
6.1.1 INCREASING STRINGENT ENVIRONMENTAL POLICIES AND EMISSION REDUCTION TARGETS IN SERBIA, ROMANIA, AND BULGARIA SUPPORT THE ADOPTION OF CNG
6.1.2 RISING ECONOMIC BENEFITS OF USING CNG
6.1.3 INCREASED GOVERNMENT INCENTIVES AND SUBSIDIES PROMOTING THE USE OF CNG
6.2 RESTRAINTS
6.2.1 HIGH INITIAL COSTS ASSOCIATED WITH DEVELOPING CNG STATIONS AND INFRASTRUCTURE
6.2.2 LACK OF COMPREHENSIVE CNG REFUELLING INFRASTRUCTURE
6.3 OPPORTUNITIES
6.3.1 SUBSTANTIAL POTENTIAL IN CONVERTING EXISTING FLEETS OF PUBLIC AND PRIVATE TRANSPORTATION TO CNG
6.3.2 COLLABORATIVE EFFORTS BETWEEN SERBIA, ROMANIA, AND BULGARIA IN DEVELOPING CROSS-BORDER CNG INFRASTRUCTURE
6.4 CHALLENGES
6.4.1 INCREASING COMPETITION WITH ALTERNATIVE FUELS
6.4.2 STRICT SAFETY AND REGULATORY STANDARDS HEIGHTEN COMPLEXITY AND COSTS
7 SERBIA, ROMANIA, AND BULGARIA CNG (COMPRESSED NATURAL GAS) FUEL MARKET, BY PRODUCTS
7.1 OVERVIEW
7.2 CNG (METHANE-NATURAL GAS STORED UNDER HIGH PRESSURE AND USED AS TRANSPORTATION FUEL)
7.3 BIOCNG (BIOMETHANE)
8 SERBIA, ROMANIA, AND BULGARIA CNG (COMPRESSED NATURAL GAS) FUEL MARKET, BY SOURCE
8.1 OVERVIEW
8.2 ASSOCIATED GAS
8.2.1 NON-ASSOCIATED GAS
9 SERBIA, ROMANIA, AND BULGARIA CNG (COMPRESSED NATURAL GAS) FUEL MARKET, BY KITS
9.1 OVERVIEW
9.2 SEQUENTIAL
9.3 VENTURI
10 SERBIA, ROMANIA, AND BULGARIA CNG (COMPRESSED NATURAL GAS) FUEL MARKET, BY FUEL CHAMBER
10.1 OVERVIEW
10.2 DUAL-FUELLED VEHICLES
10.3 DEDICATED (CNG-FUELLED) VEHICLES
11 SERBIA, ROMANIA, AND BULGARIA CNG (COMPRESSED NATURAL GAS) FUEL MARKET, BY VEHICLE TYPE
11.1 OVERVIEW
11.2 PRIVATE
11.3 FLEET
12 SERBIA, ROMANIA, AND BULGARIA CNG (COMPRESSED NATURAL GAS) FUEL MARKET, BY CNG FUEL STATIONS OFFERING
12.1 OVERVIEW
12.2 MONOFUEL REFUELLING STATIONS (OFFERING SOLELY CNG)
12.3 MULTIFUEL REFUELLING STATIONS (OFFERING CONVENTIONAL FUELS AND CNG)
13 SERBIA, ROMANIA, AND BULGARIA CNG (COMPRESSED NATURAL GAS) FUEL MARKET, BY CNG FUEL STATIONS ENTITY
13.1 OVERVIEW
13.2 PUBLIC REFUELLING STATIONS (FREE ACCESS AT THE STATION)
13.3 PRIVATE/INTERNAL
14 SERBIA, ROMANIA, AND BULGARIA CNG (COMPRESSED NATURAL GAS) FUEL MARKET, BY END USE
14.1 OVERVIEW
14.2 LIGHT MOTOR VEHICLES
14.3 MEDIUM MOTOR VEHICLES
14.4 HEAVY MOTOR VEHICLES
15 SERBIA, ROMANIA, AND BULGARIA CNG (COMPRESSED NATURAL GAS) FUEL MARKET, BY COUNTRY
15.1 ROMANIA
15.2 BULGARIA
15.3 SERBIA
16 SERBIA, ROMANIA, AND BULGARIA CNG (COMPRESSED NATURAL GAS) FUEL MARKET: COMPANY LANDSCAPE
16.1 COMPANY SHARE ANALYSIS: SERBIA
16.2 COMPANY SHARE ANALYSIS: ROMANIA
16.3 COMPANY SHARE ANALYSIS: BULGARIA
17 SWOT ANALYSIS
18 COMPANY PROFILE
18.1 ENGIE SA
18.1.1 COMPANY SNAPSHOT
18.1.2 REVENUE ANALYSIS
18.1.3 PRODUCT PORTFOLIO
18.1.4 RECENT UPDATES
18.2 TOTALENERGIES SE
18.2.1 COMPANY SNAPSHOT
18.2.2 REVENUE ANALYSIS
18.2.3 PRODUCT PORTFOLIO
18.2.4 RECENT UPDATES
18.3 SHELL PLC
18.3.1 COMPANY SNAPSHOT
18.3.2 REVENUE ANALYSIS
18.3.3 PRODUCT PORTFOLIO
18.3.4 RECENT UPDATES
18.4 CHEVRON CORPORATION
18.4.1 COMPANY SNAPSHOT
18.4.2 REVENUE ANALYSIS
18.4.3 PRODUCT PORTFOLIO
18.4.4 RECENT UPDATES
18.5 KRYOGAS
18.5.1 COMPANY SNAPSHOT
18.5.2 PRODUCT PORTFOLIO
18.5.3 RECENT DEVELOPMENTS
18.6 NIS
18.6.1 COMPANY SNAPSHOT
18.6.2 REVENUE ANALYSIS
18.6.3 PRODUCT PORTFOLIO
18.6.4 RECENT DEVELOPMENTS
19 QUESTIONNAIRE
20 RELATED REPORTS
Tabellenverzeichnis
TABELLE 1 SCHÄTZUNG DER CNG-EINZELHANDELSUMSATZ PRO BETRIEBSUNTERNEHMEN, TONNEN UND ANTEIL
TABELLE 2: CNG-KRAFTSTOFF-EINZELHANDELSMARKT IN SERBIEN, RUMÄNIEN UND BULGARIEN (TONNEN)
TABELLE 3: BENZIN-EINZELHANDELSMARKT IN SERBIEN, RUMÄNIEN UND BULGARIEN (TONNEN)
TABELLE 4 ANZAHL DER CNG-TANKSTELLEN UND DURCHSCHNITTSPREISE IN EUROPA, NACH LAND
TABELLE 5 ERDGASFAHRZEUGE
TABELLE 6 REGULIERUNGSABDECKUNG
TABELLE 7: CNG-KRAFTSTOFFMARKT (COMPRESSED NATURAL GAS) IN SERBIEN, RUMÄNIEN UND BULGARIEN, NACH PRODUKTEN, 2020–2035 (TAUSEND USD)
TABELLE 8: CNG-KRAFTSTOFFMARKT (COMPRESSED NATURAL GAS) IN SERBIEN, RUMÄNIEN UND BULGARIEN, NACH PRODUKTEN, 2020–2035 (TONNEN)
TABELLE 9: CNG-KRAFTSTOFFMARKT (COMPRESSED NATURAL GAS) IN SERBIEN, RUMÄNIEN UND BULGARIEN, NACH QUELLE, 2020–2035 (TAUSEND USD)
TABELLE 10: CNG-KRAFTSTOFFMARKT (COMPRESSED NATURAL GAS) IN SERBIEN, RUMÄNIEN UND BULGARIEN, NACH QUELLE, 2020–2035 (TONNEN)
TABELLE 11: CNG-KRAFTSTOFFMARKT (COMPRESSED NATURAL GAS) IN SERBIEN, RUMÄNIEN UND BULGARIEN, NACH KITS, 2020–2035 (TAUSEND USD)
TABELLE 12: CNG-KRAFTSTOFFMARKT (COMPRESSED NATURAL GAS) IN SERBIEN, RUMÄNIEN UND BULGARIEN, NACH BRENNSTOFFKAMMER, 2020–2035 (TAUSEND USD)
TABELLE 13: CNG-KRAFTSTOFFMARKT (COMPRESSED NATURAL GAS) IN SERBIEN, RUMÄNIEN UND BULGARIEN, NACH FAHRZEUGTYP, 2020–2035 (TAUSEND USD)
TABELLE 14: Fuhrpark in Serbien, Rumänien und Bulgarien auf dem CNG-Kraftstoffmarkt (Compressed Natural Gas), nach Fahrzeugtyp, 2020–2035 (in TAUSEND USD)
TABELLE 15: CNG-KRAFTSTOFFMARKT (COMPRESSED NATURAL GAS) IN SERBIEN, RUMÄNIEN UND BULGARIEN, NACH ANGEBOT DER CNG-TANKSTELLEN, 2020–2035 (TAUSEND USD)
TABELLE 16: CNG-KRAFTSTOFFMARKT (COMPRESSED NATURAL GAS) IN SERBIEN, RUMÄNIEN UND BULGARIEN, NACH CNG-TANKSTELLEN, 2020–2035 (TAUSEND USD)
TABELLE 17: CNG-KRAFTSTOFFMARKT (COMPRESSED NATURAL GAS) IN SERBIEN, RUMÄNIEN UND BULGARIEN, NACH ENDVERWENDUNG, 2020–2035 (TAUSEND USD)
TABELLE 18: SERBIEN, RUMÄNIEN UND BULGARIEN – LEICHTFAHRZEUGE AUF DEM CNG-KRAFTSTOFFMARKT (COMPRESSED NATURAL GAS), NACH TYP, 2020–2035 (TAUSEND USD)
TABELLE 19: SERBIEN, RUMÄNIEN UND BULGARIEN – AUTOS AUF DEM CNG-KRAFTSTOFFMARKT (COMPRESSED NATURAL GAS), NACH KATEGORIE, 2020–2035 (TAUSEND USD)
TABELLE 20: MITTLERE KRAFTFAHRZEUGE IN SERBIEN, RUMÄNIEN UND BULGARIEN AUF DEM CNG-KRAFTSTOFFMARKT (COMPRESSED NATURAL GAS), NACH TYP, 2020–2035 (TAUSEND USD)
TABELLE 21: Schwere Kraftfahrzeuge in Serbien, Rumänien und Bulgarien auf dem Markt für komprimiertes Erdgas (CNG), nach Typ, 2020–2035 (in TAUSEND USD)
TABELLE 22: CNG-KRAFTSTOFFMARKT (COMPRESSED NATURAL GAS) FÜR SERBIEN, RUMÄNIEN UND BULGARIEN, NACH LÄNDERN, 2020–2035 (TAUSEND USD)
TABELLE 23: CNG-KRAFTSTOFFMARKT (COMPRESSED NATURAL GAS) IN SERBIEN, RUMÄNIEN UND BULGARIEN, NACH LÄNDERN, 2020–2035 (TONNEN)
TABELLE 24 RUMÄNIEN CNG (COMPRESSED NATURAL GAS) KRAFTSTOFFMARKT, NACH PRODUKTEN, 2020-2035 (TAUSEND USD)
TABELLE 25 RUMÄNIEN: CNG-KRAFTSTOFFMARKT (COMPRESSED NATURAL GAS), NACH PRODUKTEN, 2020–2035 (TONNEN)
TABELLE 26 RUMÄNIEN: CNG-KRAFTSTOFFMARKT (COMPRESSED NATURAL GAS), NACH QUELLE, 2020–2035 (TAUSEND USD)
TABELLE 27 RUMÄNIEN: CNG-KRAFTSTOFFMARKT (COMPRESSED NATURAL GAS), NACH QUELLE, 2020–2035 (TONNEN)
TABELLE 28 RUMÄNIEN – CNG-KRAFTSTOFFMARKT (COMPRESSED NATURAL GAS), NACH KITS, 2020–2035 (TAUSEND USD)
TABELLE 29 RUMÄNIEN: CNG-KRAFTSTOFFMARKT (COMPRESSED NATURAL GAS), NACH BRENNSTOFFKAMMER, 2020–2035 (TAUSEND USD)
TABELLE 30 RUMÄNIEN: CNG-KRAFTSTOFFMARKT (COMPRESSED NATURAL GAS), NACH FAHRZEUGTYP, 2020–2035 (TAUSEND USD)
TABELLE 31: RUMÄNISCHE FAHRZEUGFLOTTE AUF DEM CNG-KRAFTSTOFFMARKT (COMPRESSED NATURAL GAS), NACH FAHRZEUGTYP, 2020–2035 (TAUSEND USD)
TABELLE 32: RUMÄNISCHER CNG-KRAFTSTOFFMARKT (COMPRESSED NATURAL GAS), NACH ANGEBOT DER CNG-TANKSTELLEN, 2020–2035 (TAUSEND USD)
TABELLE 33 RUMÄNIEN: CNG-KRAFTSTOFFMARKT (COMPRESSED NATURAL GAS), NACH CNG-TANKSTELLEN, 2020–2035 (TAUSEND USD)
TABELLE 34 RUMÄNIEN: CNG-KRAFTSTOFFMARKT (COMPRESSED NATURAL GAS), NACH ENDVERWENDUNG, 2020–2035 (TAUSEND USD)
TABELLE 35: RUMÄNISCHE LEICHTFAHRZEUGE AUF DEM CNG-KRAFTSTOFFMARKT (COMPRESSED NATURAL GAS), NACH TYP, 2020–2035 (TAUSEND USD)
TABELLE 36: RUMÄNISCHE AUTOS AUF DEM CNG-KRAFTSTOFFMARKT (COMPRESSED NATURAL GAS), NACH KATEGORIE, 2020–2035 (TAUSEND USD)
TABELLE 37: MITTLERE KRAFTFAHRZEUGE IN RUMÄNIEN AUF DEM CNG-KRAFTSTOFFMARKT (COMPRESSED NATURAL GAS), NACH TYP, 2020–2035 (TAUSEND USD)
TABELLE 38: RUMÄNISCHE SCHWERLASTFAHRZEUGE AUF DEM CNG-KRAFTSTOFFMARKT (COMPRESSED NATURAL GAS), NACH TYP, 2020–2035 (TAUSEND USD)
TABELLE 39 BULGARIEN: CNG-KRAFTSTOFFMARKT (COMPRESSED NATURAL GAS), NACH PRODUKTEN, 2020–2035 (TAUSEND USD)
TABELLE 40 BULGARIEN: CNG-KRAFTSTOFFMARKT (COMPRESSED NATURAL GAS), NACH PRODUKTEN, 2020–2035 (TONNEN)
TABELLE 41 BULGARIEN – CNG-KRAFTSTOFFMARKT (COMPRESSED NATURAL GAS), NACH QUELLE, 2020–2035 (TAUSEND USD)
TABELLE 42 BULGARIEN: CNG-KRAFTSTOFFMARKT (COMPRESSED NATURAL GAS), NACH QUELLE, 2020–2035 (TONNEN)
TABELLE 43 BULGARIEN CNG (COMPRESSED NATURAL GAS) KRAFTSTOFFMARKT, NACH KITS, 2020-2035 (TAUSEND USD)
TABELLE 44 BULGARIEN: CNG-KRAFTSTOFFMARKT (COMPRESSED NATURAL GAS), NACH BRENNSTOFFKAMMER, 2020–2035 (TAUSEND USD)
TABELLE 45 BULGARIEN: CNG-KRAFTSTOFFMARKT (COMPRESSED NATURAL GAS), NACH FAHRZEUGTYP, 2020–2035 (TAUSEND USD)
TABELLE 46 BULGARIENS FUHRPARK AUF DEM CNG-KRAFTSTOFFMARKT (COMPRESSED NATURAL GAS), NACH FAHRZEUGTYP, 2020–2035 (TAUSEND USD)
TABELLE 47 BULGARIENS CNG-KRAFTSTOFFMARKT (COMPRESSED NATURAL GAS), NACH ANGEBOT DER CNG-TANKSTELLEN, 2020–2035 (TAUSEND USD)
TABELLE 48 BULGARIEN: CNG-KRAFTSTOFFMARKT (COMPRESSED NATURAL GAS), NACH CNG-TANKSTELLEN, 2020–2035 (TAUSEND USD)
TABELLE 49 BULGARIEN CNG (COMPRESSED NATURAL GAS) KRAFTSTOFFMARKT, NACH ENDVERWENDUNG, 2020-2035 (TAUSEND USD)
TABELLE 50 BULGARIEN: LEICHTFAHRZEUGE AUF DEM CNG-KRAFTSTOFFMARKT (COMPRESSED NATURAL GAS), NACH TYP, 2020–2035 (TAUSEND USD)
TABELLE 51 BULGARIEN: AUTOS AUF DEM CNG-KRAFTSTOFFMARKT (COMPRESSED NATURAL GAS), NACH KATEGORIE, 2020–2035 (TAUSEND USD)
TABELLE 52 BULGARIEN MITTLERE KRAFTFAHRZEUGE AUF DEM CNG-KRAFTSTOFFMARKT (COMPRESSED NATURAL GAS), NACH TYP, 2020–2035 (TAUSEND USD)
TABELLE 53: BULGARIEN: SCHWERE KRAFTFAHRZEUGE AUF DEM CNG-KRAFTSTOFFMARKT (COMPRESSED NATURAL GAS), NACH TYP, 2020–2035 (TAUSEND USD)
TABELLE 54 SERBIEN: CNG-KRAFTSTOFFMARKT (COMPRESSED NATURAL GAS), NACH PRODUKTEN, 2020–2035 (TAUSEND USD)
TABELLE 55 SERBIEN: CNG-KRAFTSTOFFMARKT (COMPRESSED NATURAL GAS), NACH PRODUKTEN, 2020–2035 (TONNEN)
TABELLE 56 SERBIEN – CNG-KRAFTSTOFFMARKT (COMPRESSED NATURAL GAS), NACH QUELLE, 2020–2035 (TAUSEND USD)
TABELLE 57 SERBIEN: CNG-KRAFTSTOFFMARKT (COMPRESSED NATURAL GAS), NACH QUELLE, 2020–2035 (TONNEN)
TABELLE 58 SERBIEN – CNG-KRAFTSTOFFMARKT (COMPRESSED NATURAL GAS), NACH KITS, 2020–2035 (TAUSEND USD)
TABELLE 59 SERBIEN CNG (COMPRESSED NATURAL GAS) KRAFTSTOFFMARKT, NACH BRENNSTOFFKAMMER, 2020–2035 (TAUSEND USD)
TABELLE 60 SERBIEN – CNG-KRAFTSTOFFMARKT (COMPRESSED NATURAL GAS), NACH FAHRZEUGTYP, 2020–2035 (TAUSEND USD)
TABELLE 61 SERBISCHER Fuhrpark auf dem CNG-Kraftstoffmarkt (Compressed Natural Gas), nach Fahrzeugtyp, 2020–2035 (in TAUSEND USD)
TABELLE 62 SERBIEN: CNG-KRAFTSTOFFMARKT (COMPRESSED NATURAL GAS), NACH ANGEBOT DER CNG-TANKSTELLEN, 2020–2035 (TAUSEND USD)
TABELLE 63 SERBIEN: CNG-KRAFTSTOFFMARKT (COMPRESSED NATURAL GAS), NACH CNG-TANKSTELLEN, 2020–2035 (TAUSEND USD)
TABELLE 64 SERBIEN: CNG-KRAFTSTOFFMARKT (COMPRESSED NATURAL GAS), NACH ENDVERWENDUNG, 2020–2035 (TAUSEND USD)
TABELLE 65 SERBIEN: LEICHTFAHRZEUGE AUF DEM CNG-KRAFTSTOFFMARKT (COMPRESSED NATURAL GAS), NACH TYP, 2020–2035 (TAUSEND USD)
TABELLE 66 SERBIEN: AUTOS AUF DEM CNG-KRAFTSTOFFMARKT (COMPRESSED NATURAL GAS), NACH KATEGORIE, 2020–2035 (TAUSEND USD)
TABELLE 67: SERBIEN – MITTLERE KRAFTFAHRZEUGE AUF DEM CNG-KRAFTSTOFFMARKT (COMPRESSED NATURAL GAS), NACH TYP, 2020–2035 (TAUSEND USD)
TABELLE 68 SERBIEN: SCHWERE KRAFTFAHRZEUGE AUF DEM CNG-KRAFTSTOFFMARKT (COMPRESSED NATURAL GAS), NACH TYP, 2020–2035 (TAUSEND USD)
Abbildungsverzeichnis
ABBILDUNG 1: CNG-KRAFTSTOFFMARKT (COMPRESSED NATURAL GAS) IN SERBIEN, RUMÄNIEN UND BULGARIEN
ABBILDUNG 2: CNG-KRAFTSTOFFMARKT (COMPRESSED NATURAL GAS) IN SERBIEN, RUMÄNIEN UND BULGARIEN: DATENTRIANGULATION
ABBILDUNG 3: CNG-KRAFTSTOFFMARKT (COMPRESSED NATURAL GAS) IN SERBIEN, RUMÄNIEN UND BULGARIEN: DROC-ANALYSE
ABBILDUNG 4: CNG-KRAFTSTOFFMARKT (COMPRESSED NATURAL GAS) IN SERBIEN, RUMÄNIEN UND BULGARIEN: REGIONALE MARKTANALYSE
ABBILDUNG 5: CNG-KRAFTSTOFFMARKT (COMPRESSED NATURAL GAS) IN SERBIEN, RUMÄNIEN UND BULGARIEN: UNTERNEHMENSANALYSE
ABBILDUNG 6: CNG-KRAFTSTOFFMARKT (COMPRESSED NATURAL GAS) IN SERBIEN, RUMÄNIEN UND BULGARIEN: MULTIVARIATE MODELLIERUNG
ABBILDUNG 7: CNG-KRAFTSTOFFMARKT (COMPRESSED NATURAL GAS) IN SERBIEN, RUMÄNIEN UND BULGARIEN: DEMOGRAFISCHE INTERVIEWDATEN
ABBILDUNG 8: CNG-KRAFTSTOFFMARKT (COMPRESSED NATURAL GAS) IN SERBIEN, RUMÄNIEN UND BULGARIEN: DBMR-MARKTPOSITIONSRASTER
ABBILDUNG 9: CNG-KRAFTSTOFFMARKT (COMPRESSED NATURAL GAS) IN SERBIEN, RUMÄNIEN UND BULGARIEN: MARKT-ENDVERWENDUNGS-ABDECKUNGSRAST
ABBILDUNG 10 SERBIEN, RUMÄNIEN UND BULGARIEN CNG (COMPRESSED NATURAL GAS) KRAFTSTOFFMARKT: ANALYSE DER ANBIETERANTEILE
ABBILDUNG 11 SERBIEN, RUMÄNIEN UND BULGARIEN CNG (COMPRESSED NATURAL GAS)-KRAFTSTOFFMARKT: SEGMENTIERUNG
ABBILDUNG 12 ZWEI SEGMENTE UMFALLEN DEN MARKT FÜR CNG (COMPRESSED NATURAL GAS) IN SERBIEN, RUMÄNIEN UND BULGARIEN, NACH PRODUKTEN
ABBILDUNG 13 SERBIEN, RUMÄNIEN UND BULGARIEN CNG (COMPRESSED NATURAL GAS)-KRAFTSTOFFMARKT: ÜBERSICHT
ABBILDUNG 14 STRATEGISCHE ENTSCHEIDUNGEN
ABBILDUNG 15: Es wird erwartet, dass die steigenden wirtschaftlichen Vorteile der Verwendung von CNG den Markt für CNG-Kraftstoffe (Compressed Natural Gas) in Serbien, Rumänien und Bulgarien im Prognosezeitraum antreiben werden.
ABBILDUNG 16 DAS CNG-SEGMENT (METHAN-ERDGAS, DAS UNTER HOHEM DRUCK GESPEICHERT UND ALS TRANSPORTKRAFTSTOFF VERWENDET WIRD) WIRD VORAUSSICHTLICH DEN GRÖSSTEN ANTEIL AM CNG-KRAFTSTOFFMARKT (KOMPRIMIERTES ERDGAS) IN SERBIEN, RUMÄNIEN UND BULGARIEN IN DEN JAHREN 2024 UND 2031 AUSMACHEN
ABBILDUNG 17 PESTEL-ANALYSE
ABBILDUNG 18 PORTERS FÜNF KRÄFTE
ABBILDUNG 19 PRODUKTIONS-VERBRAUCHSANALYSE: SERBIEN, RUMÄNIEN UND BULGARIEN CNG (COMPRESSED NATURAL GAS) KRAFTSTOFFMÄRKTE
ABBILDUNG 20 LIEFERANTENAUSWAHLKRITERIEN
ABBILDUNG 21 TREIBER, EINSCHRÄNKUNGEN, CHANCEN UND HERAUSFORDERUNGEN DES CNG-KRAFTSTOFFMARKTS (COMPRESSED NATURAL GAS) IN SERBIEN, RUMÄNIEN UND BULGARIEN
ABBILDUNG 22 SERBIEN, RUMÄNIEN UND BULGARIEN CNG-KRAFTSTOFFMARKT (COMPRESSED NATURAL GAS), PRODUKTE, 2023
ABBILDUNG 23 SERBIEN, RUMÄNIEN UND BULGARIEN CNG (COMPRESSED NATURAL GAS) KRAFTSTOFFMARKT, QUELLE, 2023
ABBILDUNG 24 SERBIEN, RUMÄNIEN UND BULGARIEN CNG (COMPRESSED NATURAL GAS) KRAFTSTOFFMARKT, KITS, 2023
ABBILDUNG 25 SERBIEN, RUMÄNIEN UND BULGARIEN CNG (COMPRESSED NATURAL GAS)-KRAFTSTOFFMARKT, BRENNSTOFFKAMMER, 2023
ABBILDUNG 26 SERBIEN, RUMÄNIEN UND BULGARIEN CNG-KRAFTSTOFFMARKT (COMPRESSED NATURAL GAS), FAHRZEUGTYP, 2023
ABBILDUNG 27 SERBIEN, RUMÄNIEN UND BULGARIEN CNG (COMPRESSED NATURAL GAS)-KRAFTSTOFFMARKT, ANGEBOT AN CNG-TANKSTELLEN, 2023
ABBILDUNG 28 SERBIEN, RUMÄNIEN UND BULGARIEN CNG-KRAFTSTOFFMARKT (COMPRESSED NATURAL GAS), CNG-TANKSTELLEN, 2023
ABBILDUNG 29 SERBIEN, RUMÄNIEN UND BULGARIEN CNG-KRAFTSTOFFMARKT (COMPRESSED NATURAL GAS), ENDVERWENDUNG, 2023
ABBILDUNG 30 SERBIEN CNG (COMPRESSED NATURAL GAS) KRAFTSTOFFMARKT: UNTERNEHMENSANTEIL 2023 (%)
ABBILDUNG 31 RUMÄNIEN CNG (COMPRESSED NATURAL GAS) KRAFTSTOFFMARKT: UNTERNEHMENSANTEIL 2023 (%)
ABBILDUNG 32 BULGARIEN CNG (COMPRESSED NATURAL GAS) KRAFTSTOFFMARKT: UNTERNEHMENSANTEIL 2023 (%)
Forschungsmethodik
Die Datenerfassung und Basisjahresanalyse werden mithilfe von Datenerfassungsmodulen mit großen Stichprobengrößen durchgeführt. Die Phase umfasst das Erhalten von Marktinformationen oder verwandten Daten aus verschiedenen Quellen und Strategien. Sie umfasst die Prüfung und Planung aller aus der Vergangenheit im Voraus erfassten Daten. Sie umfasst auch die Prüfung von Informationsinkonsistenzen, die in verschiedenen Informationsquellen auftreten. Die Marktdaten werden mithilfe von marktstatistischen und kohärenten Modellen analysiert und geschätzt. Darüber hinaus sind Marktanteilsanalyse und Schlüsseltrendanalyse die wichtigsten Erfolgsfaktoren im Marktbericht. Um mehr zu erfahren, fordern Sie bitte einen Analystenanruf an oder geben Sie Ihre Anfrage ein.
Die wichtigste Forschungsmethodik, die vom DBMR-Forschungsteam verwendet wird, ist die Datentriangulation, die Data Mining, die Analyse der Auswirkungen von Datenvariablen auf den Markt und die primäre (Branchenexperten-)Validierung umfasst. Zu den Datenmodellen gehören ein Lieferantenpositionierungsraster, eine Marktzeitlinienanalyse, ein Marktüberblick und -leitfaden, ein Firmenpositionierungsraster, eine Patentanalyse, eine Preisanalyse, eine Firmenmarktanteilsanalyse, Messstandards, eine globale versus eine regionale und Lieferantenanteilsanalyse. Um mehr über die Forschungsmethodik zu erfahren, senden Sie eine Anfrage an unsere Branchenexperten.
Anpassung möglich
Data Bridge Market Research ist ein führendes Unternehmen in der fortgeschrittenen formativen Forschung. Wir sind stolz darauf, unseren bestehenden und neuen Kunden Daten und Analysen zu bieten, die zu ihren Zielen passen. Der Bericht kann angepasst werden, um Preistrendanalysen von Zielmarken, Marktverständnis für zusätzliche Länder (fordern Sie die Länderliste an), Daten zu klinischen Studienergebnissen, Literaturübersicht, Analysen des Marktes für aufgearbeitete Produkte und Produktbasis einzuschließen. Marktanalysen von Zielkonkurrenten können von technologiebasierten Analysen bis hin zu Marktportfoliostrategien analysiert werden. Wir können so viele Wettbewerber hinzufügen, wie Sie Daten in dem von Ihnen gewünschten Format und Datenstil benötigen. Unser Analystenteam kann Ihnen auch Daten in groben Excel-Rohdateien und Pivot-Tabellen (Fact Book) bereitstellen oder Sie bei der Erstellung von Präsentationen aus den im Bericht verfügbaren Datensätzen unterstützen.

