Asia Pacific Cereals Market
Tamaño del mercado en miles de millones de dólares
Tasa de crecimiento anual compuesta (CAGR) :
% 
 USD
28.94 Billion
USD
56.81 Billion
2024
2032
USD
28.94 Billion
USD
56.81 Billion
2024
2032
| 2025 –2032 | |
| USD 28.94 Billion | |
| USD 56.81 Billion | |
| % | |
|
Segmentación del mercado de cereales en Asia-Pacífico, por tipo de producto (trigo, arroz, maíz, cebada, avena, centeno, sorgo, mijo, quinua, trigo sarraceno, triticale, fonio, teff, amaranto, kamut y otros), presentación del producto (granos integrales, harina, copos, laminados, inflados, molidos, triturados, almidón, salvado, germen y otros), nivel de procesamiento (fortificado, descascarillado, pulido, precocido, mezclado, instantáneo, germinado, tostado, extruido, parcialmente cocido, micronizado, crudo, completamente cocido, al vapor, sazonado, endulzado, recubierto y otros), formato de consumo (con leche o yogur, barritas para llevar, gachas, snack seco, snack packs, listo para cocinar, listo para calentar, para mezclar Ingrediente, con infusión de bebidas y otros), Categoría de producto (Ingredientes de panadería (mezclas de harina/grano), Cereales para el desayuno, Materia prima/alimento animal, Snacks de cereales, Mezclas de cereales instantáneos, Cereales para bebés, Kits de comida a base de cereales, Insumos para elaboración de cerveza/destilación y otros), Naturaleza (Convencional y orgánico), Categoría (A BASE DE OMG y con certificación SIN OMG), Beneficios funcionales (Fortificado con vitaminas, Alto en fibra, Bajo en azúcar/sin azúcar, Alto en proteínas, Sin gluten, Saludable para el corazón, Mejorado con probióticos/prebióticos, Reductor de colesterol, Bajo índice glucémico, Enriquecido con omega-3, Bajo en grasa, Sin alérgenos, Alto en hierro, Bajo en sal/sin sal, Apto para paleo, Apto para keto, Certificado vegano y otros) Vida útil (Largo plazo (Estable en almacenamiento a temperatura ambiente), Mediano plazo y Corto plazo (Perecedero)), Empaque (Caja, bolsa, sobre, sobre/paquete, saco (a granel), frasco, tetrapack/cartón aséptico, bidón, tambor, embalaje ecológico y otros), tamaño del embalaje (envases pequeños (51 g–250 g), envases medianos (251 g–500 g), envases grandes (501 g–1 kg), envases individuales (menos de 50 g), envases extra grandes (1,1 kg–2,5 kg) y envases a granel (más de 2,5 kg)), rango de precios (económico (hasta USD 2,49), gama media (USD 2,50–6,99) y premium (USD 7,00 y más)), canal de distribución (B2B y B2C): tendencias de la industria y pronóstico hasta 2032
Tamaño del mercado de cereales
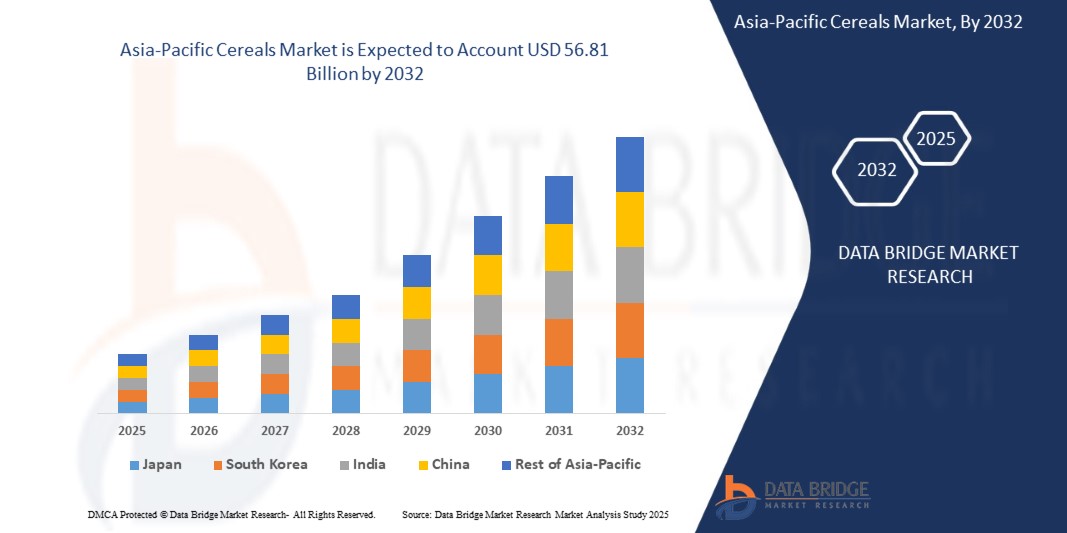
- El tamaño del mercado de cereales de Asia-Pacífico se valoró en USD 28,94 mil millones en 2024 y se espera que alcance los USD 56,81 mil millones para 2032 , con una CAGR del 8,9% durante el período de pronóstico.
- El crecimiento del mercado está impulsado por factores como la creciente demanda de opciones de desayuno convenientes y nutritivas, la creciente conciencia de la salud entre los consumidores, la innovación en las formulaciones de cereales y la expansión de la disponibilidad a través de canales minoristas en línea.
- Además, la evolución de las preferencias de los consumidores por alimentos nutritivos y funcionales, junto con la expansión de la urbanización y la creciente penetración del comercio minorista en línea, están acelerando la adopción de productos de cereales, impulsando así significativamente el crecimiento de la industria.
Análisis del mercado de cereales
- El mercado de cereales representa un segmento clave dentro de la industria agroalimentaria de Asia-Pacífico, que abarca productos de cereales listos para consumir y calientes. Estos productos se consumen ampliamente como opciones de desayuno prácticas y nutritivas que se adaptan a los estilos de vida modernos y ajetreados. El mercado incluye una amplia gama de productos elaborados con trigo, avena, maíz, arroz y cebada, adaptados a las diversas necesidades de los consumidores, incluyendo preferencias saludables, orgánicas y sin gluten.
- Los fabricantes de cereales innovan cada vez más con variantes ricas en proteínas, fortificadas y de origen vegetal para adaptarse a las tendencias de salud y los cambios en la dieta de Asia-Pacífico. Estos avances están ampliando el alcance del mercado de cereales hacia categorías de alimentos funcionales, especialmente en las regiones desarrolladas, donde los consumidores priorizan las etiquetas limpias y el valor nutricional. La creciente tendencia de los sustitutos de comidas y los snacks para llevar impulsa aún más el crecimiento del mercado.
- China dominó el mercado de cereales en 2024 y se prevé que sea el país con mayor crecimiento en el mercado, gracias a sus sólidos patrones de consumo, la fidelidad a las marcas y la presencia de empresas consolidadas como Kellogg's, General Mills y Post Holdings. La región también se beneficia de una infraestructura minorista consolidada y una alta concienciación de los consumidores sobre la salud y el bienestar.
- El segmento de trigo dominó el mercado de cereales con la mayor participación en 2024, gracias a su conveniencia, estabilidad en el almacenamiento y amplia disponibilidad. Este segmento desempeña un papel crucial en la formación de los hábitos de desayuno del consumidor y ofrece valor a través de opciones fortificadas, ricas en sabor y específicas para cada dieta, que satisfacen diversas necesidades nutricionales.
Alcance del informe y segmentación del mercado de cereales
|
Atributos |
Mercado de cereales: Perspectivas clave del mercado |
|
Segmentos cubiertos |
|
|
Países cubiertos |
Asia-Pacífico
|
|
Actores clave del mercado |
|
|
Oportunidades de mercado |
|
|
Conjuntos de información de datos de valor añadido |
Además de los conocimientos sobre escenarios de mercado como valor de mercado, tasa de crecimiento, segmentación, cobertura geográfica y actores principales, los informes de mercado seleccionados por Data Bridge Market Research también incluyen un análisis profundo de expertos, producción y capacidad por empresa representadas geográficamente, diseños de red de distribuidores y socios, análisis detallado y actualizado de tendencias de precios y análisis deficitario de la cadena de suministro y la demanda. |
Tendencias del mercado de cereales
“Innovación en Cereales Funcionales y Nutrición Personalizada”
- El mercado de cereales de Asia-Pacífico está experimentando un cambio fundamental con la creciente demanda de cereales funcionales y nutrición personalizada adaptada a los objetivos de salud y las preferencias dietéticas del consumidor.
- Esta tendencia está impulsando a los fabricantes a reformular los cereales tradicionales incorporando ingredientes con beneficios específicos para la salud, como alto contenido de fibra, apoyo inmunológico, salud cardíaca y mejor digestión.
- Por ejemplo, las principales marcas de cereales están introduciendo productos enriquecidos con superalimentos (semillas de chía, semillas de lino), probióticos, prebióticos y adaptógenos como ashwagandha y maca para atraer a los consumidores centrados en el bienestar.
- Este cambio refleja la creciente conciencia en torno a la salud preventiva y la preferencia por alimentos de etiqueta limpia y ricos en nutrientes, posicionando a los cereales funcionales como componentes esenciales de las dietas modernas.
Dinámica del mercado de cereales
Conductor
Creciente demanda de opciones alimentarias convenientes y nutritivas
- Los estilos de vida urbanos se están volviendo cada vez más agitados, lo que provoca un aumento en la demanda de soluciones de desayuno rápidas, nutritivas y fáciles de preparar.
- Los productos de cereales satisfacen eficazmente esta necesidad debido a su conveniencia, larga vida útil, diversos perfiles nutricionales y amplia disponibilidad en los canales minoristas modernos y tradicionales.
- Las opciones de cereales listos para comer e instantáneos permiten a los consumidores ahorrar tiempo y al mismo tiempo garantizar una ingesta equilibrada de nutrientes esenciales como fibra, vitaminas y minerales.
- Esta creciente preferencia por opciones de alimentos convenientes y saludables está impulsando una demanda sostenida de cereales en varios grupos demográficos, especialmente profesionales que trabajan, estudiantes y familias preocupadas por la salud.
- En abril de 2024, según un informe de FoodNavigator, Kellogg's se asoció con una empresa líder en ciencia nutricional para aprovechar los datos de salud del consumidor y las herramientas de inteligencia artificial para desarrollar mezclas de cereales personalizadas. Mediante el análisis de millones de datos relacionados con hábitos alimenticios, preferencias y condiciones de salud, Kellogg's presentó una línea de cereales personalizados diseñados para apoyar la salud intestinal, el bienestar cardiovascular y los niveles de energía. Esta iniciativa refleja la creciente demanda de soluciones de cereales funcionales basadas en datos, diseñadas para una nutrición personalizada.
- Estas innovaciones ponen de relieve cómo las marcas están adoptando la transformación digital y el análisis de salud para impulsar la innovación de productos y mejorar la participación del consumidor, impulsando en última instancia un crecimiento sostenido del mercado en las categorías de cereales de Asia y el Pacífico.
Restricción/Desafío
Preocupaciones de salud sobre el contenido de azúcar en los cereales para el desayuno
- El alto coste de obtener materias primas de primera calidad y desarrollar cereales funcionales, orgánicos o personalizados plantea desafíos importantes, especialmente para los pequeños y medianos fabricantes (PYME).
- Estos costos incluyen la adquisición de ingredientes especializados (como superalimentos y probióticos), tecnologías de procesamiento avanzadas, el cumplimiento de estándares de etiquetado limpio o certificación sanitaria, y la comercialización para nichos de mercado de la salud. Muchos pequeños productores de cereales carecen de los recursos financieros o la capacidad de I+D necesarios para competir con las marcas consolidadas de Asia-Pacífico, lo que ralentiza la innovación y limita su alcance en el mercado.
- En octubre de 2023, un informe de AgriBusiness Review destacó que el costo de lanzar líneas de productos de cereales funcionales u orgánicos va mucho más allá del abastecimiento de materias primas. Incluye inversión en maquinaria especializada, I+D para la mejora nutricional, innovación en envases, certificación (como orgánica o sin gluten) y educación del consumidor. Estos gastos acumulados suelen ser inmanejables para las pequeñas marcas que buscan entrar en el segmento de cereales saludables.
- La limitada capacidad financiera y la infraestructura tecnológica obligan a muchos pequeños y medianos productores de cereales a retrasar o renunciar al desarrollo de estos productos, lo que limita su capacidad para competir en categorías premium y funcionales. Este obstáculo financiero frena significativamente la diversificación del mercado y la innovación en la industria cerealera.
Alcance del mercado de cereales
El mercado está segmentado en trece segmentos notables según el tipo de producto, forma del producto, nivel de procesamiento, formato de consumo, categoría del producto, naturaleza, categoría, beneficios funcionales, vida útil, empaque, tamaño del empaque, rango de precios y canal de distribución.
- Por tipo de producto
Según el tipo de producto, el mercado de cereales se segmenta en trigo, arroz, maíz, cebada, avena, centeno, sorgo, mijo, quinua, trigo sarraceno, triticale, fonio, teff, amaranto, kamut, entre otros. Se prevé que el trigo domine la cuota de mercado en 2025 y sea el segmento de mayor crecimiento gracias a su disponibilidad en Asia-Pacífico, su asequibilidad y su amplio uso en las industrias alimentaria y de piensos. Se prevé que la creciente demanda de granos antiguos, como la quinua y el amaranto, impulse el crecimiento de los segmentos de cereales especiales y saludables durante el período de pronóstico.
- Por forma de producto
Según la presentación del producto, el mercado de cereales se segmenta en granos integrales, harina, copos, laminados, inflados, molidos, partidos, almidón, salvado, germen y otros. Los granos integrales representaron la mayor participación en 2025 y se prevé que sean el segmento de mayor crecimiento del mercado, impulsados por la creciente concienciación sobre las dietas ricas en fibra y las preferencias de etiquetado limpio.
Se espera que la harina y el salvado experimenten la CAGR más rápida entre 2025 y 2032, debido a su uso en panadería y alimentos saludables.
- Por nivel de procesamiento
Según el nivel de procesamiento, el mercado de cereales se segmenta en fortificados, descascarillados, pulidos, precocidos, mezclados, instantáneos, germinados, tostados, extruidos, parcialmente cocidos, micronizados, crudos, totalmente cocidos, al vapor, sazonados, endulzados, recubiertos, entre otros. Los fortificados dominaron la cuota de mercado en 2024 y se prevé que sean el segmento de mayor crecimiento gracias a sus beneficios nutricionales adicionales. Por otro lado, los formatos instantáneos y precocidos impulsan la demanda de soluciones de alimentación rápida entre las poblaciones urbanas.
- Por formato de consumo
Según el formato de consumo, el mercado de cereales se segmenta en: para comer con cuchara con leche/yogur, barritas para llevar, gachas, snacks secos, snacks en envases, listos para cocinar, listos para calentar, con ingredientes para mezclar, con infusión para bebidas, entre otros. Se espera que los cereales para comer con cuchara dominen la cuota de mercado en 2025 y se prevé que sean el segmento de mayor crecimiento debido a su uso convencional, mientras que se proyecta que los listos para cocinar y los snacks en envases experimenten un rápido crecimiento gracias a su portabilidad y comodidad.
- Por categoría de producto
Según la categoría de producto, el mercado de cereales se segmenta en ingredientes de panadería (mezclas de harina y granos), cereales para el desayuno, piensos para animales, snacks de cereales, mezclas de cereales instantáneos, cereales infantiles, kits de comida a base de cereales, insumos para la elaboración de cerveza y destilación, entre otros. Los cereales para el desayuno tuvieron la mayor participación en 2025 y se prevé que sean el segmento de mayor crecimiento en el mercado debido a su amplio consumo, mientras que se prevé que los snacks de cereales y los cereales infantiles crezcan rápidamente debido a los cambios en los hábitos alimentarios y a una crianza centrada en la salud.
- Por naturaleza
En función de la naturaleza, el mercado de cereales se segmenta en convencionales y orgánicos. Los cereales convencionales dominaron el mercado en 2024, gracias a su asequibilidad y a las cadenas de suministro consolidadas.
Se proyecta que los cereales orgánicos exhibirán el crecimiento más rápido durante 2025-2032, impulsado por la creciente demanda de los consumidores de productos libres de pesticidas y de etiqueta limpia.
- Por categoría
Según la categoría, el mercado de cereales se segmenta en cereales con certificación de OGM y cereales sin certificación de OGM. El segmento sin certificación de OGM dominó el mercado en 2024 y se espera que crezca rápidamente debido a la creciente concienciación y preferencia de los consumidores por los cereales de origen natural, especialmente en Asia-Pacífico.
- Por beneficios funcionales
En función de sus beneficios funcionales, el mercado de cereales se segmenta en: fortificados con vitaminas, ricos en fibra, bajos en azúcar o sin azúcar, ricos en proteínas, sin gluten, cardiosaludables, enriquecidos con probióticos/prebióticos, reductores de colesterol, de bajo índice glucémico, enriquecidos con omega-3, bajos en grasa, sin alérgenos, ricos en hierro, bajos en sal o sin sal, aptos para dietas paleo, aptos para dietas keto, con certificación vegana, entre otros. Los cereales ricos en fibra y cardiosaludables dominan la dieta y se prevé que sean el segmento de mayor crecimiento en el mercado debido al mayor enfoque en la salud preventiva y el control de peso.
- Por vida útil
Según su vida útil, el mercado de cereales se segmenta en largo plazo (perecederos), mediano plazo y corto plazo. Los cereales perecederos lideran el mercado y se prevé que sean el segmento de mayor crecimiento gracias a su durabilidad y ventajas logísticas, especialmente en los mercados minoristas y de exportación.
- Por embalaje
En cuanto al envasado, el mercado de cereales se segmenta en cajas, sobres, bolsas, sobres/stick packs, sacos (a granel), tarros, envases Tetra Pack/cartón aséptico, bidones, bidones, envases ecológicos y otros. Las cajas y sobres tuvieron la mayor cuota de mercado en 2025 y se prevé que sean el segmento de mayor crecimiento en el mercado minorista, mientras que se espera que los envases ecológicos experimenten un rápido crecimiento gracias a soluciones de envasado sostenibles y rentables. La preferencia de los consumidores por formatos resellables, ligeros y ecológicos impulsa el crecimiento, especialmente en los sectores de alimentación, cuidado personal y comercio electrónico, centrados en la frescura y la reducción de residuos.
- Por tamaño de embalaje
Según el tamaño del envase, el mercado de cereales se segmenta en paquetes pequeños (51 g–250 g), paquetes medianos (251 g–500 g), paquetes grandes (501 g–1 kg), paquetes individuales (menos de 50 g), paquetes extragrandes (1,1 kg–2,5 kg) y paquetes a granel (más de 2,5 kg). Los paquetes pequeños y medianos tuvieron la mayor cuota de mercado en 2025 y se prevé que sean el segmento de mayor crecimiento en el mercado gracias a su asequibilidad y a su idoneidad para hogares unipersonales, mientras que los paquetes a granel son comunes en las ventas B2B e institucionales.
- Por rango de precio
Según el rango de precios, el mercado de cereales se segmenta en económico (hasta USD 2,49), gama media (USD 2,50-6,99) y premium (USD 7,00 y más). La gama media tuvo la mayor participación en 2025 y se prevé que sea el segmento de mayor crecimiento en el mercado gracias a su equilibrio entre asequibilidad y calidad, mientras que los cereales premium están ganando terreno en los mercados urbanos con el aumento de la renta disponible.
- Por canal de distribución
Según el canal de distribución, el mercado de cereales se segmenta en B2B y B2C. El B2C tuvo la mayor participación en 2025 y se prevé que sea el segmento de mayor crecimiento del mercado debido a que la mayoría de las ventas se realizan a través de supermercados, tiendas de conveniencia y plataformas en línea. Por su parte, el segmento B2B se caracteriza por la restauración, el suministro institucional y el uso industrial.
Análisis regional del mercado de cereales
- El mercado de cereales de Asia-Pacífico tuvo una participación en los ingresos del 22,36 % en 2024, impulsado por el alto consumo de cereales listos para comer, una fuerte presencia de marca y una amplia disponibilidad en formatos minoristas modernos.
- La región se beneficia de una industria de procesamiento de alimentos consolidada, una creciente demanda de cereales orgánicos y fortificados, y la innovación continua de empresas clave como Kellogg's, General Mills y Post Holdings. Además, la creciente preferencia de los consumidores por opciones de desayuno prácticas y saludables consolida aún más su liderazgo en el mercado de Asia-Pacífico.
Perspectivas del mercado de cereales de China
El mercado chino de cereales, que capturó la mayor participación en los ingresos de Asia-Pacífico en 2024, con más del 14,44 %, se proyecta que crezca de forma sostenida durante el período de pronóstico, impulsado por el alto consumo per cápita de cereales, la fidelidad a la marca y una red minorista consolidada. Grandes empresas como General Mills, Kellogg's, Post Holdings y Quaker (PepsiCo) dominan el mercado con una amplia gama de cereales listos para consumir y funcionales. La demanda de cereales orgánicos, ricos en fibra y enriquecidos con proteínas continúa creciendo, lo que refleja la evolución de las tendencias en salud y bienestar.
Perspectivas del mercado de cereales de la India
El mercado de cereales de la India, que capturó la mayor participación en los ingresos de Asia-Pacífico en 2024, con más del 13,38 %, se proyecta que crecerá de forma sostenida durante el período de pronóstico, impulsado por una mayor concienciación sobre la salud, la urbanización y la creciente demanda de opciones alimentarias prácticas y nutritivas. Este crecimiento se sustenta en la expansión de los canales minoristas, los programas gubernamentales de nutrición y las innovaciones en productos de cereales integrales, orgánicos y listos para consumir.
Cuota de mercado de los cereales
El mercado de cereales está liderado principalmente por empresas bien establecidas, entre las que se incluyen:
- Bagrry's (India)
- KWALITY (India)
- Marico (India)
- Sanatorio (Australia)
Últimos avances en el mercado de cereales de Asia-Pacífico
- En marzo de 2025 , General Mills lanzó una nueva línea de cereales de desayuno ricos en proteínas bajo su marca "Nature Valley", dirigida a consumidores preocupados por su salud y entusiastas del fitness. El producto incluye variantes fortificadas con proteína de suero, fibra y cero azúcares añadidos, en línea con la creciente demanda de alimentos funcionales.
- En enero de 2025 , Kellogg's anunció su expansión estratégica al Sudeste Asiático con una nueva planta de fabricación en Vietnam para satisfacer la creciente demanda regional de soluciones de desayuno convenientes. La planta producirá una variedad de cereales adaptados a los gustos locales, incluyendo opciones bajas en azúcar y de origen vegetal.
- En octubre de 2024 , Nestlé se asoció con Danone y una startup de tecnología sanitaria para desarrollar conjuntamente una plataforma de nutrición personalizada. Esta plataforma utiliza datos dietéticos de los consumidores para recomendar productos de cereales ricos en nutrientes específicos como omega-3, fibra y hierro, marcando el comienzo de una nueva era de nutrición de precisión en la categoría de desayunos.
- En abril de 2025 , Post Holdings presentó un embalaje sostenible para su línea de cereales "Honey Bunches of Oats". Los nuevos envases reciclables y biodegradables respaldan el compromiso de la empresa de reducir el uso de plástico en un 50 % para 2030 y atienden a los consumidores con conciencia ecológica.
- En febrero de 2025 , la marca "Saffola" de Marico introdujo cereales a base de mijo en India, bajo su línea "Healthy Crunch". El lanzamiento se alinea con la iniciativa del Año Internacional del Mijo y responde a la creciente popularidad de los cereales ancestrales en las fórmulas modernas para el desayuno.
SKU-
Obtenga acceso en línea al informe sobre la primera nube de inteligencia de mercado del mundo

- Panel de análisis de datos interactivo
- Panel de análisis de empresas para oportunidades con alto potencial de crecimiento
- Acceso de analista de investigación para personalización y consultas
- Análisis de la competencia con panel interactivo
- Últimas noticias, actualizaciones y análisis de tendencias
- Aproveche el poder del análisis de referencia para un seguimiento integral de la competencia
Tabla de contenido
1 INTRODUCCIÓN
1.1 OBJETIVOS DEL ESTUDIO
1.2 DEFINICIÓN DE MERCADO
1.3 RESUMEN
1.4 LIMITACIONES
1.5 MERCADOS CUBIERTOS
2 SEGMENTACIÓN DEL MERCADO
2.1 MERCADOS CUBIERTOS
2.2 ÁMBITO GEOGRÁFICO
2,3 AÑOS CONSIDERADOS PARA EL ESTUDIO
2.4 MONEDA Y PRECIOS
2.5 MODELO DE VALIDACIÓN DE DATOS TRÍPODE DBMR
2.6 MODELADO MULTIVARIADO
2.7 ENTREVISTAS PRINCIPALES CON LÍDERES DE OPINIÓN CLAVE
2.8 CUADRÍCULA DE POSICIÓN DE MERCADO DBMR
2.9 ANÁLISIS DE PARTICIPACIÓN DE PROVEEDORES DE DBMR
2.1 FUENTES SECUNDARIAS
2.11 SUPUESTOS
3 RESUMEN EJECUTIVO
4 INFORMACIÓN PREMIUM
4.1 CINCO FUERZAS DE PORTERS:-
4.1.1 INTENSIDAD DE LA RIVALIDAD COMPETITIVA (ALTA)
4.1.2 PODER DE NEGOCIACIÓN DE LOS COMPRADORES/CONSUMIDORES (ALTO)
4.1.3 AMENAZA DE NUEVOS ENTRANTES (BAJA A MODERADA)
4.1.4 AMENAZA DE PRODUCTOS SUSTITUTOS (MODERADA A ALTA)
4.1.5 PODER DE NEGOCIACIÓN DE LOS PROVEEDORES (MODERADO)
4.2 PERSPECTIVA DE LA MARCA
4.2.1 ANÁLISIS COMPARATIVO DE MARCAS
4.2.2 DESCRIPCIÓN GENERAL DEL PRODUCTO Y LA MARCA
4.3 ESTRATEGIAS DE CRECIMIENTO ADOPTADAS POR LOS ACTORES CLAVE DEL MERCADO:
4.4 FACTORES QUE INFLUYEN EN LA DECISIÓN DE COMPRA DE LOS USUARIOS FINALES
4.5 IMPACTO DE LA DESACELERACIÓN ECONÓMICA EN EL MERCADO
4.5.1 IMPACTO EN EL PRECIO
4.5.2 IMPACTO EN LA CADENA DE SUMINISTRO
4.5.3 IMPACTO EN EL ENVÍO
4.5.4 IMPACTO EN LAS DECISIONES ESTRATÉGICAS DE LA EMPRESA
4.6 MARCO REGULATORIO Y DIRECTRICES
4.7 CADENA DE VALOR
4.7.1 CADENA DE VALOR DEL MERCADO DE CEREALES DE ASIA-PACÍFICO
4.7.2 PRODUCCIÓN:
4.7.3 TRATAMIENTO:
4.7.4 MARKETING/DISTRIBUCIÓN:
4.7.5 COMPRADORES:
4.8 ANÁLISIS DE LA CADENA DE SUMINISTRO
4.9 DESGLOSE DEL ANÁLISIS DE COSTOS
4.1 ESCENARIO DE MÁRGENES DE GANANCIA
4.11 SEGUIMIENTO DE INNOVACIÓN Y ANÁLISIS ESTRATÉGICO
4.11.1 ANÁLISIS DE GRANDES ACUERDOS Y ALIANZAS ESTRATÉGICAS
4.11.1.1 EMPRESAS CONJUNTAS
4.11.1.2 FUSIONES Y ADQUISICIONES
4.11.1.3 LICENCIAS Y ASOCIACIONES
4.11.1.4 COLABORACIONES TECNOLÓGICAS
4.11.1.5 DESINVERSIONES ESTRATÉGICAS
4.12 ANÁLISIS DE PRECIOS
4.13 ANÁLISIS DE PATENTES
4.13.1 CALIDAD Y RESISTENCIA DE LA PATENTE
4.13.2 FAMILIAS DE PATENTES
4.13.3 NÚMERO DE FAMILIAS DE PATENTES INTERNACIONALES POR AÑO DE PUBLICACIÓN
4.13.4 LICENCIAS Y COLABORACIONES
4.13.5 PANORAMA DE PATENTES DE EMPRESAS
4.13.6 PANORAMA DE PATENTES REGIONALES
4.14 ESTRATEGIA Y GESTIÓN DE LA PROPIEDAD INTELECTUAL
4.14.1 ANÁLISIS DE PATENTES
4.14.2 ESCENARIO DE MÁRGENES DE GANANCIA
4.15 IMPACTO DE LA DESACELERACIÓN ECONÓMICA EN EL MERCADO DE CEREALES DE ASIA-PACÍFICO
4.15.1 IMPACTO EN LOS PRECIOS
4.15.2 IMPACTO EN LA CADENA DE SUMINISTRO
4.15.3 IMPACTO EN EL ENVÍO
4.15.4 IMPACTO EN LA DEMANDA
4.15.5 IMPACTO EN LAS DECISIONES ESTRATÉGICAS
4.16 ANÁLISIS DE LA CADENA DE SUMINISTRO
4.16.1 DESCRIPCIÓN GENERAL
4.16.2 TIPOS DE COSTOS LOGÍSTICOS INVOLUCRADOS
4.16.3 FACTORES QUE INFLUYEN EN CADA TIPO DE COSTO
4.16.4 ESTRATEGIAS PARA MINIMIZAR LOS COSTOS LOGÍSTICOS
4.16.5 IMPORTANCIA DE LOS PROVEEDORES DE SERVICIOS LOGÍSTICOS
4.17 ANÁLISIS DEL ECOSISTEMA INDUSTRIAL
4.17.1 EMPRESAS DESTACADAS
4.17.2 PEQUEÑAS Y MEDIANAS EMPRESAS
4.17.3 USUARIOS FINALES
4.18 ANÁLISIS DE PRODUCCIÓN Y CONSUMO
4.19 ANÁLISIS DE ABASTECIMIENTO DE MATERIAS PRIMAS (MERCADO DE CEREALES DE ASIA-PACÍFICO)
4.2 PANORAMA GENERAL DE LAS INNOVACIONES TECNOLÓGICAS
4.20.1 DESCRIPCIÓN GENERAL:
4.21 ARANCELES E IMPACTO EN EL MERCADO
4.21.1 TASA(S) ARANCELARIA(S) ACTUAL(ES) EN LOS MERCADOS DE LOS 5 PAÍSES PRINCIPALES
4.21.2 PERSPECTIVAS: PRODUCCIÓN LOCAL V/S DEPENDENCIA DE LAS IMPORTACIONES
4.21.3 DINÁMICA DE LOS CRITERIOS DE SELECCIÓN DE PROVEEDORES
4.21.4 IMPACTO EN LA CADENA DE SUMINISTRO
4.21.4.1 ADQUISICIÓN DE MATERIA PRIMA
4.21.4.2 FABRICACIÓN Y PRODUCCIÓN
4.21.4.3 LOGÍSTICA Y DISTRIBUCIÓN
4.21.4.4 PRECIOS DE LANZAMIENTO Y POSICIÓN DEL MERCADO
4.21.5 PARTICIPANTES DE LA INDUSTRIA: ACCIONES PROACTIVAS
4.21.5.1 OPTIMIZACIÓN DE LA CADENA DE SUMINISTRO
4.21.5.2 ESTABLECIMIENTOS DE EMPRESAS CONJUNTAS
4.21.6 IMPACTO EN LOS PRECIOS
4.21.7 INCLINACIÓN REGULADORA
4.21.7.1 SITUACIÓN GEOPOLÍTICA
4.21.7.2 ASOCIACIONES COMERCIALES ENTRE LOS PAÍSES
4.21.8 TRATADOS DE LIBRE COMERCIO
4.21.9 ESTABLECIMIENTOS DE ALIANZAS
4.21.10 ACREDITACIÓN DE ESTADO (INCLUYENDO MFTN)
4.21.11 CURSO DE CORRECCIÓN DOMÉSTICA
4.21.12 ESQUEMAS DE INCENTIVOS PARA IMPULSAR LA PRODUCCIÓN
4.21.13 ESTABLECIMIENTO DE ZONAS ECONÓMICAS ESPECIALES/PARQUES INDUSTRIALES
5 DESCRIPCIÓN GENERAL DEL MERCADO
5.1 CONTROLADORES
5.1.1 AUMENTO DE LA DEMANDA DE ALIMENTOS NUTRICIONALES Y FUNCIONALES
5.1.2 URBANIZACIÓN Y CAMBIO DE ESTILOS DE VIDA IMPULSO DE LOS CEREALES LISTOS PARA COMER
5.1.3 AUMENTO DE INGREDIENTES FUNCIONALES Y DE ORIGEN VEGETAL IMPULSADO POR PREOCUPACIONES AMBIENTALES Y DE SALUD
5.2 RESTRICCIONES
5.2.1 PRECIOS FLUCTUANTES DE LAS MATERIAS PRIMAS Y RIESGOS CLIMÁTICOS
5.2.2 CRECIENTES CRÍTICAS SOBRE EL AZÚCAR AÑADIDO Y EL PROCESAMIENTO
5.3 OPORTUNIDADES
5.3.1 LOS CONSUMIDORES ELIGEN CADA VEZ MÁS CEREALES CON ALTO CONTENIDO DE FIBRA, BAJO EN AZÚCAR Y ORGÁNICOS
5.3.2 EL CAMBIO CRECIENTE HACIA PATRONES ALIMENTARIOS BASADOS EN PLANTAS QUE INFLUYEN EN LAS PREFERENCIAS DE LOS CONSUMIDORES.
5.3.3 COMESTIBLES EN LÍNEA QUE PERMITEN A LAS MARCAS DE CEREALES VENDER DIRECTAMENTE, RECOPILAR DATOS DE LOS CONSUMIDORES Y OFRECER SUSCRIPCIONES
5.4 DESAFÍOS
5.4.1 OBSTÁCULOS IMPORTANTES PARA LAS CADENAS DE SUMINISTRO DEBIDO A INTERRUPCIONES LOGÍSTICAS, REGULACIONES COMPLEJAS Y REDES DE DISTRIBUCIÓN INEFICIENTES
5.4.2 MAYOR COMPETENCIA DE ALTERNATIVAS COMO GRANOLA, BARRAS DE PROTEÍNA, BATIDOS, YOGUR Y DESAYUNOS ÉTNICOS
6 MERCADO DE CEREALES DE ASIA-PACÍFICO, POR TIPO DE CEREAL
6.1 DESCRIPCIÓN GENERAL
6.2 TRIGO
6.2.1 TRIGO, POR TIPO
6.3 ARROZ
6.3.1 ARROZ, POR TIPO
6.4 MAÍZ
6.4.1 MAÍZ, POR TIPO
6.5 CEBADA
6.5.1 CEBADA, POR TIPO
6.6 AVENA
6.6.1 AVENA, POR TIPO
6.7 CENTENO
6.7.1 CENTENO, POR TIPO
6.8 SORGO
6.8.1 SORGO, POR TIPO
6.9 MIJO
6.9.1 MIJO, POR TIPO
6.1 QUINUA
6.10.1 QUINUA, POR TIPO
6.11 TRIGO SARRACENO
6.12 TRITICALE
6.13 FONIO
6.14 TEFF
6.15 AMARANTO
6.16 KAMUT
6.17 OTROS
7 MERCADO DE CEREALES DE ASIA-PACÍFICO, FORMA DEL PRODUCTO
7.1 DESCRIPCIÓN GENERAL
7.2 GRANOS ENTEROS
7.3 HARINA
7.4 GRANOS EN COPOS
7.5 GRANOS LAMINADOS
7.6 GRANOS INFLADOS
7.7 HARINA MOLIDA
7.8 GRANOS PARTIDOS
7.9 ALMIDÓN
7.1 SALVADO
7.11 GERMEN
7.12 OTROS
8 MERCADO DE CEREALES DE ASIA-PACÍFICO, POR NIVEL DE PROCESAMIENTO
8.1 DESCRIPCIÓN GENERAL
8.2 FORTIFICADO
8.3 DESCASCARILLADO
8.4 PULIDO
8.5 PRECOCINADOS
8.6 MEZCLADO
8.7 INSTANT
8.8 BROTARON
8.9 ASADO
8.1 EXTRUIDO
8.11 PARCIALMENTE COCIDO
8.12 MICRONIZADO
8.13 CRUDO
8.14 COMPLETAMENTE COCIDO
8.15 AL VAPOR
8.16 SAZONADO
8.17 ENDULZADO
8.18 RECUBIERTO
8.19 OTROS
9 MERCADO DE CEREALES DE ASIA-PACÍFICO, POR FORMATO DE CONSUMO
9.1 DESCRIPCIÓN GENERAL
9.2 CUCHARADAS CON LECHE/YOGUR
9.3 BARRAS PARA LLEVAR
9.4 GACHAS DE AVENA
9.5 SNACK SECO
9.6 PAQUETES DE BOCADILLOS
9.7 LISTO PARA COCINAR
9.8 LISTO PARA CALENTAR
9.9 INGREDIENTE PARA MEZCLAR
9.1 BEBIDA INFUSIONADA
9.11 OTROS
10 MERCADO DE CEREALES DE ASIA-PACÍFICO, POR CATEGORÍA DE PRODUCTO
10.1 DESCRIPCIÓN GENERAL
10.2 INGREDIENTES DE PANADERÍA (MEZCLAS DE HARINA/GRANOS)
10.3 CEREALES PARA EL DESAYUNO
10.3.1 CEREALES PARA EL DESAYUNO, POR TIPO
10.3.1.1 Listo para comer (RTE), por tipo
10.3.1.2 Cereales calientes, por tipo
10.4 MATERIAS PRIMAS/ALIMENTO PARA ANIMALES
10.5 APERITIVOS DE CEREALES
10.5.1 APERITIVOS DE CEREALES, POR TIPO
10.6 MEZCLAS DE CEREALES INSTANTÁNEOS
10.7 CEREALES INFANTILES
10.7.1 CEREALES INFANTILES, POR TIPO
10.8 KITS DE COMIDA A BASE DE CEREALES
10.9 INSUMOS PARA LA ELABORACIÓN/DESTILACIÓN DE CERVEZA
10.1 OTROS
11 MERCADO DE CEREALES DE ASIA-PACÍFICO, POR NATURALEZA
11.1 DESCRIPCIÓN GENERAL
11.2 CONVENCIONAL
11.3 ORGÁNICO
12 MERCADO DE CEREALES DE ASIA-PACÍFICO, POR CATEGORÍA
12.1 DESCRIPCIÓN GENERAL
12.2 BASADO EN OMG
12.3 CERTIFICADO SIN OMG
13 MERCADO DE CEREALES DE ASIA-PACÍFICO, POR BENEFICIOS FUNCIONALES
13.1 DESCRIPCIÓN GENERAL
13.2 ENRIQUECIDO CON VITAMINAS
13.3 ALTO EN FIBRA
13.4 BAJO/SIN AZÚCAR
13.5 ALTO EN PROTEÍNAS
13.6 SIN GLUTEN
13.7 SALUDABLE PARA EL CORAZÓN
13.8 PROBIÓTICO/PREBIÓTICO MEJORADO
13.9 REDUCCIÓN DEL COLESTEROL
13.1 ÍNDICE GLUCÉMICO BAJO
13.11 OMEGA-3 ENRIQUECIDO
13.12 BAJO EN GRASA
13.13 LIBRE DE ALÉRGENOS
13.14 ALTO EN HIERRO
13.15 BAJO EN SAL/SIN SAL
13.16 PALEO-AMIGABLE
13.17 APTO PARA KETO
13.18 CERTIFICADO VEGANO
13.19 OTROS
14 MERCADO DE CEREALES DE ASIA-PACÍFICO, POR VIDA ÚTIL
14.1 DESCRIPCIÓN GENERAL
14.2 LARGO PLAZO (ESTABLE A AMBIENTE)
14.3 MEDIO PLAZO
14.4 CORTO PLAZO (PERECEDEROS)
15 MERCADO DE CEREALES DE ASIA-PACÍFICO, POR ENVASE
15.1 DESCRIPCIÓN GENERAL
15.2 CAJA
15.2.1 CAJA, POR TIPO
15.3 BOLSA
15.3.1 BOLSA, POR TIPO
15.4 BOLSA
15.4.1 BOLSA, POR TIPO
15,5 SOBRES/PAQUETE DE BARRAS
15.6 SACO (A GRANEL)
15,7 frascos
15.7.1 FRASCO, POR TIPO
15.8 TETRA PACK / CARTÓN ASÉPTICO
15.9 RECIPIENTE
15.1 TAMBOR
15.11 EMBALAJE ECOLÓGICO
15.11.1 EMBALAJE ECOLÓGICO, POR TIPO
15.12 OTROS
16 MERCADO DE CEREALES DE ASIA-PACÍFICO, POR TAMAÑO DE ENVASE
16.1 DESCRIPCIÓN GENERAL
16.2 PAQUETES PEQUEÑOS (51G–250G)
16.3 PAQUETES MEDIANOS (251G–500G)
16,4 PAQUETES GRANDES (501 G–1 KG)
16,5 PAQUETES INDIVIDUALES (MENORES DE 50 G)
16.6 PAQUETES EXTRA GRANDES (1,1 KG–2,5 KG)
16.7 PAQUETES A GRANEL (MÁS DE 2,5 KG)
17 MERCADO DE CEREALES DE ASIA-PACÍFICO, POR RANGO DE PRECIOS
17.1 DESCRIPCIÓN GENERAL
17.2 ECONOMÍA (HASTA USD 2,49)
17.3 GAMA MEDIA (USD 2,50-6,99)
17.4 PREMIUM (USD 7.00 Y MÁS)
18 MERCADO DE CEREALES DE ASIA-PACÍFICO, POR CANAL DE DISTRIBUCIÓN
18.1 DESCRIPCIÓN GENERAL
18.2 B2B
18.3 B2C
18.3.1 B2C, POR TIPO
18.3.2 EN LÍNEA, POR TIPO
18.3.3 FUERA DE LÍNEA, POR TIPO
19 MERCADO DE CEREALES DE ASIA-PACÍFICO, POR REGIÓN
19.1 ASIA-PACÍFICO
19.1.1 CHINA
19.1.2 INDIA
19.1.3 JAPÓN
19.1.4 AUSTRALIA
19.1.5 COREA DEL SUR
19.1.6 MALASIA
19.1.7 SINGAPUR
19.1.8 TAILANDIA
19.1.9 FILIPINAS
19.1.10 INDONESIA
19.1.11 NUEVA ZELANDA
19.1.12 HONG KONG
19.1.13 TAIWÁN
19.1.14 RESTO DE ASIA-PACÍFICO
20 MERCADO DE CEREALES DE ASIA-PACÍFICO
20.1 ANÁLISIS DE ACCIONES DE LA EMPRESA: GLOBAL
21 ANÁLISIS FODA
22 PERFILES DE EMPRESAS
22.1 NESTLÉ
22.1.1 INSTANTÁNEA DE LA EMPRESA
22.1.2 ANÁLISIS DE INGRESOS
22.1.3 ANÁLISIS DE LAS ACCIONES DE LA EMPRESA
22.1.4 CARTERA DE MARCAS
22.1.5 DESARROLLO RECIENTE
22.2 ALIMENTOS BRITÁNICOS ASOCIADOS PLC
22.2.1 INSTANTÁNEA DE LA EMPRESA
22.2.2 ANÁLISIS DE INGRESOS
22.2.3 ANÁLISIS DE LAS ACCIONES DE LA EMPRESA
22.2.4 CARTERA DE NEGOCIOS
22.2.5 NOTICIAS RECIENTES
22.3 GENERAL MILLS INC.
22.3.1 INSTANTÁNEA DE LA EMPRESA
22.3.2 ANÁLISIS DE INGRESOS
22.3.3 ANÁLISIS DE LAS ACCIONES DE LA EMPRESA
22.3.4 CARTERA DE MARCAS
22.3.5 DESARROLLO RECIENTE
22.4 POST HOLDINGS, INC.
22.4.1 INSTANTÁNEA DE LA EMPRESA
22.4.2 ANÁLISIS DE INGRESOS
22.4.3 ANÁLISIS DE LAS ACCIONES DE LA EMPRESA
22.4.4 CARTERA DE MARCAS
22.4.5 DESARROLLO RECIENTE
22,5 semanas KELLOGG CO
22.5.1 INSTANTÁNEA DE LA EMPRESA
22.5.2 ANÁLISIS DE INGRESOS
22.5.3 ANÁLISIS DE LAS ACCIONES DE LA EMPRESA
22.5.4 CARTERA DE MARCAS
22.5.5 DESARROLLO RECIENTE
22.6 BAGRRY'S
22.6.1 INSTANTÁNEA DE LA EMPRESA
22.6.2 PORTAFOLIO DE PRODUCTOS
22.6.3 DESARROLLOS/NOTICIAS RECIENTES
22.7 B&G ALIMENTOS, INC.
22.7.1 INSTANTÁNEA DE LA EMPRESA
22.7.2 ANÁLISIS DE INGRESOS
22.7.3 PORTAFOLIO DE PRODUCTOS
22.7.4 DESARROLLO RECIENTE
22.8 PANADERÍA DE BARBARA
22.8.1 INSTANTÁNEA DE LA EMPRESA
22.8.2 PORTAFOLIO DE PRODUCTOS
22.8.3 DESARROLLO RECIENTE
22.9 BIO-FAMILIA EN
22.9.1 INSTANTÁNEA DE LA EMPRESA
22.9.2 PORTAFOLIO DE PRODUCTOS
22.9.3 DESARROLLOS/NOTICIAS RECIENTES
22.1 ALIMENTOS NATURALES BOB'S RED MILL
22.10.1 INSTANTÁNEA DE LA EMPRESA
22.10.2 PORTAFOLIO DE PRODUCTOS
22.10.3 DESARROLLOS/NOTICIAS RECIENTES
22.11 CÉRÉAL BIO
22.11.1 INSTANTÁNEA DE LA EMPRESA
22.11.2 PORTAFOLIO DE PRODUCTOS
22.11.3 DESARROLLO RECIENTE
22.12 CLEXTRAL
22.12.1 INSTANTÁNEA DE LA EMPRESA
22.12.2 PORTAFOLIO DE PRODUCTOS
22.12.3 DESARROLLO RECIENTE
22.13 DR. OETKER
22.13.1 INSTANTÁNEA DE LA EMPRESA
22.13.2 ANÁLISIS DE INGRESOS
22.13.3 PORTAFOLIO DE PRODUCTOS
22.13.4 DESARROLLOS/NOTICIAS RECIENTES
22.14 GRUPO HÉROE
22.14.1 INSTANTÁNEA DE LA EMPRESA
22.14.2 ANÁLISIS DE INGRESOS
22.14.3 PORTAFOLIO DE PRODUCTOS
22.14.4 DESARROLLOS/NOTICIAS RECIENTES
22.15 KASHI LLC
22.15.1 INSTANTÁNEA DE LA EMPRESA
22.15.2 PORTAFOLIO DE PRODUCTOS
22.15.3 DESARROLLO RECIENTE
22.16 KWALITY
22.16.1 INSTANTÁNEA DE LA EMPRESA
22.16.2 PORTAFOLIO DE PRODUCTOS
22.16.3 DESARROLLO RECIENTE
22.17 LIMAGRAIN - INGREDIENTES
22.17.1 INSTANTÁNEA DE LA EMPRESA
22.17.2 PORTAFOLIO DE PRODUCTOS
22.17.3 DESARROLLO RECIENTE
22.18 MARICO
22.18.1 INSTANTÁNEA DE LA EMPRESA
22.18.2 ANÁLISIS DE INGRESOS
22.18.3 CARTERA DE MARCAS
22.18.4 DESARROLLOS/NOTICIAS RECIENTES
22.19 CEREALES DE DESAYUNO MULDER
22.19.1 INSTANTÁNEA DE LA EMPRESA
22.19.2 PORTAFOLIO DE PRODUCTOS
22.19.3 DESARROLLO RECIENTE
22.2 CAMINO DE LA NATURALEZA
22.20.1 INSTANTÁNEA DE LA EMPRESA
22.20.2 PORTAFOLIO DE PRODUCTOS
22.20.3 DESARROLLO RECIENTE
22.21 PEPSICO
22.21.1 INSTANTÁNEA DE LA EMPRESA
22.21.2 ANÁLISIS DE INGRESOS
22.21.3 PORTAFOLIO DE PRODUCTOS
22.21.4 DESARROLLO RECIENTE
22.22 SALUD GROSERA
22.22.1 INSTANTÁNEA DE LA EMPRESA
22.22.2 PORTAFOLIO DE PRODUCTOS
22.22.3 DESARROLLOS/NOTICIAS RECIENTES
22.23 SANITARIO
22.23.1 INSTANTÁNEA DE LA EMPRESA
22.23.2 PORTAFOLIO DE PRODUCTOS
22.23.3 RECENT DEVELOPMENT
22.24 SEITENBACHER
22.24.1 COMPANY SNAPSHOT
22.24.2 PRODUCT PORTFOLIO
22.24.3 RECENT DEVELOPMENTS/NEWS
22.25 SEVEN SUNDAYS
22.25.1 COMPANY SNAPSHOT
22.25.2 PRODUCT PORTFOLIO
22.25.3 RECENT DEVELOPMENTS/NEWS
22.26 SURREAL UK
22.26.1 COMPANY SNAPSHOT
22.26.2 PRODUCT PORTFOLIO
22.26.3 RECENT DEVELOPMENTS/NEWS
22.27 THE HAIN CELESTIAL GROUP, INC.
22.27.1 COMPANY SNAPSHOT
22.27.2 REVENUE ANALYSIS
22.27.3 BRAND PORTFOLIO
22.27.4 RECENT DEVELOPMENTS/NEWS
22.28 THE QUAKER OATS COMPANY
22.28.1 COMPANY SNAPSHOT
22.28.2 PRODUCT PORTFOLIO
22.28.3 RECENT DEVELOPMENTS/NEWS
22.29 THE SILVER PALATE
22.29.1 COMPANY SNAPSHOT
22.29.2 PRODUCT PORTFOLIO
22.29.3 RECENT DEVELOPMENT
22.3 WEETABIX
22.30.1 COMPANY SNAPSHOT
22.30.2 PRODUCT PORTFOLIO
22.30.3 RECENT DEVELOPMENTS/NEWS
23 QUESTIONNAIRE
24 RELATED REPORTS
Lista de Tablas
CUADRO 1 RESUMEN DEL POSICIONAMIENTO COMPETITIVO:
TABLA 2 ANÁLISIS COMPARATIVO DE MARCAS
CUADRO 3 EXPORTACIÓN
CUADRO 4 IMPORTACIÓN
CUADRO 5 COSTOS DE LOS EQUIPOS CLAVE Y DE LAS PLANTAS DE PROCESAMIENTO DE CEREALES EN GENERAL
TABLA 6 ESCENARIOS DE MARGEN DE GANANCIA
TABLA 7 COMPORTAMIENTO DE COMPRA DEL CONSUMIDOR
TABLA 8 PRODUCCIÓN
CUADRO 9 CONSUMO
TABLA 10 COMPORTAMIENTO DE COMPRA DEL CONSUMIDOR
CUADRO 11 TASAS ARANCELARIAS DE IMPORTACIÓN DE CEREALES EN LOS 5 MERCADOS PRINCIPALES (2024)
CUADRO 12 PRODUCCIÓN LOCAL VS. DEPENDENCIA DE LAS IMPORTACIONES
TABLA 13 INCLINACIÓN REGULADORA
CUADRO 14 ASOCIACIONES COMERCIALES ENTRE LOS PAÍSES
CUADRO 15 ESTABLECIMIENTOS DE ALIANZAS
CUADRO 16 ESTABLECIMIENTO DE ZONAS ECONÓMICAS ESPECIALES (ZEE) Y PARQUES INDUSTRIALES
CUADRO 17 MERCADO DE CEREALES DE ASIA-PACÍFICO, POR TIPO DE CEREAL, 2018-2032 (MILES DE USD)
CUADRO 18 MERCADO DE CEREALES DE ASIA-PACÍFICO, POR TIPO DE CEREAL, 2018-2032 (MILES DE TONELADAS)
CUADRO 19 MERCADO DE TRIGO EN CEREALES DE ASIA-PACÍFICO, POR REGIÓN, 2018-2032 (MILES DE USD)
CUADRO 20 MERCADO DE TRIGO EN CEREALES DE ASIA-PACÍFICO, POR TIPO, 2018-2032 (MILES DE USD)
CUADRO 21 MERCADO DE ARROZ EN CEREALES DE ASIA-PACÍFICO, POR REGIÓN, 2018-2032 (MILES DE USD)
CUADRO 22 MERCADO DE ARROZ EN CEREALES DE ASIA-PACÍFICO, POR TIPO, 2018-2032 (MILES DE USD)
CUADRO 23 MERCADO DE MAÍZ EN CEREALES DE ASIA-PACÍFICO, POR REGIÓN, 2018-2032 (MILES DE USD)
CUADRO 24 MERCADO DE MAÍZ EN CEREALES DE ASIA-PACÍFICO, POR TIPO, 2018-2032 (MILES DE USD)
CUADRO 25 MERCADO DE CEBADA EN CEREALES DE ASIA-PACÍFICO, POR REGIÓN, 2018-2032 (MILES DE USD)
CUADRO 26 MERCADO DE CEBADA EN CEREALES DE ASIA-PACÍFICO, POR TIPO, 2018-2032 (MILES DE USD)
CUADRO 27 MERCADO DE AVENA EN CEREALES DE ASIA-PACÍFICO, POR REGIÓN, 2018-2032 (MILES DE USD)
CUADRO 28 MERCADO DE AVENA EN CEREALES DE ASIA-PACÍFICO, POR TIPO, 2018-2032 (MILES DE USD)
CUADRO 29 MERCADO DE CENTENO EN CEREALES DE ASIA-PACÍFICO, POR REGIÓN, 2018-2032 (MILES DE USD)
CUADRO 30 MERCADO DE CENTENO EN CEREALES DE ASIA-PACÍFICO, POR TIPO, 2018-2032 (MILES DE USD)
CUADRO 31 MERCADO DE SORGO EN CEREALES DE ASIA-PACÍFICO, POR REGIÓN, 2018-2032 (MILES DE USD)
CUADRO 32 MERCADO DE SORGO EN CEREALES DE ASIA-PACÍFICO, POR TIPO, 2018-2032 (MILES DE USD)
CUADRO 33 MERCADO DE MIJO EN CEREALES DE ASIA-PACÍFICO, POR REGIÓN, 2018-2032 (MILES DE USD)
CUADRO 34 MERCADO DE MIJO EN CEREALES DE ASIA-PACÍFICO, POR TIPO, 2018-2032 (MILES DE USD)
CUADRO 35 MERCADO DE QUINUA EN CEREALES EN ASIA-PACÍFICO, POR REGIÓN, 2018-2032 (MILES DE USD)
CUADRO 36 MERCADO DE QUINUA EN CEREALES DE ASIA-PACÍFICO, POR TIPO, 2018-2032 (MILES DE USD)
CUADRO 37 MERCADO DE TRIGO SARRACENO EN CEREALES DE ASIA-PACÍFICO, POR REGIÓN, 2018-2032 (MILES DE USD)
CUADRO 38 MERCADO DE TRITICALE EN CEREALES DE ASIA-PACÍFICO, POR REGIÓN, 2018-2032 (MILES DE USD)
CUADRO 39 MERCADO DE FONIO EN CEREALES DE ASIA-PACÍFICO, POR REGIÓN, 2018-2032 (MILES DE USD)
CUADRO 40 MERCADO DE TEFF EN CEREALES DE ASIA-PACÍFICO, POR REGIÓN, 2018-2032 (MILES DE USD)
CUADRO 41 MERCADO DE AMARANTO EN CEREALES DE ASIA-PACÍFICO, POR REGIÓN, 2018-2032 (MILES DE USD)
CUADRO 42 OTROS MERCADOS DE CEREALES DE ASIA-PACÍFICO, POR REGIÓN, 2018-2032 (MILES DE USD)
CUADRO 43 OTROS MERCADOS DE CEREALES DE ASIA-PACÍFICO, POR REGIÓN, 2018-2032 (MILES DE USD)
CUADRO 44 MERCADO DE CEREALES DE ASIA-PACÍFICO, POR FORMA DE PRODUCTO, 2018-2032 (MILES DE USD)
CUADRO 45 MERCADO DE GRANOS ENTEROS DE ASIA-PACÍFICO, POR REGIÓN, 2018-2032 (MILES DE USD)
CUADRO 46 MERCADO DE HARINA DE CEREALES DE ASIA-PACÍFICO, POR REGIÓN, 2018-2032 (MILES DE USD)
CUADRO 47 MERCADO DE GRANOS EN COPOS DE CEREALES DE ASIA-PACÍFICO, POR REGIÓN, 2018-2032 (MILES DE USD)
CUADRO 48 MERCADO DE GRANOS LAMINADOS EN CEREALES DE ASIA-PACÍFICO, POR REGIÓN, 2018-2032 (MILES DE USD)
CUADRO 49 MERCADO DE GRANOS INFLADOS DE ASIA-PACÍFICO, POR REGIÓN, 2018-2032 (MILES DE USD)
CUADRO 50 MERCADO DE HARINA MOLIDA DE CEREALES DE ASIA-PACÍFICO, POR REGIÓN, 2018-2032 (MILES DE USD)
CUADRO 51 MERCADO DE GRANOS PARTIDOS EN CEREALES DE ASIA-PACÍFICO, POR REGIÓN, 2018-2032 (MILES DE USD)
CUADRO 52 MERCADO DE ALMIDÓN EN CEREALES DE ASIA-PACÍFICO, POR REGIÓN, 2018-2032 (MILES DE USD)
CUADRO 53 MERCADO DE SALVADO DE CEREALES DE ASIA-PACÍFICO, POR REGIÓN, 2018-2032 (MILES DE USD)
CUADRO 54 MERCADO DE GERMEN DE CEREALES DE ASIA-PACÍFICO, POR REGIÓN, 2018-2032 (MILES DE USD)
CUADRO 55 OTROS MERCADOS DE CEREALES DE ASIA-PACÍFICO, POR REGIÓN, 2018-2032 (MILES DE USD)
CUADRO 56 MERCADO DE CEREALES DE ASIA-PACÍFICO, POR NIVEL DE PROCESAMIENTO, 2018-2032 (MILES DE USD)
CUADRO 57 MERCADO DE CEREALES ENRIQUECIDOS DE ASIA Y EL PACÍFICO, POR REGIÓN, 2018-2032 (MILES DE USD)
CUADRO 58 MERCADO DE CEREALES DESCASCARILLADOS DE ASIA-PACÍFICO, POR REGIÓN, 2018-2032 (MILES DE USD)
CUADRO 59 MERCADO DE CEREALES PULIDOS EN ASIA-PACÍFICO, POR REGIÓN, 2018-2032 (MILES DE USD)
CUADRO 60 MERCADO DE CEREALES PRECOCINADOS DE ASIA-PACÍFICO, POR REGIÓN, 2018-2032 (MILES DE USD)
CUADRO 61 MERCADO DE CEREALES MEZCLADOS DE ASIA-PACÍFICO, POR REGIÓN, 2018-2032 (MILES DE USD)
CUADRO 62 MERCADO DE CEREALES INSTANTÁNEO DE ASIA-PACÍFICO, POR REGIÓN, 2018-2032 (MILES DE USD)
CUADRO 63 MERCADO DE CEREALES GERMINADOS EN ASIA-PACÍFICO, POR REGIÓN, 2018-2032 (MILES DE USD)
CUADRO 64 MERCADO DE CEREALES TOSTADOS DE ASIA-PACÍFICO, POR REGIÓN, 2018-2032 (MILES DE USD)
CUADRO 65 MERCADO DE CEREALES EXTRUIDOS DE ASIA-PACÍFICO, POR REGIÓN, 2018-2032 (MILES DE USD)
CUADRO 66 MERCADO DE CEREALES PARCIALMENTE COCIDOS EN ASIA-PACÍFICO, POR REGIÓN, 2018-2032 (MILES DE USD)
CUADRO 67 MERCADO DE CEREALES MICRONIZADOS EN ASIA-PACÍFICO, POR REGIÓN, 2018-2032 (MILES DE USD)
CUADRO 68 MERCADO DE CEREALES CRUDOS DE ASIA-PACÍFICO, POR REGIÓN, 2018-2032 (MILES DE USD)
CUADRO 69 MERCADO DE CEREALES TOTALMENTE COCIDOS EN ASIA-PACÍFICO, POR REGIÓN, 2018-2032 (MILES DE USD)
CUADRO 70 MERCADO DE CEREALES AL VAPOR EN ASIA-PACÍFICO, POR REGIÓN, 2018-2032 (MILES DE USD)
CUADRO 71 MERCADO DE CEREALES SAZONADOS EN ASIA-PACÍFICO, POR REGIÓN, 2018-2032 (MILES DE USD)
CUADRO 72 MERCADO DE CEREALES ENDULZADOS DE ASIA-PACÍFICO, POR REGIÓN, 2018-2032 (MILES DE USD)
CUADRO 73 MERCADO DE CEREALES RECUBIERTOS DE ASIA-PACÍFICO, POR REGIÓN, 2018-2032 (MILES DE USD)
CUADRO 74 OTROS MERCADOS DE CEREALES DE ASIA-PACÍFICO, POR REGIÓN, 2018-2032 (MILES DE USD)
CUADRO 75 MERCADO DE CEREALES DE ASIA-PACÍFICO, POR FORMATO DE CONSUMO, 2018-2032 (MILES DE USD)
TABLA 76 ASIA-PACÍFICO CUCHARADAS CONSUMIDAS CON LECHE/YOGUR EN EL MERCADO DE CEREALES, POR REGIÓN, 2018-2032 (MILES DE USD)
TABLA 77 MERCADO DE BARRAS DE CEREALES PARA LLEVAR DE ASIA-PACÍFICO, POR REGIÓN, 2018-2032 (MILES DE USD)
CUADRO 78 MERCADO DE GACHAS DE ASIA Y EL PACÍFICO EN CEREALES, POR REGIÓN, 2018-2032 (MILES DE USD)
TABLA 79 MERCADO DE SNACKS SECOS DE CEREALES EN ASIA-PACÍFICO, POR REGIÓN, 2018-2032 (MILES DE USD)
TABLA 80 PAQUETES DE BOCADILLOS EN EL MERCADO DE CEREALES DE ASIA-PACÍFICO, POR REGIÓN, 2018-2032 (MILES DE USD)
CUADRO 81 MERCADO DE CEREALES LISTOS PARA COCINAR EN ASIA-PACÍFICO, POR REGIÓN, 2018-2032 (MILES DE USD)
CUADRO 82 MERCADO DE CEREALES LISTO PARA CALENTAR EN ASIA-PACÍFICO, POR REGIÓN, 2018-2032 (MILES DE USD)
TABLA 83 INGREDIENTES MIXTOS EN EL MERCADO DE CEREALES DE ASIA-PACÍFICO, POR REGIÓN, 2018-2032 (MILES DE USD)
CUADRO 84 MERCADO DE BEBIDAS CON INFUSIÓN EN CEREALES DE ASIA-PACÍFICO, POR REGIÓN, 2018-2032 (MILES DE USD)
CUADRO 85 OTROS MERCADOS DE CEREALES DE ASIA-PACÍFICO, POR REGIÓN, 2018-2032 (MILES DE USD)
CUADRO 86 MERCADO DE CEREALES DE ASIA-PACÍFICO, POR CATEGORÍA DE PRODUCTO, 2018-2032 (MILES DE USD)
TABLA 87 INGREDIENTES DE PANADERÍA DE ASIA-PACÍFICO (MEZCLAS DE HARINA/GRANOS) EN EL MERCADO DE CEREALES, POR REGIÓN, 2018-2032 (MILES DE USD)
CUADRO 88 CEREALES PARA EL DESAYUNO EN EL MERCADO DE CEREALES DE ASIA-PACÍFICO, POR REGIÓN, 2018-2032 (MILES DE USD)
CUADRO 89 CEREALES PARA DESAYUNO EN EL MERCADO DE CEREALES DE ASIA-PACÍFICO, POR TIPO, 2018-2032 (MILES DE USD)
CUADRO 90 MERCADO DE CEREALES LISTO PARA COMER (RTE) DE ASIA-PACÍFICO, POR TIPO, 2018-2032 (MILES DE USD)
CUADRO 91 CEREALES CALIENTES EN EL MERCADO DE CEREALES DE ASIA-PACÍFICO, POR TIPO, 2018-2032 (MILES DE USD)
CUADRO 92 MERCADO DE CEREALES PARA MATERIAS PRIMAS/ALIMENTOS ANIMALES DE ASIA-PACÍFICO, POR REGIÓN, 2018-2032 (MILES DE USD)
TABLA 93 SNACKS DE CEREALES EN EL MERCADO DE CEREALES DE ASIA-PACÍFICO, POR REGIÓN, 2018-2032 (MILES DE USD)
TABLA 94 SNACKS DE CEREALES EN EL MERCADO DE CEREALES DE ASIA-PACÍFICO, POR TIPO, 2018-2032 (MILES DE USD)
CUADRO 95 MEZCLAS DE CEREALES INSTANTÁNEOS DE ASIA-PACÍFICO EN EL MERCADO DE CEREALES, POR REGIÓN, 2018-2032 (MILES DE USD)
CUADRO 96 CEREALES INFANTILES DE ASIA-PACÍFICO EN EL MERCADO DE CEREALES, POR REGIÓN, 2018-2032 (MILES DE USD)
CUADRO 97 CEREALES INFANTILES DE ASIA-PACÍFICO EN EL MERCADO DE CEREALES, POR TIPO, 2018-2032 (MILES DE USD)
CUADRO 98 KITS DE COMIDA A BASE DE CEREALES EN EL MERCADO DE CEREALES DE ASIA-PACÍFICO, POR REGIÓN, 2018-2032 (MILES DE USD)
CUADRO 99 INSUMOS PARA LA CERVECERÍA Y DESTILACIÓN EN EL MERCADO DE CEREALES DE ASIA-PACÍFICO, POR REGIÓN, 2018-2032 (MILES DE USD)
CUADRO 100 OTROS MERCADOS DE CEREALES DE ASIA-PACÍFICO, POR REGIÓN, 2018-2032 (MILES DE USD)
CUADRO 101 MERCADO DE CEREALES DE ASIA-PACÍFICO, POR NATURALEZA, 2018-2032 (MILES DE USD)
CUADRO 102 MERCADO DE CEREALES CONVENCIONALES DE ASIA-PACÍFICO, POR REGIÓN, 2018-2032 (MILES DE USD)
CUADRO 103 MERCADO DE CEREALES ORGÁNICOS DE ASIA-PACÍFICO, POR REGIÓN, 2018-2032 (MILES DE USD)
CUADRO 104 MERCADO DE CEREALES DE ASIA-PACÍFICO, POR CATEGORÍA, 2018-2032 (MILES DE USD)
CUADRO 105 MERCADO DE CEREALES BASADOS EN OGM DE ASIA-PACÍFICO, POR REGIÓN, 2018-2032 (MILES DE USD)
CUADRO 106 ASIA-PACÍFICO NO OGM CERTIFICADO EN EL MERCADO DE CEREALES, POR REGIÓN, 2018-2032 (MILES DE USD)
CUADRO 107 MERCADO DE CEREALES DE ASIA-PACÍFICO, POR BENEFICIOS FUNCIONALES, 2018-2032 (MILES DE USD)
CUADRO 108 MERCADO DE CEREALES ENRIQUECIDOS CON VITAMINAS EN ASIA-PACÍFICO, POR REGIÓN, 2018-2032 (MILES DE USD)
CUADRO 109 MERCADO DE CEREALES CON ALTO CONTENIDO DE FIBRA DE ASIA-PACÍFICO, POR REGIÓN, 2018-2032 (MILES DE USD)
CUADRO 110 MERCADO DE CEREALES CON BAJO CONTENIDO DE AZÚCAR O SIN AZÚCAR EN ASIA-PACÍFICO, POR REGIÓN, 2018-2032 (MILES DE USD)
CUADRO 111 MERCADO DE CEREALES CON ALTO CONTENIDO DE PROTEÍNAS DE ASIA-PACÍFICO, POR REGIÓN, 2018-2032 (MILES DE USD)
CUADRO 112 MERCADO DE CEREALES SIN GLUTEN DE ASIA-PACÍFICO, POR REGIÓN, 2018-2032 (MILES DE USD)
TABLA 113 MERCADO DE CEREALES SALUDABLES PARA EL CORAZÓN EN ASIA-PACÍFICO, POR REGIÓN, 2018-2032 (MILES DE USD)
CUADRO 114 MERCADO DE CEREALES MEJORADOS CON PROBIÓTICOS/PREBIÓTICOS DE ASIA-PACÍFICO, POR REGIÓN, 2018-2032 (MILES DE USD)
CUADRO 115 MERCADO DE CEREALES PARA LA REDUCCIÓN DEL COLESTEROL EN ASIA-PACÍFICO, POR REGIÓN, 2018-2032 (MILES DE USD)
CUADRO 116 ÍNDICE GLUCÉMICO BAJO EN EL MERCADO DE CEREALES DE ASIA-PACÍFICO, POR REGIÓN, 2018-2032 (MILES DE USD)
CUADRO 117 MERCADO DE CEREALES ENRIQUECIDOS CON OMEGA-3 DE ASIA-PACÍFICO, POR REGIÓN, 2018-2032 (MILES DE USD)
CUADRO 118 MERCADO DE CEREALES BAJOS EN GRASA DE ASIA-PACÍFICO, POR REGIÓN, 2018-2032 (MILES DE USD)
TABLA 119 MERCADO DE CEREALES LIBRES DE ALÉRGENOS DE ASIA-PACÍFICO, POR REGIÓN, 2018-2032 (MILES DE USD)
CUADRO 120 MERCADO DE CEREALES CON ALTO CONTENIDO DE HIERRO EN ASIA-PACÍFICO, POR REGIÓN, 2018-2032 (MILES DE USD)
CUADRO 121 MERCADO DE CEREALES CON BAJO CONTENIDO DE SAL O SIN SAL, ASIA-PACÍFICO, POR REGIÓN, 2018-2032 (MILES DE USD)
CUADRO 122 MERCADO DE CEREALES AMIGABLES CON LA POLÍTICA PALEOFICIAL DE ASIA Y EL PACÍFICO, POR REGIÓN, 2018-2032 (MILES DE USD)
TABLA 123 MERCADO DE CEREALES CETO-AMIGABLES EN ASIA-PACÍFICO, POR REGIÓN, 2018-2032 (MILES DE USD)
TABLA 124 MERCADO DE CEREALES CON CERTIFICACIÓN VEGANA DE ASIA-PACÍFICO, POR REGIÓN, 2018-2032 (MILES DE USD)
CUADRO 125 OTROS MERCADOS DE CEREALES DE ASIA-PACÍFICO, POR REGIÓN, 2018-2032 (MILES DE USD)
CUADRO 126 MERCADO DE CEREALES DE ASIA-PACÍFICO, POR VIDA ÚTIL, 2018-2032 (MILES DE USD)
CUADRO 127 MERCADO DE CEREALES A LARGO PLAZO (CONSERVACIÓN AMBIENTAL) EN ASIA-PACÍFICO, POR REGIÓN, 2018-2032 (MILES DE USD)
CUADRO 128 MERCADO DE CEREALES A MEDIANO PLAZO EN ASIA-PACÍFICO, POR REGIÓN, 2018-2032 (MILES DE USD)
CUADRO 129 MERCADO DE CEREALES A CORTO PLAZO (PERECEDEROS) EN ASIA-PACÍFICO, POR REGIÓN, 2018-2032 (MILES DE USD)
CUADRO 130 MERCADO DE CEREALES DE ASIA-PACÍFICO, POR ENVASE, 2018-2032 (MILES DE USD)
CUADRO 131 RECUADRO DE ASIA-PACÍFICO EN EL MERCADO DE CEREALES, POR REGIÓN, 2018-2032 (MILES DE USD)
TABLA 132 CUADRO DE ASIA-PACÍFICO EN EL MERCADO DE CEREALES, POR TIPO, 2018-2032 (MILES DE USD)
CUADRO 133 BOLSA DE ASIA-PACÍFICO EN EL MERCADO DE CEREALES, POR REGIÓN, 2018-2032 (MILES DE USD)
TABLA 134 BOLSA DE ASIA-PACÍFICO EN EL MERCADO DE CEREALES, POR TIPO, 2018-2032 (MILES DE USD)
CUADRO 135 BOLSA DE ASIA-PACÍFICO EN EL MERCADO DE CEREALES, POR REGIÓN, 2018-2032 (MILES DE USD)
TABLA 136 BOLSA DE ASIA-PACÍFICO EN EL MERCADO DE CEREALES, POR TIPO, 2018-2032 (MILES DE USD)
TABLA 137 MERCADO DE CEREALES EN SOBRES/PALITOS DE ASIA-PACÍFICO, POR REGIÓN, 2018-2032 (MILES DE USD)
CUADRO 138 MERCADO DE CEREALES A GRANEL EN SACOS DE ASIA-PACÍFICO, POR REGIÓN, 2018-2032 (MILES DE USD)
TABLA 139 MERCADO DE CEREALES EN ASIA-PACÍFICO, POR REGIÓN, 2018-2032 (MILES DE USD)
TABLA 140 MERCADO DE CEREALES EN ASIA-PACÍFICO, POR TIPO, 2018-2032 (MILES DE USD)
TABLA 141 MERCADO DE CEREALES TETRA PACK/ASÉPTICO EN ASIA-PACÍFICO, POR REGIÓN, 2018-2032 (MILES DE USD)
CUADRO 142 MERCADO DE CEREALES EN LATA DE ASIA-PACÍFICO, POR REGIÓN, 2018-2032 (MILES DE USD)
CUADRO 143 MERCADO DE CEREALES EN ASIA-PACÍFICO, POR REGIÓN, 2018-2032 (MILES DE USD)
CUADRO 144 MERCADO DE ENVASES ECOLÓGICOS DE CEREALES EN ASIA-PACÍFICO, POR REGIÓN, 2018-2032 (MILES DE USD)
CUADRO 145 ENVASES ECOLÓGICOS EN EL MERCADO DE CEREALES DE ASIA-PACÍFICO, POR TIPO, 2018-2032 (MILES DE USD)
CUADRO 146 MERCADO DE ENVASES ECOLÓGICOS DE CEREALES EN ASIA-PACÍFICO, POR REGIÓN, 2018-2032 (MILES DE USD)
CUADRO 147 MERCADO DE CEREALES DE ASIA-PACÍFICO, POR TAMAÑO DE ENVASE, 2018-2032 (MILES DE USD)
TABLA 148 PAQUETES PEQUEÑOS DE ASIA-PACÍFICO (51G–250G) EN EL MERCADO DE CEREALES, POR REGIÓN, 2018-2032 (MILES DE USD)
TABLA 149 PAQUETES MEDIANOS DE ASIA-PACÍFICO (251G–500G) EN EL MERCADO DE CEREALES, POR REGIÓN, 2018-2032 (MILES DE USD)
TABLA 150 PAQUETES GRANDES DE ASIA-PACÍFICO (501G–1KG) EN EL MERCADO DE CEREALES, POR REGIÓN, 2018-2032 (MILES DE USD)
TABLA 151 PAQUETES INDIVIDUALES DE ASIA-PACÍFICO (MENORES DE 50 G) EN EL MERCADO DE CEREALES, POR REGIÓN, 2018-2032 (MILES DE USD)
TABLA 152 PAQUETES EXTRA GRANDES DE ASIA-PACÍFICO (1,1 KG–2,5 KG) EN EL MERCADO DE CEREALES, POR REGIÓN, 2018-2032 (MILES DE USD)
TABLA 153 PAQUETES A GRANEL DE ASIA-PACÍFICO (MÁS DE 2,5 KG) EN EL MERCADO DE CEREALES, POR REGIÓN, 2018-2032 (MILES DE USD)
CUADRO 154 MERCADO DE CEREALES DE ASIA-PACÍFICO, POR RANGO DE PRECIOS, 2018-2032 (MILES DE USD)
CUADRO 155 ECONOMÍA DE ASIA-PACÍFICO (HASTA USD 2,49) EN EL MERCADO DE CEREALES, POR REGIÓN, 2018-2032 (MILES DE USD)
CUADRO 156 MERCADO DE CEREALES DE RANGO MEDIO (USD 2,50-6,99) EN ASIA-PACÍFICO, POR REGIÓN, 2018-2032 (MILES DE USD)
CUADRO 157 PRIMA DE ASIA-PACÍFICO (USD 7,00 Y MÁS) EN EL MERCADO DE CEREALES, POR REGIÓN, 2018-2032 (MILES DE USD)
CUADRO 158 MERCADO DE CEREALES DE ASIA-PACÍFICO, POR CANAL DE DISTRIBUCIÓN, 2018-2032 (MILES DE USD)
CUADRO 159 MERCADO B2B DE CEREALES EN ASIA-PACÍFICO, POR REGIÓN, 2018-2032 (MILES DE USD)
CUADRO 160 MERCADO B2C DE CEREALES EN ASIA-PACÍFICO, POR REGIÓN, 2018-2032 (MILES DE USD)
TABLA 161 MERCADO B2C DE CEREALES EN ASIA-PACÍFICO, POR TIPO, 2018-2032 (MILES DE USD)
TABLA 162 MERCADO DE CEREALES EN LÍNEA DE ASIA-PACÍFICO, POR TIPO, 2018-2032 (MILES DE USD)
CUADRO 163 MERCADO DE CEREALES SIN CONEXIÓN EN ASIA-PACÍFICO, POR TIPO, 2018-2032 (MILES DE USD)
CUADRO 164 MERCADO DE CEREALES DE ASIA-PACÍFICO, POR PAÍS, 2018-2032 (MILES DE USD)
CUADRO 165 MERCADO DE CEREALES DE ASIA-PACÍFICO, POR TIPO DE CEREAL, 2018-2032 (MILES DE USD)
CUADRO 166 MERCADO DE CEREALES DE ASIA-PACÍFICO, POR TIPO DE CEREAL, 2018-2032 (MILES DE TONELADAS)
CUADRO 167 MERCADO DE TRIGO EN CEREALES DE ASIA-PACÍFICO, POR TIPO, 2018-2032 (MILES DE USD)
CUADRO 168 MERCADO DE ARROZ EN CEREALES DE ASIA-PACÍFICO, POR TIPO, 2018-2032 (MILES DE USD)
CUADRO 169 MERCADO DE MAÍZ EN CEREALES DE ASIA-PACÍFICO, POR TIPO, 2018-2032 (MILES DE USD)
CUADRO 170 MERCADO DE CEBADA EN CEREALES DE ASIA-PACÍFICO, POR TIPO, 2018-2032 (MILES DE USD)
CUADRO 171 MERCADO DE AVENA EN CEREALES DE ASIA-PACÍFICO, POR TIPO, 2018-2032 (MILES DE USD)
CUADRO 172 MERCADO DE CENTENO EN CEREALES DE ASIA-PACÍFICO, POR TIPO, 2018-2032 (MILES DE USD)
CUADRO 173 MERCADO DE SORGO EN CEREALES DE ASIA-PACÍFICO, POR TIPO, 2018-2032 (MILES DE USD)
CUADRO 174 MERCADO DE MIJO EN CEREALES DE ASIA-PACÍFICO, POR TIPO, 2018-2032 (MILES DE USD)
CUADRO 175 MERCADO DE QUINUA EN CEREALES DE ASIA-PACÍFICO, POR TIPO, 2018-2032 (MILES DE USD)
CUADRO 176 MERCADO DE CEREALES DE ASIA-PACÍFICO, POR FORMA DE PRODUCTO, 2018-2032 (MILES DE USD)
CUADRO 177 MERCADO DE CEREALES DE ASIA-PACÍFICO, POR NIVEL DE PROCESAMIENTO, 2018-2032 (MILES DE USD)
CUADRO 178 MERCADO DE CEREALES DE ASIA-PACÍFICO, POR FORMATO DE CONSUMO, 2018-2032 (MILES DE USD)
CUADRO 179 MERCADO DE CEREALES DE ASIA-PACÍFICO, POR CATEGORÍA DE PRODUCTO, 2018-2032 (MILES DE USD)
CUADRO 180 CEREALES PARA EL DESAYUNO EN EL MERCADO DE CEREALES DE ASIA-PACÍFICO, POR TIPO, 2018-2032 (MILES DE USD)
CUADRO 181 MERCADO DE CEREALES LISTO PARA COMER (RTE) DE ASIA-PACÍFICO, POR TIPO, 2018-2032 (MILES DE USD)
CUADRO 182 CEREALES CALIENTES EN EL MERCADO DE CEREALES DE ASIA-PACÍFICO, POR TIPO, 2018-2032 (MILES DE USD)
TABLA 183 SNACKS DE CEREALES EN EL MERCADO DE CEREALES DE ASIA-PACÍFICO, POR TIPO, 2018-2032 (MILES DE USD)
CUADRO 184 CEREALES INFANTILES DE ASIA-PACÍFICO EN EL MERCADO DE CEREALES, POR TIPO, 2018-2032 (MILES DE USD)
CUADRO 185 MERCADO DE CEREALES DE ASIA-PACÍFICO, POR NATURALEZA, 2018-2032 (MILES DE USD)
CUADRO 186 MERCADO DE CEREALES DE ASIA-PACÍFICO, POR CATEGORÍA, 2018-2032 (MILES DE USD)
CUADRO 187 MERCADO DE CEREALES DE ASIA-PACÍFICO, POR BENEFICIOS FUNCIONALES, 2018-2032 (MILES DE USD)
CUADRO 188 MERCADO DE CEREALES DE ASIA-PACÍFICO, POR VIDA ÚTIL, 2018-2032 (MILES DE USD)
CUADRO 189 MERCADO DE CEREALES DE ASIA-PACÍFICO, POR ENVASE, 2018-2032 (MILES DE USD)
TABLA 190 RECUADRO DE ASIA-PACÍFICO EN EL MERCADO DE CEREALES, POR TIPO, 2018-2032 (MILES DE USD)
TABLA 191 BOLSA DE ASIA-PACÍFICO EN EL MERCADO DE CEREALES, POR TIPO, 2018-2032 (MILES DE USD)
TABLA 192 BOLSA DE ASIA-PACÍFICO EN EL MERCADO DE CEREALES, POR TIPO, 2018-2032 (MILES DE USD)
TABLA 193 MERCADO DE CEREALES EN ASIA-PACÍFICO, POR TIPO, 2018-2032 (MILES DE USD)
CUADRO 194 MERCADO DE ENVASES ECOLÓGICOS DE CEREALES EN ASIA-PACÍFICO, POR TIPO, 2018-2032 (MILES DE USD)
CUADRO 195 MERCADO DE CEREALES DE ASIA-PACÍFICO, POR TAMAÑO DE ENVASE, 2018-2032 (MILES DE USD)
CUADRO 196 MERCADO DE CEREALES DE ASIA-PACÍFICO, POR RANGO DE PRECIOS, 2018-2032 (MILES DE USD)
CUADRO 197 MERCADO DE CEREALES DE ASIA-PACÍFICO, POR CANAL DE DISTRIBUCIÓN, 2018-2032 (MILES DE USD)
CUADRO 198 MERCADO B2C DE CEREALES DE ASIA-PACÍFICO, POR TIPO, 2018-2032 (MILES DE USD)
CUADRO 199 MERCADO DE CEREALES EN LÍNEA EN ASIA-PACÍFICO, POR TIPO, 2018-2032 (MILES DE USD)
CUADRO 200 MERCADO DE CEREALES SIN CONEXIÓN EN ASIA-PACÍFICO, POR TIPO, 2018-2032 (MILES DE USD)
TABLA 201 MERCADO DE CEREALES DE CHINA, POR TIPO DE CEREAL, 2018-2032 (MILES DE USD)
CUADRO 202 MERCADO DE CEREALES DE CHINA, POR TIPO DE CEREAL, 2018-2032 (MILES DE TONELADAS)
TABLA 203 MERCADO DE TRIGO EN CEREALES DE CHINA, POR TIPO, 2018-2032 (MILES DE USD)
TABLA 204 MERCADO DE ARROZ EN CEREALES DE CHINA, POR TIPO, 2018-2032 (MILES DE USD)
TABLA 205 MAÍZ DE CHINA EN EL MERCADO DE CEREALES, POR TIPO, 2018-2032 (MILES DE USD)
TABLA 206 MERCADO DE CEBADA EN CEREALES DE CHINA, POR TIPO, 2018-2032 (MILES DE USD)
TABLA 207 AVENA DE CHINA EN EL MERCADO DE CEREALES, POR TIPO, 2018-2032 (MILES DE USD)
TABLA 208 MERCADO DE CENTENO DE CHINA EN CEREALES, POR TIPO, 2018-2032 (MILES DE USD)
CUADRO 209 SORGO DE CHINA EN EL MERCADO DE CEREALES, POR TIPO, 2018-2032 (MILES DE USD)
CUADRO 210 MIJO DE CHINA EN EL MERCADO DE CEREALES, POR TIPO, 2018-2032 (MILES DE USD)
TABLA 211 QUINUA CHINA EN EL MERCADO DE CEREALES, POR TIPO, 2018-2032 (MILES DE USD)
TABLA 212 MERCADO DE CEREALES DE CHINA, POR FORMA DE PRODUCTO, 2018-2032 (MILES DE USD)
CUADRO 213 MERCADO DE CEREALES DE CHINA, POR NIVEL DE PROCESAMIENTO, 2018-2032 (MILES DE USD)
TABLA 214 MERCADO DE CEREALES DE CHINA, POR FORMATO DE CONSUMO, 2018-2032 (MILES DE USD)
TABLA 215 MERCADO DE CEREALES DE CHINA, POR CATEGORÍA DE PRODUCTO, 2018-2032 (MILES DE USD)
TABLA 216 CEREALES DE DESAYUNO DE CHINA EN EL MERCADO DE CEREALES, POR TIPO, 2018-2032 (MILES DE USD)
TABLA 217 MERCADO DE CEREALES LISTO PARA COMER (RTE) DE CHINA, POR TIPO, 2018-2032 (MILES DE USD)
TABLA 218 CEREALES CALIENTES DE CHINA EN EL MERCADO DE CEREALES, POR TIPO, 2018-2032 (MILES DE USD)
TABLA 219 SNACKS DE CEREALES DE CHINA EN EL MERCADO DE CEREALES, POR TIPO, 2018-2032 (MILES DE USD)
TABLA 220 CEREALES INFANTILES DE CHINA EN EL MERCADO DE CEREALES, POR TIPO, 2018-2032 (MILES DE USD)
TABLA 221 MERCADO DE CEREALES DE CHINA, POR NATURALEZA, 2018-2032 (MILES DE USD)
TABLA 222 MERCADO DE CEREALES DE CHINA, POR CATEGORÍA, 2018-2032 (MILES DE USD)
TABLA 223 MERCADO DE CEREALES DE CHINA, POR BENEFICIOS FUNCIONALES, 2018-2032 (MILES DE USD)
TABLA 224 MERCADO DE CEREALES DE CHINA, POR VIDA ÚTIL, 2018-2032 (MILES DE USD)
TABLA 225 MERCADO DE CEREALES DE CHINA, POR ENVASE, 2018-2032 (MILES DE USD)
TABLA 226 CAJA DE CHINA EN EL MERCADO DE CEREALES, POR TIPO, 2018-2032 (MILES DE USD)
TABLA 227 BOLSA DE CHINA EN EL MERCADO DE CEREALES, POR TIPO, 2018-2032 (MILES DE USD)
TABLA 228 BOLSA DE CHINA EN EL MERCADO DE CEREALES, POR TIPO, 2018-2032 (MILES DE USD)
TABLA 229 TARRO DE PORCELANA EN EL MERCADO DE CEREALES, POR TIPO, 2018-2032 (MILES DE USD)
TABLA 230 ENVASES ECOLÓGICOS EN EL MERCADO DE CEREALES DE CHINA, POR TIPO, 2018-2032 (MILES DE USD)
TABLA 231 MERCADO DE CEREALES DE CHINA, POR TAMAÑO DE ENVASE, 2018-2032 (MILES DE USD)
CUADRO 232 MERCADO DE CEREALES DE CHINA, POR RANGO DE PRECIOS, 2018-2032 (MILES DE USD)
TABLA 233 MERCADO DE CEREALES DE CHINA, POR CANAL DE DISTRIBUCIÓN, 2018-2032 (MILES DE USD)
TABLA 234 MERCADO DE CEREALES B2C DE CHINA, POR TIPO, 2018-2032 (MILES DE USD)
TABLA 235 MERCADO DE CEREALES EN LÍNEA DE CHINA, POR TIPO, 2018-2032 (MILES DE USD)
TABLA 236 CHINA DESCONECTADA EN EL MERCADO DE CEREALES, POR TIPO, 2018-2032 (MILES DE USD)
TABLA 237 MERCADO DE CEREALES DE LA INDIA, POR TIPO DE CEREAL, 2018-2032 (MILES DE USD)
TABLA 238 MERCADO DE CEREALES DE LA INDIA, POR TIPO DE CEREAL, 2018-2032 (MILES DE TONELADAS)
TABLA 239 MERCADO DE TRIGO EN CEREALES DE LA INDIA, POR TIPO, 2018-2032 (MILES DE USD)
TABLA 240 MERCADO DE ARROZ EN CEREALES DE LA INDIA, POR TIPO, 2018-2032 (MILES DE USD)
TABLA 241 MERCADO DE MAÍZ EN CEREALES DE INDIA, POR TIPO, 2018-2032 (MILES DE USD)
TABLA 242 MERCADO DE CEBADA EN CEREALES DE LA INDIA, POR TIPO, 2018-2032 (MILES DE USD)
TABLA 243 MERCADO DE AVENA EN CEREALES DE INDIA, POR TIPO, 2018-2032 (MILES DE USD)
TABLA 244 MERCADO DE CENTENO EN CEREALES DE INDIA, POR TIPO, 2018-2032 (MILES DE USD)
TABLA 245 SORGO EN EL MERCADO DE CEREALES DE LA INDIA, POR TIPO, 2018-2032 (MILES DE USD)
TABLA 246 MIJO EN EL MERCADO DE CEREALES DE LA INDIA, POR TIPO, 2018-2032 (MILES DE USD)
TABLA 247 MERCADO DE QUINUA EN CEREALES EN INDIA, POR TIPO, 2018-2032 (MILES DE USD)
TABLA 248 MERCADO DE CEREALES DE LA INDIA, POR FORMA DE PRODUCTO, 2018-2032 (MILES DE USD)
CUADRO 249 MERCADO DE CEREALES DE LA INDIA, POR NIVEL DE PROCESAMIENTO, 2018-2032 (MILES DE USD)
TABLA 250 MERCADO DE CEREALES DE LA INDIA, POR FORMATO DE CONSUMO, 2018-2032 (MILES DE USD)
TABLA 251 MERCADO DE CEREALES DE LA INDIA, POR CATEGORÍA DE PRODUCTO, 2018-2032 (MILES DE USD)
TABLA 252 CEREALES PARA DESAYUNO EN EL MERCADO DE CEREALES DE INDIA, POR TIPO, 2018-2032 (MILES DE USD)
TABLA 253 MERCADO DE CEREALES LISTO PARA COMER (RTE) EN INDIA, POR TIPO, 2018-2032 (MILES DE USD)
TABLA 254 CEREALES CALIENTES EN EL MERCADO DE CEREALES DE LA INDIA, POR TIPO, 2018-2032 (MILES DE USD)
TABLA 255 SNACKS DE CEREALES EN EL MERCADO DE CEREALES DE LA INDIA, POR TIPO, 2018-2032 (MILES DE USD)
TABLA 256 CEREALES INFANTILES EN EL MERCADO DE CEREALES DE LA INDIA, POR TIPO, 2018-2032 (MILES DE USD)
TABLA 257 MERCADO DE CEREALES DE LA INDIA, POR NATURALEZA, 2018-2032 (MILES DE USD)
TABLA 258 MERCADO DE CEREALES DE LA INDIA, POR CATEGORÍA, 2018-2032 (MILES DE USD)
TABLA 259 MERCADO DE CEREALES DE LA INDIA, POR BENEFICIOS FUNCIONALES, 2018-2032 (MILES DE USD)
TABLA 260 MERCADO DE CEREALES DE LA INDIA, POR VIDA ÚTIL, 2018-2032 (MILES DE USD)
TABLA 261 MERCADO DE CEREALES DE LA INDIA, POR ENVASE, 2018-2032 (MILES DE USD)
TABLA 262 CUADRO DE INDIA EN EL MERCADO DE CEREALES, POR TIPO, 2018-2032 (MILES DE USD)
TABLA 263 INDIA BOLSA EN EL MERCADO DE CEREALES, POR TIPO, 2018-2032 (MILES DE USD)
TABLA 264 BOLSA DE CEREALES EN EL MERCADO DE INDIA, POR TIPO, 2018-2032 (MILES DE USD)
TABLA 265. MERCADO DE CEREALES EN FRASCO DE INDIA, POR TIPO, 2018-2032 (MILES DE USD)
TABLA 266 ENVASES ECOLÓGICOS EN EL MERCADO DE CEREALES DE LA INDIA, POR TIPO, 2018-2032 (MILES DE USD)
TABLA 267 MERCADO DE CEREALES DE LA INDIA, POR TAMAÑO DE ENVASE, 2018-2032 (MILES DE USD)
TABLA 268 MERCADO DE CEREALES DE LA INDIA, POR RANGO DE PRECIOS, 2018-2032 (MILES DE USD)
TABLA 269 MERCADO DE CEREALES DE LA INDIA, POR CANAL DE DISTRIBUCIÓN, 2018-2032 (MILES DE USD)
TABLA 270 MERCADO DE CEREALES B2C EN INDIA, POR TIPO, 2018-2032 (MILES DE USD)
TABLA 271 INDIA EN LÍNEA EN EL MERCADO DE CEREALES, POR TIPO, 2018-2032 (MILES DE USD)
TABLA 272 INDIA SIN CONEXIÓN EN EL MERCADO DE CEREALES, POR TIPO, 2018-2032 (MILES DE USD)
TABLA 273 MERCADO DE CEREALES DE JAPÓN, POR TIPO DE CEREAL, 2018-2032 (MILES DE USD)
CUADRO 274 MERCADO DE CEREALES DE JAPÓN, POR TIPO DE CEREAL, 2018-2032 (MILES DE TONELADAS)
TABLA 275 MERCADO DE TRIGO EN CEREALES DE JAPÓN, POR TIPO, 2018-2032 (MILES DE USD)
TABLA 276 MERCADO DE ARROZ EN CEREALES DE JAPÓN, POR TIPO, 2018-2032 (MILES DE USD)
TABLA 277 MERCADO DE MAÍZ EN CEREALES DE JAPÓN, POR TIPO, 2018-2032 (MILES DE USD)
TABLA 278 MERCADO DE CEBADA EN CEREALES DE JAPÓN, POR TIPO, 2018-2032 (MILES DE USD)
TABLA 279 MERCADO DE AVENA EN CEREALES DE JAPÓN, POR TIPO, 2018-2032 (MILES DE USD)
TABLA 280 MERCADO DE CENTENO EN CEREALES DE JAPÓN, POR TIPO, 2018-2032 (MILES DE USD)
TABLA 281 SORGO JAPONÉS EN EL MERCADO DE CEREALES, POR TIPO, 2018-2032 (MILES DE USD)
TABLA 282 MIJO JAPONÉS EN EL MERCADO DE CEREALES, POR TIPO, 2018-2032 (MILES DE USD)
TABLA 283 MERCADO DE QUINUA EN CEREALES DE JAPÓN, POR TIPO, 2018-2032 (MILES DE USD)
TABLA 284 MERCADO DE CEREALES DE JAPÓN, POR FORMA DE PRODUCTO, 2018-2032 (MILES DE USD)
CUADRO 285 MERCADO DE CEREALES DE JAPÓN, POR NIVEL DE PROCESAMIENTO, 2018-2032 (MILES DE USD)
TABLA 286 MERCADO DE CEREALES DE JAPÓN, POR FORMATO DE CONSUMO, 2018-2032 (MILES DE USD)
TABLA 287 MERCADO DE CEREALES DE JAPÓN, POR CATEGORÍA DE PRODUCTO, 2018-2032 (MILES DE USD)
TABLA 288 CEREALES DE DESAYUNO EN EL MERCADO DE CEREALES DE JAPÓN, POR TIPO, 2018-2032 (MILES DE USD)
TABLA 289 MERCADO DE CEREALES LISTO PARA COMER (RTE) EN JAPÓN, POR TIPO, 2018-2032 (MILES DE USD)
TABLA 290 CEREALES CALIENTES EN EL MERCADO DE CEREALES DE JAPÓN, POR TIPO, 2018-2032 (MILES DE USD)
TABLA 291 SNACKS DE CEREALES EN EL MERCADO DE CEREALES DE JAPÓN, POR TIPO, 2018-2032 (MILES DE USD)
TABLA 292 CEREALES INFANTILES EN EL MERCADO DE CEREALES DE JAPÓN, POR TIPO, 2018-2032 (MILES DE USD)
TABLA 293 MERCADO DE CEREALES DE JAPÓN, POR NATURALEZA, 2018-2032 (MILES DE USD)
TABLA 294 MERCADO DE CEREALES DE JAPÓN, POR CATEGORÍA, 2018-2032 (MILES DE USD)
CUADRO 295 MERCADO DE CEREALES DE JAPÓN, POR BENEFICIOS FUNCIONALES, 2018-2032 (MILES DE USD)
TABLA 296 MERCADO DE CEREALES DE JAPÓN, POR VIDA ÚTIL, 2018-2032 (MILES DE USD)
TABLA 297 MERCADO DE CEREALES DE JAPÓN, POR ENVASE, 2018-2032 (MILES DE USD)
TABLA 298 CUADRO DE REPARTO EN EL MERCADO DE CEREALES DE JAPÓN, POR TIPO, 2018-2032 (MILES DE USD)
TABLA 299 BOLSA DE JAPÓN EN EL MERCADO DE CEREALES, POR TIPO, 2018-2032 (MILES DE USD)
TABLA 300 BOLSA DE JAPÓN EN EL MERCADO DE CEREALES, POR TIPO, 2018-2032 (MILES DE USD)
TABLA 301 FRASCO DE JAPÓN EN EL MERCADO DE CEREALES, POR TIPO, 2018-2032 (MILES DE USD)
TABLA 302 ENVASES ECOLÓGICOS EN EL MERCADO DE CEREALES DE JAPÓN, POR TIPO, 2018-2032 (MILES DE USD)
TABLA 303 MERCADO DE CEREALES DE JAPÓN, POR TAMAÑO DE ENVASE, 2018-2032 (MILES DE USD)
TABLA 304 MERCADO DE CEREALES DE JAPÓN, POR RANGO DE PRECIOS, 2018-2032 (MILES DE USD)
TABLA 305 MERCADO DE CEREALES DE JAPÓN, POR CANAL DE DISTRIBUCIÓN, 2018-2032 (MILES DE USD)
TABLA 306 MERCADO B2C DE CEREALES EN JAPÓN, POR TIPO, 2018-2032 (MILES DE USD)
TABLA 307 MERCADO DE CEREALES EN LÍNEA DE JAPÓN, POR TIPO, 2018-2032 (MILES DE USD)
TABLA 308 JAPÓN FUERA DE LÍNEA EN EL MERCADO DE CEREALES, POR TIPO, 2018-2032 (MILES DE USD)
TABLA 309 MERCADO DE CEREALES DE AUSTRALIA, POR TIPO DE CEREAL, 2018-2032 (MILES DE USD)
CUADRO 310 MERCADO DE CEREALES DE AUSTRALIA, POR TIPO DE CEREAL, 2018-2032 (MILES DE TONELADAS)
TABLA 311 MERCADO DE TRIGO EN CEREALES DE AUSTRALIA, POR TIPO, 2018-2032 (MILES DE USD)
CUADRO 312 MERCADO DE ARROZ EN CEREALES DE AUSTRALIA, POR TIPO, 2018-2032 (MILES DE USD)
TABLA 313 MERCADO DE MAÍZ EN CEREALES DE AUSTRALIA, POR TIPO, 2018-2032 (MILES DE USD)
TABLA 314 MERCADO DE CEBADA EN CEREALES DE AUSTRALIA, POR TIPO, 2018-2032 (MILES DE USD)
TABLA 315 MERCADO DE AVENA EN CEREALES DE AUSTRALIA, POR TIPO, 2018-2032 (MILES DE USD)
TABLA 316 MERCADO DE CENTENO EN CEREALES DE AUSTRALIA, POR TIPO, 2018-2032 (MILES DE USD)
TABLA 317 MERCADO DE SORGO EN CEREALES DE AUSTRALIA, POR TIPO, 2018-2032 (MILES DE USD)
CUADRO 318 MERCADO DE MIJO EN CEREALES DE AUSTRALIA, POR TIPO, 2018-2032 (MILES DE USD)
TABLA 319 MERCADO DE QUINUA EN CEREALES DE AUSTRALIA, POR TIPO, 2018-2032 (MILES DE USD)
TABLA 320 MERCADO DE CEREALES DE AUSTRALIA, POR FORMA DE PRODUCTO, 2018-2032 (MILES DE USD)
CUADRO 321 MERCADO DE CEREALES DE AUSTRALIA, POR NIVEL DE PROCESAMIENTO, 2018-2032 (MILES DE USD)
TABLA 322 MERCADO DE CEREALES DE AUSTRALIA, POR FORMATO DE CONSUMO, 2018-2032 (MILES DE USD)
TABLA 323 MERCADO DE CEREALES DE AUSTRALIA, POR CATEGORÍA DE PRODUCTO, 2018-2032 (MILES DE USD)
TABLA 324 CEREALES DE DESAYUNO EN EL MERCADO DE CEREALES DE AUSTRALIA, POR TIPO, 2018-2032 (MILES DE USD)
TABLA 325 MERCADO DE CEREALES LISTO PARA COMER (RTE) DE AUSTRALIA, POR TIPO, 2018-2032 (MILES DE USD)
TABLA 326 CEREALES CALIENTES DE AUSTRALIA EN EL MERCADO DE CEREALES, POR TIPO, 2018-2032 (MILES DE USD)
TABLA 327 SNACKS DE CEREALES EN EL MERCADO DE CEREALES DE AUSTRALIA, POR TIPO, 2018-2032 (MILES DE USD)
TABLA 328 CEREALES INFANTILES DE AUSTRALIA EN EL MERCADO DE CEREALES, POR TIPO, 2018-2032 (MILES DE USD)
TABLA 329 MERCADO DE CEREALES DE AUSTRALIA, POR NATURALEZA, 2018-2032 (MILES DE USD)
TABLA 330 MERCADO DE CEREALES DE AUSTRALIA, POR CATEGORÍA, 2018-2032 (MILES DE USD)
TABLA 331 MERCADO DE CEREALES DE AUSTRALIA, POR BENEFICIOS FUNCIONALES, 2018-2032 (MILES DE USD)
TABLA 332 MERCADO DE CEREALES DE AUSTRALIA, POR VIDA ÚTIL, 2018-2032 (MILES DE USD)
TABLA 333 MERCADO DE CEREALES DE AUSTRALIA, POR ENVASE, 2018-2032 (MILES DE USD)
TABLA 334 CUADRO DE AUSTRALIA EN EL MERCADO DE CEREALES, POR TIPO, 2018-2032 (MILES DE USD)
TABLA 335 AUSTRALIA BOLSA EN EL MERCADO DE CEREALES, POR TIPO, 2018-2032 (MILES DE USD)
TABLA 336 AUSTRALIA BOLSA EN EL MERCADO DE CEREALES, POR TIPO, 2018-2032 (MILES DE USD)
TABLA 337 MERCADO DE CEREALES EN AUSTRALIA, POR TIPO, 2018-2032 (MILES DE USD)
TABLA 338 AUSTRALIA: ENVASES ECOLÓGICOS EN EL MERCADO DE CEREALES, POR TIPO, 2018-2032 (MILES DE USD)
TABLA 339 MERCADO DE CEREALES DE AUSTRALIA, POR TAMAÑO DE ENVASE, 2018-2032 (MILES DE USD)
TABLA 340 MERCADO DE CEREALES DE AUSTRALIA, POR RANGO DE PRECIOS, 2018-2032 (MILES DE USD)
TABLA 341 MERCADO DE CEREALES DE AUSTRALIA, POR CANAL DE DISTRIBUCIÓN, 2018-2032 (MILES DE USD)
TABLA 342 MERCADO DE CEREALES B2C DE AUSTRALIA, POR TIPO, 2018-2032 (MILES DE USD)
TABLA 343 AUSTRALIA EN LÍNEA EN EL MERCADO DE CEREALES, POR TIPO, 2018-2032 (MILES DE USD)
TABLA 344 AUSTRALIA FUERA DE LÍNEA EN EL MERCADO DE CEREALES, POR TIPO, 2018-2032 (MILES DE USD)
TABLA 345 MERCADO DE CEREALES DE COREA DEL SUR, POR TIPO DE CEREAL, 2018-2032 (MILES DE USD)
CUADRO 346 MERCADO DE CEREALES DE COREA DEL SUR, POR TIPO DE CEREAL, 2018-2032 (MILES DE TONELADAS)
TABLA 347 MERCADO DE TRIGO EN CEREALES DE COREA DEL SUR, POR TIPO, 2018-2032 (MILES DE USD)
CUADRO 348 MERCADO DE ARROZ EN CEREALES DE COREA DEL SUR, POR TIPO, 2018-2032 (MILES DE USD)
TABLA 349 MERCADO DE MAÍZ DE COREA DEL SUR EN CEREALES, POR TIPO, 2018-2032 (MILES DE USD)
TABLA 350 MERCADO DE CEBADA EN CEREALES DE COREA DEL SUR, POR TIPO, 2018-2032 (MILES DE USD)
TABLA 351 MERCADO DE AVENA EN CEREALES DE COREA DEL SUR, POR TIPO, 2018-2032 (MILES DE USD)
TABLA 352 MERCADO DE CENTENO EN CEREALES DE COREA DEL SUR, POR TIPO, 2018-2032 (MILES DE USD)
TABLA 353 SORGO DE COREA DEL SUR EN EL MERCADO DE CEREALES, POR TIPO, 2018-2032 (MILES DE USD)
TABLA 354 MERCADO DE MIJO DE COREA DEL SUR EN CEREALES, POR TIPO, 2018-2032 (MILES DE USD)
TABLA 355 MERCADO DE QUINUA EN CEREALES DE COREA DEL SUR, POR TIPO, 2018-2032 (MILES DE USD)
TABLA 356 MERCADO DE CEREALES DE COREA DEL SUR, POR FORMA DE PRODUCTO, 2018-2032 (MILES DE USD)
CUADRO 357 MERCADO DE CEREALES DE COREA DEL SUR, POR NIVEL DE PROCESAMIENTO, 2018-2032 (MILES DE USD)
TABLA 358 MERCADO DE CEREALES DE COREA DEL SUR, POR FORMATO DE CONSUMO, 2018-2032 (MILES DE USD)
TABLA 359 MERCADO DE CEREALES DE COREA DEL SUR, POR CATEGORÍA DE PRODUCTO, 2018-2032 (MILES DE USD)
TABLA 360 CEREALES PARA DESAYUNO EN EL MERCADO DE CEREALES DE COREA DEL SUR, POR TIPO, 2018-2032 (MILES DE USD)
TABLA 361 MERCADO DE CEREALES LISTO PARA COMER (RTE) DE COREA DEL SUR, POR TIPO, 2018-2032 (MILES DE USD)
TABLA 362 CEREALES CALIENTES DE COREA DEL SUR EN EL MERCADO DE CEREALES, POR TIPO, 2018-2032 (MILES DE USD)
TABLA 363 APERITIVOS DE CEREALES DE COREA DEL SUR EN EL MERCADO DE CEREALES, POR TIPO, 2018-2032 (MILES DE USD)
TABLA 364 CEREALES INFANTILES DE COREA DEL SUR EN EL MERCADO DE CEREALES, POR TIPO, 2018-2032 (MILES DE USD)
TABLA 365 MERCADO DE CEREALES DE COREA DEL SUR, POR NATURALEZA, 2018-2032 (MILES DE USD)
TABLA 366 MERCADO DE CEREALES DE COREA DEL SUR, POR CATEGORÍA, 2018-2032 (MILES DE USD)
TABLA 367 MERCADO DE CEREALES DE COREA DEL SUR, POR BENEFICIOS FUNCIONALES, 2018-2032 (MILES DE USD)
TABLA 368 MERCADO DE CEREALES DE COREA DEL SUR, POR VIDA ÚTIL, 2018-2032 (MILES DE USD)
TABLA 369 MERCADO DE CEREALES DE COREA DEL SUR, POR ENVASE, 2018-2032 (MILES DE USD)
TABLA 370 CUADRO DE CAJAS DE COREA DEL SUR EN EL MERCADO DE CEREALES, POR TIPO, 2018-2032 (MILES DE USD)
TABLA 371 MERCADO DE CEREALES DE COREA DEL SUR, POR TIPO, 2018-2032 (MILES DE USD)
TABLA 372 MERCADO DE CEREALES EN BOLSAS DE COREA DEL SUR, POR TIPO, 2018-2032 (MILES DE USD)
TABLA 373 MERCADO DE CEREALES EN FRASCO DE COREA DEL SUR, POR TIPO, 2018-2032 (MILES DE USD)
TABLA 374 ENVASES ECOLÓGICOS EN EL MERCADO DE CEREALES DE COREA DEL SUR, POR TIPO, 2018-2032 (MILES DE USD)
TABLA 375 MERCADO DE CEREALES DE COREA DEL SUR, POR TAMAÑO DE ENVASE, 2018-2032 (MILES DE USD)
CUADRO 376 MERCADO DE CEREALES DE COREA DEL SUR, POR RANGO DE PRECIOS, 2018-2032 (MILES DE USD)
TABLA 377 MERCADO DE CEREALES DE COREA DEL SUR, POR CANAL DE DISTRIBUCIÓN, 2018-2032 (MILES DE USD)
TABLA 378 MERCADO B2C DE CEREALES DE COREA DEL SUR, POR TIPO, 2018-2032 (MILES DE USD)
TABLA 379 COREA DEL SUR EN EL MERCADO DE CEREALES EN LÍNEA, POR TIPO, 2018-2032 (MILES DE USD)
TABLA 380 COREA DEL SUR FUERA DE LÍNEA EN EL MERCADO DE CEREALES, POR TIPO, 2018-2032 (MILES DE USD)
TABLA 381 MERCADO DE CEREALES DE MALASIA, POR TIPO DE CEREAL, 2018-2032 (MILES DE USD)
CUADRO 382 MERCADO DE CEREALES DE MALASIA, POR TIPO DE CEREAL, 2018-2032 (MILES DE TONELADAS)
TABLA 383 MERCADO DE TRIGO EN CEREALES DE MALASIA, POR TIPO, 2018-2032 (MILES DE USD)
TABLA 384 MERCADO DE ARROZ EN CEREALES DE MALASIA, POR TIPO, 2018-2032 (MILES DE USD)
TABLA 385 MAÍZ DE MALASIA EN EL MERCADO DE CEREALES, POR TIPO, 2018-2032 (MILES DE USD)
TABLA 386 MERCADO DE CEBADA EN CEREALES DE MALASIA, POR TIPO, 2018-2032 (MILES DE USD)
TABLA 387 MERCADO DE AVENA EN CEREALES DE MALASIA, POR TIPO, 2018-2032 (MILES DE USD)
TABLA 388 MERCADO DE CENTENO EN CEREALES DE MALASIA, POR TIPO, 2018-2032 (MILES DE USD)
TABLA 389 SORGO DE MALASIA EN EL MERCADO DE CEREALES, POR TIPO, 2018-2032 (MILES DE USD)
CUADRO 390 MIJO DE MALASIA EN EL MERCADO DE CEREALES, POR TIPO, 2018-2032 (MILES DE USD)
TABLA 391 MERCADO DE QUINUA EN CEREALES DE MALASIA, POR TIPO, 2018-2032 (MILES DE USD)
TABLA 392 MERCADO DE CEREALES DE MALASIA, POR FORMA DE PRODUCTO, 2018-2032 (MILES DE USD)
CUADRO 393 MERCADO DE CEREALES DE MALASIA, POR NIVEL DE PROCESAMIENTO, 2018-2032 (MILES DE USD)
TABLA 394 MERCADO DE CEREALES DE MALASIA, POR FORMATO DE CONSUMO, 2018-2032 (MILES DE USD)
CUADRO 395 MERCADO DE CEREALES DE MALASIA, POR CATEGORÍA DE PRODUCTO, 2018-2032 (MILES DE USD)
TABLA 396 CEREALES DE DESAYUNO DE MALASIA EN EL MERCADO DE CEREALES, POR TIPO, 2018-2032 (MILES DE USD)
TABLA 397 MERCADO DE CEREALES LISTO PARA COMER (RTE) DE MALASIA, POR TIPO, 2018-2032 (MILES DE USD)
TABLA 398 CEREALES CALIENTES DE MALASIA EN EL MERCADO DE CEREALES, POR TIPO, 2018-2032 (MILES DE USD)
TABLA 399 APERITIVOS DE CEREALES EN EL MERCADO DE CEREALES DE MALASIA, POR TIPO, 2018-2032 (MILES DE USD)
TABLA 400 CEREALES INFANTILES DE MALASIA EN EL MERCADO DE CEREALES, POR TIPO, 2018-2032 (MILES DE USD)
TABLA 401 MERCADO DE CEREALES DE MALASIA, POR NATURALEZA, 2018-2032 (MILES DE USD)
CUADRO 402 MERCADO DE CEREALES DE MALASIA, POR CATEGORÍA, 2018-2032 (MILES DE USD)
TABLA 403 MERCADO DE CEREALES DE MALASIA, POR BENEFICIOS FUNCIONALES, 2018-2032 (MILES DE USD)
TABLA 404 MERCADO DE CEREALES DE MALASIA, POR VIDA ÚTIL, 2018-2032 (MILES DE USD)
TABLA 405 MERCADO DE CEREALES DE MALASIA, POR ENVASE, 2018-2032 (MILES DE USD)
TABLA 406 CUADRO DE MALASIA EN EL MERCADO DE CEREALES, POR TIPO, 2018-2032 (MILES DE USD)
TABLA 407 MERCADO DE CEREALES EN MALASIA, POR TIPO, 2018-2032 (MILES DE USD)
TABLA 408 BOLSA DE MALASIA EN EL MERCADO DE CEREALES, POR TIPO, 2018-2032 (MILES DE USD)
TABLA 409 MERCADO DE CEREALES EN MALASIA, POR TIPO, 2018-2032 (MILES DE USD)
TABLA 410 ENVASES ECOLÓGICOS EN EL MERCADO DE CEREALES DE MALASIA, POR TIPO, 2018-2032 (MILES DE USD)
TABLA 411 MERCADO DE CEREALES DE MALASIA, POR TAMAÑO DE ENVASE, 2018-2032 (MILES DE USD)
CUADRO 412 MERCADO DE CEREALES DE MALASIA, POR RANGO DE PRECIOS, 2018-2032 (MILES DE USD)
TABLA 413 MERCADO DE CEREALES DE MALASIA, POR CANAL DE DISTRIBUCIÓN, 2018-2032 (MILES DE USD)
TABLA 414 MERCADO DE CEREALES B2C DE MALASIA, POR TIPO, 2018-2032 (MILES DE USD)
TABLA 415 MALASIA EN LÍNEA EN EL MERCADO DE CEREALES, POR TIPO, 2018-2032 (MILES DE USD)
TABLA 416 MALASIA FUERA DE LÍNEA EN EL MERCADO DE CEREALES, POR TIPO, 2018-2032 (MILES DE USD)
TABLA 417 MERCADO DE CEREALES DE SINGAPUR, POR TIPO DE CEREAL, 2018-2032 (MILES DE USD)
CUADRO 418 MERCADO DE CEREALES DE SINGAPUR, POR TIPO DE CEREAL, 2018-2032 (MILES DE TONELADAS)
TABLA 419 TRIGO DE SINGAPUR EN EL MERCADO DE CEREALES, POR TIPO, 2018-2032 (MILES DE USD)
TABLA 420 MERCADO DE ARROZ EN CEREALES DE SINGAPUR, POR TIPO, 2018-2032 (MILES DE USD)
TABLA 421 MAÍZ DE SINGAPUR EN EL MERCADO DE CEREALES, POR TIPO, 2018-2032 (MILES DE USD)
TABLA 422 MERCADO DE CEBADA EN CEREALES DE SINGAPUR, POR TIPO, 2018-2032 (MILES DE USD)
TABLA 423 AVENA DE SINGAPUR EN EL MERCADO DE CEREALES, POR TIPO, 2018-2032 (MILES DE USD)
TABLA 424 MERCADO DE CENTENO DE SINGAPUR EN CEREALES, POR TIPO, 2018-2032 (MILES DE USD)
TABLA 425 SORGO DE SINGAPUR EN EL MERCADO DE CEREALES, POR TIPO, 2018-2032 (MILES DE USD)
TABLA 426 MIJO DE SINGAPUR EN EL MERCADO DE CEREALES, POR TIPO, 2018-2032 (MILES DE USD)
TABLA 427 QUINUA DE SINGAPUR EN EL MERCADO DE CEREALES, POR TIPO, 2018-2032 (MILES DE USD)
TABLA 428 MERCADO DE CEREALES DE SINGAPUR, POR FORMA DE PRODUCTO, 2018-2032 (MILES DE USD)
CUADRO 429 MERCADO DE CEREALES DE SINGAPUR, POR NIVEL DE PROCESAMIENTO, 2018-2032 (MILES DE USD)
TABLA 430 MERCADO DE CEREALES DE SINGAPUR, POR FORMATO DE CONSUMO, 2018-2032 (MILES DE USD)
TABLA 431 MERCADO DE CEREALES DE SINGAPUR, POR CATEGORÍA DE PRODUCTO, 2018-2032 (MILES DE USD)
TABLA 432 CEREALES DE DESAYUNO DE SINGAPUR EN EL MERCADO DE CEREALES, POR TIPO, 2018-2032 (MILES DE USD)
TABLA 433 MERCADO DE CEREALES LISTO PARA COMER (RTE) DE SINGAPUR, POR TIPO, 2018-2032 (MILES DE USD)
TABLA 434 CEREALES CALIENTES DE SINGAPUR EN EL MERCADO DE CEREALES, POR TIPO, 2018-2032 (MILES DE USD)
TABLA 435 APERITIVOS DE CEREALES DE SINGAPUR EN EL MERCADO DE CEREALES, POR TIPO, 2018-2032 (MILES DE USD)
TABLA 436 CEREALES INFANTILES DE SINGAPUR EN EL MERCADO DE CEREALES, POR TIPO, 2018-2032 (MILES DE USD)
TABLA 437 MERCADO DE CEREALES DE SINGAPUR, POR NATURALEZA, 2018-2032 (MILES DE USD)
TABLA 438 MERCADO DE CEREALES DE SINGAPUR, POR CATEGORÍA, 2018-2032 (MILES DE USD)
TABLA 439 MERCADO DE CEREALES DE SINGAPUR, POR BENEFICIOS FUNCIONALES, 2018-2032 (MILES DE USD)
TABLA 440 MERCADO DE CEREALES DE SINGAPUR, POR VIDA ÚTIL, 2018-2032 (MILES DE USD)
TABLA 441 MERCADO DE CEREALES DE SINGAPUR, POR ENVASE, 2018-2032 (MILES DE USD)
TABLA 442 CUADRO DE SINGAPUR EN EL MERCADO DE CEREALES, POR TIPO, 2018-2032 (MILES DE USD)
TABLA 443 BOLSA DE SINGAPUR EN EL MERCADO DE CEREALES, POR TIPO, 2018-2032 (MILES DE USD)
TABLA 444 BOLSA DE SINGAPUR EN EL MERCADO DE CEREALES, POR TIPO, 2018-2032 (MILES DE USD)
TABLA 445 FRASCO DE SINGAPUR EN EL MERCADO DE CEREALES, POR TIPO, 2018-2032 (MILES DE USD)
TABLA 446 ENVASES ECOLÓGICOS EN EL MERCADO DE CEREALES DE SINGAPUR, POR TIPO, 2018-2032 (MILES DE USD)
TABLA 447 MERCADO DE CEREALES DE SINGAPUR, POR TAMAÑO DE ENVASE, 2018-2032 (MILES DE USD)
TABLA 448 MERCADO DE CEREALES DE SINGAPUR, POR RANGO DE PRECIOS, 2018-2032 (MILES DE USD)
TABLA 449 MERCADO DE CEREALES DE SINGAPUR, POR CANAL DE DISTRIBUCIÓN, 2018-2032 (MILES DE USD)
TABLA 450 MERCADO DE CEREALES B2C DE SINGAPUR, POR TIPO, 2018-2032 (MILES DE USD)
TABLA 451 MERCADO DE CEREALES EN LÍNEA DE SINGAPUR, POR TIPO, 2018-2032 (MILES DE USD)
TABLA 452 SINGAPUR FUERA DE LÍNEA EN EL MERCADO DE CEREALES, POR TIPO, 2018-2032 (MILES DE USD)
TABLA 453 MERCADO DE CEREALES DE TAILANDIA, POR TIPO DE CEREAL, 2018-2032 (MILES DE USD)
TABLA 454 MERCADO DE CEREALES DE TAILANDIA, POR TIPO DE CEREAL, 2018-2032 (MILES DE TONELADAS)
TABLA 455 MERCADO DE TRIGO EN CEREALES DE TAILANDIA, POR TIPO, 2018-2032 (MILES DE USD)
TABLA 456 MERCADO DE ARROZ EN CEREALES DE TAILANDIA, POR TIPO, 2018-2032 (MILES DE USD)
TABLA 457 MAÍZ DE TAILANDIA EN EL MERCADO DE CEREALES, POR TIPO, 2018-2032 (MILES DE USD)
TABLA 458 MERCADO DE CEBADA EN CEREALES DE TAILANDIA, POR TIPO, 2018-2032 (MILES DE USD)
TABLA 459 MERCADO DE AVENA EN CEREALES DE TAILANDIA, POR TIPO, 2018-2032 (MILES DE USD)
TABLA 460 MERCADO DE CENTENO EN CEREALES DE TAILANDIA, POR TIPO, 2018-2032 (MILES DE USD)
TABLA 461 SORGO DE TAILANDIA EN EL MERCADO DE CEREALES, POR TIPO, 2018-2032 (MILES DE USD)
TABLA 462 MIJO EN EL MERCADO DE CEREALES DE TAILANDIA, POR TIPO, 2018-2032 (MILES DE USD)
TABLA 463 MERCADO DE QUINUA EN CEREALES DE TAILANDIA, POR TIPO, 2018-2032 (MILES DE USD)
TABLA 464 MERCADO DE CEREALES DE TAILANDIA, POR FORMA DE PRODUCTO, 2018-2032 (MILES DE USD)
TABLA 465 MERCADO DE CEREALES DE TAILANDIA, POR NIVEL DE PROCESAMIENTO, 2018-2032 (MILES DE USD)
TABLA 466 MERCADO DE CEREALES DE TAILANDIA, POR FORMATO DE CONSUMO, 2018-2032 (MILES DE USD)
TABLA 467 MERCADO DE CEREALES DE TAILANDIA, POR CATEGORÍA DE PRODUCTO, 2018-2032 (MILES DE USD)
TABLA 468 CEREALES DE DESAYUNO DE TAILANDIA EN EL MERCADO DE CEREALES, POR TIPO, 2018-2032 (MILES DE USD)
TABLA 469 MERCADO DE CEREALES LISTO PARA COMER (RTE) DE TAILANDIA, POR TIPO, 2018-2032 (MILES DE USD)
TABLA 470 CEREALES CALIENTES DE TAILANDIA EN EL MERCADO DE CEREALES, POR TIPO, 2018-2032 (MILES DE USD)
TABLA 471 APERITIVOS DE CEREALES EN EL MERCADO DE CEREALES DE TAILANDIA, POR TIPO, 2018-2032 (MILES DE USD)
TABLA 472 CEREALES INFANTILES DE TAILANDIA EN EL MERCADO DE CEREALES, POR TIPO, 2018-2032 (MILES DE USD)
TABLA 473 MERCADO DE CEREALES DE TAILANDIA, POR NATURALEZA, 2018-2032 (MILES DE USD)
TABLA 474 MERCADO DE CEREALES DE TAILANDIA, POR CATEGORÍA, 2018-2032 (MILES DE USD)
TABLA 475 MERCADO DE CEREALES DE TAILANDIA, POR BENEFICIOS FUNCIONALES, 2018-2032 (MILES DE USD)
TABLA 476 MERCADO DE CEREALES DE TAILANDIA, POR VIDA ÚTIL, 2018-2032 (MILES DE USD)
TABLA 477 MERCADO DE CEREALES DE TAILANDIA, POR ENVASE, 2018-2032 (MILES DE USD)
TABLA 478 CUADRO DE CAJAS EN EL MERCADO DE CEREALES DE TAILANDIA, POR TIPO, 2018-2032 (MILES DE USD)
TABLA 479 BOLSA DE CEREALES DE TAILANDIA, POR TIPO, 2018-2032 (MILES DE USD)
TABLA 480 BOLSA DE CEREALES EN TAILANDIA, POR TIPO, 2018-2032 (MILES DE USD)
TABLA 481 MERCADO DE CEREALES EN TAILANDIA, POR TIPO, 2018-2032 (MILES DE USD)
TABLA 482 ENVASES ECOLÓGICOS EN EL MERCADO DE CEREALES DE TAILANDIA, POR TIPO, 2018-2032 (MILES DE USD)
TABLA 483 MERCADO DE CEREALES DE TAILANDIA, POR TAMAÑO DE ENVASE, 2018-2032 (MILES DE USD)
TABLA 484 MERCADO DE CEREALES DE TAILANDIA, POR RANGO DE PRECIOS, 2018-2032 (MILES DE USD)
TABLA 485 MERCADO DE CEREALES DE TAILANDIA, POR CANAL DE DISTRIBUCIÓN, 2018-2032 (MILES DE USD)
TABLA 486 MERCADO DE CEREALES B2C DE TAILANDIA, POR TIPO, 2018-2032 (MILES DE USD)
TABLA 487 MERCADO DE CEREALES EN LÍNEA DE TAILANDIA, POR TIPO, 2018-2032 (MILES DE USD)
TABLA 488 TAILANDIA FUERA DE LÍNEA EN EL MERCADO DE CEREALES, POR TIPO, 2018-2032 (MILES DE USD)
TABLA 489 MERCADO DE CEREALES DE FILIPINAS, POR TIPO DE CEREAL, 2018-2032 (MILES DE USD)
CUADRO 490 MERCADO DE CEREALES DE FILIPINAS, POR TIPO DE CEREAL, 2018-2032 (MILES DE TONELADAS)
TABLA 491 MERCADO DE TRIGO EN CEREALES DE FILIPINAS, POR TIPO, 2018-2032 (MILES DE USD)
TABLA 492 MERCADO DE ARROZ EN CEREALES DE FILIPINAS, POR TIPO, 2018-2032 (MILES DE USD)
TABLA 493 MAÍZ DE FILIPINAS EN EL MERCADO DE CEREALES, POR TIPO, 2018-2032 (MILES DE USD)
TABLA 494 MERCADO DE CEBADA EN CEREALES DE FILIPINAS, POR TIPO, 2018-2032 (MILES DE USD)
TABLA 495 MERCADO DE AVENA EN CEREALES DE FILIPINAS, POR TIPO, 2018-2032 (MILES DE USD)
TABLA 496 MERCADO DE CENTENO EN CEREALES DE FILIPINAS, POR TIPO, 2018-2032 (MILES DE USD)
TABLA 497 SORGO DE FILIPINAS EN EL MERCADO DE CEREALES, POR TIPO, 2018-2032 (MILES DE USD)
TABLA 498 MIJO FILIPINAS EN EL MERCADO DE CEREALES, POR TIPO, 2018-2032 (MILES DE USD)
TABLA 499 MERCADO DE QUINUA EN CEREALES DE FILIPINAS, POR TIPO, 2018-2032 (MILES DE USD)
TABLA 500 MERCADO DE CEREALES DE FILIPINAS, POR FORMA DE PRODUCTO, 2018-2032 (MILES DE USD)
CUADRO 501 MERCADO DE CEREALES DE FILIPINAS, POR NIVEL DE PROCESAMIENTO, 2018-2032 (MILES DE USD)
TABLA 502 MERCADO DE CEREALES DE FILIPINAS, POR FORMATO DE CONSUMO, 2018-2032 (MILES DE USD)
TABLA 503 MERCADO DE CEREALES DE FILIPINAS, POR CATEGORÍA DE PRODUCTO, 2018-2032 (MILES DE USD)
TABLA 504 CEREALES DE DESAYUNO EN EL MERCADO DE CEREALES DE FILIPINAS, POR TIPO, 2018-2032 (MILES DE USD)
TABLA 505 MERCADO DE CEREALES LISTO PARA COMER (RTE) EN FILIPINAS, POR TIPO, 2018-2032 (MILES DE USD)
TABLA 506 CEREALES CALIENTES EN EL MERCADO DE CEREALES DE FILIPINAS, POR TIPO, 2018-2032 (MILES DE USD)
TABLA 507 APERITIVOS DE CEREALES EN EL MERCADO DE CEREALES DE FILIPINAS, POR TIPO, 2018-2032 (MILES DE USD)
TABLA 508 CEREALES INFANTILES EN EL MERCADO DE CEREALES DE FILIPINAS, POR TIPO, 2018-2032 (MILES DE USD)
TABLA 509 MERCADO DE CEREALES DE FILIPINAS, POR NATURALEZA, 2018-2032 (MILES DE USD)
TABLA 510 MERCADO DE CEREALES DE FILIPINAS, POR CATEGORÍA, 2018-2032 (MILES DE USD)
TABLA 511 MERCADO DE CEREALES DE FILIPINAS, POR BENEFICIOS FUNCIONALES, 2018-2032 (MILES DE USD)
TABLA 512 MERCADO DE CEREALES DE FILIPINAS, POR VIDA ÚTIL, 2018-2032 (MILES DE USD)
TABLA 513 MERCADO DE CEREALES DE FILIPINAS, POR ENVASE, 2018-2032 (MILES DE USD)
TABLA 514 CAJA DE FILIPINAS EN EL MERCADO DE CEREALES, POR TIPO, 2018-2032 (MILES DE USD)
TABLA 515 BOLSA DE CEREALES EN FILIPINAS, POR TIPO, 2018-2032 (MILES DE USD)
TABLA 516 BOLSA DE CEREALES EN FILIPINAS, POR TIPO, 2018-2032 (MILES DE USD)
TABLA 517 MERCADO DE CEREALES EN FILIPINAS, POR TIPO, 2018-2032 (MILES DE USD)
TABLA 518 ENVASES ECOLÓGICOS EN EL MERCADO DE CEREALES DE FILIPINAS, POR TIPO, 2018-2032 (MILES DE USD)
TABLA 519 MERCADO DE CEREALES DE FILIPINAS, POR TAMAÑO DE ENVASE, 2018-2032 (MILES DE USD)
TABLA 520 MERCADO DE CEREALES DE FILIPINAS, POR RANGO DE PRECIOS, 2018-2032 (MILES DE USD)
TABLA 521 MERCADO DE CEREALES DE FILIPINAS, POR CANAL DE DISTRIBUCIÓN, 2018-2032 (MILES DE USD)
TABLA 522 MERCADO DE CEREALES B2C DE FILIPINAS, POR TIPO, 2018-2032 (MILES DE USD)
TABLA 523 FILIPINAS EN LÍNEA EN EL MERCADO DE CEREALES, POR TIPO, 2018-2032 (MILES DE USD)
TABLA 524 FILIPINAS FUERA DE LÍNEA EN EL MERCADO DE CEREALES, POR TIPO, 2018-2032 (MILES DE USD)
TABLA 525 MERCADO DE CEREALES DE INDONESIA, POR TIPO DE CEREAL, 2018-2032 (MILES DE USD)
CUADRO 526 MERCADO DE CEREALES DE INDONESIA, POR TIPO DE CEREAL, 2018-2032 (MILES DE TONELADAS)
TABLA 527 MERCADO DE TRIGO EN CEREALES DE INDONESIA, POR TIPO, 2018-2032 (MILES DE USD)
CUADRO 528 MERCADO DE ARROZ EN CEREALES DE INDONESIA, POR TIPO, 2018-2032 (MILES DE USD)
CUADRO 529 MERCADO DE MAÍZ EN CEREALES DE INDONESIA, POR TIPO, 2018-2032 (MILES DE USD)
TABLA 530 MERCADO DE CEBADA EN CEREALES DE INDONESIA, POR TIPO, 2018-2032 (MILES DE USD)
TABLA 531 MERCADO DE AVENA EN CEREALES DE INDONESIA, POR TIPO, 2018-2032 (MILES DE USD)
TABLA 532 MERCADO DE CENTENO EN CEREALES DE INDONESIA, POR TIPO, 2018-2032 (MILES DE USD)
TABLA 533 SORGO EN EL MERCADO DE CEREALES DE INDONESIA, POR TIPO, 2018-2032 (MILES DE USD)
CUADRO 534 MERCADO DE MIJO EN CEREALES DE INDONESIA, POR TIPO, 2018-2032 (MILES DE USD)
TABLA 535 MERCADO DE QUINUA EN CEREALES DE INDONESIA, POR TIPO, 2018-2032 (MILES DE USD)
CUADRO 536 MERCADO DE CEREALES DE INDONESIA, POR FORMA DE PRODUCTO, 2018-2032 (MILES DE USD)
CUADRO 537 MERCADO DE CEREALES DE INDONESIA, POR NIVEL DE PROCESAMIENTO, 2018-2032 (MILES DE USD)
CUADRO 538 MERCADO DE CEREALES DE INDONESIA, POR FORMATO DE CONSUMO, 2018-2032 (MILES DE USD)
CUADRO 539 MERCADO DE CEREALES DE INDONESIA, POR CATEGORÍA DE PRODUCTO, 2018-2032 (MILES DE USD)
TABLA 540 CEREALES PARA DESAYUNO EN EL MERCADO DE CEREALES DE INDONESIA, POR TIPO, 2018-2032 (MILES DE USD)
TABLA 541 MERCADO DE CEREALES LISTO PARA CONSUMIR (RTE) DE INDONESIA, POR TIPO, 2018-2032 (MILES DE USD)
TABLA 542 CEREALES CALIENTES EN EL MERCADO DE CEREALES DE INDONESIA, POR TIPO, 2018-2032 (MILES DE USD)
TABLA 543 APERITIVOS DE CEREALES EN EL MERCADO DE CEREALES DE INDONESIA, POR TIPO, 2018-2032 (MILES DE USD)
TABLA 544 CEREALES INFANTILES EN EL MERCADO DE CEREALES DE INDONESIA, POR TIPO, 2018-2032 (MILES DE USD)
TABLA 545 MERCADO DE CEREALES DE INDONESIA, POR NATURALEZA, 2018-2032 (MILES DE USD)
CUADRO 546 MERCADO DE CEREALES DE INDONESIA, POR CATEGORÍA, 2018-2032 (MILES DE USD)
CUADRO 547 MERCADO DE CEREALES DE INDONESIA, POR BENEFICIOS FUNCIONALES, 2018-2032 (MILES DE USD)
TABLA 548 MERCADO DE CEREALES DE INDONESIA, POR VIDA ÚTIL, 2018-2032 (MILES DE USD)
TABLA 549 MERCADO DE CEREALES DE INDONESIA, POR ENVASE, 2018-2032 (MILES DE USD)
TABLA 550 CAJAS EN EL MERCADO DE CEREALES DE INDONESIA, POR TIPO, 2018-2032 (MILES DE USD)
TABLA 551 BOLSA DE CEREALES EN INDONESIA, POR TIPO, 2018-2032 (MILES DE USD)
TABLA 552 BOLSA DE CEREALES EN EL MERCADO DE INDONESIA, POR TIPO, 2018-2032 (MILES DE USD)
TABLA 553 MERCADO DE CEREALES EN FRASCO DE INDONESIA, POR TIPO, 2018-2032 (MILES DE USD)
TABLA 554 ENVASES ECOLÓGICOS EN EL MERCADO DE CEREALES DE INDONESIA, POR TIPO, 2018-2032 (MILES DE USD)
TABLA 555 MERCADO DE CEREALES DE INDONESIA, POR TAMAÑO DE ENVASE, 2018-2032 (MILES DE USD)
CUADRO 556 MERCADO DE CEREALES DE INDONESIA, POR RANGO DE PRECIOS, 2018-2032 (MILES DE USD)
TABLA 557 MERCADO DE CEREALES DE INDONESIA, POR CANAL DE DISTRIBUCIÓN, 2018-2032 (MILES DE USD)
TABLA 558 INDONESIA EN EL MERCADO DE CEREALES EN LÍNEA, POR TIPO, 2018-2032 (MILES DE USD)
TABLA 559 INDONESIA FUERA DE LÍNEA EN EL MERCADO DE CEREALES, POR TIPO, 2018-2032 (MILES DE USD)
TABLA 560 MERCADO DE CEREALES DE NUEVA ZELANDA, POR TIPO DE CEREAL, 2018-2032 (MILES DE USD)
CUADRO 561 MERCADO DE CEREALES DE NUEVA ZELANDA, POR TIPO DE CEREAL, 2018-2032 (MILES DE TONELADAS)
TABLA 562 MERCADO DE TRIGO EN CEREALES DE NUEVA ZELANDA, POR TIPO, 2018-2032 (MILES DE USD)
CUADRO 563 MERCADO DE ARROZ EN CEREALES DE NUEVA ZELANDA, POR TIPO, 2018-2032 (MILES DE USD)
TABLA 564 MERCADO DE MAÍZ DE NUEVA ZELANDA EN CEREALES, POR TIPO, 2018-2032 (MILES DE USD)
TABLA 565 MERCADO DE CEBADA EN CEREALES DE NUEVA ZELANDA, POR TIPO, 2018-2032 (MILES DE USD)
TABLA 566 AVENA DE NUEVA ZELANDA EN EL MERCADO DE CEREALES, POR TIPO, 2018-2032 (MILES DE USD)
TABLA 567 MERCADO DE CENTENO DE NUEVA ZELANDA EN CEREALES, POR TIPO, 2018-2032 (MILES DE USD)
TABLA 568 SORGO DE NUEVA ZELANDA EN EL MERCADO DE CEREALES, POR TIPO, 2018-2032 (MILES DE USD)
TABLA 569 MIJO DE NUEVA ZELANDA EN EL MERCADO DE CEREALES, POR TIPO, 2018-2032 (MILES DE USD)
TABLA 570 MERCADO DE QUINUA EN CEREALES DE NUEVA ZELANDA, POR TIPO, 2018-2032 (MILES DE USD)
CUADRO 571 MERCADO DE CEREALES DE NUEVA ZELANDA, POR FORMA DE PRODUCTO, 2018-2032 (MILES DE USD)
CUADRO 572 MERCADO DE CEREALES DE NUEVA ZELANDA, POR NIVEL DE PROCESAMIENTO, 2018-2032 (MILES DE USD)
CUADRO 573 MERCADO DE CEREALES DE NUEVA ZELANDA, POR FORMATO DE CONSUMO, 2018-2032 (MILES DE USD)
CUADRO 574 MERCADO DE CEREALES DE NUEVA ZELANDA, POR CATEGORÍA DE PRODUCTO, 2018-2032 (MILES DE USD)
TABLA 575 CEREALES DE DESAYUNO DE NUEVA ZELANDA EN EL MERCADO DE CEREALES, POR TIPO, 2018-2032 (MILES DE USD)
TABLA 576 MERCADO DE CEREALES LISTO PARA COMER (RTE) DE NUEVA ZELANDA, POR TIPO, 2018-2032 (MILES DE USD)
TABLA 577 CEREALES CALIENTES DE NUEVA ZELANDA EN EL MERCADO DE CEREALES, POR TIPO, 2018-2032 (MILES DE USD)
TABLA 578 APERITIVOS DE CEREALES DE NUEVA ZELANDA EN EL MERCADO DE CEREALES, POR TIPO, 2018-2032 (MILES DE USD)
TABLA 579 CEREALES INFANTILES DE NUEVA ZELANDA EN EL MERCADO DE CEREALES, POR TIPO, 2018-2032 (MILES DE USD)
TABLA 580 MERCADO DE CEREALES DE NUEVA ZELANDA, POR NATURALEZA, 2018-2032 (MILES DE USD)
CUADRO 581 MERCADO DE CEREALES DE NUEVA ZELANDA, POR CATEGORÍA, 2018-2032 (MILES DE USD)
CUADRO 582 MERCADO DE CEREALES DE NUEVA ZELANDA, POR BENEFICIOS FUNCIONALES, 2018-2032 (MILES DE USD)
TABLA 583 MERCADO DE CEREALES DE NUEVA ZELANDA, POR VIDA ÚTIL, 2018-2032 (MILES DE USD)
TABLA 584 MERCADO DE CEREALES DE NUEVA ZELANDA, POR ENVASE, 2018-2032 (MILES DE USD)
TABLA 585 CAJAS DE NUEVA ZELANDA EN EL MERCADO DE CEREALES, POR TIPO, 2018-2032 (MILES DE USD)
TABLA 586 MERCADO DE CEREALES DE NUEVA ZELANDA, POR TIPO, 2018-2032 (MILES DE USD)
TABLA 587 MERCADO DE CEREALES EN NUEVA ZELANDA, POR TIPO, 2018-2032 (MILES DE USD)
TABLA 588 MERCADO DE CEREALES DE NUEVA ZELANDA, POR TIPO, 2018-2032 (MILES DE USD)
TABLA 589 ENVASES ECOLÓGICOS EN EL MERCADO DE CEREALES DE NUEVA ZELANDA, POR TIPO, 2018-2032 (MILES DE USD)
TABLA 590 MERCADO DE CEREALES DE NUEVA ZELANDA, POR TAMAÑO DE ENVASE, 2018-2032 (MILES DE USD)
CUADRO 591 MERCADO DE CEREALES DE NUEVA ZELANDA, POR RANGO DE PRECIOS, 2018-2032 (MILES DE USD)
TABLA 592 MERCADO DE CEREALES DE NUEVA ZELANDA, POR CANAL DE DISTRIBUCIÓN, 2018-2032 (MILES DE USD)
TABLA 593 MERCADO DE CEREALES B2C DE NUEVA ZELANDA, POR TIPO, 2018-2032 (MILES DE USD)
TABLA 594 NUEVA ZELANDA EN LÍNEA EN EL MERCADO DE CEREALES, POR TIPO, 2018-2032 (MILES DE USD)
TABLA 595 NUEVA ZELANDA FUERA DE LÍNEA EN EL MERCADO DE CEREALES, POR TIPO, 2018-2032 (MILES DE USD)
TABLA 596 MERCADO DE CEREALES DE HONG KONG, POR TIPO DE CEREAL, 2018-2032 (MILES DE USD)
TABLA 597 MERCADO DE CEREALES DE HONG KONG, POR TIPO DE CEREAL, 2018-2032 (MILES DE TONELADAS)
TABLA 598 TRIGO EN EL MERCADO DE CEREALES DE HONG KONG, POR TIPO, 2018-2032 (MILES DE USD)
TABLA 599 MERCADO DE ARROZ EN CEREALES DE HONG KONG, POR TIPO, 2018-2032 (MILES DE USD)
TABLA 600 MAÍZ DE HONG KONG EN EL MERCADO DE CEREALES, POR TIPO, 2018-2032 (MILES DE USD)
TABLA 601 MERCADO DE CEBADA EN CEREALES DE HONG KONG, POR TIPO, 2018-2032 (MILES DE USD)
TABLA 602 AVENA DE HONG KONG EN EL MERCADO DE CEREALES, POR TIPO, 2018-2032 (MILES DE USD)
TABLA 603 MERCADO DE CENTENO DE HONG KONG EN CEREALES, POR TIPO, 2018-2032 (MILES DE USD)
TABLA 604 SORGO DE HONG KONG EN EL MERCADO DE CEREALES, POR TIPO, 2018-2032 (MILES DE USD)
TABLA 605 MIJO DE HONG KONG EN EL MERCADO DE CEREALES, POR TIPO, 2018-2032 (MILES DE USD)
TABLA 606 QUINUA DE HONG KONG EN EL MERCADO DE CEREALES, POR TIPO, 2018-2032 (MILES DE USD)
TABLA 607 MERCADO DE CEREALES DE HONG KONG, POR FORMA DE PRODUCTO, 2018-2032 (MILES DE USD)
CUADRO 608 MERCADO DE CEREALES DE HONG KONG, POR NIVEL DE PROCESAMIENTO, 2018-2032 (MILES DE USD)
TABLA 609 MERCADO DE CEREALES DE HONG KONG, POR FORMATO DE CONSUMO, 2018-2032 (MILES DE USD)
TABLA 610 MERCADO DE CEREALES DE HONG KONG, POR CATEGORÍA DE PRODUCTO, 2018-2032 (MILES DE USD)
TABLA 611 CEREALES DE DESAYUNO DE HONG KONG EN EL MERCADO DE CEREALES, POR TIPO, 2018-2032 (MILES DE USD)
TABLA 612 MERCADO DE CEREALES LISTO PARA COMER (RTE) DE HONG KONG, POR TIPO, 2018-2032 (MILES DE USD)
TABLA 613 CEREALES CALIENTES DE HONG KONG EN EL MERCADO DE CEREALES, POR TIPO, 2018-2032 (MILES DE USD)
TABLA 614 APERITIVOS DE CEREALES DE HONG KONG EN EL MERCADO DE CEREALES, POR TIPO, 2018-2032 (MILES DE USD)
TABLA 615 CEREALES INFANTILES EN EL MERCADO DE CEREALES DE HONG KONG, POR TIPO, 2018-2032 (MILES DE USD)
TABLA 616 MERCADO DE CEREALES DE HONG KONG, POR NATURALEZA, 2018-2032 (MILES DE USD)
TABLA 617 MERCADO DE CEREALES DE HONG KONG, POR CATEGORÍA, 2018-2032 (MILES DE USD)
TABLA 618 MERCADO DE CEREALES DE HONG KONG, POR BENEFICIOS FUNCIONALES, 2018-2032 (MILES DE USD)
TABLA 619 MERCADO DE CEREALES DE HONG KONG, POR VIDA ÚTIL, 2018-2032 (MILES DE USD)
TABLA 620 MERCADO DE CEREALES DE HONG KONG, POR ENVASE, 2018-2032 (MILES DE USD)
TABLA 621 CAJA DE HONG KONG EN EL MERCADO DE CEREALES, POR TIPO, 2018-2032 (MILES DE USD)
TABLA 622 BOLSA DE HONG KONG EN EL MERCADO DE CEREALES, POR TIPO, 2018-2032 (MILES DE USD)
TABLA 623 BOLSA DE CEREALES EN HONG KONG, POR TIPO, 2018-2032 (MILES DE USD)
TABLA 624 FRASCO DE HONG KONG EN EL MERCADO DE CEREALES, POR TIPO, 2018-2032 (MILES DE USD)
TABLA 625 MERCADO DE CEREALES DE HONG KONG, POR TAMAÑO DE ENVASE, 2018-2032 (MILES DE USD)
TABLA 626 MERCADO DE CEREALES DE HONG KONG, POR RANGO DE PRECIOS, 2018-2032 (MILES DE USD)
TABLA 627 MERCADO DE CEREALES DE HONG KONG, POR CANAL DE DISTRIBUCIÓN, 2018-2032 (MILES DE USD)
TABLA 628 MERCADO DE CEREALES B2C EN HONG KONG, POR TIPO, 2018-2032 (MILES DE USD)
TABLA 629 MERCADO DE CEREALES EN LÍNEA DE HONG KONG, POR TIPO, 2018-2032 (MILES DE USD)
TABLA 630 HONG KONG SIN CONEXIÓN EN EL MERCADO DE CEREALES, POR TIPO, 2018-2032 (MILES DE USD)
TABLA 631 MERCADO DE CEREALES DE TAIWÁN, POR TIPO DE CEREAL, 2018-2032 (MILES DE USD)
TABLA 632 MERCADO DE CEREALES DE TAIWÁN, POR TIPO DE CEREAL, 2018-2032 (MILES DE TONELADAS)
TABLA 633 TRIGO EN EL MERCADO DE CEREALES DE TAIWÁN, POR TIPO, 2018-2032 (MILES DE USD)
TABLA 634 MERCADO DE ARROZ EN CEREALES DE TAIWÁN, POR TIPO, 2018-2032 (MILES DE USD)
TABLA 635 MAÍZ DE TAIWÁN EN EL MERCADO DE CEREALES, POR TIPO, 2018-2032 (MILES DE USD)
TABLA 636 MERCADO DE CEBADA EN CEREALES DE TAIWÁN, POR TIPO, 2018-2032 (MILES DE USD)
TABLA 637 AVENA DE TAIWÁN EN EL MERCADO DE CEREALES, POR TIPO, 2018-2032 (MILES DE USD)
TABLA 638 MERCADO DE CENTENO EN CEREALES DE TAIWÁN, POR TIPO, 2018-2032 (MILES DE USD)
TABLA 639 SORGO DE TAIWÁN EN EL MERCADO DE CEREALES, POR TIPO, 2018-2032 (MILES DE USD)
TABLA 640 MIJO DE TAIWÁN EN EL MERCADO DE CEREALES, POR TIPO, 2018-2032 (MILES DE USD)
TABLA 641 QUINUA DE TAIWÁN EN EL MERCADO DE CEREALES, POR TIPO, 2018-2032 (MILES DE USD)
TABLA 642 MERCADO DE CEREALES DE TAIWÁN, POR FORMA DE PRODUCTO, 2018-2032 (MILES DE USD)
TABLA 643 MERCADO DE CEREALES DE TAIWÁN, POR NIVEL DE PROCESAMIENTO, 2018-2032 (MILES DE USD)
TABLA 644 MERCADO DE CEREALES DE TAIWÁN, POR FORMATO DE CONSUMO, 2018-2032 (MILES DE USD)
TABLA 645 MERCADO DE CEREALES DE TAIWÁN, POR CATEGORÍA DE PRODUCTO, 2018-2032 (MILES DE USD)
TABLA 646 CEREALES DE DESAYUNO DE TAIWÁN EN EL MERCADO DE CEREALES, POR TIPO, 2018-2032 (MILES DE USD)
TABLA 647 MERCADO DE CEREALES LISTO PARA COMER (RTE) DE TAIWÁN, POR TIPO, 2018-2032 (MILES DE USD)
TABLA 648 CEREALES CALIENTES EN EL MERCADO DE CEREALES DE TAIWÁN, POR TIPO, 2018-2032 (MILES DE USD)
TABLA 649 APERITIVOS DE CEREALES DE TAIWÁN EN EL MERCADO DE CEREALES, POR TIPO, 2018-2032 (MILES DE USD)
TABLA 650 CEREALES INFANTILES EN EL MERCADO DE CEREALES DE TAIWÁN, POR TIPO, 2018-2032 (MILES DE USD)
TABLA 651 MERCADO DE CEREALES DE TAIWÁN, POR NATURALEZA, 2018-2032 (MILES DE USD)
TABLA 652 MERCADO DE CEREALES DE TAIWÁN, POR CATEGORÍA, 2018-2032 (MILES DE USD)
TABLA 653 MERCADO DE CEREALES DE TAIWÁN, POR BENEFICIOS FUNCIONALES, 2018-2032 (MILES DE USD)
TABLA 654 MERCADO DE CEREALES DE TAIWÁN, POR VIDA ÚTIL, 2018-2032 (MILES DE USD)
TABLA 655 MERCADO DE CEREALES DE TAIWÁN, POR ENVASE, 2018-2032 (MILES DE USD)
TABLA 656 CAJA DE TAIWÁN EN EL MERCADO DE CEREALES, POR TIPO, 2018-2032 (MILES DE USD)
TABLA 657 BOLSA DE TAIWÁN EN EL MERCADO DE CEREALES, POR TIPO, 2018-2032 (MILES DE USD)
TABLA 658 BOLSA DE CEREALES EN TAIWÁN, POR TIPO, 2018-2032 (MILES DE USD)
TABLA 659 FRASCO DE TAIWÁN EN EL MERCADO DE CEREALES, POR TIPO, 2018-2032 (MILES DE USD)
TABLA 660 ENVASES ECOLÓGICOS EN EL MERCADO DE CEREALES DE TAIWÁN, POR TIPO, 2018-2032 (MILES DE USD)
TABLA 661 MERCADO DE CEREALES DE TAIWÁN, POR TAMAÑO DE ENVASE, 2018-2032 (MILES DE USD)
TABLA 662 MERCADO DE CEREALES DE TAIWÁN, POR RANGO DE PRECIOS, 2018-2032 (MILES DE USD)
TABLA 663 MERCADO DE CEREALES DE TAIWÁN, POR CANAL DE DISTRIBUCIÓN, 2018-2032 (MILES DE USD)
TABLA 664 MERCADO B2C DE CEREALES DE TAIWÁN, POR TIPO, 2018-2032 (MILES DE USD)
TABLA 665 MERCADO DE CEREALES EN LÍNEA DE TAIWÁN, POR TIPO, 2018-2032 (MILES DE USD)
TABLA 666 TAIWÁN FUERA DE LÍNEA EN EL MERCADO DE CEREALES, POR TIPO, 2018-2032 (MILES DE USD)
CUADRO 667 RESTO DEL MERCADO DE CEREALES DE ASIA-PACÍFICO, POR TIPO DE CEREAL, 2018-2032 (MILES DE USD)
CUADRO 668 RESTO DEL MERCADO DE CEREALES DE ASIA-PACÍFICO, POR TIPO DE CEREAL, 2018-2032 (MILES DE TONELADAS)
Lista de figuras
FIGURA 1 MERCADO DE CEREALES DE ASIA-PACÍFICO
FIGURA 2 MERCADO DE CEREALES DE ASIA-PACÍFICO: TRIANGULACIÓN DE DATOS
FIGURA 3 MERCADO DE CEREALES DE ASIA-PACÍFICO: ANÁLISIS DROC
FIGURA 4 MERCADO DE CEREALES DE ASIA-PACÍFICO: ANÁLISIS DEL MERCADO DE ASIA-PACÍFICO VS. REGIONAL
FIGURA 5 MERCADO DE CEREALES DE ASIA-PACÍFICO: ANÁLISIS DE INVESTIGACIÓN DE EMPRESAS
FIGURA 6 MERCADO DE CEREALES DE ASIA-PACÍFICO: MODELADO MULTIVARIADO
FIGURA 7 CURVA DE LÍNEA DE TIEMPO DEL TIPO DE CEREAL
FIGURA 8 MERCADO DE CEREALES DE ASIA-PACÍFICO: DATOS DEMOGRÁFICOS DE LA ENTREVISTA
FIGURA 9 MERCADO DE CEREALES DE ASIA-PACÍFICO: CUADRÍCULA DE POSICIÓN DE MERCADO DBMR
FIGURA 10 MERCADO DE CEREALES DE ASIA-PACÍFICO: ANÁLISIS DE LA PARTICIPACIÓN DE LOS PROVEEDORES
FIGURA 11 MERCADO DE CEREALES DE ASIA-PACÍFICO: SEGMENTACIÓN
FIGURA 12 MERCADO DE CEREALES DE ASIA-PACÍFICO: DECISIONES ESTRATÉGICAS
FIGURA 13 MERCADO DE CEREALES DE ASIA-PACÍFICO: RESUMEN EJECUTIVO
FIGURA 14 DIECISÉIS SEGMENTOS COMPRENDEN EL MERCADO DE CEREALES DE ASIA-PACÍFICO: POR TIPO DE CEREAL
FIGURA 15 SE ESPERA QUE LA AUMENTO DE LA DEMANDA DE ALIMENTOS NUTRICIONALES Y FUNCIONALES IMPULSE EL MERCADO DE CEREALES DE ASIA-PACÍFICO EN EL PERÍODO DE PRONÓSTICO
FIGURA 16 SE ESPERA QUE EL SEGMENTO DE TRIGO REPRESENTE LA MAYOR PARTICIPACIÓN DEL MERCADO DE CEREALES DE ASIA-PACÍFICO EN 2025 Y 2032
FIGURA 17 DESCRIPCIÓN GENERAL DEL PRODUCTO Y LA MARCA
FIGURA 18 PERSPECTIVA DE LA CAPACIDAD DE PRODUCCIÓN
FIGURA 19 ANÁLISIS DE LA CADENA DE VALOR
FIGURA 20 FIGURA: ANÁLISIS DE LA CADENA DE SUMINISTRO DEL MERCADO DE CEREALES
FIGURA 21 CUADRANTE DE EVALUACIÓN DE EMPRESAS
FIGURA 22 NÚMERO TOTAL DE TRANSACCIONES
FIGURA 23 TRANSACCIONES POR TIPO
FIGURA 24 TRANSACCIONES POR SEGMENTO
FIGURA 25 ANÁLISIS DE LA TENDENCIA DE LOS PRECIOS DEL MERCADO DE CEREALES
FIGURA 26 FAMILIAS DE PATENTES
FIGURA 27 FAMILIAS DE PATENTES
FIGURA 28 % DEL COSTO TOTAL DEL TRANSPORTE
FIGURA 29 PUNTAJE DE IMPORTANCIA (1-10)
FIGURA 30 PARTICIPACIÓN ESTIMADA (%)
FIGURA 31 IMPULSORES, RESTRICCIONES, OPORTUNIDADES Y DESAFÍOS DEL MERCADO DE CEREALES DE ASIA-PACÍFICO
FIGURA 32 MERCADO DE CEREALES DE ASIA-PACÍFICO: POR TIPO DE CEREAL, 2024
FIGURA 33 MERCADO DE CEREALES DE ASIA-PACÍFICO: FORMA DEL PRODUCTO, 2024
FIGURA 34 MERCADO DE CEREALES DE ASIA-PACÍFICO: POR NIVEL DE PROCESAMIENTO, 2024
FIGURA 35 MERCADO DE CEREALES DE ASIA-PACÍFICO: POR FORMATO DE CONSUMO, 2024
FIGURA 36 MERCADO DE CEREALES DE ASIA-PACÍFICO: POR CATEGORÍA DE PRODUCTO, 2024
FIGURA 37 MERCADO DE CEREALES DE ASIA-PACÍFICO: POR NATURALEZA, 2024
FIGURA 38 MERCADO DE CEREALES DE ASIA-PACÍFICO: POR CATEGORÍA, 2024
FIGURA 39 MERCADO DE CEREALES DE ASIA-PACÍFICO: POR BENEFICIOS FUNCIONALES, 2024
FIGURA 40 MERCADO DE CEREALES DE ASIA-PACÍFICO: POR VIDA ÚTIL, 2024
FIGURA 41 MERCADO DE CEREALES DE ASIA-PACÍFICO: POR ENVASE, 2024
FIGURA 42 MERCADO DE CEREALES DE ASIA-PACÍFICO: POR TAMAÑO DE ENVASE, 2024
FIGURA 43 MERCADO DE CEREALES DE ASIA-PACÍFICO: POR RANGO DE PRECIOS, 2024
FIGURA 44 MERCADO DE CEREALES DE ASIA-PACÍFICO: POR CANAL DE DISTRIBUCIÓN, 2024
FIGURA 45 MERCADO DE CEREALES DE ASIA-PACÍFICO: INSTANTÁNEA (2024)
FIGURA 46 MERCADO DE CEREALES DE ASIA-PACÍFICO: PARTICIPACIÓN DE LA EMPRESA 2024 (%)
Metodología de investigación
La recopilación de datos y el análisis del año base se realizan utilizando módulos de recopilación de datos con muestras de gran tamaño. La etapa incluye la obtención de información de mercado o datos relacionados a través de varias fuentes y estrategias. Incluye el examen y la planificación de todos los datos adquiridos del pasado con antelación. Asimismo, abarca el examen de las inconsistencias de información observadas en diferentes fuentes de información. Los datos de mercado se analizan y estiman utilizando modelos estadísticos y coherentes de mercado. Además, el análisis de la participación de mercado y el análisis de tendencias clave son los principales factores de éxito en el informe de mercado. Para obtener más información, solicite una llamada de un analista o envíe su consulta.
La metodología de investigación clave utilizada por el equipo de investigación de DBMR es la triangulación de datos, que implica la extracción de datos, el análisis del impacto de las variables de datos en el mercado y la validación primaria (experto en la industria). Los modelos de datos incluyen cuadrícula de posicionamiento de proveedores, análisis de línea de tiempo de mercado, descripción general y guía del mercado, cuadrícula de posicionamiento de la empresa, análisis de patentes, análisis de precios, análisis de participación de mercado de la empresa, estándares de medición, análisis global versus regional y de participación de proveedores. Para obtener más información sobre la metodología de investigación, envíe una consulta para hablar con nuestros expertos de la industria.
Personalización disponible
Data Bridge Market Research es líder en investigación formativa avanzada. Nos enorgullecemos de brindar servicios a nuestros clientes existentes y nuevos con datos y análisis que coinciden y se adaptan a sus objetivos. El informe se puede personalizar para incluir análisis de tendencias de precios de marcas objetivo, comprensión del mercado de países adicionales (solicite la lista de países), datos de resultados de ensayos clínicos, revisión de literatura, análisis de mercado renovado y base de productos. El análisis de mercado de competidores objetivo se puede analizar desde análisis basados en tecnología hasta estrategias de cartera de mercado. Podemos agregar tantos competidores sobre los que necesite datos en el formato y estilo de datos que esté buscando. Nuestro equipo de analistas también puede proporcionarle datos en archivos de Excel sin procesar, tablas dinámicas (libro de datos) o puede ayudarlo a crear presentaciones a partir de los conjuntos de datos disponibles en el informe.

