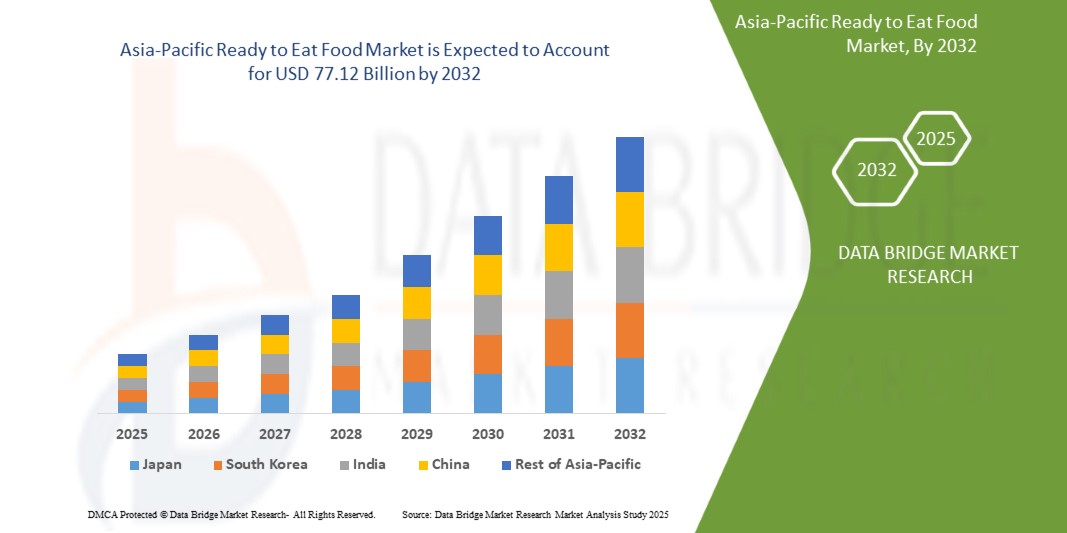
Asia Pacific Ready To Eat Food Market
Tamaño del mercado en miles de millones de dólares
Tasa de crecimiento anual compuesta (CAGR) :
% 
 USD
37.73 Billion
USD
77.12 Billion
2024
2032
USD
37.73 Billion
USD
77.12 Billion
2024
2032
| 2025 –2032 | |
| USD 37.73 Billion | |
| USD 77.12 Billion | |
| % | |
|
Segmentación del mercado de alimentos listos para comer en Asia-Pacífico, por tipo de producto (productos cárnicos, productos a base de cereales, productos lácteos, productos de panadería, dulces salados, productos de confitería, productos a base de vegetales, sopas instantáneas, refrigerios salados, alimentos refrigerados, refrigerios de carne a base de plantas y comidas listas para comer), categoría (convencional y especial), tipo de empaque (bolsas/sobres, latas, frascos y contenedores, botellas, cajas y otros), tamaño del empaque (menos de 250 gramos, 251-500 gramos, 501-750 gramos, 751-1000 gramos y más de 1000 gramos), tecnología de empaque (capturadores de oxígeno, control de humedad, antimicrobianos, indicadores de temperatura y tiempo, y películas comestibles), tipo de almacenamiento (congelado/refrigerado, estable, enlatado y otros), canal de distribución (canal basado en tienda y canal no basado en tienda), usuario final (Servicios de la industria alimentaria, hogares y otros): Tendencias de la industria y pronóstico hasta 2032
Análisis del mercado de alimentos listos para consumir en Asia-Pacífico
El mercado de alimentos listos para consumir (RTE) en Asia-Pacífico crece de forma constante, impulsado por la creciente demanda de opciones de comida prácticas y que ahorren tiempo. La urbanización, los estilos de vida ajetreados y los cambios en los hábitos alimenticios son factores clave que influyen en este cambio. Las comidas congeladas, los snacks instantáneos y los productos envasados listos para consumir están ganando popularidad entre diversos grupos demográficos. Si bien Norteamérica y Europa lideran el mercado, Asia-Pacífico se perfila como un fuerte competidor debido al aumento de la renta disponible y la evolución de las preferencias alimentarias. Los consumidores preocupados por su salud buscan opciones orgánicas, sin conservantes y nutritivas. La innovación en envasado, sostenibilidad y calidad de los ingredientes está moldeando el futuro del mercado, a pesar de los desafíos de la cadena de suministro.
Tamaño del mercado de alimentos listos para consumir en Asia-Pacífico
El tamaño del mercado de alimentos listos para comer de Asia-Pacífico se valoró en USD 37.73 mil millones en 2024 y se proyecta que alcance los USD 77.12 mil millones para 2032, con una CAGR del 9,48% durante el período de pronóstico de 2025 a 2032. Además de los conocimientos sobre escenarios de mercado como el valor de mercado, la tasa de crecimiento, la segmentación, la cobertura geográfica y los principales actores, los informes de mercado seleccionados por Data Bridge Market Research también incluyen un análisis experto en profundidad, análisis de precios, análisis de participación de marca, encuesta de consumidores, análisis demográfico, análisis de la cadena de suministro, análisis de la cadena de valor, descripción general de materias primas / consumibles, criterios de selección de proveedores, análisis PESTLE, análisis Porter y marco regulatorio.
Tendencias del mercado de alimentos listos para consumir en Asia-Pacífico
“Aumento de las horas de trabajo y estilos de vida acelerados”
A medida que las personas se esfuerzan por conciliar sus compromisos profesionales y personales, la demanda de opciones de comida convenientes ha aumentado. Según un informe de la Organización Internacional del Trabajo (OIT), la jornada laboral promedio en Asia-Pacífico ha aumentado aproximadamente un 8 % en la última década, lo que pone de manifiesto la creciente presión sobre la gestión del tiempo. En consecuencia, los consumidores optan por opciones de comida rápidas y sencillas que requieren una preparación mínima y ofrecen un ahorro de tiempo considerable.
El mercado de alimentos listos para comer se ha beneficiado enormemente de este cambio, ya que estos productos satisfacen las necesidades de las personas ocupadas que buscan comidas prácticas, nutritivas y de consumo inmediato. El ritmo de vida acelerado es particularmente frecuente en las poblaciones urbanas, donde las agendas apretadas limitan el tiempo para la preparación de comidas tradicionales. Esto ha impulsado a los fabricantes a innovar y a introducir una amplia gama de productos listos para comer que satisfacen diversas preferencias de sabor y necesidades dietéticas.
Además, el creciente número de hogares con doble ingreso ha contribuido a la expansión del mercado. En países como Estados Unidos y el Reino Unido, más del 60 % de los hogares tienen ahora a ambos miembros de la pareja trabajando, lo que deja menos tiempo para preparar comidas elaboradas. Este cambio demográfico ha provocado un aumento de la demanda de productos listos para consumir que se pueden consumir cómodamente en el trabajo, durante los desplazamientos o en casa después de largas jornadas laborales.
Por ejemplo,
- En marzo de 2023, la Organización Internacional del Trabajo (OIT) informó que Camboya trabajó un promedio de aproximadamente 2456 horas al año en 2017, lo que equivale a casi 47 horas semanales, la cifra más alta entre los 66 países estudiados. Esto indica una importante limitación de tiempo para la preparación de comidas, lo que impulsa la demanda de productos alimenticios listos para el consumo.
En países como México y la República Checa, los empleados suelen trabajar más de 2.000 horas al año, lo que genera una fuerte preferencia por opciones de comidas rápidas y sin complicaciones, incluidos productos listos para comer.
A medida que los estilos de vida ocupados se vuelven más frecuentes en todo el mundo, el mercado de alimentos listos para comer está preparado para un crecimiento sólido, impulsado por la necesidad inquebrantable de soluciones de comidas rápidas, accesibles y satisfactorias.
Alcance del informe y segmentación del mercado
|
Atributos |
Perspectivas clave del mercado de alimentos listos para consumir en Asia-Pacífico |
|
Segmentos cubiertos |
|
|
Países cubiertos |
China, India, Japón, Corea del Sur, Singapur, Tailandia, Indonesia, Malasia, Filipinas, Australia, Nueva Zelanda, Vietnam, Taiwán y el resto de Asia-Pacífico. |
|
Actores clave del mercado |
Mondelēz International, Inc. (EE. UU.), The Kraft Heinz Company (EE. UU.), General Mills Inc (EE. UU.), Nestlé (Suiza), Kellanova (EE. UU.), McCain Foods Limited (Canadá), Hormel Foods, LLC (EE. UU.), Unilever (Reino Unido), Lamb Weston, Inc. (EE. UU.), Simplot (EE. UU.), Tyson Foods, Inc. (EE. UU.), Nomad Foods (Inglaterra), Greencore Group plc (Irlanda), 2 Sisters Food Group (Inglaterra), ITC Limited (India), Agristo (Bélgica), Premier Foods plc (Reino Unido), Bakkavor Group plc (Reino Unido), The Hain Celestial Group, Inc. (EE. UU.), Orkla (Noruega), Farm Frites (Países Bajos), Haldiram's (India), Greenyard (Bélgica), Agrarfrost GmbH (Alemania), Regal Kitchen Foods (India), GODREJ AGROVET LTD. (India), Gitsfood.com (India), LIGHT MASS (Brasil), Koyara Food (India), Genie Food Group (India), Himalaya Food International Ltd. (India), Vimal Agro Products Pvt Ltd (India), Vechem Organics (P) Limited (India), Eateasy New (India), Sankalpfoods.com (India), CSC Brands LP (Canadá) y Priya Foods (Ushodaya Enterprises Pvt Ltd) (India). |
|
Oportunidades de mercado |
|
|
Conjuntos de información de datos de valor añadido |
Además de los conocimientos sobre escenarios de mercado, como valor de mercado, tasa de crecimiento, segmentación, cobertura geográfica y actores principales, los informes de mercado seleccionados por Data Bridge Market Research también incluyen análisis en profundidad de expertos, análisis de precios, análisis de participación de marca, encuesta de consumidores, análisis demográfico, análisis de la cadena de suministro, análisis de la cadena de valor, descripción general de materias primas/consumibles, criterios de selección de proveedores, análisis PESTLE, análisis de Porter y marco regulatorio. |
Definición del mercado de alimentos listos para consumir de Asia-Pacífico
Los alimentos listos para consumir (RTE) se refieren a productos alimenticios precocinados, preenvasados y que requieren mínima o ninguna preparación adicional antes de su consumo. Estos alimentos están diseñados para la comodidad y se adaptan a estilos de vida ajetreados, ofreciendo soluciones de comidas rápidas y fáciles sin comprometer el sabor ni la calidad. Los alimentos RTE incluyen una amplia variedad de productos, como comidas congeladas, alimentos enlatados, productos refrigerados y refrigerados, y refrigerios envasados no perecederos. Se encuentran comúnmente en supermercados, hipermercados, tiendas de conveniencia y plataformas de venta minorista en línea. Los alimentos RTE son particularmente populares entre profesionales, estudiantes y consumidores urbanos que buscan opciones de comida que les ahorren tiempo.
Dinámica del mercado de alimentos listos para consumir en Asia-Pacífico
Conductores
- Aumento del ingreso disponible del consumidor y mayor poder adquisitivo
A medida que las economías continúan expandiéndose, los consumidores experimentan una mayor estabilidad financiera, lo que les permite gastar más en productos alimenticios prácticos y de alta calidad. Según el Banco Mundial, la renta disponible per cápita en Asia-Pacífico ha experimentado un crecimiento constante durante la última década, lo que permite a los consumidores explorar una mayor variedad de opciones alimentarias que ofrecen comodidad y calidad.
Este aumento de la renta disponible ha provocado un cambio en las preferencias de los consumidores hacia soluciones de comida rápida y sin complicaciones. A medida que más personas pueden permitirse comprar productos listos para comer premium y de mayor precio, los fabricantes están aprovechando esta tendencia ofreciendo opciones de comida diversas e innovadoras que satisfacen diversas preferencias dietéticas, incluyendo variedades orgánicas, sin gluten y de origen vegetal. El aumento de la renta disponible es particularmente evidente en economías emergentes como China, India y Brasil, donde la creciente clase media se inclina cada vez más por opciones de comida convenientes en medio de los ajetreados estilos de vida urbanos. Solo en China, la renta disponible promedio por hogar aumentó alrededor de un 5,3 % en 2024, en comparación con el 5,1 % del año anterior, lo que impulsó significativamente la demanda de productos listos para comer.
Por ejemplo,
- En febrero de 2025, un artículo de The Economic Times destacó que Adani Wilmar, conocida por marcas como el arroz Kohinoor y los aceites de cocina Fortune, anticipa un crecimiento del 10 % en el volumen de ventas para el próximo año fiscal. El director ejecutivo, Angshu Mallick, atribuye este crecimiento previsto al aumento del gasto urbano, impulsado por las reducciones del impuesto sobre la renta personal y la creciente demanda de aplicaciones de entrega rápida de comestibles.
- En 2023, el ingreso personal disponible en China aumentó a 7,2 mil dólares, frente a los 6,9 mil dólares de 2022. Durante el período de 1978 a 2023, el ingreso personal disponible en China promedió 1,97 mil dólares, alcanzando un máximo de 7,2 mil dólares en 2023 y un mínimo histórico de 0,048 mil dólares en 1978.
Además, el mayor poder adquisitivo ha animado a los consumidores a priorizar la calidad, el sabor y la nutrición, impulsando a los fabricantes a desarrollar ofertas de alimentos listos para consumir con valor añadido. A medida que la renta disponible continúa aumentando en Asia-Pacífico, se prevé un auge del mercado de alimentos listos para consumir, impulsado por la disposición de los consumidores a invertir en soluciones de comida premium y prácticas.
- Canales de comercio minorista y electrónico en rápida expansión
Los fabricantes están aprovechando los formatos minoristas modernos y las soluciones de compra digital para aumentar la visibilidad y la accesibilidad de sus productos a medida que los consumidores los siguen adoptando. La creciente presencia de supermercados, hipermercados, tiendas de conveniencia y plataformas de alimentación en línea ha hecho que los productos alimenticios listos para consumir sean más accesibles, adaptándose al ritmo de vida acelerado de los consumidores urbanos.
El comercio electrónico, en particular, ha transformado el panorama del comercio minorista de alimentos al ofrecer la comodidad de comprar comidas listas para comer desde la comodidad del hogar. Actualmente, alrededor de 2.770 millones de personas en todo el mundo realizan compras en línea a través de plataformas de comercio electrónico especializadas o tiendas en redes sociales, lo que refleja una creciente preferencia por las compras en línea. Esta tendencia se ve impulsada por la creciente penetración de los teléfonos inteligentes y la mejora de la conectividad a internet, especialmente en las economías emergentes. Los gigantes del comercio minorista y las plataformas digitales están aprovechando esta oportunidad ampliando sus carteras de productos listos para comer, incluyendo comidas congeladas, refrigerios instantáneos y kits de comidas saludables. Las colaboraciones estratégicas entre fabricantes de alimentos y plataformas de comercio electrónico como Amazon, Walmart y actores regionales como BigBasket en India y JD.com en China han facilitado a los consumidores el acceso a una amplia variedad de opciones listas para comer con solo unos clics, lo que ha agilizado la distribución, reducido los plazos de entrega y mejorado la satisfacción del cliente. Además, la adopción de la venta minorista omnicanal (que integra las ventas físicas y digitales) ha demostrado ser muy eficaz para satisfacer las diversas demandas de los consumidores modernos.
Por ejemplo,
- Los resultados de SellersCommerce indican que, con más del 33 % de la población mundial comprando en línea, el comercio electrónico se ha convertido en una industria de 6,8 billones de dólares y se proyecta que alcance los 8 billones de dólares para 2027. Alrededor de 2770 millones de personas en todo el mundo realizan compras a través de plataformas de comercio electrónico especializadas o tiendas en redes sociales. China y Estados Unidos lideran las compras en línea, lo que genera grandes oportunidades para las marcas de alimentos listos para comer (RTE). Dado que los consumidores prefieren cada vez más las compras sin complicaciones, los productos listos para comer (RTE) están bien posicionados para prosperar.
- BigBasket, la plataforma líder de alimentación en línea de India, ha ampliado su catálogo de productos listos para consumir (RTE) para satisfacer la creciente demanda de opciones de comida práctica. Centrada en ofrecer productos frescos y de alta calidad, la empresa busca aprovechar la creciente preferencia de los consumidores por comidas rápidas y sin complicaciones. Esta estrategia permite a BigBasket capitalizar la creciente popularidad de los alimentos RTE en el mercado indio.
- En China, las tiendas Hema Fresh de Alibaba combinan la venta en línea y fuera de línea, lo que permite a los consumidores pedir comidas preparadas a través de una aplicación y recibirlas en 30 minutos. Hema reportó un aumento del 20% en sus ventas brutas en 2022.
Esta experiencia de compra fluida, sumada a atractivos descuentos y modelos de suscripción, ha convertido el comercio electrónico en el canal predilecto de los consumidores activos. Como resultado, los fabricantes se asocian cada vez más con plataformas en línea para ampliar su alcance, impulsando así el crecimiento y la innovación del mercado.
Oportunidades
- Creciente demanda de alimentos listos para consumir, de origen vegetal y veganos
La creciente conciencia sobre los beneficios para la salud, la sostenibilidad ambiental y las consideraciones éticas asociadas con las dietas basadas en plantas es una tendencia actual. A medida que más consumidores adoptan estilos de vida veganos o flexitarianos, la demanda de comidas prácticas y listas para comer que se ajusten a estas opciones continúa en aumento.
Los actores del mercado están capitalizando esta tendencia con el lanzamiento de productos listos para comer (RTE) innovadores, sabrosos y ricos en nutrientes, derivados de ingredientes vegetales. Según un informe del Good Food Institute, el sector de alimentos de origen vegetal ha experimentado un crecimiento de dos dígitos en los últimos años, impulsado por el creciente interés de los consumidores y la mayor disponibilidad de productos. Los principales fabricantes de alimentos y startups, por ejemplo, invierten cada vez más en soluciones de comidas veganas, desde curris y pastas vegetales hasta postres sin lácteos y ensaladas ricas en proteínas. Las redes sociales y las tendencias alimentarias impulsadas por influencers también han desempeñado un papel fundamental en la promoción de comidas veganas RTE, haciéndolas más populares y accesibles. Además, la expansión de los canales minoristas y de comercio electrónico ha impulsado aún más la visibilidad y el alcance de las ofertas de origen vegetal.
Por ejemplo,
- En noviembre de 2021, un estudio de NielsenIQ reveló que 2,7 millones de hogares en el Reino Unido tenían al menos un residente vegano o vegetariano. Además, 10,5 millones de hogares optaban por alternativas veganas o vegetarianas al menos una vez a la semana en lugar de comidas a base de carne. Entre los encuestados, el 40 % citó los beneficios para la salud como su motivación, mientras que el 31 % creía que era mejor para el planeta.
- En 2022, un estudio de Ipsos reveló que la creciente demanda de alimentos listos para consumir (LTE) de origen vegetal y veganos es evidente, ya que los consumidores buscan cada vez más opciones más saludables y sostenibles. Según un estudio de Ipsos, casi la mitad (46%) de los británicos de entre 16 y 75 años se plantea reducir el consumo de productos animales, y el 48% ya utiliza alternativas a la leche vegetal, como la de almendras, avena y coco. El mercado de LTE puede aprovechar esta tendencia ofreciendo soluciones de comidas prácticas, nutritivas y de origen vegetal.
- En la Encuesta Europea de Consumidores sobre Alimentos de Origen Vegetal de 2021, realizada por ProVeg International, se destacó que el Reino Unido lidera la compra y el consumo de productos de origen vegetal en Europa, incluyendo platos veganos preparados y comida para llevar. Dado que los consumidores priorizan cada vez más la salud y la sostenibilidad, el mercado de alimentos listos para comer (RTE) puede aprovechar esta tendencia ofreciendo opciones de comidas vegetales prácticas y variadas.
Dado que los consumidores preocupados por su salud buscan opciones alimentarias nutritivas y éticas, existe un amplio margen para que los fabricantes innoven y diversifiquen sus carteras de productos. La colaboración con proveedores de ingredientes de origen vegetal y la inversión en investigación y desarrollo pueden aumentar aún más el atractivo de los alimentos veganos listos para consumir (RTE). A medida que el mercado evoluciona, la adopción del movimiento de origen vegetal presenta una prometedora oportunidad de crecimiento sostenido y rentabilidad.
- Avances tecnológicos en el procesamiento y envasado de alimentos
Las innovaciones en los métodos de procesamiento, como el procesamiento a alta presión (HPP) y la esterilización térmica asistida por microondas (MATS), han permitido a los fabricantes prolongar la vida útil de los productos, preservando al mismo tiempo la frescura, el sabor y el valor nutricional. Estas técnicas de vanguardia satisfacen la demanda de los consumidores de productos mínimamente procesados y sin aditivos, sin comprometer la seguridad ni la calidad.
En el ámbito del envasado, la adopción de soluciones inteligentes y sostenibles está cobrando impulso. Las tecnologías de envasado activas e inteligentes, como los captadores de oxígeno y los indicadores de tiempo y temperatura, mejoran la seguridad del producto y mantienen la calidad a lo largo de la cadena de suministro. Además, la transición hacia materiales ecológicos, como los envases biodegradables y reciclables, atrae a consumidores con conciencia ambiental, alineándose con los objetivos de sostenibilidad de Asia-Pacífico. La automatización y la digitalización en el procesamiento de alimentos también están revolucionando la eficiencia de la producción. Los sistemas automatizados de clasificación, porcionado y control de calidad reducen los costes laborales y garantizan la consistencia, lo que permite a los fabricantes aumentar la producción manteniendo altos estándares. Asimismo, la maquinaria de envasado avanzada, con capacidades como el sellado al vacío y el envasado en atmósfera modificada (MAP), aumenta aún más el atractivo del producto al conservar la textura y el sabor durante más tiempo.
La integración de soluciones de trazabilidad, como la tecnología blockchain y los códigos QR en los envases, proporciona a los consumidores información en tiempo real sobre el origen del producto y el control de calidad. Esta transparencia genera confianza y mejora la fidelidad a la marca, haciendo que los productos listos para consumir sean más atractivos para los consumidores más exigentes.
Por ejemplo,
- Tetra Pak revolucionó el envasado de alimentos con su tecnología aséptica, que permite almacenar los productos sin refrigeración durante largos periodos, conservando su valor nutricional y sabor. Esta innovación ha sido fundamental para ampliar la distribución y la vida útil de los productos listos para consumir, especialmente en regiones con escasez de infraestructura para la cadena de frío.
- La esterilización térmica asistida por microondas (MATS) es una tecnología de vanguardia que combina agua caliente a presión y energía de microondas de onda larga para esterilizar productos alimenticios. A diferencia de la esterilización convencional en autoclave, MATS reduce significativamente el tiempo de procesamiento, minimizando la pérdida de nutrientes y preservando la calidad de los alimentos. Empresas líderes en Asia-Pacífico como Eka Asia-Pacific están aprovechando esta innovación para mejorar sus soluciones de envasado, satisfaciendo así las necesidades cambiantes de la industria alimentaria.
- La tecnología de sensores inteligentes está revolucionando el control de calidad en el procesamiento de alimentos al proporcionar monitoreo en tiempo real de la temperatura, la humedad y los niveles de contaminación. Estos sensores detectan desviaciones al instante, lo que permite ajustes rápidos para mantener la calidad y seguridad del producto. El registro automatizado de datos garantiza la trazabilidad y el cumplimiento de las normas de seguridad alimentaria, lo que aumenta la fiabilidad y eficiencia de la producción.
Estos avances no solo mejoran el atractivo de los productos, sino que también abren nuevos mercados al abordar los desafíos logísticos, especialmente en zonas remotas. Como resultado, las innovaciones tecnológicas impulsan el crecimiento, permitiendo a los fabricantes satisfacer las cambiantes demandas de los consumidores y, al mismo tiempo, mantener la rentabilidad.
Restricciones/Desafíos
- Alto costo de los alimentos listos para comer (RTE) en comparación con las comidas caseras
Los consumidores, especialmente en regiones con precios sensibles, suelen encontrar los alimentos listos para comer considerablemente más caros que preparar comidas caseras. Esta disparidad de costos se puede atribuir a varios factores, como el uso de ingredientes de primera calidad, el envasado, el procesamiento y los gastos logísticos.
Según la Oficina de Estadísticas Laborales, el costo promedio de una comida casera en EE. UU. es de aproximadamente USD4 por porción, mientras que el costo de una sola comida lista para comer puede variar entre USD7 y USD15, dependiendo de la marca y los ingredientes utilizados. Esta brecha de precios dificulta que muchos consumidores, especialmente aquellos de ingresos medios y bajos, justifiquen la compra frecuente de productos listos para comer. Además, la percepción de que las comidas listas para comer ofrecen una menor relación calidad-precio en comparación con las comidas caseras recién preparadas limita aún más la penetración en el mercado. A medida que los consumidores se vuelven más conscientes de sus gastos, especialmente en medio de las incertidumbres económicas, tienden a preferir opciones de comida casera y económica. Además, las preferencias culturales por las comidas recién cocinadas en muchos países continúan influyendo en las decisiones de los consumidores, ya que las familias priorizan los platos caseros sobre las alternativas preenvasadas. Esta tendencia a optar por métodos de cocción tradicionales plantea un desafío para los fabricantes que buscan capturar una mayor participación en el mercado.
Por ejemplo,
- Un artículo del New York Times de enero de 2025 destacó cómo las personas ahorraron cantidades sustanciales anualmente al reducir su dependencia de la comida rápida y optar por comidas caseras. Una persona ahorró casi 11 000 dólares al año al optar por preparar comidas en casa en lugar de comprar opciones preparadas.
- En agosto de 2023, un estudio destacado por Real Plans indica que los kits de entrega de comidas pueden ser hasta tres veces más caros que comprar ingredientes en supermercados locales y preparar comidas en casa.
Advance Financial informó que el alto costo de los alimentos listos para consumir (RTE) en comparación con las comidas caseras sigue siendo una preocupación para muchos consumidores. En promedio, una comida casera cuesta entre USD 4 y USD 6 por persona, mientras que una comida de restaurante o RTE puede costar entre USD 15 y USD 20 o más. Esta significativa diferencia de precio, de al menos USD 10 por comida, puede acumularse rápidamente, especialmente para quienes compran con frecuencia.
El alto costo de los productos alimenticios listos para consumir (RTE) en comparación con las comidas caseras sigue siendo un obstáculo importante para el crecimiento del mercado. A medida que los consumidores priorizan cada vez más las opciones económicas y recién preparadas, el mercado enfrenta constantes limitaciones para lograr una aceptación generalizada, especialmente en regiones con precios sensibles.
- Intensa competencia en el mercado entre las principales marcas de alimentos y los actores regionales
Las grandes marcas multinacionales están aprovechando sus sólidas redes de distribución y su prestigio consolidado para mantener su dominio, mientras que los actores regionales aprovechan las preferencias locales y las ventajas de costes. Esta competencia obliga a los fabricantes a innovar y diferenciar sus ofertas de productos para captar la atención del consumidor. Las marcas invierten cada vez más en estrategias de marketing y diversificación de productos para destacar, introduciendo a menudo sabores únicos, ingredientes fortificados y fórmulas saludables. Sin embargo, mantener la competitividad en medio de estrategias de precios agresivas y campañas promocionales sigue siendo un reto importante. Los fabricantes más pequeños y regionales a menudo tienen dificultades para igualar las economías de escala de los gigantes del sector, lo que se traduce en márgenes de beneficio más reducidos. Además, la aparición de productos de marca blanca en las grandes cadenas minoristas está ejerciendo mayor presión sobre los productos de marca, ya que los consumidores optan cada vez más por alternativas asequibles sin comprometer la calidad.
Además, la evolución de las preferencias de los consumidores y la creciente popularidad de productos dietéticos de nicho, como las opciones vegetales y sin gluten, obligan a las marcas a adaptar y ampliar continuamente sus portafolios. Equilibrar la innovación de productos con la rentabilidad sigue siendo una tarea abrumadora, especialmente para las empresas pequeñas con recursos limitados.
Por ejemplo,
- En marzo de 2025, Reuters publicó un artículo que afirmaba que los consumidores se inclinaban cada vez más por marcas de alimentos más pequeñas e independientes, a menudo percibidas como productoras menos procesadas y más asequibles. Este cambio ha afectado a grandes conglomerados como Unilever y Procter & Gamble, cuya cuota de mercado ha disminuido a medida que los consumidores optan por alternativas como la mayonesa Duke's y la mayonesa Mike's Amazing en lugar de marcas tradicionales como Hellmann's.
- Un artículo de noviembre de 2022 de Dow Jones & Company, Inc. (WALL STREET JOURNAL) destacó que los minoristas están desarrollando cada vez más sus propios productos alimenticios listos para consumir (RTE) de marca blanca, ofreciendo a los consumidores alternativas rentables a las marcas establecidas. Esta estrategia no solo ofrece a los consumidores más opciones, sino que también intensifica la competencia, obligando a las grandes marcas a reevaluar sus precios y propuestas de valor.
En medio de esta intensa competencia, mantener la lealtad a la marca y sostener la rentabilidad se ha vuelto cada vez más difícil, ya que tanto los actores establecidos como los emergentes navegan en un panorama en rápida evolución con mayores expectativas de los consumidores.
Impacto y escenario actual del mercado ante la escasez de materias primas y los retrasos en los envíos
Data Bridge Market Research ofrece un análisis exhaustivo del mercado y proporciona información considerando el impacto y el entorno actual del mercado en la escasez de materias primas y los retrasos en los envíos. Esto se traduce en la evaluación de posibilidades estratégicas, la creación de planes de acción eficaces y la asistencia a las empresas en la toma de decisiones importantes.
Además del informe estándar, también ofrecemos un análisis en profundidad del nivel de adquisiciones a partir de retrasos de envío previstos, mapeo de distribuidores por región, análisis de productos básicos, análisis de producción, tendencias de mapeo de precios, abastecimiento, análisis del desempeño de categorías, soluciones de gestión de riesgos de la cadena de suministro, evaluación comparativa avanzada y otros servicios para adquisiciones y soporte estratégico.
Impacto esperado de la desaceleración económica en los precios y la disponibilidad de los productos
Cuando la actividad económica se desacelera, las industrias empiezan a verse afectadas. Los efectos previstos de la recesión económica en los precios y la accesibilidad de los productos se tienen en cuenta en los informes de análisis de mercado y los servicios de inteligencia que ofrece DBMR. Gracias a esto, nuestros clientes pueden, por lo general, adelantarse a sus competidores, proyectar sus ventas e ingresos, y estimar sus gastos de resultados.
Panorama del mercado de alimentos listos para consumir en Asia-Pacífico
El mercado está segmentado según el tipo de producto, la categoría, el tipo de empaque, el tamaño del empaque, la tecnología de empaque, el tipo de almacenamiento, el canal de distribución y el usuario final. El crecimiento de estos segmentos le permitirá analizar los segmentos con menor crecimiento en las industrias y brindar a los usuarios una valiosa visión general del mercado y perspectivas que les ayudarán a tomar decisiones estratégicas para identificar las principales aplicaciones del mercado.
Tipo de producto
- Productos cárnicos
- Productos a base de cereales
- Productos lácteos
- Productos de panadería
- Dulces Salados
- Productos de confitería
- Productos a base de vegetales
- Sopas instantáneas, bocadillos salados
- Alimentos refrigerados
- Snacks de carne a base de plantas
- Comidas listas para comer
Categoría
- Convencional
- Especialidad
Tipo de embalaje
- Bolsas/sobres
- Latas
- Frascos y contenedores
- Botellas
- Cajas
- Otros
Tamaño del embalaje
- Menos de 250 gramos
- 251-500 gramos
- 501-750 gramos
- 751-1000 gramos
- Más de 1000 gramos
Tecnología de embalaje
- Absorbedores de oxígeno
- Control de humedad
- Antimicrobianos
- Indicadores de temperatura y tiempo
- Películas comestibles
Tipo de fuente
- Congelado/Refrigerado
- Estable en almacenamiento
- Enlatado
- Otros
Canal de distribución
- Basado en la tienda
- Canal no basado en tienda
Usuario final
- Servicios de la industria alimentaria
- Hogares
- Otros
Análisis regional del mercado de alimentos listos para consumir en Asia-Pacífico
Se analiza el mercado y se proporcionan información sobre el tamaño del mercado y las tendencias por país, tipo de producto, categoría, tipo de embalaje, tamaño del embalaje, tecnología de embalaje, tipo de almacenamiento, canal de distribución y usuario final como se mencionó anteriormente.
Los países cubiertos en el mercado son China, India, Japón, Corea del Sur, Singapur, Tailandia, Indonesia, Malasia, Filipinas, Australia, Nueva Zelanda, Vietnam, Taiwán y el resto de Asia-Pacífico.
Se espera que China domine el mercado de alimentos listos para consumir (RTE) debido a su amplia base de consumidores, su rápida urbanización y los cambios en los hábitos alimenticios que priorizan la conveniencia. El aumento de la renta disponible y las apretadas agendas laborales impulsan la demanda de soluciones de comida rápida. La sólida presencia de fabricantes nacionales de alimentos, las extensas redes minoristas y el auge de las plataformas de comercio electrónico impulsan aún más el crecimiento del mercado. Además, la innovación en opciones de RTE tradicionales y saludables responde a las cambiantes preferencias de los consumidores, consolidando el liderazgo de China en el mercado.
Se prevé que India sea el mercado de alimentos listos para consumir (RTE) con mayor crecimiento debido a la rápida urbanización, el aumento de los ingresos disponibles y los cambios en el estilo de vida de los consumidores, que priorizan la conveniencia. Una fuerza laboral activa y el aumento del empleo femenino impulsan la demanda de soluciones de comida rápida. La expansión de las cadenas de supermercados, la penetración del comercio electrónico y la preferencia por los sabores tradicionales en formatos envasados impulsan la expansión del mercado. Además, la creciente concienciación sobre la salud y la demanda de opciones RTE orgánicas y sin conservantes contribuyen a la sólida trayectoria de crecimiento del sector.
La sección de países del informe también presenta los factores que impactan en cada mercado y los cambios en la regulación nacional que impactan las tendencias actuales y futuras del mercado. Datos como el análisis de la cadena de valor aguas abajo y aguas arriba, las tendencias técnicas, el análisis de las cinco fuerzas de Porter y los estudios de caso son algunos de los indicadores utilizados para pronosticar el escenario del mercado en cada país. Asimismo, se considera la presencia y disponibilidad de marcas de Asia-Pacífico y los desafíos que enfrentan debido a la alta o escasa competencia de marcas locales y nacionales, el impacto de los aranceles internos y las rutas comerciales, al proporcionar un análisis de pronóstico de los datos nacionales.
Cuota de mercado de alimentos listos para consumir en Asia-Pacífico
El panorama competitivo del mercado proporciona detalles por competidores. Se incluye información general de la empresa, sus estados financieros, ingresos generados, potencial de mercado, inversión en investigación y desarrollo, nuevas iniciativas de mercado, presencia en Asia-Pacífico, plantas de producción, capacidad de producción, fortalezas y debilidades de la empresa, lanzamiento de productos, alcance y variedad de productos, y dominio de las aplicaciones. Los datos anteriores se refieren únicamente al enfoque de mercado de las empresas.
Los líderes del mercado de alimentos listos para comer de Asia-Pacífico que operan en el mercado son:
- Lamb Weston (Estados Unidos)
- Simplot (EE. UU.)
- Haldiram (India)
- Patatas fritas de granja (Países Bajos)
- Greenyard (Bélgica)
- Agrarfrost GmbH (Alemania)
- Agristo (Bélgica)
- CSC Brands LP (Canadá)
- El Grupo Celestial Hain, Inc. (EE. UU.)
- Bakkavor Group plc (Reino Unido)
- McCain Foods Limited (Canadá)
- Premier Foods plc (Reino Unido)
- gitsfood.com (India)
- Nomad Foods (Reino Unido)
- General Mills (EE. UU.)
- Greencore Group plc (Irlanda)
- Orkla (Noruega)
- ITC Limited (India)
- Himalaya Food International Ltd. (India)
- Grupo Internacional Mondelēz (EE. UU.)
- Kraft Heinz (EE. UU.)
- Tyson Foods, Inc. (EE. UU.)
- Soluciones alimentarias de Unilever (Reino Unido)
- Nestlé (Suiza)
- Misa ligera (Brasil)
- Kellanova (EE. UU.)
- Hormel Foods, LLC. (EE. UU.)
- Comida Koyara (India)
- Priya Foods (India)
- Grupo de alimentos Genie (India)
- Vechem Organics (P) Limited (India)
- Vimal Agro Products Pvt Ltd (India)
- sankalpfoods.com (India)
- Alimentos de cocina real (India)
- Eateasy nuevo (India)
- GODREJ AGROVET LTD. (India)
- 2 Sisters Food Group (Reino Unido)
Últimos avances en el mercado de alimentos listos para consumir en Asia-Pacífico
- En enero de 2025, OREO inicia el año con el lanzamiento de seis nuevos y emocionantes sabores, incluyendo ediciones limitadas y productos permanentes. Entre los sabores más destacados se encuentran las galletas OREO Game Day, con relieves inspirados en el fútbol americano, perfectas para los días de partido y las fiestas para ver el partido. Las nuevas galletas OREO Loaded, disponibles permanentemente, ofrecen crema Mega Stuf rellena con trocitos de OREO. Otras novedades permanentes incluyen las OREO Cakesters Doradas, las OREO Irish Creme THINS y las OREO Minis Peanut Butter. Las OREO Cakesters Doradas son pastelitos dorados rellenos de crema, las OREO Irish Creme THINS ofrecen un toque de crema irlandesa, y las OREO Minis Peanut Butter combinan galletas de chocolate con una suave crema de mantequilla de cacahuete. Además, las galletas OREO congeladas completan la nueva y emocionante línea de productos.
- En septiembre de 2024, la alianza entre OREO y Coca-Cola presenta una divertida y emocionante colaboración llamada "Besties", que celebra el vínculo único de la amistad. Las marcas se han unido para ofrecer dos productos por tiempo limitado: la galleta sándwich OREO Coca-Cola y la Coca-Cola OREO Zero Azúcar Edición Limitada. Ambas presentan diseños y empaques distintivos, que combinan los elementos icónicos de ambas marcas. La galleta sándwich OREO Coca-Cola combina una base de chocolate con un sabor inspirado en Coca-Cola y crema blanca con purpurina comestible roja, mientras que la Coca-Cola OREO Zero Azúcar ofrece un refrescante sabor a Coca-Cola con toques de OREO. La colaboración busca unir a los fans, crear nuevas experiencias y celebrar la conexión y la unión de una manera divertida e inesperada.
- En abril de 2024, los traviesos SOUR PATCH KIDS se unieron a OREO para una divertida e inesperada colaboración, presentando las galletas OREO SOUR PATCH KIDS de edición limitada. Estas galletas contienen Golden OREO con sabor a SOUR PATCH KIDS, con inclusiones coloridas y un relleno de crema con azúcar ácida multicolor para una experiencia agridulce. Junto con las galletas, las marcas lanzarán una línea de merchandising exclusiva, que incluye una camiseta de cuello redondo, pantalones deportivos, un sombrero de pescador, una bandolera, pinzas para el pelo y calcetines. La colección celebra el espíritu lúdico de ambas marcas, ofreciendo a los fans la oportunidad de disfrutar de la mejor combinación agridulce con artículos de OREO y SOUR PATCH KIDS de edición limitada.
- En febrero de 2023, Mondelēz International dio un paso significativo hacia su objetivo de cero emisiones netas de gases de efecto invernadero para 2050 al anunciar una importante inversión en energía renovable procedente de plantas fotovoltaicas en Polonia. La compañía firmó un Acuerdo de Compra de Energía Virtual (PPA) de 12 años con GoldenPeaks Capital, que suministrará alrededor de 126 gigavatios hora de electricidad renovable al año, procedente de diversas plantas de energía solar en Polonia. Se espera que este acuerdo ahorre más de un millón de toneladas métricas de CO2 y compense la huella de carbono relacionada con la electricidad de ocho plantas de Mondelēz en Polonia. El inicio de la producción de energía está previsto para marzo de 2023, lo que marca un hito importante en el compromiso de Mondelēz con la sostenibilidad y la reducción de su huella de emisiones. Esta colaboración ejemplifica la dedicación de la compañía a construir un futuro más sostenible, a la vez que continúa ofreciendo sus apreciados productos, como Milka, Prince Polo y Delicje.
- En febrero de 2025, Capri Sun lanzó su primera botella resellable en más de 20 años, ofreciendo una nueva y cómoda forma de disfrutar de sus icónicos sabores para llevar a todos los públicos. Las botellas de 355 ml, disponibles en Fruit Punch, Pacific Cooler y Strawberry Kiwi, contienen el equivalente a dos sobres y están elaboradas con ingredientes totalmente naturales, sin colorantes ni edulcorantes artificiales. Este lanzamiento responde a la demanda de porciones más grandes y está diseñado para satisfacer las necesidades de las familias ocupadas, especialmente en tiendas de conveniencia donde Capri Sun tenía una disponibilidad limitada. Esta iniciativa amplía el portafolio de Capri Sun, basándose en el éxito de innovaciones anteriores como las jarras Capri Sun Multi-Serve, y refuerza el compromiso de la marca de evolucionar con las preferencias del consumidor.
SKU-
Obtenga acceso en línea al informe sobre la primera nube de inteligencia de mercado del mundo

- Panel de análisis de datos interactivo
- Panel de análisis de empresas para oportunidades con alto potencial de crecimiento
- Acceso de analista de investigación para personalización y consultas
- Análisis de la competencia con panel interactivo
- Últimas noticias, actualizaciones y análisis de tendencias
- Aproveche el poder del análisis de referencia para un seguimiento integral de la competencia
Tabla de contenido
1 INTRODUCCIÓN
1.1 OBJETIVOS DEL ESTUDIO
1.2 DEFINICIÓN DE MERCADO
1.3 INFORMACIÓN GENERAL
1.4 LIMITACIONES
1.5 MERCADOS CUBIERTOS
2 SEGMENTACIÓN DEL MERCADO
2.1 MERCADOS CUBIERTOS
2.2 ÁMBITO GEOGRÁFICO
2,3 AÑOS CONSIDERADOS PARA EL ESTUDIO
2.4 MONEDA Y PRECIOS
2.5 MODELO DE VALIDACIÓN DE DATOS TRÍPODE DBMR
2.6 MODELADO MULTIVARIADO
2.7 ENTREVISTAS PRINCIPALES CON LÍDERES DE OPINIÓN CLAVE
2.8 CUADRÍCULA DE POSICIÓN DE MERCADO DBMR
2.9 CUADRÍCULA DE COBERTURA DE APLICACIONES DEL MERCADO
2.1 ANÁLISIS DE PARTICIPACIÓN DE PROVEEDORES DE DBMR
2.11 FUENTES SECUNDARIAS
2.12 SUPUESTOS
3 RESUMEN EJECUTIVO
4 INFORMACIÓN PREMIUM
4.1 LAS CINCO FUERZAS DE PORTER
4.1.1 AMENAZA DE NUEVOS ENTRANTES
4.1.2 AMENAZA DE SUSTITUTOS
4.1.3 PODER DE NEGOCIACIÓN DE LOS COMPRADORES
4.1.4 PODER DE NEGOCIACIÓN DE LOS PROVEEDORES
4.1.5 RIVALIDAD COMPETITIVA
4.2 ESCENARIO DE IMPORTACIÓN Y EXPORTACIÓN
4.3 ANÁLISIS DE LA CADENA DE VALOR
4.3.1 ABASTECIMIENTO DE MATERIA PRIMA
4.3.2 PROCESAMIENTO Y FABRICACIÓN DE ALIMENTOS
4.3.3 EMBALAJE Y ALMACENAMIENTO
4.3.4 DISTRIBUCIÓN Y LOGÍSTICA
4.3.5 MARKETING Y VENTA MINORISTA
4.3.6 CONCLUSIÓN
4.4 FACTORES CLAVE QUE INFLUYEN EN LA DECISIÓN DE COMPRA DE LOS USUARIOS FINALES
4.4.1 COMODIDAD Y AHORRO DE TIEMPO
4.4.2 CONCIENCIACIÓN SOBRE SALUD Y NUTRICIÓN
4.4.3 SENSIBILIDAD AL PRECIO Y FACTORES ECONÓMICOS
4.4.4 REPUTACIÓN DE LA MARCA Y CONFIANZA
4.4.5 EMBALAJE Y PRESENTACIÓN DEL PRODUCTO
4.4.6 INFLUENCIA DIGITAL Y VENTA MINORISTA EN LÍNEA
4.4.7 PREFERENCIAS CULTURALES Y REGIONALES
4.4.8 SOSTENIBILIDAD Y CONSIDERACIONES ÉTICAS
4.5 ESTRATEGIAS DE CRECIMIENTO ADOPTADAS POR LOS ACTORES CLAVE DEL MERCADO
4.5.1 INNOVACIÓN Y DIVERSIFICACIÓN DE PRODUCTOS
4.5.2 ADQUISICIONES ESTRATÉGICAS
4.5.3 EXPANSIÓN INTERNACIONAL
4.5.4 AVANCES TECNOLÓGICOS
4.6 TENDENCIAS DE LA INDUSTRIA Y PERSPECTIVA FUTURA
4.6.1 TENDENCIAS DE LA INDUSTRIA
4.6.1.1 CRECIENTE DEMANDA DE CONVENIENCIA POR PARTE DE LOS CONSUMIDORES
4.6.1.2 AUMENTO DE LA POPULARIDAD DE LOS ALIMENTOS RTE SALUDABLES Y NUTRITIVOS
4.6.1.3 INNOVACIONES EN ENVASES PARA UNA VIDA ÚTIL MÁS LARGA
4.6.1.4 EXPANSIÓN DE LOS SEGMENTOS DE CONGELADOS Y REFRIGERADOS RTE
4.6.1.5 AUGE DE OPCIONES DE PROTEÍNAS VEGETALES Y ALTERNATIVAS
4.6.1.6 DIGITALIZACIÓN Y CRECIMIENTO DEL COMERCIO ELECTRÓNICO
4.6.1.7 ENFOQUE EN LA ETIQUETA LIMPIA Y LA TRANSPARENCIA
4.6.2 PERSPECTIVA FUTURA
4.6.2.1 AVANCES TECNOLÓGICOS EN EL PROCESAMIENTO DE ALIMENTOS
4.6.2.2 OPCIONES ALIMENTARIAS SOSTENIBLES Y ÉTICAS
4.6.2.3 PERSONALIZACIÓN EN COMIDAS RTE
4.6.2.4 DESAFÍOS REGULATORIOS Y DE CUMPLIMIENTO
4.7 PANORAMA GENERAL DE LAS INNOVACIONES TECNOLÓGICAS
4.7.1 TECNOLOGÍAS AVANZADAS DE PROCESAMIENTO DE ALIMENTOS
4.7.2 EMBALAJES INTELIGENTES Y MATERIALES SOSTENIBLES
4.7.3 AUTOMATIZACIÓN Y ROBÓTICA EN LA PRODUCCIÓN DE ALIMENTOS
4.7.4 MEJORA NUTRICIONAL E INGREDIENTES FUNCIONALES
4.7.5 IA Y BIG DATA PARA LA PERSONALIZACIÓN Y LA OPTIMIZACIÓN DE LA CADENA DE SUMINISTRO
4.7.6 IMPRESIÓN Y PERSONALIZACIÓN DE ALIMENTOS EN 3D
4.7.7 COMERCIO ELECTRÓNICO, COCINAS EN LA NUBE E INNOVACIONES EN LA ENTREGA DE ÚLTIMA MILLA
4.7.8 CONCLUSIÓN
4.8 COBERTURA DE MATERIA PRIMA
4.8.1 PROTEÍNAS (CARNE, AVES Y PROTEÍNAS DE ORIGEN VEGETAL)
4.8.2 GRANOS Y CARBOHIDRATOS
4.8.3 VERDURAS Y FRUTAS
4.8.4 CONSERVANTES Y ADITIVOS
4.8.5 TENDENCIAS EMERGENTES Y FUTURAS OPORTUNIDADES DE ABASTECIMIENTO
4.8.6 CONCLUSIÓN
4.9 ANÁLISIS DE LA CADENA DE SUMINISTRO
4.9.1 ABASTECIMIENTO Y ADQUISICIÓN DE MATERIA PRIMA
4.9.2 PROCESAMIENTO Y FABRICACIÓN
4.9.3 GESTIÓN DE ALMACENAMIENTO E INVENTARIO
4.9.4 DISTRIBUCIÓN Y LOGÍSTICA
4.9.5 ACCESO AL POR MENOR Y AL CONSUMIDOR
4.9.6 DESAFÍOS EN LA CADENA DE SUMINISTRO DE ALIMENTOS LISTA PARA COMER
4.9.7 TENDENCIAS E INNOVACIONES FUTURAS
4.9.8 CONCLUSIÓN
4.1 ANÁLISIS DE PRECIOS
4.11 CAPACIDAD DE PRODUCCIÓN DE LOS FABRICANTES CLAVE
4.12 PERSPECTIVA DE LA MARCA
4.12.1 ANÁLISIS COMPARATIVO DE MARCAS
4.12.2 RESUMEN DEL PRODUCTO VS. MARCA
4.12.2.1 DESCRIPCIÓN GENERAL DEL PRODUCTO
4.12.2.2 DESCRIPCIÓN GENERAL DE LA MARCA
4.12.2.3 CONCLUSIÓN
5 MARCO REGULADOR Y DIRECTRICES
6 PANORAMA GENERAL DEL MERCADO
6.1 CONDUCTORES
6.1.1 AUMENTO DE LAS HORAS DE TRABAJO Y ESTILOS DE VIDA ACELERADOS
6.1.2 AUMENTO DE LA RENTA DISPONIBLE DEL CONSUMIDOR Y MAYOR PODER ADQUISITIVO
6.1.3 CANALES DE COMERCIO MINORISTA Y ELECTRÓNICO EN RÁPIDA EXPANSIÓN
6.1.4 AUMENTO DE LA DEMANDA DE ALIMENTOS SALUDABLES, ORGÁNICOS Y ENRIQUECIDOS LISTOS PARA CONSUMIR
6.2 RESTRICCIONES
6.2.1 PREOCUPACIONES DE SALUD RELACIONADAS CON LOS ALIMENTOS PROCESADOS
6.2.2 ALTO COSTO DE LOS ALIMENTOS LISTOS PARA COMER (RTE) EN COMPARACIÓN CON LAS COMIDAS CASERAS
6.3 OPORTUNIDADES
6.3.1 AUMENTO DE LA DEMANDA DE ALIMENTOS LISTOS PARA CONSUMIR, DE ORIGEN VEGETAL Y VEGANOS
6.3.2 AVANCES TECNOLÓGICOS EN EL PROCESAMIENTO Y ENVASADO DE ALIMENTOS
6.3.3 PERSONALIZACIÓN Y PERSONALIZACIÓN DE ALIMENTOS LISTOS PARA CONSUMIR
6.4 DESAFÍOS
6.4.1 INTENSA COMPETENCIA DE MERCADO ENTRE LAS PRINCIPALES MARCAS DE ALIMENTOS Y LOS ACTORES REGIONALES
6.4.2 PERCEPCIÓN DEL CONSUMIDOR DE LOS INGREDIENTES Y SABORES ARTIFICIALES EN ALIMENTOS LISTOS PARA EL CONSUMO
7 MERCADO DE ALIMENTOS LISTOS PARA CONSUMIR DE ASIA-PACÍFICO, POR TIPO DE PRODUCTO
7.1 INFORMACIÓN GENERAL
7.2 PRODUCTOS CÁRNICOS
7.3 PRODUCTOS A BASE DE CEREALES
7.4 PRODUCTOS LÁCTEOS
7.5 PRODUCTOS DE PANADERÍA
7.6 POSTRES SALADOS
7.7 PRODUCTOS DE CONFITERÍA
7.8 PRODUCTOS A BASE DE VEGETALES
7.9 SOPAS INSTANTÁNEAS
7.1 APERITIVOS SALADOS
7.11 ALIMENTOS REFRIGERADOS
7.12 SNACKS DE CARNE DE ORIGEN VEGETAL
7.13 COMIDAS LISTAS PARA COMER
8 MERCADO DE ALIMENTOS LISTOS PARA COMER DE ASIA-PACÍFICO, POR CATEGORÍA
8.1 DESCRIPCIÓN GENERAL
8.2 CONVENCIONAL
8.3 ESPECIALIDAD
9 MERCADO DE ALIMENTOS LISTOS PARA CONSUMIR DE ASIA-PACÍFICO, POR TIPO DE ENVASE
9.1 INFORMACIÓN GENERAL
9.2 BOLSAS/SOBRES
9.3 LATAS
9.4 FRASCOS Y RECIPIENTES
9.5 BOTELLAS
9.6 CAJAS
9.7 OTROS
10 MERCADO DE ALIMENTOS LISTOS PARA CONSUMIR DE ASIA-PACÍFICO, POR TAMAÑO DE ENVASE
10.1 INFORMACIÓN GENERAL
10.2 MENOS DE 250 GRAMOS
10.3 251-500 GRAMOS
10.4 501-750 GRAMOS
10.5 751-1000 GRAMOS
10.6 MÁS DE 1000 GRAMOS
11 MERCADO DE ALIMENTOS LISTOS PARA CONSUMIR EN ASIA-PACÍFICO, MEDIANTE TECNOLOGÍA DE ENVASADO
11.1 INFORMACIÓN GENERAL
11.2 RECOGEDORES DE OXÍGENO
11.3 CONTROL DE HUMEDAD
11.4 ANTIMICROBIANOS
11.5 INDICADORES DE TEMPERATURA Y TIEMPO
11.6 PELÍCULAS COMESTIBLES
12 MERCADO DE ALIMENTOS LISTOS PARA CONSUMIR DE ASIA-PACÍFICO, POR TIPO DE ALMACENAMIENTO
12.1 DESCRIPCIÓN GENERAL
12.2 CONGELADOS/REFRIGERADOS
12.3 ESTABLE
12.4 ENLATADOS
12.5 OTROS
13 MERCADO DE ALIMENTOS LISTOS PARA CONSUMIR DE ASIA-PACÍFICO, POR CANAL DE DISTRIBUCIÓN
13.1 INFORMACIÓN GENERAL
13.2 BASADO EN TIENDA
13.3 SIN TIENDA
14 MERCADO DE ALIMENTOS LISTOS PARA CONSUMIR DE ASIA-PACÍFICO, POR USUARIO FINAL
14.1 INFORMACIÓN GENERAL
14.2 SERVICIOS DE LA INDUSTRIA ALIMENTARIA
14.3 HOGARES
14.4 OTROS
15 MERCADO DE ALIMENTOS LISTOS PARA COMER DE ASIA-PACÍFICO, POR REGIÓN
15.1 ASIA-PACÍFICO
15.1.1 CHINA
15.1.2 INDIA
15.1.3 JAPÓN
15.1.4 COREA DEL SUR
15.1.5 SINGAPUR
15.1.6 TAILANDIA
15.1.7 INDONESIA
15.1.8 MALASIA
15.1.9 FILIPINAS
15.1.10 AUSTRALIA
15.1.11 NUEVA ZELANDA
15.1.12 VIETNAM
15.1.13 TAIWÁN
15.1.14 RESTO DE ASIA-PACÍFICO
16 MERCADO DE ALIMENTOS LISTOS PARA COMER DE ASIA-PACÍFICO: PANORAMA EMPRESARIAL
16.1 ANÁLISIS DE LAS ACCIONES DE LA EMPRESA: GLOBAL
17 ANÁLISIS FODA
18 PERFILES DE EMPRESAS
18.1 MONDELĒZ INTERNATIONAL, INC.
18.1.1 INSTANTÁNEA DE LA EMPRESA
18.1.2 INFORMACIÓN FINANCIERA RECIENTE
18.1.3 ANÁLISIS DE LAS ACCIONES DE LA EMPRESA
18.1.4 PORTAFOLIO DE PRODUCTOS
18.1.5 DESARROLLO RECIENTE
18.2 LA COMPAÑÍA KRAFT HEINZ
18.2.1 INSTANTÁNEA DE LA EMPRESA
18.2.2 INFORMACIÓN FINANCIERA RECIENTE
18.2.3 ANÁLISIS DE LAS ACCIONES DE LA EMPRESA
18.2.4 PORTAFOLIO DE PRODUCTOS
18.2.5 DESARROLLO RECIENTE
18.3 GENERAL MILLS INC
18.3.1 INSTANTÁNEA DE LA EMPRESA
18.3.2 INFORMACIÓN FINANCIERA RECIENTE
18.3.3 ANÁLISIS DE LAS ACCIONES DE LA EMPRESA
18.3.4 PORTAFOLIO DE PRODUCTOS
18.3.5 DESARROLLO RECIENTE
18.4 NESTLÉ
18.4.1 INSTANTÁNEA DE LA EMPRESA
18.4.2 ANÁLISIS DE INGRESOS
18.4.3 ANÁLISIS DE LAS ACCIONES DE LA EMPRESA
18.4.4 PORTAFOLIO DE PRODUCTOS
18.4.5 DESARROLLOS RECIENTES
18.5 KELLANOVA
18.5.1 INSTANTÁNEA DE LA EMPRESA
18.5.2 ANÁLISIS DE INGRESOS
18.5.3 ANÁLISIS DE LAS ACCIONES DE LA EMPRESA
18.5.4 PORTAFOLIO DE PRODUCTOS
18.5.5 DESARROLLO RECIENTE
18.6 AGRISTO
18.6.1 INSTANTÁNEA DE LA EMPRESA
18.6.2 PORTAFOLIO DE PRODUCTOS
18.6.3 DESARROLLO RECIENTE
18.7 GRUPO DE ALIMENTOS 2 HERMANAS
18.7.1 INSTANTÁNEA DE LA EMPRESA
18.7.2 PORTAFOLIO DE PRODUCTOS
18.7.3 NOTICIAS RECIENTES
18.8 AGRARFROST GMBH
18.8.1 INSTANTÁNEA DE LA EMPRESA
18.8.2 PRODUCT PORTFOLIO
18.8.3 RECENT DEVELOPMENT
18.9 BAKKAVOR GROUP PLC
18.9.1 COMPANY SNAPSHOT
18.9.2 RECENT FINANCIALS
18.9.3 PRODUCT PORTFOLIO
18.9.4 RECENT DEVELOPMENT
18.1 CSC BRANDS LP
18.10.1 COMPANY SNAPSHOT
18.10.2 PRODUCT PORTFOLIO
18.10.3 RECENT DEVELOPMENT
18.11 EATEASY NEW.
18.11.1 COMPANY SNAPSHOT
18.11.2 PRODUCT PORTFOLIO
18.11.3 RECENT DEVELOPMENT
18.12 FARM FRITES
18.12.1 COMPANY SNAPSHOT
18.12.2 PRODUCT PORTFOLIO
18.12.3 RECENT DEVELOPMENT
18.13 GENIE FOOD GROUP
18.13.1 COMPANY SNAPSHOT
18.13.2 PRODUCT PORTFOLIO
18.13.3 RECENT DEVELOPMENT
18.14 GITSFOOD.COM
18.14.1 COMPANY SNAPSHOT
18.14.2 PRODUCT PORTFOLIO
18.14.3 RECENT DEVELOPMENT
18.15 GODREJ AGROVET LIMITED
18.15.1 COMPANY SNAPSHOT
18.15.2 REVENUE ANALYSIS
18.15.3 PRODUCT PORTFOLIO
18.15.4 RECENT DEVELOPMENT
18.16 GREENCORE GROUP PLC
18.16.1 COMPANY SNAPSHOT
18.16.2 RECENT FINANCIALS
18.16.3 PRODUCT PORTFOLIO
18.16.4 NEWS TYPE
18.17 GREENYARD
18.17.1 COMPANY SNAPSHOT
18.17.2 REVENUE ANALYSIS
18.17.3 PRODUCT PORTFOLIO
18.17.4 RECENT DEVELOPMENT
18.18 HALDIRAM’S
18.18.1 COMPANY SNAPSHOTS
18.18.2 PRODUCT PORTFOLIO
18.18.3 RECENT DEVELOPMENT
18.19 HIMALAYA FOOD INTERNATIONAL LTD.
18.19.1 COMPANY SNAPSHOT
18.19.2 REVENUE ANALYSIS
18.19.3 PRODUCT PORTFOLIO
18.19.4 RECENT DEVELOPMENT
18.2 HORMEL FOODS CORPORATION.
18.20.1 COMPANY SNAPSHOT
18.20.2 REVENUE ANALYSIS
18.20.3 PRODUCT PORTFOLIO
18.20.4 RECENT DEVELOPMENT
18.21 ITC LIMITED
18.21.1 COMPANY SNAPSHOT
18.21.2 REVENUE ANALYSIS
18.21.3 PRODUCT PORTFOLIO
18.21.4 RECENT DEVELOPMENTS
18.22 KOYARA FOODS
18.22.1 COMPANY SNAPSHOT
18.22.2 PRODUCT PORTFOLIO
18.22.3 RECENT DEVELOPMENT
18.23 LAMB WESTON, INC.
18.23.1 COMPANY SNAPSHOT
18.23.2 REVENUE ANALYSIS
18.23.3 PRODUCT PORTFOLIO
18.23.4 RECENT DEVELOPMENT
18.24 LIGHT MASS
18.24.1 COMPANY SNAPSHOT
18.24.2 PRODUCT PORTFOLIO
18.24.3 RECENT DEVELOPMENT
18.25 MCCAIN FOODS LIMITED
18.25.1 COMPANY SNAPSHOT
18.25.2 PRODUCT PORTFOLIO
18.25.3 RECENT DEVELOPMENT
18.26 NOMAD FOODS
18.26.1 COMPANY SNAPSHOT
18.26.2 RECENT FINANCIALS
18.26.3 PRODUCT PORTFOLIO
18.26.4 RECENT DEVELOPMENT
18.27 ORKLA
18.27.1 COMPANY SNAPSHOT
18.27.2 RECENT FINANCIALS
18.27.3 PRODUCT PORTFOLIO
18.27.4 RECENT DEVELOPMENT
18.28 PREMIER FOODS PLC
18.28.1 COMPANY SNAPSHOT
18.28.2 RECENT FINANCIALS
18.28.3 PRODUCT PORTFOLIO
18.28.4 RECENT DEVELOPMENT
18.29 PRIYA FOODS
18.29.1 COMPANY SNAPSHOT
18.29.2 PRODUCT PORTFOLIO
18.29.3 RECENT DEVELOPMENT
18.3 REGAL KITCHEN FOODS
18.30.1 COMPANY SNAPSHOT
18.30.2 PRODUCT PORTFOLIO
18.30.3 RECENT DEVELOPMENT
18.31 SANKALPFOODS.COM
18.31.1 COMPANY SNAPSHOT
18.31.2 PRODUCT PORTFOLIO
18.31.3 RECENT DEVELOPMENT/ NEWS TYPE
18.32 J.R. SIMPLOT COMPANY.
18.32.1 COMPANY SNAPSHOT
18.32.2 PRODUCT PORTFOLIO
18.32.3 RECENT DEVELOPMENT
18.33 THE HAIN CELESTIAL GROUP, INC.
18.33.1 COMPANY SNAPSHOT
18.33.2 REVENUE ANALYSIS
18.33.3 PRODUCT PORTFOLIO
18.33.4 RECENT DEVELOPMENTS
18.34 TYSON FOODS, INC.
18.34.1 COMPANY SNAPSHOT
18.34.2 RECENT FINANCIALS
18.34.3 PRODUCT PORTFOLIO
18.34.4 RECENT DEVELOPMENT
18.35 UNILEVER
18.35.1 COMPANY SNAPSHOT
18.35.2 REVENUE ANALYSIS
18.35.3 PRODUCT PORTFOLIO
18.35.4 RECENT DEVELOPMENTS
18.36 VECHEM ORGANICS (P) LIMITED
18.36.1 COMPANY SNAPSHOT
18.36.2 PRODUCT PORTFOLIO
18.36.3 RECENT DEVELOPMENT
18.37 VIMAL AGRO PRODUCTS PVT LTD
18.37.1 COMPANY SNAPSHOT
18.37.2 PRODUCT PORTFOLIO
18.37.3 RECENT DEVELOPMENT
19 QUESTIONNAIRE
20 RELATED REPORTS
Lista de Tablas
CUADRO 1 CAPACIDAD DE PRODUCCIÓN ESTIMADA DE LOS FABRICANTES CLAVE
CUADRO 2 COBERTURA REGULATORIA
CUADRO 3 AUMENTO DE LOS INGRESOS DISPONIBLES
TABLA 4 AHORROS ESTIMADOS AL USAR ALIMENTOS LISTOS PARA CONSUMIR
TABLA 5 MERCADO DE ALIMENTOS LISTOS PARA CONSUMIR DE ASIA-PACÍFICO, POR TIPO DE PRODUCTO, 2018-2032 (MILES DE USD)
CUADRO 6 MERCADO DE ALIMENTOS LISTOS PARA CONSUMIR DE ASIA-PACÍFICO, POR TIPO DE PRODUCTO, 2018-2032 (TONELADAS)
CUADRO 7 MERCADO DE ALIMENTOS LISTOS PARA CONSUMIR DE ASIA-PACÍFICO, POR TIPO DE PRODUCTO, 2018-2032 (USD/KG)
TABLA 8 PRODUCTOS CÁRNICOS DE ASIA-PACÍFICO EN EL MERCADO DE ALIMENTOS LISTOS PARA CONSUMIR, POR REGIÓN, 2018-2032 (MILES DE USD)
CUADRO 9 PRODUCTOS CÁRNICOS DE ASIA-PACÍFICO EN EL MERCADO DE ALIMENTOS LISTOS PARA CONSUMIR, POR REGIÓN, 2018-2032, (TONELADAS)
TABLA 10 PRODUCTOS CÁRNICOS DE ASIA-PACÍFICO EN EL MERCADO DE ALIMENTOS LISTOS PARA CONSUMIR, POR TIPO, 2018-2032 (MILES DE USD)
TABLA 11 PRODUCTOS CÁRNICOS DE ASIA-PACÍFICO EN EL MERCADO DE ALIMENTOS LISTOS PARA CONSUMIR, POR TIPO, 2018-2032 (TONELADAS)
CUADRO 12 PRODUCTOS CÁRNICOS DE ASIA-PACÍFICO EN EL MERCADO DE ALIMENTOS LISTOS PARA CONSUMIR, POR TIPO, 2018-2032 (USD/KG)
CUADRO 13 PRODUCTOS A BASE DE CEREALES DE ASIA-PACÍFICO EN EL MERCADO DE ALIMENTOS LISTOS PARA CONSUMIR, POR REGIÓN 2018-2032, (MILES DE USD)
CUADRO 14 PRODUCTOS A BASE DE CEREALES DE ASIA-PACÍFICO EN EL MERCADO DE ALIMENTOS LISTOS PARA CONSUMIR, POR REGIÓN, 2018-2032, (TONELADAS)
CUADRO 15 PRODUCTOS A BASE DE CEREALES DE ASIA-PACÍFICO EN EL MERCADO DE ALIMENTOS LISTOS PARA CONSUMIR, POR TIPO, 2018-2032 (MILES DE USD)
CUADRO 16 PRODUCTOS A BASE DE CEREALES DE ASIA-PACÍFICO EN EL MERCADO DE ALIMENTOS LISTOS PARA CONSUMIR, POR TIPO, 2018-2032 (TONELADAS)
CUADRO 17 PRODUCTOS A BASE DE CEREALES DE ASIA-PACÍFICO EN EL MERCADO DE ALIMENTOS LISTOS PARA CONSUMIR, POR TIPO, 2018-2032 (USD/KG)
TABLA 18 PRODUCTOS LÁCTEOS DE ASIA-PACÍFICO EN EL MERCADO DE ALIMENTOS LISTOS PARA CONSUMIR, POR REGIÓN, 2018-2032, (MILES DE USD)
TABLA 19 PRODUCTOS LÁCTEOS DE ASIA-PACÍFICO EN EL MERCADO DE ALIMENTOS LISTOS PARA CONSUMIR, REGIÓN, 2018-2032 (TONELADAS)
TABLA 20 PRODUCTOS LÁCTEOS DE ASIA-PACÍFICO EN EL MERCADO DE ALIMENTOS LISTOS PARA CONSUMIR, POR TIPO, 2018-2032 (MILES DE USD)
TABLA 21 PRODUCTOS LÁCTEOS DE ASIA-PACÍFICO EN EL MERCADO DE ALIMENTOS LISTOS PARA CONSUMIR, POR TIPO, 2018-2032 (TONELADAS)
CUADRO 22 PRODUCTOS LÁCTEOS DE ASIA-PACÍFICO EN EL MERCADO DE ALIMENTOS LISTOS PARA CONSUMIR, POR TIPO, 2018-2032 (USD/KG)
TABLA 23 QUESO EN EL MERCADO DE ALIMENTOS LISTOS PARA CONSUMIR DE ASIA-PACÍFICO, POR FORMA, 2018-2032 (MILES DE USD)
TABLA 24 QUESO DE ASIA-PACÍFICO EN EL MERCADO DE ALIMENTOS LISTOS PARA CONSUMIR, POR FORMA, 2018-2032 (TONELADAS)
TABLA 25 QUESO DE ASIA-PACÍFICO EN EL MERCADO DE ALIMENTOS LISTOS PARA CONSUMIR, POR FORMA, 2018-2032 (USD/KG)
TABLA 26 QUESO EN EL MERCADO DE ALIMENTOS LISTOS PARA CONSUMIR DE ASIA-PACÍFICO, POR TIPO, 2018-2032 (MILES DE USD)
TABLA 27 QUESO DE ASIA-PACÍFICO EN EL MERCADO DE ALIMENTOS LISTOS PARA CONSUMIR, POR TIPO, 2018-2032 (TONELADAS)
TABLA 28 QUESO DE ASIA-PACÍFICO EN EL MERCADO DE ALIMENTOS LISTOS PARA CONSUMIR, POR TIPO, 2018-2032 (TONELADAS)
TABLA 29 QUESO DE ORIGEN ANIMAL EN EL MERCADO DE ALIMENTOS LISTOS PARA CONSUMIR DE ASIA-PACÍFICO, POR TIPO, 2018-2032 (MILES DE USD)
TABLA 30 QUESO DE ORIGEN VEGETAL EN EL MERCADO DE ALIMENTOS LISTOS PARA CONSUMIR DE ASIA-PACÍFICO, POR TIPO (MILES DE USD)
TABLA 31 HELADOS DE ASIA-PACÍFICO EN EL MERCADO DE ALIMENTOS LISTOS PARA CONSUMIR, POR TIPO, 2018-2032 (MILES DE USD)
TABLA 32 HELADOS DE ASIA-PACÍFICO EN EL MERCADO DE ALIMENTOS LISTOS PARA CONSUMIR, POR TIPO, 2018-2032 (TONELADAS)
TABLA 33 HELADOS DE ASIA-PACÍFICO EN EL MERCADO DE ALIMENTOS LISTOS PARA CONSUMIR, POR TIPO, 2018-2032 (TONELADAS)
TABLA 34 CUAJADA EN EL MERCADO DE ALIMENTOS LISTOS PARA CONSUMIR DE ASIA-PACÍFICO, POR TIPO, 2018-2032 (MILES DE USD)
TABLA 35 CUAJADA EN EL MERCADO DE ALIMENTOS LISTOS PARA CONSUMIR DE ASIA-PACÍFICO, POR TIPO, 2018-2032 (TONELADAS)
TABLA 36 CUAJADA EN EL MERCADO DE ALIMENTOS LISTOS PARA CONSUMIR DE ASIA-PACÍFICO, POR TIPO, 2018-2032 (USD/KG)
TABLA 37 PANEER DE ASIA-PACÍFICO EN EL MERCADO DE ALIMENTOS LISTOS PARA CONSUMIR, POR TIPO, 2018-2032 (TONELADAS)
TABLA 38 PANEER DE ASIA-PACÍFICO EN EL MERCADO DE ALIMENTOS LISTOS PARA CONSUMIR, POR TIPO, 2018-2032 (TONELADAS)
TABLA 39 PANEER DE ASIA-PACÍFICO EN EL MERCADO DE ALIMENTOS LISTOS PARA CONSUMIR, POR TIPO, 2018-2032 (USD/KG)
TABLA 40 GHEE EN EL MERCADO DE ALIMENTOS LISTOS PARA CONSUMIR DE ASIA-PACÍFICO, POR FUENTE, 2018-2032 (MILES DE USD)
TABLA 41 GHEE DE ASIA-PACÍFICO EN EL MERCADO DE ALIMENTOS LISTOS PARA CONSUMIR, POR FUENTE, 2018-2032 (TONELADAS)
CUADRO 42 GHEE EN EL MERCADO DE ALIMENTOS LISTOS PARA CONSUMIR DE ASIA-PACÍFICO, POR FUENTE, 2018-2032 (USD/KG)
TABLA 43 PRODUCTOS DE PANADERÍA DE ASIA-PACÍFICO EN EL MERCADO DE ALIMENTOS LISTOS PARA CONSUMIR, POR REGIÓN, 2018-2032, (MILES DE USD)
TABLA 44 PRODUCTOS DE PANADERÍA DE ASIA-PACÍFICO EN EL MERCADO DE ALIMENTOS LISTOS PARA CONSUMIR, POR TIPO DE PRODUCTO, 2018-2032, (TONELADAS)
TABLA 45 PRODUCTOS DE PANADERÍA DE ASIA-PACÍFICO EN EL MERCADO DE ALIMENTOS LISTOS PARA CONSUMIR, POR TIPO, 2018-2032 (MILES DE USD)
TABLA 46 PRODUCTOS DE PANADERÍA DE ASIA-PACÍFICO EN EL MERCADO DE ALIMENTOS LISTOS PARA CONSUMIR, POR TIPO, 2018-2032 (TONELADAS)
TABLA 47 PRODUCTOS DE PANADERÍA DE ASIA-PACÍFICO EN EL MERCADO DE ALIMENTOS LISTOS PARA CONSUMIR, POR TIPO, 2018-2032 (USD/KG)
TABLA 48 DULCES SALADOS DE ASIA-PACÍFICO EN EL MERCADO DE ALIMENTOS LISTOS PARA CONSUMIR, POR REGIÓN, 2018-2032, (MILES DE USD)
TABLA 49 DULCES SALADOS DE ASIA-PACÍFICO EN EL MERCADO DE ALIMENTOS LISTOS PARA CONSUMIR, POR REGIÓN, 2018-2032, (TONELADAS)
TABLA 50 DULCES SALADOS EN EL MERCADO DE ALIMENTOS LISTOS PARA CONSUMIR DE ASIA-PACÍFICO, POR TIPO, 2018-2032 (MILES DE USD)
TABLA 51 DULCES SALADOS DE ASIA-PACÍFICO EN EL MERCADO DE ALIMENTOS LISTOS PARA CONSUMIR, POR TIPO, 2018-2032 (TONELADAS)
TABLA 52 DULCES SALADOS DE ASIA-PACÍFICO EN EL MERCADO DE ALIMENTOS LISTOS PARA CONSUMIR, POR TIPO, 2018-2032 (USD/KG)
TABLA 53 PRODUCTOS DE CONFITERÍA DE ASIA-PACÍFICO EN EL MERCADO DE ALIMENTOS LISTOS PARA CONSUMIR, POR TIPO DE REGIÓN, 2018-2032, (MILES DE USD)
TABLA 54 PRODUCTOS DE CONFITERÍA DE ASIA-PACÍFICO EN EL MERCADO DE ALIMENTOS LISTOS PARA CONSUMIR, POR REGIÓN, 2018-2032, (TONELADAS)
TABLA 55 PRODUCTOS DE CONFITERÍA DE ASIA-PACÍFICO EN EL MERCADO DE ALIMENTOS LISTOS PARA CONSUMIR, POR TIPO, 2018-2032 (MILES DE USD)
TABLA 56 PRODUCTOS DE CONFITERÍA DE ASIA-PACÍFICO EN EL MERCADO DE ALIMENTOS LISTOS PARA CONSUMIR, POR TIPO, 2018-2032 (TONELADAS)
TABLA 57 PRODUCTOS DE CONFITERÍA DE ASIA-PACÍFICO EN EL MERCADO DE ALIMENTOS LISTOS PARA CONSUMIR, POR TIPO, 2018-2032 (TONELADAS)
CUADRO 58 PRODUCTOS A BASE DE VEGETALES EN EL MERCADO DE ALIMENTOS LISTOS PARA CONSUMIR DE ASIA-PACÍFICO, POR REGIÓN, 2018-2032, (MILES DE USD)
CUADRO 59 PRODUCTOS A BASE DE VEGETALES DE ASIA-PACÍFICO EN EL MERCADO DE ALIMENTOS LISTOS PARA CONSUMIR, POR REGIÓN, 2018-2032 (TONELADAS)
CUADRO 60 PRODUCTOS A BASE DE VEGETALES EN EL MERCADO DE ALIMENTOS LISTOS PARA CONSUMIR DE ASIA-PACÍFICO, POR TIPO, 2018-2032 (MILES DE USD)
CUADRO 61 PRODUCTOS A BASE DE VEGETALES EN EL MERCADO DE ALIMENTOS LISTOS PARA CONSUMIR DE ASIA-PACÍFICO, POR TIPO, 2018-2032 (TONELADAS)
CUADRO 62 PRODUCTOS A BASE DE VEGETALES EN EL MERCADO DE ALIMENTOS LISTOS PARA CONSUMIR DE ASIA-PACÍFICO, POR TIPO, 2018-2032 (TONELADAS)
TABLA 63 SOPAS INSTANTÁNEAS EN EL MERCADO DE ALIMENTOS LISTOS PARA CONSUMIR DE ASIA-PACÍFICO, POR REGIÓN, 2018-2032, (MILES DE USD)
TABLA 64 SOPAS INSTANTÁNEAS EN EL MERCADO DE ALIMENTOS LISTOS PARA CONSUMIR DE ASIA-PACÍFICO, POR REGIÓN, 2018-2032, (TONELADAS)
TABLA 65 SOPAS INSTANTÁNEAS EN EL MERCADO DE ALIMENTOS LISTOS PARA CONSUMIR DE ASIA-PACÍFICO, POR TIPO, 2018-2032 (MILES DE USD)
TABLA 66 SOPAS INSTANTÁNEAS EN EL MERCADO DE ALIMENTOS LISTOS PARA CONSUMIR DE ASIA-PACÍFICO, POR TIPO, 2018-2032 (TONELADAS)
TABLA 67 SOPAS INSTANTÁNEAS EN EL MERCADO DE ALIMENTOS LISTOS PARA CONSUMIR DE ASIA-PACÍFICO, POR TIPO, 2018-2032 (USD/KG)
TABLA 68 APERITIVOS SALADOS EN EL MERCADO DE ALIMENTOS LISTOS PARA CONSUMIR DE ASIA-PACÍFICO, POR REGIÓN, 2018-2032, (MILES DE USD)
TABLA 69 APERITIVOS SALADOS EN EL MERCADO DE ALIMENTOS LISTOS PARA CONSUMIR DE ASIA-PACÍFICO, POR REGIÓN, 2018-2032 (TONELADAS)
TABLA 70 APERITIVOS SALADOS EN EL MERCADO DE ALIMENTOS LISTOS PARA CONSUMIR DE ASIA-PACÍFICO, POR TIPO, 2018-2032 (MILES DE USD)
TABLA 71 APERITIVOS SALADOS EN EL MERCADO DE ALIMENTOS LISTOS PARA CONSUMIR DE ASIA-PACÍFICO, POR TIPO, 2018-2032 (TONELADAS)
TABLA 72 APERITIVOS SALADOS EN EL MERCADO DE ALIMENTOS LISTOS PARA CONSUMIR DE ASIA-PACÍFICO, POR TIPO, 2018-2032 (USD/KG)
TABLA 73 PAPAS FRITAS EN EL MERCADO DE ALIMENTOS LISTOS PARA CONSUMIR DE ASIA-PACÍFICO, POR TIPO, 2018-2032 (MILES DE USD)
TABLA 74 PATATAS FRITAS EN EL MERCADO DE ALIMENTOS LISTOS PARA CONSUMIR DE ASIA-PACÍFICO, POR TIPO, 2018-2032 (TONELADAS)
TABLA 75 PATATAS FRITAS EN EL MERCADO DE ALIMENTOS LISTOS PARA CONSUMIR DE ASIA-PACÍFICO, POR TIPO, 2018-2032 (TONELADAS)
TABLA 76 OBLEAS DE ASIA-PACÍFICO EN EL MERCADO DE ALIMENTOS LISTOS PARA CONSUMIR, POR TIPO, 2018-2032 (MILES DE USD)
TABLA 77 OBLEAS DE ASIA-PACÍFICO EN EL MERCADO DE ALIMENTOS LISTOS PARA CONSUMIR, POR TIPO, 2018-2032 (TONELADAS)
TABLA 78 OBLEAS DE ASIA-PACÍFICO EN EL MERCADO DE ALIMENTOS LISTOS PARA CONSUMIR, POR TIPO, 2018-2032 (USD/KG)
TABLA 79 NAMKEEN DE ASIA-PACÍFICO EN EL MERCADO DE ALIMENTOS LISTOS PARA CONSUMIR, POR TIPO, 2018-2032 (MILES DE USD)
TABLA 80 NAMKEEN DE ASIA-PACÍFICO EN EL MERCADO DE ALIMENTOS LISTOS PARA CONSUMIR, POR TIPO, 2018-2032 (TONELADAS)
TABLA 81 NAMKEEN DE ASIA-PACÍFICO EN EL MERCADO DE ALIMENTOS LISTOS PARA CONSUMIR, POR TIPO, 2018-2032 (USD/KG)
TABLA 82 GALLETAS Y GALLETAS EN EL MERCADO DE ALIMENTOS LISTOS PARA CONSUMIR DE ASIA-PACÍFICO, POR TIPO, 2018-2032 (MILES DE USD)
TABLA 83 GALLETAS Y GALLETAS DE ASIA-PACÍFICO EN EL MERCADO DE ALIMENTOS LISTOS PARA CONSUMIR, POR TIPO, 2018-2032 (TONELADAS)
TABLA 84 GALLETAS Y GALLETAS DE ASIA-PACÍFICO EN EL MERCADO DE ALIMENTOS LISTOS PARA CONSUMIR, POR TIPO, 2018-2032 (USD/KG)
TABLA 85 ALIMENTOS REFRIGERADOS EN EL MERCADO DE ALIMENTOS LISTOS PARA CONSUMIR DE ASIA-PACÍFICO, POR REGIÓN, 2018-2032, (MILES DE USD)
TABLA 86 ALIMENTOS REFRIGERADOS DE ASIA-PACÍFICO EN EL MERCADO DE ALIMENTOS LISTOS PARA CONSUMIR, POR REGIÓN, 2018-2032, (TONELADAS)
TABLA 87 ALIMENTOS REFRIGERADOS DE ASIA-PACÍFICO EN EL MERCADO DE ALIMENTOS LISTOS PARA CONSUMIR, POR TIPO (MILES DE USD)
CUADRO 88 ALIMENTOS REFRIGERADOS DE ASIA-PACÍFICO EN EL MERCADO DE ALIMENTOS LISTOS PARA CONSUMIR, POR TIPO (TONELADAS)
CUADRO 89 ALIMENTOS REFRIGERADOS DE ASIA-PACÍFICO EN EL MERCADO DE ALIMENTOS LISTOS PARA CONSUMIR, POR TIPO (USD/KG)
TABLA 90 SNACKS DE CARNE DE ORIGEN VEGETAL EN EL MERCADO DE ALIMENTOS LISTOS PARA CONSUMIR DE ASIA-PACÍFICO, POR REGIÓN, 2018-2032, (MILES DE USD)
TABLA 91 SNACKS DE CARNE DE ORIGEN VEGETAL EN EL MERCADO DE ALIMENTOS LISTOS PARA CONSUMIR DE ASIA-PACÍFICO, POR REGIÓN, 2018-2032 (TONELADAS)
TABLA 92 SNACKS DE CARNE DE ORIGEN VEGETAL EN EL MERCADO DE ALIMENTOS LISTOS PARA CONSUMIR DE ASIA-PACÍFICO, POR TIPO, 2018-2032 (MILES DE USD)
TABLA 93 APERITIVOS DE CARNE DE ORIGEN VEGETAL EN EL MERCADO DE ALIMENTOS LISTOS PARA CONSUMIR DE ASIA-PACÍFICO, POR TIPO, 2018-2032 (TONELADAS)
TABLA 94 SNACKS DE CARNE DE ORIGEN VEGETAL EN EL MERCADO DE ALIMENTOS LISTOS PARA CONSUMIR DE ASIA-PACÍFICO, POR TIPO, 2018-2032 (USD/KG)
TABLA 95 APERITIVOS DE CARNE DE ORIGEN VEGETAL EN EL MERCADO DE ALIMENTOS LISTOS PARA CONSUMIR DE ASIA-PACÍFICO, POR FUENTE, 2018-2032 (MILES DE USD)
TABLA 96 APERITIVOS DE CARNE DE ORIGEN VEGETAL EN EL MERCADO DE ALIMENTOS LISTOS PARA CONSUMIR DE ASIA-PACÍFICO, POR FUENTE, 2018-2032 (TONELADAS)
TABLA 97 APERITIVOS DE CARNE DE ORIGEN VEGETAL EN EL MERCADO DE ALIMENTOS LISTOS PARA CONSUMIR DE ASIA-PACÍFICO, POR FUENTE, 2018-2032 (USD/KG)
TABLA 98 COMIDAS LISTAS PARA COMER EN EL MERCADO DE ALIMENTOS LISTOS PARA COMER DE ASIA-PACÍFICO, POR REGIÓN, 2018-2032, (MILES DE USD)
TABLA 99 COMIDAS LISTAS PARA COMER EN EL MERCADO DE ALIMENTOS LISTOS PARA COMER DE ASIA-PACÍFICO, POR REGIÓN 2018-2032, (TONELADAS)
TABLA 100 COMIDAS LISTAS PARA COMER EN EL MERCADO DE ALIMENTOS LISTOS PARA COMER DE ASIA-PACÍFICO, POR TIPO, 2018-2032 (MILES DE USD)
TABLA 101 COMIDAS LISTAS PARA COMER EN EL MERCADO DE ALIMENTOS LISTOS PARA COMER DE ASIA-PACÍFICO, POR TIPO, 2018-2032 (TONELADAS)
TABLA 102 COMIDAS LISTAS PARA COMER EN EL MERCADO DE ALIMENTOS LISTOS PARA COMER DE ASIA-PACÍFICO, POR TIPO, 2018-2032 (USD/KG)
TABLA 103 MERCADO DE ALIMENTOS LISTOS PARA CONSUMIR DE ASIA-PACÍFICO, POR CATEGORÍA, 2018-2032 (MILES DE USD)
TABLA 104 MERCADO DE ALIMENTOS CONVENCIONALES LISTOS PARA CONSUMIR DE ASIA-PACÍFICO, POR REGIÓN, 2018-2032 (MILES DE USD)
TABLA 105 MERCADO DE ESPECIALIDADES DE ASIA-PACÍFICO EN ALIMENTOS LISTOS PARA CONSUMIR, POR REGIÓN, 2018-2032 (MILES DE USD)
TABLA 106 MERCADO DE ESPECIALIDADES DE ASIA-PACÍFICO EN ALIMENTOS LISTOS PARA CONSUMIR, POR TIPO, 2018-2032 (MILES DE USD)
TABLA 107 MERCADO DE ALIMENTOS LISTOS PARA CONSUMIR DE ASIA-PACÍFICO, POR TIPO DE ENVASE, 2018-2032 (MILES DE USD)
TABLA 108 BOLSAS/SOBRES DE ASIA-PACÍFICO EN EL MERCADO DE ALIMENTOS CONVENCIONALES LISTOS PARA CONSUMIR, POR REGIÓN, 2018-2032 (MILES DE USD)
TABLA 109 ASIA-PACÍFICO ENLATADOS EN EL MERCADO DE ALIMENTOS CONVENCIONALES LISTOS PARA CONSUMIR, POR REGIÓN, 2018-2032 (MILES DE USD)
TABLA 110 ASIA-PACÍFICO FRASCOS Y ENVASES EN EL MERCADO CONVENCIONAL DE ALIMENTOS LISTOS PARA CONSUMIR, POR REGIÓN, 2018-2032 (MILES DE USD)
TABLA 111 ENVASES DE ASIA-PACÍFICO EN EL MERCADO DE ALIMENTOS CONVENCIONALES LISTOS PARA CONSUMIR, POR REGIÓN, 2018-2032 (MILES DE USD)
TABLA 112 ENVASES DE ASIA-PACÍFICO EN EL MERCADO DE ALIMENTOS CONVENCIONALES LISTOS PARA CONSUMIR, POR TIPO, 2018-2032 (MILES DE USD)
TABLA 113 CUADROS DE ASIA-PACÍFICO EN EL MERCADO DE ALIMENTOS CONVENCIONALES LISTOS PARA CONSUMIR, POR REGIÓN, 2018-2032 (MILES DE USD)
TABLA 114 OTROS MERCADOS DE ALIMENTOS CONVENCIONALES LISTOS PARA CONSUMIR EN ASIA-PACÍFICO, POR REGIÓN, 2018-2032 (MILES DE USD)
TABLA 115 MERCADO DE ALIMENTOS LISTOS PARA CONSUMIR DE ASIA-PACÍFICO, POR TAMAÑO DE ENVASE, 2018-2032 (MILES DE USD)
TABLA 116 ASIA-PACÍFICO MERCADO DE ALIMENTOS CONVENCIONALES LISTOS PARA CONSUMIR MENOS DE 250 GRAMOS, POR REGIÓN, 2018-2032 (MILES DE USD)
TABLA 117 ASIA-PACÍFICO 251-500 GRAMOS EN EL MERCADO DE ALIMENTOS CONVENCIONALES LISTOS PARA CONSUMIR, POR REGIÓN, 2018-2032 (MILES DE USD)
TABLA 118 ASIA-PACÍFICO 501-750 GRAMOS EN EL MERCADO DE ALIMENTOS CONVENCIONALES LISTOS PARA CONSUMIR, POR REGIÓN, 2018-2032 (MILES DE USD)
TABLA 119 ASIA-PACÍFICO 751-1000 GRAMOS EN EL MERCADO DE ALIMENTOS CONVENCIONALES LISTOS PARA CONSUMIR, POR REGIÓN, 2018-2032 (MILES DE USD)
TABLA 120 ASIA-PACÍFICO MÁS DE 1000 GRAMOS EN EL MERCADO DE ALIMENTOS CONVENCIONALES LISTOS PARA CONSUMIR, POR REGIÓN, 2018-2032 (MILES DE USD)
TABLA 121 MERCADO DE ALIMENTOS LISTOS PARA CONSUMIR DE ASIA-PACÍFICO, POR TECNOLOGÍA DE ENVASE, 2018-2032 (MILES DE USD)
TABLA 122 RECOGEDORES DE OXÍGENO DE ASIA-PACÍFICO EN EL MERCADO DE ALIMENTOS CONVENCIONALES LISTOS PARA CONSUMIR, POR REGIÓN, 2018-2032 (MILES DE USD)
TABLA 123 CONTROL DE HUMEDAD EN EL MERCADO DE ALIMENTOS CONVENCIONALES LISTOS PARA CONSUMIR DE ASIA-PACÍFICO, POR REGIÓN, 2018-2032 (MILES DE USD)
CUADRO 124 ANTIMICROBIANOS EN EL MERCADO DE ALIMENTOS CONVENCIONALES LISTOS PARA EL CONSUMO DE ASIA-PACÍFICO, POR REGIÓN, 2018-2032 (MILES DE USD)
TABLA 125 INDICADORES DE TEMPERATURA Y TIEMPO DE ASIA-PACÍFICO EN EL MERCADO DE ALIMENTOS CONVENCIONALES LISTOS PARA CONSUMIR, POR REGIÓN, 2018-2032 (MILES DE USD)
TABLA 126 PELÍCULAS COMESTIBLES DE ASIA-PACÍFICO EN EL MERCADO DE ALIMENTOS CONVENCIONALES LISTOS PARA CONSUMIR, POR REGIÓN, 2018-2032 (MILES DE USD)
TABLA 127 MERCADO DE ALIMENTOS LISTOS PARA CONSUMIR DE ASIA-PACÍFICO, POR TIPO DE ALMACENAMIENTO, 2018-2032 (MILES DE USD)
CUADRO 128 MERCADO DE ALIMENTOS CONGELADOS/REFRIGERADOS LISTOS PARA CONSUMIR DE ASIA-PACÍFICO, POR REGIÓN, 2018-2032 (MILES DE USD)
CUADRO 129 MERCADO DE ALIMENTOS LISTOS PARA CONSUMIR, CONSERVADOS EN ALMACENAMIENTO EN ASIA-PACÍFICO, POR REGIÓN, 2018-2032 (MILES DE USD)
TABLA 130 MERCADO DE ALIMENTOS ENLATADOS Y LISTOS PARA CONSUMIR DE ASIA-PACÍFICO, POR REGIÓN, 2018-2032 (MILES DE USD)
TABLA 131 OTROS MERCADOS DE ALIMENTOS LISTOS PARA CONSUMIR EN ASIA-PACÍFICO, POR REGIÓN, 2018-2032 (MILES DE USD)
TABLA 132 MERCADO DE ALIMENTOS LISTOS PARA CONSUMIR DE ASIA-PACÍFICO, POR CANAL DE DISTRIBUCIÓN, 2018-2032 (MILES DE USD)
TABLA 133 MERCADO DE ALIMENTOS LISTOS PARA CONSUMIR EN TIENDAS DE ASIA-PACÍFICO, POR REGIÓN, 2018-2032 (MILES DE USD)
TABLA 134 MERCADO DE ALIMENTOS LISTOS PARA CONSUMIR EN TIENDAS DE ASIA-PACÍFICO, POR TIPO, 2018-2032 (MILES DE USD)
TABLA 135 MERCADO DE ALIMENTOS LISTOS PARA CONSUMIR SIN TIENDAS DE ASIA-PACÍFICO, POR REGIÓN, 2018-2032 (MILES DE USD)
TABLA 136 MERCADO DE ALIMENTOS LISTOS PARA CONSUMIR SIN TIENDAS DE ASIA-PACÍFICO, POR TIPO, 2018-2032 (MILES DE USD)
TABLA 137 MERCADO DE ALIMENTOS LISTOS PARA CONSUMIR DE ASIA-PACÍFICO, POR USUARIO FINAL, 2018-2032 (MILES DE USD)
TABLA 138 SERVICIOS DE LA INDUSTRIA ALIMENTARIA DE ASIA-PACÍFICO EN EL MERCADO DE ALIMENTOS LISTOS PARA CONSUMIR, POR REGIÓN, 2018-2032 (MILES DE USD)
TABLA 139 SERVICIOS DE LA INDUSTRIA ALIMENTARIA DE ASIA-PACÍFICO EN EL MERCADO DE ALIMENTOS LISTOS PARA CONSUMIR, POR TIPO, 2018-2032 (MILES DE USD)
TABLA 140 RESTAURANTES DE ASIA-PACÍFICO EN EL MERCADO DE ALIMENTOS LISTO PARA CONSUMIR, POR TIPO, 2018-2032 (MILES DE USD)
TABLA 141 HOGARES DE ASIA-PACÍFICO EN EL MERCADO DE ALIMENTOS LISTOS PARA CONSUMIR, POR REGIÓN, 2018-2032 (MILES DE USD)
TABLA 142 OTROS MERCADOS DE ALIMENTOS LISTOS PARA CONSUMIR EN ASIA-PACÍFICO, POR REGIÓN, 2018-2032 (MILES DE USD)
TABLA 143 MERCADO DE ALIMENTOS LISTOS PARA CONSUMIR DE ASIA-PACÍFICO, POR PAÍS, 2018-2032 (MILES DE USD)
CUADRO 144 MERCADO DE ALIMENTOS LISTOS PARA CONSUMIR DE ASIA-PACÍFICO, POR PAÍS, 2018-2032 (TONELADAS)
CUADRO 145 MERCADO DE ALIMENTOS LISTOS PARA CONSUMIR DE ASIA-PACÍFICO, POR PAÍS, 2018-2032 (USD/KG)
TABLA 146 MERCADO DE ALIMENTOS LISTOS PARA CONSUMIR DE ASIA-PACÍFICO, POR TIPO DE PRODUCTO, 2018-2032 (MILES DE USD)
TABLA 147 MERCADO DE ALIMENTOS LISTOS PARA CONSUMIR DE ASIA-PACÍFICO, POR TIPO DE PRODUCTO, 2018-2032 (TONELADAS)
CUADRO 148 MERCADO DE ALIMENTOS LISTOS PARA CONSUMIR DE ASIA-PACÍFICO, POR TIPO DE PRODUCTO, 2018-2032 (USD/KG)
TABLA 149 PRODUCTOS CÁRNICOS DE ASIA-PACÍFICO EN EL MERCADO DE ALIMENTOS LISTOS PARA CONSUMIR, POR TIPO, 2018-2032 (MILES DE USD)
TABLA 150 PRODUCTOS CÁRNICOS DE ASIA-PACÍFICO EN EL MERCADO DE ALIMENTOS LISTOS PARA CONSUMIR, POR TIPO, 2018-2032 (TONELADAS)
TABLA 151 PRODUCTOS CÁRNICOS DE ASIA-PACÍFICO EN EL MERCADO DE ALIMENTOS LISTOS PARA CONSUMIR, POR TIPO, 2018-2032 (USD/KG)
CUADRO 152 PRODUCTOS A BASE DE CEREALES DE ASIA-PACÍFICO EN EL MERCADO DE ALIMENTOS LISTOS PARA CONSUMIR, POR TIPO, 2018-2032 (MILES DE USD)
CUADRO 153 PRODUCTOS A BASE DE CEREALES DE ASIA-PACÍFICO EN EL MERCADO DE ALIMENTOS LISTOS PARA CONSUMIR, POR TIPO, 2018-2032 (TONELADAS)
CUADRO 154 PRODUCTOS A BASE DE CEREALES DE ASIA-PACÍFICO EN EL MERCADO DE ALIMENTOS LISTOS PARA CONSUMIR, POR TIPO, 2018-2032 (USD/KG)
TABLA 155 PRODUCTOS LÁCTEOS DE ASIA-PACÍFICO EN EL MERCADO DE ALIMENTOS LISTOS PARA CONSUMIR, POR TIPO, 2018-2032 (MILES DE USD)
TABLA 156 PRODUCTOS LÁCTEOS DE ASIA-PACÍFICO EN EL MERCADO DE ALIMENTOS LISTOS PARA CONSUMIR, POR TIPO, 2018-2032 (TONELADAS)
TABLA 157 PRODUCTOS LÁCTEOS DE ASIA-PACÍFICO EN EL MERCADO DE ALIMENTOS LISTOS PARA CONSUMIR, POR TIPO, 2018-2032 (USD/KG)
TABLA 158 QUESO EN EL MERCADO DE ALIMENTOS LISTOS PARA CONSUMIR DE ASIA-PACÍFICO, POR FORMA, 2018-2032 (MILES DE USD)
TABLA 159 QUESO DE ASIA-PACÍFICO EN EL MERCADO DE ALIMENTOS LISTOS PARA CONSUMIR, POR FORMA, 2018-2032 (TONELADAS)
TABLA 160 QUESO DE ASIA-PACÍFICO EN EL MERCADO DE ALIMENTOS LISTOS PARA CONSUMIR, POR FORMA, 2018-2032 (USD/KG)
TABLA 161 QUESO DE ASIA-PACÍFICO EN EL MERCADO DE ALIMENTOS LISTOS PARA CONSUMIR, POR TIPO, 2018-2032 (MILES DE USD)
TABLA 162 QUESO DE ASIA-PACÍFICO EN EL MERCADO DE ALIMENTOS LISTOS PARA CONSUMIR, POR TIPO, 2018-2032 (TONELADAS)
TABLA 163 QUESO DE ASIA-PACÍFICO EN EL MERCADO DE ALIMENTOS LISTOS PARA CONSUMIR, POR TIPO, 2018-2032 (USD/KG)
TABLA 164 QUESO DE ORIGEN ANIMAL EN EL MERCADO DE ALIMENTOS LISTOS PARA CONSUMIR DE ASIA-PACÍFICO, POR TIPO, 2018-2032 (MILES DE USD)
TABLA 165 QUESO DE ORIGEN VEGETAL EN EL MERCADO DE ALIMENTOS LISTOS PARA CONSUMIR DE ASIA-PACÍFICO, POR TIPO, 2018-2032 (MILES DE USD)
TABLA 166 HELADOS DE ASIA-PACÍFICO EN EL MERCADO DE ALIMENTOS LISTOS PARA CONSUMIR, POR TIPO, 2018-2032 (MILES DE USD)
TABLA 167 HELADOS DE ASIA-PACÍFICO EN EL MERCADO DE ALIMENTOS LISTOS PARA CONSUMIR, POR TIPO, 2018-2032 (TONELADAS)
TABLA 168 HELADOS DE ASIA-PACÍFICO EN EL MERCADO DE ALIMENTOS LISTOS PARA CONSUMIR, POR TIPO, 2018-2032 (USD/KG)
TABLA 169 CUAJADA EN EL MERCADO DE ALIMENTOS LISTOS PARA CONSUMIR DE ASIA-PACÍFICO, POR TIPO, 2018-2032 (MILES DE USD)
TABLA 170 CUAJADA EN EL MERCADO DE ALIMENTOS LISTOS PARA CONSUMIR DE ASIA-PACÍFICO, POR TIPO, 2018-2032 (TONELADAS)
TABLA 171 CUAJADA EN EL MERCADO DE ALIMENTOS LISTOS PARA CONSUMIR DE ASIA-PACÍFICO, POR TIPO, 2018-2032 (USD/KG)
TABLA 172 PANEER EN EL MERCADO DE ALIMENTOS LISTOS PARA CONSUMIR DE ASIA-PACÍFICO, POR TIPO, 2018-2032 (MILES DE USD)
TABLA 173 PANEER DE ASIA-PACÍFICO EN EL MERCADO DE ALIMENTOS LISTOS PARA CONSUMIR, POR TIPO, 2018-2032 (TONELADAS)
TABLA 174 PANEER DE ASIA-PACÍFICO EN EL MERCADO DE ALIMENTOS LISTOS PARA CONSUMIR, POR TIPO, 2018-2032 (USD/KG)
TABLA 175 GHEE EN EL MERCADO DE ALIMENTOS LISTOS PARA CONSUMIR DE ASIA-PACÍFICO, POR FUENTE, 2018-2032 (MILES DE USD)
TABLA 176 GHEE DE ASIA-PACÍFICO EN EL MERCADO DE ALIMENTOS LISTOS PARA CONSUMIR, POR FUENTE, 2018-2032 (TONELADAS)
TABLA 177 GHEE EN EL MERCADO DE ALIMENTOS LISTOS PARA CONSUMIR DE ASIA-PACÍFICO, POR FUENTE, 2018-2032 (USD/KG)
TABLA 178 PRODUCTOS DE PANADERÍA DE ASIA-PACÍFICO EN EL MERCADO DE ALIMENTOS LISTOS PARA CONSUMIR, POR TIPO, 2018-2032 (MILES DE USD)
TABLA 179 PRODUCTOS DE PANADERÍA DE ASIA-PACÍFICO EN EL MERCADO DE ALIMENTOS LISTOS PARA CONSUMIR, POR TIPO, 2018-2032 (TONELADAS)
TABLA 180 PRODUCTOS DE PANADERÍA DE ASIA-PACÍFICO EN EL MERCADO DE ALIMENTOS LISTOS PARA CONSUMIR, POR TIPO, 2018-2032 (USD/KG)
TABLA 181 DULCES SALADOS EN EL MERCADO DE ALIMENTOS LISTOS PARA CONSUMIR DE ASIA-PACÍFICO, POR TIPO, 2018-2032 (MILES DE USD)
TABLA 182 DULCES SALADOS DE ASIA-PACÍFICO EN EL MERCADO DE ALIMENTOS LISTOS PARA CONSUMIR, POR TIPO, 2018-2032 (TONELADAS)
TABLA 183 DULCES SALADOS DE ASIA-PACÍFICO EN EL MERCADO DE ALIMENTOS LISTOS PARA CONSUMIR, POR TIPO, 2018-2032 (USD/KG)
TABLA 184 PRODUCTOS DE CONFITERÍA DE ASIA-PACÍFICO EN EL MERCADO DE ALIMENTOS LISTOS PARA CONSUMIR, POR TIPO, 2018-2032 (MILES DE USD)
TABLA 185 PRODUCTOS DE CONFITERÍA DE ASIA-PACÍFICO EN EL MERCADO DE ALIMENTOS LISTOS PARA CONSUMIR, POR TIPO, 2018-2032 (TONELADAS)
TABLA 186 PRODUCTOS DE CONFITERÍA DE ASIA-PACÍFICO EN EL MERCADO DE ALIMENTOS LISTOS PARA CONSUMIR, POR TIPO, 2018-2032 (USD/KG)
CUADRO 187 PRODUCTOS A BASE DE VEGETALES EN EL MERCADO DE ALIMENTOS LISTOS PARA CONSUMIR DE ASIA-PACÍFICO, POR TIPO, 2018-2032 (MILES DE USD)
CUADRO 188 PRODUCTOS A BASE DE VEGETALES EN EL MERCADO DE ALIMENTOS LISTOS PARA CONSUMIR DE ASIA-PACÍFICO, POR TIPO, 2018-2032 (TONELADAS)
CUADRO 189 PRODUCTOS A BASE DE VEGETALES EN EL MERCADO DE ALIMENTOS LISTOS PARA CONSUMIR DE ASIA-PACÍFICO, POR TIPO, 2018-2032 (USD/KG)
TABLA 190 SOPAS INSTANTÁNEAS EN EL MERCADO DE ALIMENTOS LISTOS PARA CONSUMIR DE ASIA-PACÍFICO, POR TIPO, 2018-2032 (MILES DE USD)
TABLA 191 SOPAS INSTANTÁNEAS EN EL MERCADO DE ALIMENTOS LISTOS PARA CONSUMIR DE ASIA-PACÍFICO, POR TIPO, 2018-2032 (TONELADAS)
TABLA 192 SOPAS INSTANTÁNEAS EN EL MERCADO DE ALIMENTOS LISTOS PARA CONSUMIR DE ASIA-PACÍFICO, POR TIPO, 2018-2032 (USD/KG)
TABLA 193 APERITIVOS SALADOS EN EL MERCADO DE ALIMENTOS LISTOS PARA CONSUMIR DE ASIA-PACÍFICO, POR TIPO, 2018-2032 (MILES DE USD)
TABLA 194 APERITIVOS SALADOS EN EL MERCADO DE ALIMENTOS LISTOS PARA CONSUMIR DE ASIA-PACÍFICO, POR TIPO, 2018-2032 (TONELADAS)
TABLA 195 APERITIVOS SALADOS EN EL MERCADO DE ALIMENTOS LISTOS PARA CONSUMIR DE ASIA-PACÍFICO, POR TIPO, 2018-2032 (USD/KG)
TABLA 196 PAPAS FRITAS EN EL MERCADO DE ALIMENTOS LISTOS PARA CONSUMIR DE ASIA-PACÍFICO, POR TIPO, 2018-2032 (MILES DE USD)
TABLA 197 PATATAS FRITAS EN EL MERCADO DE ALIMENTOS LISTOS PARA CONSUMIR DE ASIA-PACÍFICO, POR TIPO, 2018-2032 (TONELADAS)
TABLA 198 PAPAS FRITAS EN EL MERCADO DE ALIMENTOS LISTOS PARA CONSUMIR DE ASIA-PACÍFICO, POR TIPO, 2018-2032 (USD/KG)
TABLA 199 OBLEAS DE ASIA-PACÍFICO EN EL MERCADO DE ALIMENTOS LISTOS PARA CONSUMIR, POR TIPO, 2018-2032 (MILES DE USD)
TABLA 200 OBLEAS DE ASIA-PACÍFICO EN EL MERCADO DE ALIMENTOS LISTOS PARA CONSUMIR, POR TIPO, 2018-2032 (TONELADAS)
TABLA 201 OBLEAS DE ASIA-PACÍFICO EN EL MERCADO DE ALIMENTOS LISTOS PARA CONSUMIR, POR TIPO, 2018-2032 (USD/KG)
TABLA 202 NÚMEROS DE REFERENCIA DE ASIA-PACÍFICO EN EL MERCADO DE ALIMENTOS LISTOS PARA CONSUMIR, POR TIPO, 2018-2032 (MILES DE USD)
TABLA 203 NÚMEROS DE ALIMENTOS LISTOS PARA CONSUMIR EN ASIA-PACÍFICO, POR TIPO, 2018-2032 (TONELADAS)
TABLA 204 NÚMEROS DE REFERENCIA DE ASIA-PACÍFICO EN EL MERCADO DE ALIMENTOS LISTOS PARA CONSUMIR, POR TIPO, 2018-2032 (USD/KG)
TABLA 205 GALLETAS Y GALLETAS DE ASIA-PACÍFICO EN EL MERCADO DE ALIMENTOS LISTOS PARA CONSUMIR, POR TIPO, 2018-2032 (MILES DE USD)
TABLA 206 GALLETAS Y GALLETAS DE ASIA-PACÍFICO EN EL MERCADO DE ALIMENTOS LISTOS PARA CONSUMIR, POR TIPO, 2018-2032 (TONELADAS)
TABLA 207 GALLETAS Y GALLETAS DE ASIA-PACÍFICO EN EL MERCADO DE ALIMENTOS LISTOS PARA CONSUMIR, POR TIPO, 2018-2032 (USD/KG)
TABLA 208 ALIMENTOS REFRIGERADOS EN EL MERCADO DE ALIMENTOS LISTOS PARA CONSUMIR DE ASIA-PACÍFICO, POR TIPO, 2018-2032 (MILES DE USD)
TABLA 209 ALIMENTOS REFRIGERADOS DE ASIA-PACÍFICO EN EL MERCADO DE ALIMENTOS LISTOS PARA CONSUMIR, POR TIPO, 2018-2032 (TONELADAS)
CUADRO 210 ALIMENTOS REFRIGERADOS EN EL MERCADO DE ALIMENTOS LISTOS PARA CONSUMIR DE ASIA-PACÍFICO, POR TIPO, 2018-2032 (USD/KG)
TABLA 211 SNACKS DE CARNE DE ORIGEN VEGETAL EN EL MERCADO DE ALIMENTOS LISTOS PARA CONSUMIR DE ASIA-PACÍFICO, POR TIPO, 2018-2032 (MILES DE USD)
TABLA 212 APERITIVOS DE CARNE DE ORIGEN VEGETAL EN EL MERCADO DE ALIMENTOS LISTOS PARA CONSUMIR DE ASIA-PACÍFICO, POR TIPO, 2018-2032 (TONELADAS)
TABLA 213 APERITIVOS DE CARNE DE ORIGEN VEGETAL EN EL MERCADO DE ALIMENTOS LISTOS PARA CONSUMIR DE ASIA-PACÍFICO, POR TIPO, 2018-2032 (USD/KG)
TABLA 214 APERITIVOS DE CARNE DE ORIGEN VEGETAL EN EL MERCADO DE ALIMENTOS LISTOS PARA CONSUMIR DE ASIA-PACÍFICO, POR FUENTE, 2018-2032 (MILES DE USD)
TABLA 215 APERITIVOS DE CARNE DE ORIGEN VEGETAL EN EL MERCADO DE ALIMENTOS LISTOS PARA CONSUMIR DE ASIA-PACÍFICO, POR FUENTE, 2018-2032 (TONELADAS)
TABLA 216 APERITIVOS DE CARNE DE ORIGEN VEGETAL EN EL MERCADO DE ALIMENTOS LISTOS PARA CONSUMIR DE ASIA-PACÍFICO, POR FUENTE, 2018-2032 (USD/KG)
TABLA 217 COMIDAS LISTAS PARA COMER EN EL MERCADO DE ALIMENTOS LISTOS PARA COMER DE ASIA-PACÍFICO, POR TIPO, 2018-2032 (MILES DE USD)
TABLA 218 COMIDAS LISTAS PARA CONSUMIR EN EL MERCADO DE ALIMENTOS LISTOS PARA CONSUMIR DE ASIA-PACÍFICO, POR TIPO, 2018-2032 (TONELADAS)
CUADRO 219 COMIDAS LISTAS PARA COMER EN EL MERCADO DE ALIMENTOS LISTOS PARA COMER DE ASIA-PACÍFICO, POR TIPO, 2018-2032 (USD/KG)
TABLA 220 MERCADO DE ALIMENTOS LISTOS PARA CONSUMIR DE ASIA-PACÍFICO, POR CATEGORÍA, 2018-2032 (MILES DE USD)
TABLA 221 MERCADO DE ESPECIALIDADES DE ASIA-PACÍFICO EN ALIMENTOS LISTOS PARA CONSUMIR, POR TIPO, 2018-2032 (MILES DE USD)
TABLA 222 MERCADO DE ALIMENTOS LISTOS PARA CONSUMIR DE ASIA-PACÍFICO, POR TIPO DE ENVASE, 2018-2032 (MILES DE USD)
TABLA 223 BOTELLAS DE ASIA-PACÍFICO EN EL MERCADO DE ALIMENTOS LISTOS PARA CONSUMIR, POR TIPO, 2018-2032 (MILES DE USD)
TABLA 224 MERCADO DE ALIMENTOS LISTOS PARA CONSUMIR DE ASIA-PACÍFICO, POR TAMAÑO DE ENVASE, 2018-2032 (MILES DE USD)
TABLA 225 MERCADO DE ALIMENTOS LISTOS PARA CONSUMIR DE ASIA-PACÍFICO, POR TECNOLOGÍA DE ENVASE, 2018-2032 (MILES DE USD)
TABLA 226 MERCADO DE ALIMENTOS LISTOS PARA CONSUMIR DE ASIA-PACÍFICO, POR TIPO DE ALMACENAMIENTO, 2018-2032 (MILES DE USD)
TABLA 227 MERCADO DE ALIMENTOS LISTOS PARA CONSUMIR DE ASIA-PACÍFICO, POR CANAL DE DISTRIBUCIÓN, 2018-2032 (MILES DE USD)
TABLA 228 MERCADO DE ALIMENTOS LISTOS PARA CONSUMIR EN TIENDAS DE ASIA-PACÍFICO, POR TIPO, 2018-2032 (MILES DE USD)
TABLA 229 MERCADO DE ALIMENTOS LISTOS PARA CONSUMIR SIN TIENDAS DE ASIA-PACÍFICO, POR TIPO, 2018-2032 (MILES DE USD)
TABLA 230 MERCADO DE ALIMENTOS LISTOS PARA CONSUMIR DE ASIA-PACÍFICO, POR USUARIO FINAL, 2018-2032 (MILES DE USD)
TABLA 231 SERVICIOS DE LA INDUSTRIA ALIMENTARIA DE ASIA-PACÍFICO EN EL MERCADO DE ALIMENTOS LISTOS PARA CONSUMIR, POR TIPO, 2018-2032 (MILES DE USD)
TABLA 232 RESTAURANTES DE ASIA-PACÍFICO EN EL MERCADO DE ALIMENTOS LISTO PARA CONSUMIR, POR TIPO, 2018-2032 (MILES DE USD)
TABLA 233 MERCADO DE ALIMENTOS LISTOS PARA CONSUMIR DE CHINA, POR TIPO DE PRODUCTO, 2018-2032 (MILES DE USD)
TABLA 234 MERCADO DE ALIMENTOS LISTOS PARA CONSUMIR DE CHINA, POR TIPO DE PRODUCTO, 2018-2032 (TONELADAS)
TABLA 235 MERCADO DE ALIMENTOS LISTOS PARA CONSUMIR DE CHINA, POR TIPO DE PRODUCTO, 2018-2032 (USD/KG)
TABLA 236 PRODUCTOS CÁRNICOS DE CHINA EN EL MERCADO DE ALIMENTOS LISTOS PARA CONSUMIR, POR TIPO, 2018-2032 (MILES DE USD)
TABLA 237 PRODUCTOS CÁRNICOS DE CHINA EN EL MERCADO DE ALIMENTOS LISTOS PARA CONSUMIR, POR TIPO, 2018-2032 (TONELADAS)
TABLA 238 PRODUCTOS CÁRNICOS DE CHINA EN EL MERCADO DE ALIMENTOS LISTOS PARA CONSUMIR, POR TIPO, 2018-2032 (USD/KG)
TABLA 239 PRODUCTOS A BASE DE CEREALES DE CHINA EN EL MERCADO DE ALIMENTOS LISTOS PARA CONSUMIR, POR TIPO, 2018-2032 (MILES DE USD)
TABLA 240 PRODUCTOS A BASE DE CEREALES DE CHINA EN EL MERCADO DE ALIMENTOS LISTOS PARA CONSUMIR, POR TIPO, 2018-2032 (TONELADAS)
TABLA 241 PRODUCTOS A BASE DE CEREALES DE CHINA EN EL MERCADO DE ALIMENTOS LISTOS PARA CONSUMIR, POR TIPO, 2018-2032 (USD/KG)
TABLA 242 PRODUCTOS LÁCTEOS DE CHINA EN EL MERCADO DE ALIMENTOS LISTOS PARA CONSUMIR, POR TIPO, 2018-2032 (MILES DE USD)
TABLA 243 PRODUCTOS LÁCTEOS DE CHINA EN EL MERCADO DE ALIMENTOS LISTOS PARA CONSUMIR, POR TIPO, 2018-2032 (TONELADAS)
TABLA 244 PRODUCTOS LÁCTEOS DE CHINA EN EL MERCADO DE ALIMENTOS LISTOS PARA CONSUMIR, POR TIPO, 2018-2032 (USD/KG)
TABLA 245 QUESO CHINO EN EL MERCADO DE ALIMENTOS LISTOS PARA CONSUMIR, POR FORMA, 2018-2032 (MILES DE USD)
TABLA 246 QUESO CHINO EN EL MERCADO DE ALIMENTOS LISTOS PARA CONSUMIR, POR FORMA, 2018-2032 (TONELADAS)
TABLA 247 QUESO CHINO EN EL MERCADO DE ALIMENTOS LISTOS PARA CONSUMIR, POR FORMA, 2018-2032 (USD/KG)
TABLA 248 QUESO CHINO EN EL MERCADO DE ALIMENTOS LISTOS PARA CONSUMIR, POR TIPO, 2018-2032 (MILES DE USD)
TABLA 249 QUESO CHINO EN EL MERCADO DE ALIMENTOS LISTOS PARA CONSUMIR, POR TIPO, 2018-2032 (TONELADAS)
TABLA 250 QUESO CHINO EN EL MERCADO DE ALIMENTOS LISTOS PARA CONSUMIR, POR TIPO, 2018-2032 (USD/KG)
TABLA 251 QUESO DE ORIGEN ANIMAL EN EL MERCADO DE ALIMENTOS LISTOS PARA CONSUMIR DE CHINA, POR TIPO, 2018-2032 (MILES DE USD)
TABLA 252 QUESO VEGETAL DE CHINA EN EL MERCADO DE ALIMENTOS LISTOS PARA CONSUMIR, POR TIPO, 2018-2032 (MILES DE USD)
TABLA 253 HELADOS DE CHINA EN EL MERCADO DE ALIMENTOS LISTOS PARA CONSUMIR, POR TIPO, 2018-2032 (MILES DE USD)
TABLA 254 HELADOS DE CHINA EN EL MERCADO DE ALIMENTOS LISTOS PARA CONSUMIR, POR TIPO, 2018-2032 (TONELADAS)
TABLA 255 HELADOS DE CHINA EN EL MERCADO DE ALIMENTOS LISTOS PARA CONSUMIR, POR TIPO, 2018-2032 (USD/KG)
TABLA 256 CUAJADA DE CHINA EN EL MERCADO DE ALIMENTOS LISTOS PARA CONSUMIR, POR TIPO, 2018-2032 (MILES DE USD)
TABLA 257 CUAJADA DE CHINA EN EL MERCADO DE ALIMENTOS LISTOS PARA CONSUMIR, POR TIPO, 2018-2032 (TONELADAS)
TABLA 258 CUAJADA DE CHINA EN EL MERCADO DE ALIMENTOS LISTOS PARA CONSUMIR, POR TIPO, 2018-2032 (USD/KG)
TABLA 259. PRESUPUESTO SOBRE EL PANEER DE CHINA EN EL MERCADO DE ALIMENTOS LISTOS PARA CONSUMIR, POR TIPO, 2018-2032 (MILES DE USD)
TABLA 260. PRESENTACIÓN DE CHINA PANEER EN EL MERCADO DE ALIMENTOS LISTOS PARA CONSUMIR, POR TIPO, 2018-2032 (TONELADAS)
TABLA 261. PRESUPUESTO SOBRE EL PANEER DE CHINA EN EL MERCADO DE ALIMENTOS LISTOS PARA CONSUMIR, POR TIPO, 2018-2032 (USD/KG)
TABLA 262 GHEE DE CHINA EN EL MERCADO DE ALIMENTOS LISTOS PARA CONSUMIR, POR FUENTE, 2018-2032 (MILES DE USD)
TABLA 263 GHEE DE CHINA EN EL MERCADO DE ALIMENTOS LISTOS PARA CONSUMIR, POR FUENTE, 2018-2032 (TONELADAS)
TABLA 264 GHEE DE CHINA EN EL MERCADO DE ALIMENTOS LISTOS PARA CONSUMIR, POR FUENTE, 2018-2032 (USD/KG)
TABLA 265 PRODUCTOS DE PANADERÍA DE CHINA EN EL MERCADO DE ALIMENTOS LISTOS PARA CONSUMIR, POR TIPO, 2018-2032 (MILES DE USD)
TABLA 266 PRODUCTOS DE PANADERÍA DE CHINA EN EL MERCADO DE ALIMENTOS LISTOS PARA CONSUMIR, POR TIPO, 2018-2032 (TONELADAS)
TABLA 267 PRODUCTOS DE PANADERÍA DE CHINA EN EL MERCADO DE ALIMENTOS LISTOS PARA CONSUMIR, POR TIPO, 2018-2032 (USD/KG)
TABLA 268 DULCES SALADOS DE CHINA EN EL MERCADO DE ALIMENTOS LISTOS PARA CONSUMIR, POR TIPO, 2018-2032 (MILES DE USD)
TABLA 269 DULCES SALADOS DE CHINA EN EL MERCADO DE ALIMENTOS LISTOS PARA CONSUMIR, POR TIPO, 2018-2032 (TONELADAS)
TABLA 270 DULCES SALADOS DE CHINA EN EL MERCADO DE ALIMENTOS LISTOS PARA CONSUMIR, POR TIPO, 2018-2032 (USD/KG)
TABLA 271 PRODUCTOS DE CONFITERÍA DE CHINA EN EL MERCADO DE ALIMENTOS LISTOS PARA CONSUMIR, POR TIPO, 2018-2032 (MILES DE USD)
TABLA 272 PRODUCTOS DE CONFITERÍA DE CHINA EN EL MERCADO DE ALIMENTOS LISTOS PARA CONSUMIR, POR TIPO, 2018-2032 (TONELADAS)
TABLA 273 PRODUCTOS DE CONFITERÍA DE CHINA EN EL MERCADO DE ALIMENTOS LISTOS PARA CONSUMIR, POR TIPO, 2018-2032 (USD/KG)
TABLA 274 PRODUCTOS A BASE DE VEGETALES DE CHINA EN EL MERCADO DE ALIMENTOS LISTOS PARA CONSUMIR, POR TIPO, 2018-2032 (MILES DE USD)
TABLA 275 PRODUCTOS A BASE DE VEGETALES DE CHINA EN EL MERCADO DE ALIMENTOS LISTOS PARA CONSUMIR, POR TIPO, 2018-2032 (TONELADAS)
TABLA 276 PRODUCTOS A BASE DE VEGETALES DE CHINA EN EL MERCADO DE ALIMENTOS LISTOS PARA CONSUMIR, POR TIPO, 2018-2032 (USD/KG)
TABLA 277 SOPAS INSTANTÁNEAS DE CHINA EN EL MERCADO DE ALIMENTOS LISTOS PARA CONSUMIR, POR TIPO, 2018-2032 (MILES DE USD)
TABLA 278 SOPAS INSTANTÁNEAS DE CHINA EN EL MERCADO DE ALIMENTOS LISTOS PARA CONSUMIR, POR TIPO, 2018-2032 (TONELADAS)
TABLA 279 SOPAS INSTANTÁNEAS DE CHINA EN EL MERCADO DE ALIMENTOS LISTOS PARA CONSUMIR, POR TIPO, 2018-2032 (USD/KG)
TABLA 280 APERITIVOS SALADOS DE CHINA EN EL MERCADO DE ALIMENTOS LISTOS PARA CONSUMIR, POR TIPO, 2018-2032 (MILES DE USD)
TABLA 281 APERITIVOS SALADOS DE CHINA EN EL MERCADO DE ALIMENTOS LISTOS PARA CONSUMIR, POR TIPO, 2018-2032 (TONELADAS)
TABLA 282 APERITIVOS SALADOS DE CHINA EN EL MERCADO DE ALIMENTOS LISTOS PARA CONSUMIR, POR TIPO, 2018-2032 (USD/KG)
TABLA 283 PAPAS FRITAS DE CHINA EN EL MERCADO DE ALIMENTOS LISTOS PARA CONSUMIR, POR TIPO, 2018-2032 (MILES DE USD)
TABLA 284 PAPAS FRITAS DE CHINA EN EL MERCADO DE ALIMENTOS LISTOS PARA CONSUMIR, POR TIPO, 2018-2032 (TONELADAS)
TABLA 285 PAPAS FRITAS DE CHINA EN EL MERCADO DE ALIMENTOS LISTOS PARA CONSUMIR, POR TIPO, 2018-2032 (USD/KG)
TABLA 286 OBLEAS DE CHINA EN EL MERCADO DE ALIMENTOS LISTOS PARA CONSUMIR, POR TIPO, 2018-2032 (MILES DE USD)
TABLA 287 OBLEAS DE CHINA EN EL MERCADO DE ALIMENTOS LISTOS PARA CONSUMIR, POR TIPO, 2018-2032 (TONELADAS)
TABLA 288 OBLEAS DE CHINA EN EL MERCADO DE ALIMENTOS LISTOS PARA CONSUMIR, POR TIPO, 2018-2032 (USD/KG)
TABLA 289 NÚMEROS DE REFERENCIA DE CHINA EN EL MERCADO DE ALIMENTOS LISTOS PARA CONSUMIR, POR TIPO, 2018-2032 (MILES DE USD)
TABLA 290 NÚMEROS DE CHINA EN EL MERCADO DE ALIMENTOS LISTOS PARA CONSUMIR, POR TIPO, 2018-2032 (TONELADAS)
TABLA 291 NÚMEROS DE CHINA EN EL MERCADO DE ALIMENTOS LISTOS PARA CONSUMIR, POR TIPO, 2018-2032 (USD/KG)
TABLA 292 GALLETAS Y GALLETAS DE CHINA EN EL MERCADO DE ALIMENTOS LISTOS PARA CONSUMIR, POR TIPO, 2018-2032 (MILES DE USD)
TABLA 293 GALLETAS Y GALLETAS DE CHINA EN EL MERCADO DE ALIMENTOS LISTOS PARA CONSUMIR, POR TIPO, 2018-2032 (TONELADAS)
TABLA 294 GALLETAS Y GALLETAS DE CHINA EN EL MERCADO DE ALIMENTOS LISTOS PARA CONSUMIR, POR TIPO, 2018-2032 (USD/KG)
TABLA 295 ALIMENTOS REFRIGERADOS DE CHINA EN EL MERCADO DE ALIMENTOS LISTOS PARA CONSUMIR, POR TIPO, 2018-2032 (MILES DE USD)
TABLA 296 ALIMENTOS REFRIGERADOS DE CHINA EN EL MERCADO DE ALIMENTOS LISTOS PARA CONSUMIR, POR TIPO, 2018-2032 (TONELADAS)
TABLA 297 ALIMENTOS REFRIGERADOS DE CHINA EN EL MERCADO DE ALIMENTOS LISTOS PARA CONSUMIR, POR TIPO, 2018-2032 (USD/KG)
TABLA 298 SNACKS DE CARNE DE ORIGEN VEGETAL DE CHINA EN EL MERCADO DE ALIMENTOS LISTOS PARA CONSUMIR, POR TIPO, 2018-2032 (MILES DE USD)
TABLA 299 BOCADILLOS DE CARNE DE ORIGEN VEGETAL DE CHINA EN EL MERCADO DE ALIMENTOS LISTOS PARA CONSUMIR, POR TIPO, 2018-2032 (TONELADAS)
TABLA 300 SNACKS DE CARNE DE ORIGEN VEGETAL DE CHINA EN EL MERCADO DE ALIMENTOS LISTOS PARA CONSUMIR, POR TIPO, 2018-2032 (USD/KG)
TABLA 301 SNACKS DE CARNE DE ORIGEN VEGETAL DE CHINA EN EL MERCADO DE ALIMENTOS LISTOS PARA CONSUMIR, POR FUENTE, 2018-2032 (MILES DE USD)
TABLA 302 APERITIVOS DE CARNE DE ORIGEN VEGETAL DE CHINA EN EL MERCADO DE ALIMENTOS LISTOS PARA CONSUMIR, POR FUENTE, 2018-2032 (TONELADAS)
TABLA 303 SNACKS DE CARNE DE ORIGEN VEGETAL DE CHINA EN EL MERCADO DE ALIMENTOS LISTOS PARA CONSUMIR, POR FUENTE, 2018-2032 (USD/KG)
TABLA 304 COMIDAS LISTAS PARA COMER EN EL MERCADO DE ALIMENTOS LISTOS PARA COMER DE CHINA, POR TIPO, 2018-2032 (MILES DE USD)
TABLA 305 COMIDAS LISTAS PARA COMER EN EL MERCADO DE ALIMENTOS LISTOS PARA COMER DE CHINA, POR TIPO, 2018-2032 (TONELADAS)
TABLA 306 COMIDAS LISTAS PARA COMER EN EL MERCADO DE ALIMENTOS LISTOS PARA COMER DE CHINA, POR TIPO, 2018-2032 (USD/KG)
TABLA 307 MERCADO DE ALIMENTOS LISTOS PARA CONSUMIR DE CHINA, POR CATEGORÍA, 2018-2032 (MILES DE USD)
TABLA 308 ESPECIALIDADES DE CHINA EN EL MERCADO DE ALIMENTOS LISTOS PARA CONSUMIR, POR TIPO, 2018-2032 (MILES DE USD)
TABLA 309 MERCADO DE ALIMENTOS LISTOS PARA CONSUMIR EN CHINA, POR TIPO DE ENVASE, 2018-2032 (MILES DE USD)
TABLA 310 BOTELLAS DE PORCELANA EN EL MERCADO DE ALIMENTOS LISTOS PARA CONSUMIR, POR TIPO, 2018-2032 (MILES DE USD)
TABLA 311 MERCADO DE ALIMENTOS LISTOS PARA CONSUMIR EN CHINA, POR TAMAÑO DE ENVASE, 2018-2032 (MILES DE USD)
TABLA 312 MERCADO DE ALIMENTOS LISTOS PARA CONSUMIR EN CHINA, POR TECNOLOGÍA DE ENVASADO, 2018-2032 (MILES DE USD)
TABLA 313 MERCADO DE ALIMENTOS LISTOS PARA CONSUMIR DE CHINA, POR TIPO DE ALMACENAMIENTO, 2018-2032 (MILES DE USD)
TABLA 314 MERCADO DE ALIMENTOS LISTOS PARA CONSUMIR EN CHINA, POR CANAL DE DISTRIBUCIÓN, 2018-2032 (MILES DE USD)
TABLA 315 MERCADO DE ALIMENTOS LISTOS PARA COMER CON TIENDAS DE CHINA, POR TIPO, 2018-2032 (MILES DE USD)
TABLA 316 MERCADO DE ALIMENTOS LISTOS PARA CONSUMIR SIN TIENDAS DE CHINA, POR TIPO, 2018-2032 (MILES DE USD)
TABLA 317 MERCADO DE ALIMENTOS LISTOS PARA CONSUMIR EN CHINA, POR USUARIO FINAL, 2018-2032 (MILES DE USD)
TABLA 318 SERVICIOS DE LA INDUSTRIA ALIMENTARIA DE CHINA EN EL MERCADO DE ALIMENTOS LISTOS PARA CONSUMIR, POR TIPO, 2018-2032 (MILES DE USD)
TABLA 319 RESTAURANTES DE CHINA EN EL MERCADO DE COMIDA LISTA PARA CONSUMIR, POR TIPO, 2018-2032 (MILES DE USD)
TABLA 320 MERCADO DE ALIMENTOS LISTOS PARA CONSUMIR EN LA INDIA, POR TIPO DE PRODUCTO, 2018-2032 (MILES DE USD)
TABLA 321 MERCADO DE ALIMENTOS LISTOS PARA CONSUMIR EN LA INDIA, POR TIPO DE PRODUCTO, 2018-2032 (TONELADAS)
TABLA 322 MERCADO DE ALIMENTOS LISTOS PARA CONSUMIR EN LA INDIA, POR TIPO DE PRODUCTO, 2018-2032 (USD/KG)
TABLA 323 PRODUCTOS CÁRNICOS EN EL MERCADO DE ALIMENTOS LISTOS PARA CONSUMIR DE LA INDIA, POR TIPO, 2018-2032 (MILES DE USD)
TABLA 324 PRODUCTOS CÁRNICOS EN EL MERCADO DE ALIMENTOS LISTOS PARA CONSUMIR DE LA INDIA, POR TIPO, 2018-2032 (TONELADAS)
TABLA 325 PRODUCTOS CÁRNICOS EN EL MERCADO DE ALIMENTOS LISTOS PARA CONSUMIR DE LA INDIA, POR TIPO, 2018-2032 (USD/KG)
TABLA 326 PRODUCTOS A BASE DE CEREALES EN EL MERCADO DE ALIMENTOS LISTOS PARA CONSUMIR DE LA INDIA, POR TIPO, 2018-2032 (MILES DE USD)
TABLA 327 PRODUCTOS A BASE DE CEREALES EN EL MERCADO DE ALIMENTOS LISTOS PARA CONSUMIR DE LA INDIA, POR TIPO, 2018-2032 (TONELADAS)
TABLA 328 PRODUCTOS A BASE DE CEREALES EN EL MERCADO DE ALIMENTOS LISTOS PARA CONSUMIR DE LA INDIA, POR TIPO, 2018-2032 (USD/KG)
TABLA 329 PRODUCTOS LÁCTEOS EN EL MERCADO DE ALIMENTOS LISTOS PARA CONSUMIR DE LA INDIA, POR TIPO, 2018-2032 (MILES DE USD)
TABLA 330 PRODUCTOS LÁCTEOS EN EL MERCADO DE ALIMENTOS LISTOS PARA CONSUMIR DE LA INDIA, POR TIPO, 2018-2032 (TONELADAS)
TABLA 331 PRODUCTOS LÁCTEOS EN EL MERCADO DE ALIMENTOS LISTOS PARA CONSUMIR DE LA INDIA, POR TIPO, 2018-2032 (USD/KG)
TABLA 332 QUESO EN EL MERCADO DE ALIMENTOS LISTOS PARA CONSUMIR DE LA INDIA, POR FORMA, 2018-2032 (MILES DE USD)
TABLA 333 QUESO DE LA INDIA EN EL MERCADO DE ALIMENTOS LISTOS PARA CONSUMIR, POR FORMA, 2018-2032 (TONELADAS)
TABLA 334 QUESO EN EL MERCADO DE ALIMENTOS LISTOS PARA CONSUMIR DE LA INDIA, POR FORMA, 2018-2032 (USD/KG)
TABLA 335 QUESO DE LA INDIA EN EL MERCADO DE ALIMENTOS LISTOS PARA CONSUMIR, POR TIPO, 2018-2032 (MILES DE USD)
TABLA 336 QUESO DE LA INDIA EN EL MERCADO DE ALIMENTOS LISTOS PARA CONSUMIR, POR TIPO, 2018-2032 (TONELADAS)
TABLA 337 QUESO EN EL MERCADO DE ALIMENTOS LISTOS PARA CONSUMIR DE LA INDIA, POR TIPO, 2018-2032 (USD/KG)
TABLA 338 QUESO DE ORIGEN ANIMAL EN EL MERCADO DE ALIMENTOS LISTOS PARA CONSUMIR DE LA INDIA, POR TIPO, 2018-2032 (MILES DE USD)
TABLA 339 QUESO VEGETAL EN EL MERCADO DE ALIMENTOS LISTOS PARA CONSUMIR DE LA INDIA, POR TIPO, 2018-2032 (MILES DE USD)
TABLA 340 HELADOS EN EL MERCADO DE ALIMENTOS LISTOS PARA CONSUMIR DE INDIA, POR TIPO, 2018-2032 (MILES DE USD)
TABLA 341 HELADOS EN EL MERCADO DE ALIMENTOS LISTOS PARA CONSUMIR DE LA INDIA, POR TIPO, 2018-2032 (TONELADAS)
TABLA 342 HELADOS EN EL MERCADO DE ALIMENTOS LISTOS PARA CONSUMIR DE LA INDIA, POR TIPO, 2018-2032 (USD/KG)
TABLA 343 CUAJADA EN EL MERCADO DE ALIMENTOS LISTOS PARA CONSUMIR DE INDIA, POR TIPO, 2018-2032 (MILES DE USD)
TABLA 344 CUAJADA EN EL MERCADO DE ALIMENTOS LISTOS PARA CONSUMIR DE LA INDIA, POR TIPO, 2018-2032 (TONELADAS)
TABLA 345 CUAJADA EN EL MERCADO DE ALIMENTOS LISTOS PARA CONSUMIR DE INDIA, POR TIPO, 2018-2032 (USD/KG)
TABLA 346 PANEER EN EL MERCADO DE ALIMENTOS LISTOS PARA CONSUMIR DE INDIA, POR TIPO, 2018-2032 (MILES DE USD)
TABLA 347. PANEER EN EL MERCADO DE ALIMENTOS LISTOS PARA CONSUMIR DE LA INDIA, POR TIPO, 2018-2032 (TONELADAS)
TABLA 348. PANEER EN EL MERCADO DE ALIMENTOS LISTOS PARA CONSUMIR DE LA INDIA, POR TIPO, 2018-2032 (USD/KG)
TABLA 349 GHEE EN EL MERCADO DE ALIMENTOS LISTOS PARA CONSUMIR DE LA INDIA, POR FUENTE, 2018-2032 (MILES DE USD)
TABLA 350. Ghee en el mercado de alimentos listos para consumir en India, por fuente, 2018-2032 (toneladas)
TABLA 351 GHEE EN EL MERCADO DE ALIMENTOS LISTOS PARA CONSUMIR DE LA INDIA, POR FUENTE, 2018-2032 (USD/KG)
TABLA 352 PRODUCTOS DE PANADERÍA EN EL MERCADO DE ALIMENTOS LISTOS PARA CONSUMIR DE LA INDIA, POR TIPO, 2018-2032 (MILES DE USD)
TABLA 353 PRODUCTOS DE PANADERÍA EN EL MERCADO DE ALIMENTOS LISTOS PARA CONSUMIR DE LA INDIA, POR TIPO, 2018-2032 (TONELADAS)
TABLA 354 PRODUCTOS DE PANADERÍA EN EL MERCADO DE ALIMENTOS LISTOS PARA CONSUMIR DE LA INDIA, POR TIPO, 2018-2032 (USD/KG)
TABLA 355 INDIA: DULCES SALADOS EN EL MERCADO DE ALIMENTOS LISTOS PARA CONSUMIR, POR TIPO, 2018-2032 (MILES DE USD)
TABLA 356 INDIA: DULCES SALADOS EN EL MERCADO DE ALIMENTOS LISTOS PARA CONSUMIR, POR TIPO, 2018-2032 (TONELADAS)
TABLA 357 INDIA: DULCES SALADOS EN EL MERCADO DE ALIMENTOS LISTOS PARA CONSUMIR, POR TIPO, 2018-2032 (USD/KG)
TABLA 358 PRODUCTOS DE CONFITERÍA EN EL MERCADO DE ALIMENTOS LISTOS PARA CONSUMIR DE LA INDIA, POR TIPO, 2018-2032 (MILES DE USD)
TABLA 359 PRODUCTOS DE CONFITERÍA EN EL MERCADO DE ALIMENTOS LISTOS PARA CONSUMIR DE LA INDIA, POR TIPO, 2018-2032 (TONELADAS)
TABLA 360 PRODUCTOS DE CONFITERÍA EN EL MERCADO DE ALIMENTOS LISTOS PARA CONSUMIR DE LA INDIA, POR TIPO, 2018-2032 (USD/KG)
TABLA 361 PRODUCTOS A BASE DE VEGETALES EN EL MERCADO DE ALIMENTOS LISTOS PARA CONSUMIR DE LA INDIA, POR TIPO, 2018-2032 (MILES DE USD)
TABLA 362 PRODUCTOS A BASE DE VEGETALES EN EL MERCADO DE ALIMENTOS LISTOS PARA CONSUMIR DE LA INDIA, POR TIPO, 2018-2032 (TONELADAS)
TABLA 363 PRODUCTOS A BASE DE VEGETALES EN EL MERCADO DE ALIMENTOS LISTOS PARA CONSUMIR DE LA INDIA, POR TIPO, 2018-2032 (USD/KG)
TABLA 364 SOPAS INSTANTÁNEAS EN EL MERCADO DE ALIMENTOS LISTOS PARA CONSUMIR DE LA INDIA, POR TIPO, 2018-2032 (MILES DE USD)
TABLA 365 SOPAS INSTANTÁNEAS EN EL MERCADO DE ALIMENTOS LISTOS PARA CONSUMIR, POR TIPO, 2018-2032 (TONELADAS)
TABLA 366 SOPAS INSTANTÁNEAS EN EL MERCADO DE ALIMENTOS LISTOS PARA CONSUMIR DE LA INDIA, POR TIPO, 2018-2032 (USD/KG)
TABLA 367 APERITIVOS SALADOS EN EL MERCADO DE ALIMENTOS LISTOS PARA CONSUMIR DE LA INDIA, POR TIPO, 2018-2032 (MILES DE USD)
TABLA 368 APERITIVOS SALADOS EN EL MERCADO DE ALIMENTOS LISTOS PARA CONSUMIR DE LA INDIA, POR TIPO, 2018-2032 (TONELADAS)
TABLA 369 APERITIVOS SALADOS EN EL MERCADO DE ALIMENTOS LISTOS PARA CONSUMIR DE LA INDIA, POR TIPO, 2018-2032 (USD/KG)
TABLA 370 PATATAS FRITAS EN EL MERCADO DE ALIMENTOS LISTOS PARA CONSUMIR DE LA INDIA, POR TIPO, 2018-2032 (MILES DE USD)
TABLA 371 PATATAS FRITAS EN EL MERCADO DE ALIMENTOS LISTOS PARA CONSUMIR DE LA INDIA, POR TIPO, 2018-2032 (TONELADAS)
TABLA 372 PATATAS FRITAS EN EL MERCADO DE ALIMENTOS LISTOS PARA CONSUMIR DE LA INDIA, POR TIPO, 2018-2032 (USD/KG)
TABLA 373 OBLEAS EN EL MERCADO DE ALIMENTOS LISTOS PARA CONSUMIR DE LA INDIA, POR TIPO, 2018-2032 (MILES DE USD)
TABLA 374 OBLEAS EN EL MERCADO DE ALIMENTOS LISTOS PARA CONSUMIR DE LA INDIA, POR TIPO, 2018-2032 (TONELADAS)
TABLA 375 OBLEAS EN EL MERCADO DE ALIMENTOS LISTOS PARA CONSUMIR DE LA INDIA, POR TIPO, 2018-2032 (USD/KG)
TABLA 376 NÚMEROS DE LA INDIA EN EL MERCADO DE ALIMENTOS LISTOS PARA CONSUMIR, POR TIPO, 2018-2032 (MILES DE USD)
TABLA 377 NÚMEROS DE ALIMENTOS LISTOS PARA CONSUMIR EN LA INDIA, POR TIPO, 2018-2032 (TONELADAS)
TABLA 378 NAMKEENS EN EL MERCADO DE ALIMENTOS LISTOS PARA CONSUMIR DE LA INDIA, POR TIPO, 2018-2032 (USD/KG)
TABLA 379 GALLETAS Y GALLETAS EN EL MERCADO DE ALIMENTOS LISTOS PARA CONSUMIR DE LA INDIA, POR TIPO, 2018-2032 (MILES DE USD)
TABLA 380 GALLETAS Y GALLETAS DE LA INDIA EN EL MERCADO DE ALIMENTOS LISTOS PARA CONSUMIR, POR TIPO, 2018-2032 (TONELADAS)
TABLA 381 GALLETAS Y GALLETAS EN EL MERCADO DE ALIMENTOS LISTOS PARA CONSUMIR DE LA INDIA, POR TIPO, 2018-2032 (USD/KG)
TABLA 382 ALIMENTOS REFRIGERADOS EN EL MERCADO DE ALIMENTOS LISTOS PARA CONSUMIR DE LA INDIA, POR TIPO, 2018-2032 (MILES DE USD)
TABLA 383 ALIMENTOS REFRIGERADOS EN EL MERCADO DE ALIMENTOS LISTOS PARA CONSUMIR DE LA INDIA, POR TIPO, 2018-2032 (TONELADAS)
TABLA 384 ALIMENTOS REFRIGERADOS EN EL MERCADO DE ALIMENTOS LISTOS PARA CONSUMIR DE LA INDIA, POR TIPO, 2018-2032 (USD/KG)
TABLA 385 SNACKS DE CARNE DE ORIGEN VEGETAL EN EL MERCADO DE ALIMENTOS LISTOS PARA CONSUMIR DE LA INDIA, POR TIPO, 2018-2032 (MILES DE USD)
TABLA 386 SNACKS DE CARNE DE ORIGEN VEGETAL EN EL MERCADO DE ALIMENTOS LISTOS PARA CONSUMIR DE LA INDIA, POR TIPO, 2018-2032 (TONELADAS)
TABLA 387 SNACKS DE CARNE DE ORIGEN VEGETAL EN EL MERCADO DE ALIMENTOS LISTOS PARA CONSUMIR DE LA INDIA, POR TIPO, 2018-2032 (USD/KG)
TABLA 388 SNACKS DE CARNE DE ORIGEN VEGETAL EN EL MERCADO DE ALIMENTOS LISTOS PARA CONSUMIR DE LA INDIA, POR FUENTE, 2018-2032 (MILES DE USD)
TABLA 389 SNACKS DE CARNE DE ORIGEN VEGETAL EN EL MERCADO DE ALIMENTOS LISTOS PARA CONSUMIR DE LA INDIA, POR FUENTE, 2018-2032 (TONELADAS)
TABLA 390 SNACKS DE CARNE DE ORIGEN VEGETAL EN EL MERCADO DE ALIMENTOS LISTOS PARA CONSUMIR DE LA INDIA, POR FUENTE, 2018-2032 (USD/KG)
TABLA 391 COMIDAS LISTAS PARA COMER EN EL MERCADO DE ALIMENTOS LISTOS PARA COMER DE LA INDIA, POR TIPO, 2018-2032 (MILES DE USD)
TABLA 392 COMIDAS LISTAS PARA CONSUMIR EN EL MERCADO DE ALIMENTOS LISTOS PARA CONSUMIR DE LA INDIA, POR TIPO, 2018-2032 (TONELADAS)
TABLA 393 COMIDAS LISTAS PARA CONSUMIR EN EL MERCADO DE ALIMENTOS LISTOS PARA CONSUMIR DE LA INDIA, POR TIPO, 2018-2032 (USD/KG)
TABLA 394 MERCADO DE ALIMENTOS LISTOS PARA CONSUMIR EN LA INDIA, POR CATEGORÍA, 2018-2032 (MILES DE USD)
TABLA 395 MERCADO DE ESPECIALIDADES DE ALIMENTOS LISTOS PARA CONSUMIR EN INDIA, POR TIPO, 2018-2032 (MILES DE USD)
TABLA 396 MERCADO DE ALIMENTOS LISTOS PARA CONSUMIR EN LA INDIA, POR TIPO DE ENVASE, 2018-2032 (MILES DE USD)
TABLA 397 BOTELLAS EN EL MERCADO DE ALIMENTOS LISTOS PARA CONSUMIR DE LA INDIA, POR TIPO, 2018-2032 (MILES DE USD)
TABLA 398 MERCADO DE ALIMENTOS LISTOS PARA CONSUMIR EN LA INDIA, POR TAMAÑO DE ENVASE, 2018-2032 (MILES DE USD)
TABLA 399 MERCADO DE ALIMENTOS LISTOS PARA CONSUMIR EN LA INDIA, POR TECNOLOGÍA DE ENVASADO, 2018-2032 (MILES DE USD)
TABLA 400 MERCADO DE ALIMENTOS LISTOS PARA CONSUMIR EN LA INDIA, POR TIPO DE ALMACENAMIENTO, 2018-2032 (MILES DE USD)
TABLA 401 MERCADO DE ALIMENTOS LISTOS PARA CONSUMIR EN LA INDIA, POR CANAL DE DISTRIBUCIÓN, 2018-2032 (MILES DE USD)
TABLA 402 MERCADO DE ALIMENTOS LISTOS PARA CONSUMIR EN TIENDAS DE INDIA, POR TIPO, 2018-2032 (MILES DE USD)
TABLA 403 MERCADO DE ALIMENTOS LISTOS PARA CONSUMIR SIN TIENDAS EN INDIA, POR TIPO, 2018-2032 (MILES DE USD)
TABLA 404 MERCADO DE ALIMENTOS LISTOS PARA CONSUMIR EN LA INDIA, POR USUARIO FINAL, 2018-2032 (MILES DE USD)
TABLA 405 SERVICIOS DE LA INDUSTRIA ALIMENTARIA DE LA INDIA EN EL MERCADO DE ALIMENTOS LISTOS PARA CONSUMIR, POR TIPO, 2018-2032 (MILES DE USD)
TABLA 406 RESTAURANTES DE LA INDIA EN EL MERCADO DE ALIMENTOS LISTA PARA COMER, POR TIPO, 2018-2032 (MILES DE USD)
TABLA 407 MERCADO DE ALIMENTOS LISTOS PARA CONSUMIR EN JAPÓN, POR TIPO DE PRODUCTO, 2018-2032 (MILES DE USD)
TABLA 408 MERCADO DE ALIMENTOS LISTOS PARA CONSUMIR EN JAPÓN, POR TIPO DE PRODUCTO, 2018-2032 (TONELADAS)
TABLA 409 MERCADO DE ALIMENTOS LISTOS PARA CONSUMIR DE JAPÓN, POR TIPO DE PRODUCTO, 2018-2032 (USD/KG)
TABLA 410 PRODUCTOS CÁRNICOS DE JAPÓN EN EL MERCADO DE ALIMENTOS LISTOS PARA CONSUMIR, POR TIPO, 2018-2032 (MILES DE USD)
TABLA 411 PRODUCTOS CÁRNICOS DE JAPÓN EN EL MERCADO DE ALIMENTOS LISTOS PARA CONSUMIR, POR TIPO, 2018-2032 (TONELADAS)
TABLA 412 PRODUCTOS CÁRNICOS DE JAPÓN EN EL MERCADO DE ALIMENTOS LISTOS PARA CONSUMIR, POR TIPO, 2018-2032 (USD/KG)
TABLA 413 PRODUCTOS A BASE DE CEREALES DE JAPÓN EN EL MERCADO DE ALIMENTOS LISTOS PARA CONSUMIR, POR TIPO, 2018-2032 (MILES DE USD)
TABLA 414 PRODUCTOS A BASE DE CEREALES DE JAPÓN EN EL MERCADO DE ALIMENTOS LISTOS PARA CONSUMIR, POR TIPO, 2018-2032 (TONELADAS)
TABLA 415 PRODUCTOS A BASE DE CEREALES DE JAPÓN EN EL MERCADO DE ALIMENTOS LISTOS PARA CONSUMIR, POR TIPO, 2018-2032 (USD/KG)
TABLA 416 PRODUCTOS LÁCTEOS DE JAPÓN EN EL MERCADO DE ALIMENTOS LISTOS PARA CONSUMIR, POR TIPO, 2018-2032 (MILES DE USD)
TABLA 417 PRODUCTOS LÁCTEOS DE JAPÓN EN EL MERCADO DE ALIMENTOS LISTOS PARA CONSUMIR, POR TIPO, 2018-2032 (TONELADAS)
TABLA 418 PRODUCTOS LÁCTEOS DE JAPÓN EN EL MERCADO DE ALIMENTOS LISTOS PARA CONSUMIR, POR TIPO, 2018-2032 (USD/KG)
TABLA 419 QUESO JAPONÉS EN EL MERCADO DE ALIMENTOS LISTOS PARA CONSUMIR, POR FORMA, 2018-2032 (MILES DE USD)
TABLA 420 QUESO JAPONÉS EN EL MERCADO DE ALIMENTOS LISTOS PARA CONSUMIR, POR FORMA, 2018-2032 (TONELADAS)
TABLA 421 QUESO JAPONÉS EN EL MERCADO DE ALIMENTOS LISTOS PARA CONSUMIR, POR FORMA, 2018-2032 (USD/KG)
TABLA 422 QUESO JAPONÉS EN EL MERCADO DE ALIMENTOS LISTOS PARA CONSUMIR, POR TIPO, 2018-2032 (MILES DE USD)
TABLA 423 QUESO JAPONÉS EN EL MERCADO DE ALIMENTOS LISTOS PARA CONSUMIR, POR TIPO, 2018-2032 (TONELADAS)
TABLA 424 QUESO JAPONÉS EN EL MERCADO DE ALIMENTOS LISTOS PARA CONSUMIR, POR TIPO, 2018-2032 (USD/KG)
TABLA 425 QUESO DE ORIGEN ANIMAL EN EL MERCADO DE ALIMENTOS LISTOS PARA CONSUMIR DE JAPÓN, POR TIPO, 2018-2032 (MILES DE USD)
TABLA 426 QUESO VEGETAL DE JAPÓN EN EL MERCADO DE ALIMENTOS LISTOS PARA CONSUMIR, POR TIPO, 2018-2032 (MILES DE USD)
TABLA 427 HELADOS DE JAPÓN EN EL MERCADO DE ALIMENTOS LISTOS PARA CONSUMIR, POR TIPO, 2018-2032 (MILES DE USD)
TABLA 428 HELADOS DE JAPÓN EN EL MERCADO DE ALIMENTOS LISTOS PARA CONSUMIR, POR TIPO, 2018-2032 (TONELADAS)
TABLA 429 HELADOS DE JAPÓN EN EL MERCADO DE ALIMENTOS LISTOS PARA CONSUMIR, POR TIPO, 2018-2032 (USD/KG)
TABLA 430 CUAJADA JAPONESA EN EL MERCADO DE ALIMENTOS LISTOS PARA CONSUMIR, POR TIPO, 2018-2032 (MILES DE USD)
TABLA 431 CUAJADA JAPONESA EN EL MERCADO DE ALIMENTOS LISTOS PARA CONSUMIR, POR TIPO, 2018-2032 (TONELADAS)
TABLA 432 CUAJADA JAPONESA EN EL MERCADO DE ALIMENTOS LISTOS PARA CONSUMIR, POR TIPO, 2018-2032 (USD/KG)
TABLA 433 PANEER DE JAPÓN EN EL MERCADO DE ALIMENTOS LISTOS PARA CONSUMIR, POR TIPO, 2018-2032 (MILES DE USD)
TABLA 434 PANEER DE JAPÓN EN EL MERCADO DE ALIMENTOS LISTOS PARA CONSUMIR, POR TIPO, 2018-2032 (TONELADAS)
TABLA 435 PANEER DE JAPÓN EN EL MERCADO DE ALIMENTOS LISTOS PARA CONSUMIR, POR TIPO, 2018-2032 (USD/KG)
TABLA 436 GHEE EN EL MERCADO DE ALIMENTOS LISTOS PARA CONSUMIR DE JAPÓN, POR FUENTE, 2018-2032 (MILES DE USD)
TABLA 437 GHEE DE JAPÓN EN EL MERCADO DE ALIMENTOS LISTOS PARA CONSUMIR, POR FUENTE, 2018-2032 (TONELADAS)
TABLA 438 GHEE DE JAPÓN EN EL MERCADO DE ALIMENTOS LISTOS PARA CONSUMIR, POR FUENTE, 2018-2032 (USD/KG)
TABLA 439 PRODUCTOS DE PANADERÍA EN EL MERCADO DE ALIMENTOS LISTOS PARA CONSUMIR DE JAPÓN, POR TIPO, 2018-2032 (MILES DE USD)
TABLA 440 PRODUCTOS DE PANADERÍA EN EL MERCADO DE ALIMENTOS LISTOS PARA CONSUMIR DE JAPÓN, POR TIPO, 2018-2032 (TONELADAS)
TABLA 441 PRODUCTOS DE PANADERÍA EN EL MERCADO DE ALIMENTOS LISTOS PARA CONSUMIR DE JAPÓN, POR TIPO, 2018-2032 (USD/KG)
TABLA 442 DULCES SALADOS DE JAPÓN EN EL MERCADO DE ALIMENTOS LISTOS PARA CONSUMIR, POR TIPO, 2018-2032 (MILES DE USD)
TABLA 443 DULCES SALADOS DE JAPÓN EN EL MERCADO DE ALIMENTOS LISTOS PARA CONSUMIR, POR TIPO, 2018-2032 (TONELADAS)
TABLA 444 DULCES SALADOS DE JAPÓN EN EL MERCADO DE ALIMENTOS LISTOS PARA CONSUMIR, POR TIPO, 2018-2032 (USD/KG)
TABLA 445 PRODUCTOS DE CONFITERÍA DE JAPÓN EN EL MERCADO DE ALIMENTOS LISTOS PARA CONSUMIR, POR TIPO, 2018-2032 (MILES DE USD)
TABLA 446 PRODUCTOS DE CONFITERÍA DE JAPÓN EN EL MERCADO DE ALIMENTOS LISTOS PARA CONSUMIR, POR TIPO, 2018-2032 (TONELADAS)
TABLA 447 PRODUCTOS DE CONFITERÍA DE JAPÓN EN EL MERCADO DE ALIMENTOS LISTOS PARA CONSUMIR, POR TIPO, 2018-2032 (USD/KG)
TABLA 448 PRODUCTOS A BASE DE VEGETALES EN EL MERCADO DE ALIMENTOS LISTOS PARA CONSUMIR DE JAPÓN, POR TIPO, 2018-2032 (MILES DE USD)
TABLA 449 PRODUCTOS A BASE DE VEGETALES EN EL MERCADO DE ALIMENTOS LISTOS PARA CONSUMIR DE JAPÓN, POR TIPO, 2018-2032 (TONELADAS)
TABLA 450 PRODUCTOS A BASE DE VEGETALES EN EL MERCADO DE ALIMENTOS LISTOS PARA CONSUMIR DE JAPÓN, POR TIPO, 2018-2032 (USD/KG)
TABLA 451 SOPAS INSTANTÁNEAS EN EL MERCADO DE ALIMENTOS LISTOS PARA CONSUMIR DE JAPÓN, POR TIPO, 2018-2032 (MILES DE USD)
TABLA 452 SOPAS INSTANTÁNEAS DE JAPÓN EN EL MERCADO DE ALIMENTOS LISTOS PARA CONSUMIR, POR TIPO, 2018-2032 (TONELADAS)
TABLA 453 SOPAS INSTANTÁNEAS DE JAPÓN EN EL MERCADO DE ALIMENTOS LISTOS PARA CONSUMIR, POR TIPO, 2018-2032 (USD/KG)
TABLA 454 APERITIVOS SALADOS EN EL MERCADO DE ALIMENTOS LISTOS PARA COMER DE JAPÓN, POR TIPO, 2018-2032 (MILES DE USD)
TABLA 455 APERITIVOS SALADOS DE JAPÓN EN EL MERCADO DE ALIMENTOS LISTOS PARA CONSUMIR, POR TIPO, 2018-2032 (TONELADAS)
TABLA 456 APERITIVOS SALADOS DE JAPÓN EN EL MERCADO DE ALIMENTOS LISTOS PARA CONSUMIR, POR TIPO, 2018-2032 (USD/KG)
TABLA 457 PATATAS FRITAS JAPONESAS EN EL MERCADO DE ALIMENTOS LISTOS PARA CONSUMIR, POR TIPO, 2018-2032 (MILES DE USD)
TABLA 458 PATATAS FRITAS JAPONESAS EN EL MERCADO DE ALIMENTOS LISTOS PARA CONSUMIR, POR TIPO, 2018-2032 (TONELADAS)
TABLA 459 PAPAS FRITAS JAPONESAS EN EL MERCADO DE ALIMENTOS LISTOS PARA CONSUMIR, POR TIPO, 2018-2032 (USD/KG)
TABLA 460 OBLEAS JAPONESAS EN EL MERCADO DE ALIMENTOS LISTOS PARA CONSUMIR, POR TIPO, 2018-2032 (MILES DE USD)
TABLA 461 OBLEAS JAPONESAS EN EL MERCADO DE ALIMENTOS LISTOS PARA CONSUMIR, POR TIPO, 2018-2032 (TONELADAS)
TABLA 462 OBLEAS DE JAPÓN EN EL MERCADO DE ALIMENTOS LISTOS PARA CONSUMIR, POR TIPO, 2018-2032 (USD/KG)
TABLA 463 NAMKEENS DE JAPÓN EN EL MERCADO DE ALIMENTOS LISTOS PARA CONSUMIR, POR TIPO, 2018-2032 (MILES DE USD)
TABLA 464 NAMKEENS DE JAPÓN EN EL MERCADO DE ALIMENTOS LISTOS PARA CONSUMIR, POR TIPO, 2018-2032 (TONELADAS)
TABLA 465 NAMKEENS DE JAPÓN EN EL MERCADO DE ALIMENTOS LISTOS PARA CONSUMIR, POR TIPO, 2018-2032 (USD/KG)
TABLA 466 GALLETAS Y GALLETAS JAPONESAS EN EL MERCADO DE ALIMENTOS LISTOS PARA CONSUMIR, POR TIPO, 2018-2032 (MILES DE USD)
TABLA 467 GALLETAS Y GALLETAS JAPONESAS EN EL MERCADO DE ALIMENTOS LISTOS PARA CONSUMIR, POR TIPO, 2018-2032 (TONELADAS)
TABLA 468 GALLETAS Y GALLETAS JAPONESAS EN EL MERCADO DE ALIMENTOS LISTOS PARA CONSUMIR, POR TIPO, 2018-2032 (USD/KG)
TABLA 469 ALIMENTOS REFRIGERADOS EN EL MERCADO DE ALIMENTOS LISTOS PARA CONSUMIR DE JAPÓN, POR TIPO, 2018-2032 (MILES DE USD)
TABLA 470 ALIMENTOS REFRIGERADOS EN EL MERCADO DE ALIMENTOS LISTOS PARA CONSUMIR DE JAPÓN, POR TIPO, 2018-2032 (TONELADAS)
TABLA 471 ALIMENTOS REFRIGERADOS DE JAPÓN EN EL MERCADO DE ALIMENTOS LISTOS PARA CONSUMIR, POR TIPO, 2018-2032 (USD/KG)
TABLA 472 SNACKS DE CARNE DE ORIGEN VEGETAL EN EL MERCADO DE ALIMENTOS LISTOS PARA CONSUMIR DE JAPÓN, POR TIPO, 2018-2032 (MILES DE USD)
TABLA 473 APERITIVOS DE CARNE DE ORIGEN VEGETAL EN EL MERCADO DE ALIMENTOS LISTOS PARA CONSUMIR DE JAPÓN, POR TIPO, 2018-2032 (TONELADAS)
TABLA 474 APERITIVOS DE CARNE DE ORIGEN VEGETAL EN EL MERCADO DE ALIMENTOS LISTOS PARA CONSUMIR DE JAPÓN, POR TIPO, 2018-2032 (USD/KG)
TABLA 475 APERITIVOS DE CARNE DE ORIGEN VEGETAL EN EL MERCADO DE ALIMENTOS LISTOS PARA CONSUMIR DE JAPÓN, POR FUENTE, 2018-2032 (MILES DE USD)
TABLA 476 APERITIVOS DE CARNE DE ORIGEN VEGETAL EN EL MERCADO DE ALIMENTOS LISTOS PARA CONSUMIR DE JAPÓN, POR FUENTE, 2018-2032 (TONELADAS)
TABLA 477 APERITIVOS DE CARNE DE ORIGEN VEGETAL EN EL MERCADO DE ALIMENTOS LISTOS PARA CONSUMIR DE JAPÓN, POR FUENTE, 2018-2032 (USD/KG)
TABLA 478 COMIDAS LISTAS PARA COMER EN EL MERCADO DE ALIMENTOS LISTOS PARA COMER DE JAPÓN, POR TIPO, 2018-2032 (MILES DE USD)
TABLA 479 COMIDAS LISTAS PARA COMER EN EL MERCADO DE ALIMENTOS LISTOS PARA COMER DE JAPÓN, POR TIPO, 2018-2032 (TONELADAS)
TABLA 480 COMIDAS LISTAS PARA COMER EN EL MERCADO DE ALIMENTOS LISTOS PARA COMER DE JAPÓN, POR TIPO, 2018-2032 (USD/KG)
TABLA 481 MERCADO DE ALIMENTOS LISTOS PARA CONSUMIR DE JAPÓN, POR CATEGORÍA, 2018-2032 (MILES DE USD)
TABLA 482 MERCADO DE ESPECIALIDADES DE JAPÓN EN ALIMENTOS LISTOS PARA CONSUMIR, POR TIPO, 2018-2032 (MILES DE USD)
TABLA 483 MERCADO DE ALIMENTOS LISTOS PARA CONSUMIR EN JAPÓN, POR TIPO DE ENVASE, 2018-2032 (MILES DE USD)
TABLA 484 BOTELLAS DE JAPÓN EN EL MERCADO DE ALIMENTOS LISTOS PARA CONSUMIR, POR TIPO, 2018-2032 (MILES DE USD)
TABLA 485 MERCADO DE ALIMENTOS LISTOS PARA CONSUMIR EN JAPÓN, POR TAMAÑO DE ENVASE, 2018-2032 (MILES DE USD)
TABLA 486 MERCADO DE ALIMENTOS LISTOS PARA CONSUMIR EN JAPÓN, POR TECNOLOGÍA DE ENVASADO, 2018-2032 (MILES DE USD)
TABLA 487 MERCADO DE ALIMENTOS LISTOS PARA CONSUMIR EN JAPÓN, POR TIPO DE ALMACENAMIENTO, 2018-2032 (MILES DE USD)
TABLA 488 MERCADO DE ALIMENTOS LISTOS PARA CONSUMIR EN JAPÓN, POR CANAL DE DISTRIBUCIÓN, 2018-2032 (MILES DE USD)
TABLA 489 MERCADO DE ALIMENTOS LISTOS PARA CONSUMIR EN TIENDAS DE JAPÓN, POR TIPO, 2018-2032 (MILES DE USD)
TABLA 490 MERCADO DE ALIMENTOS LISTOS PARA CONSUMIR SIN TIENDAS EN JAPÓN, POR TIPO, 2018-2032 (MILES DE USD)
TABLA 491 MERCADO DE ALIMENTOS LISTOS PARA CONSUMIR EN JAPÓN, POR USUARIO FINAL, 2018-2032 (MILES DE USD)
TABLA 492 SERVICIOS DE LA INDUSTRIA ALIMENTARIA DE JAPÓN EN EL MERCADO DE ALIMENTOS LISTOS PARA CONSUMIR, POR TIPO, 2018-2032 (MILES DE USD)
TABLA 493 RESTAURANTES DE JAPÓN EN EL MERCADO DE COMIDA LISTA PARA COMER, POR TIPO, 2018-2032 (MILES DE USD)
TABLA 494 MERCADO DE ALIMENTOS LISTOS PARA CONSUMIR DE COREA DEL SUR, POR TIPO DE PRODUCTO, 2018-2032 (MILES DE USD)
TABLA 495 MERCADO DE ALIMENTOS LISTOS PARA CONSUMIR DE COREA DEL SUR, POR TIPO DE PRODUCTO, 2018-2032 (TONELADAS)
TABLA 496 MERCADO DE ALIMENTOS LISTOS PARA CONSUMIR DE COREA DEL SUR, POR TIPO DE PRODUCTO, 2018-2032 (USD/KG)
TABLA 497 PRODUCTOS CÁRNICOS DE COREA DEL SUR EN EL MERCADO DE ALIMENTOS LISTOS PARA CONSUMIR, POR TIPO, 2018-2032 (MILES DE USD)
TABLA 498 PRODUCTOS CÁRNICOS DE COREA DEL SUR EN EL MERCADO DE ALIMENTOS LISTOS PARA CONSUMIR, POR TIPO, 2018-2032 (TONELADAS)
TABLA 499 PRODUCTOS CÁRNICOS DE COREA DEL SUR EN EL MERCADO DE ALIMENTOS LISTOS PARA CONSUMIR, POR TIPO, 2018-2032 (USD/KG)
TABLA 500 PRODUCTOS A BASE DE CEREALES DE COREA DEL SUR EN EL MERCADO DE ALIMENTOS LISTOS PARA CONSUMIR, POR TIPO, 2018-2032 (MILES DE USD)
TABLA 501 PRODUCTOS A BASE DE CEREALES DE COREA DEL SUR EN EL MERCADO DE ALIMENTOS LISTOS PARA CONSUMIR, POR TIPO, 2018-2032 (TONELADAS)
TABLA 502 PRODUCTOS A BASE DE CEREALES DE COREA DEL SUR EN EL MERCADO DE ALIMENTOS LISTOS PARA CONSUMIR, POR TIPO, 2018-2032 (USD/KG)
TABLA 503 PRODUCTOS LÁCTEOS DE COREA DEL SUR EN EL MERCADO DE ALIMENTOS LISTOS PARA CONSUMIR, POR TIPO, 2018-2032 (MILES DE USD)
TABLA 504 PRODUCTOS LÁCTEOS DE COREA DEL SUR EN EL MERCADO DE ALIMENTOS LISTOS PARA CONSUMIR, POR TIPO, 2018-2032 (TONELADAS)
TABLA 505 PRODUCTOS LÁCTEOS DE COREA DEL SUR EN EL MERCADO DE ALIMENTOS LISTOS PARA CONSUMIR, POR TIPO, 2018-2032 (USD/KG)
TABLA 506 QUESO DE COREA DEL SUR EN EL MERCADO DE ALIMENTOS LISTOS PARA CONSUMIR, POR FORMA, 2018-2032 (MILES DE USD)
TABLA 507 QUESO DE COREA DEL SUR EN EL MERCADO DE ALIMENTOS LISTOS PARA CONSUMIR, POR FORMA, 2018-2032 (TONELADAS)
TABLA 508 QUESO DE COREA DEL SUR EN EL MERCADO DE ALIMENTOS LISTOS PARA CONSUMIR, POR FORMA, 2018-2032 (USD/KG)
TABLA 509 QUESO DE COREA DEL SUR EN EL MERCADO DE ALIMENTOS LISTOS PARA CONSUMIR, POR TIPO, 2018-2032 (MILES DE USD)
TABLA 510 QUESO DE COREA DEL SUR EN EL MERCADO DE ALIMENTOS LISTOS PARA CONSUMIR, POR TIPO, 2018-2032 (TONELADAS)
TABLA 511 QUESO DE COREA DEL SUR EN EL MERCADO DE ALIMENTOS LISTOS PARA CONSUMIR, POR TIPO, 2018-2032 (USD/KG)
TABLA 512 QUESO DE ORIGEN ANIMAL DE COREA DEL SUR EN EL MERCADO DE ALIMENTOS LISTOS PARA CONSUMIR, POR TIPO, 2018-2032 (MILES DE USD)
TABLA 513 QUESO VEGETAL DE COREA DEL SUR EN EL MERCADO DE ALIMENTOS LISTOS PARA CONSUMIR, POR TIPO, 2018-2032 (MILES DE USD)
TABLA 514 HELADOS DE COREA DEL SUR EN EL MERCADO DE ALIMENTOS LISTOS PARA CONSUMIR, POR TIPO, 2018-2032 (MILES DE USD)
TABLA 515 HELADOS DE COREA DEL SUR EN EL MERCADO DE ALIMENTOS LISTOS PARA CONSUMIR, POR TIPO, 2018-2032 (TONELADAS)
TABLA 516 HELADOS DE COREA DEL SUR EN EL MERCADO DE ALIMENTOS LISTOS PARA CONSUMIR, POR TIPO, 2018-2032 (USD/KG)
TABLA 517 CUAJADA DE COREA DEL SUR EN EL MERCADO DE ALIMENTOS LISTOS PARA CONSUMIR, POR TIPO, 2018-2032 (MILES DE USD)
TABLA 518 CUAJADA DE COREA DEL SUR EN EL MERCADO DE ALIMENTOS LISTOS PARA CONSUMIR, POR TIPO, 2018-2032 (TONELADAS)
TABLA 519 CUAJADA DE COREA DEL SUR EN EL MERCADO DE ALIMENTOS LISTOS PARA CONSUMIR, POR TIPO, 2018-2032 (USD/KG)
TABLA 520 PANEER DE COREA DEL SUR EN EL MERCADO DE ALIMENTOS LISTOS PARA CONSUMIR, POR TIPO, 2018-2032 (MILES DE USD)
TABLA 521 PANEER DE COREA DEL SUR EN EL MERCADO DE ALIMENTOS LISTOS PARA CONSUMIR, POR TIPO, 2018-2032 (TONELADAS)
TABLA 522 PANEER DE COREA DEL SUR EN EL MERCADO DE ALIMENTOS LISTOS PARA CONSUMIR, POR TIPO, 2018-2032 (USD/KG)
TABLA 523 GHEE DE COREA DEL SUR EN EL MERCADO DE ALIMENTOS LISTOS PARA CONSUMIR, POR FUENTE, 2018-2032 (MILES DE USD)
TABLA 524 GHEE DE COREA DEL SUR EN EL MERCADO DE ALIMENTOS LISTOS PARA CONSUMIR, POR FUENTE, 2018-2032 (TONELADAS)
TABLA 525 GHEE DE COREA DEL SUR EN EL MERCADO DE ALIMENTOS LISTOS PARA CONSUMIR, POR FUENTE, 2018-2032 (USD/KG)
TABLA 526 PRODUCTOS DE PANADERÍA DE COREA DEL SUR EN EL MERCADO DE ALIMENTOS LISTOS PARA CONSUMIR, POR TIPO, 2018-2032 (MILES DE USD)
TABLA 527 PRODUCTOS DE PANADERÍA DE COREA DEL SUR EN EL MERCADO DE ALIMENTOS LISTOS PARA CONSUMIR, POR TIPO, 2018-2032 (TONELADAS)
TABLA 528 PRODUCTOS DE PANADERÍA DE COREA DEL SUR EN EL MERCADO DE ALIMENTOS LISTOS PARA CONSUMIR, POR TIPO, 2018-2032 (USD/KG)
TABLA 529 DULCES SALADOS DE COREA DEL SUR EN EL MERCADO DE ALIMENTOS LISTOS PARA CONSUMIR, POR TIPO, 2018-2032 (MILES DE USD)
TABLA 530 DULCES SALADOS DE COREA DEL SUR EN EL MERCADO DE ALIMENTOS LISTOS PARA CONSUMIR, POR TIPO, 2018-2032 (TONELADAS)
TABLA 531 DULCES SALADOS DE COREA DEL SUR EN EL MERCADO DE ALIMENTOS LISTOS PARA CONSUMIR, POR TIPO, 2018-2032 (USD/KG)
TABLA 532 PRODUCTOS DE CONFITERÍA DE COREA DEL SUR EN EL MERCADO DE ALIMENTOS LISTOS PARA CONSUMIR, POR TIPO, 2018-2032 (MILES DE USD)
TABLA 533 PRODUCTOS DE CONFITERÍA DE COREA DEL SUR EN EL MERCADO DE ALIMENTOS LISTOS PARA CONSUMIR, POR TIPO, 2018-2032 (TONELADAS)
TABLA 534 PRODUCTOS DE CONFITERÍA DE COREA DEL SUR EN EL MERCADO DE ALIMENTOS LISTOS PARA CONSUMIR, POR TIPO, 2018-2032 (USD/KG)
TABLA 535 PRODUCTOS A BASE DE VEGETALES EN EL MERCADO DE ALIMENTOS LISTOS PARA CONSUMIR DE COREA DEL SUR, POR TIPO, 2018-2032 (MILES DE USD)
TABLA 536 PRODUCTOS A BASE DE VEGETALES DE COREA DEL SUR EN EL MERCADO DE ALIMENTOS LISTOS PARA CONSUMIR, POR TIPO, 2018-2032 (TONELADAS)
TABLA 537 PRODUCTOS A BASE DE VEGETALES DE COREA DEL SUR EN EL MERCADO DE ALIMENTOS LISTOS PARA CONSUMIR, POR TIPO, 2018-2032 (USD/KG)
TABLA 538 SOPAS INSTANTÁNEAS DE COREA DEL SUR EN EL MERCADO DE ALIMENTOS LISTOS PARA CONSUMIR, POR TIPO, 2018-2032 (MILES DE USD)
TABLA 539 SOPAS INSTANTÁNEAS DE COREA DEL SUR EN EL MERCADO DE ALIMENTOS LISTOS PARA CONSUMIR, POR TIPO, 2018-2032 (TONELADAS)
TABLA 540 SOPAS INSTANTÁNEAS DE COREA DEL SUR EN EL MERCADO DE ALIMENTOS LISTOS PARA CONSUMIR, POR TIPO, 2018-2032 (USD/KG)
TABLA 541 APERITIVOS SALADOS DE COREA DEL SUR EN EL MERCADO DE ALIMENTOS LISTOS PARA CONSUMIR, POR TIPO, 2018-2032 (MILES DE USD)
TABLA 542 APERITIVOS SALADOS DE COREA DEL SUR EN EL MERCADO DE ALIMENTOS LISTOS PARA CONSUMIR, POR TIPO, 2018-2032 (TONELADAS)
TABLA 543 APERITIVOS SALADOS DE COREA DEL SUR EN EL MERCADO DE ALIMENTOS LISTOS PARA CONSUMIR, POR TIPO, 2018-2032 (USD/KG)
TABLA 544 PAPAS FRITAS DE COREA DEL SUR EN EL MERCADO DE ALIMENTOS LISTOS PARA CONSUMIR, POR TIPO, 2018-2032 (MILES DE USD)
TABLA 545 PATATAS FRITAS DE COREA DEL SUR EN EL MERCADO DE ALIMENTOS LISTOS PARA CONSUMIR, POR TIPO, 2018-2032 (TONELADAS)
TABLA 546 PAPAS FRITAS DE COREA DEL SUR EN EL MERCADO DE ALIMENTOS LISTOS PARA CONSUMIR, POR TIPO, 2018-2032 (USD/KG)
TABLA 547 OBLEAS DE COREA DEL SUR EN EL MERCADO DE ALIMENTOS LISTOS PARA CONSUMIR, POR TIPO, 2018-2032 (MILES DE USD)
TABLA 548 OBLEAS DE COREA DEL SUR EN EL MERCADO DE ALIMENTOS LISTOS PARA CONSUMIR, POR TIPO, 2018-2032 (TONELADAS)
TABLA 549 OBLEAS DE COREA DEL SUR EN EL MERCADO DE ALIMENTOS LISTOS PARA CONSUMIR, POR TIPO, 2018-2032 (USD/KG)
TABLA 550 NAMKEENS DE COREA DEL SUR EN EL MERCADO DE ALIMENTOS LISTOS PARA CONSUMIR, POR TIPO, 2018-2032 (MILES DE USD)
TABLA 551 NAMKEENS DE COREA DEL SUR EN EL MERCADO DE ALIMENTOS LISTOS PARA CONSUMIR, POR TIPO, 2018-2032 (TONELADAS)
TABLA 552 NAMKEENS DE COREA DEL SUR EN EL MERCADO DE ALIMENTOS LISTOS PARA CONSUMIR, POR TIPO, 2018-2032 (USD/KG)
TABLA 553 GALLETAS Y GALLETAS DE COREA DEL SUR EN EL MERCADO DE ALIMENTOS LISTOS PARA CONSUMIR, POR TIPO, 2018-2032 (MILES DE USD)
TABLA 554 GALLETAS Y GALLETAS DE COREA DEL SUR EN EL MERCADO DE ALIMENTOS LISTOS PARA CONSUMIR, POR TIPO, 2018-2032 (TONELADAS)
TABLA 555 GALLETAS Y GALLETAS DE COREA DEL SUR EN EL MERCADO DE ALIMENTOS LISTOS PARA CONSUMIR, POR TIPO, 2018-2032 (USD/KG)
TABLA 556 ALIMENTOS REFRIGERADOS DE COREA DEL SUR EN EL MERCADO DE ALIMENTOS LISTOS PARA CONSUMIR, POR TIPO, 2018-2032 (MILES DE USD)
TABLA 557 ALIMENTOS REFRIGERADOS DE COREA DEL SUR EN EL MERCADO DE ALIMENTOS LISTOS PARA CONSUMIR, POR TIPO, 2018-2032 (TONELADAS)
TABLA 558 ALIMENTOS REFRIGERADOS DE COREA DEL SUR EN EL MERCADO DE ALIMENTOS LISTOS PARA CONSUMIR, POR TIPO, 2018-2032 (USD/KG)
TABLA 559 APERITIVOS DE CARNE DE ORIGEN VEGETAL EN EL MERCADO DE ALIMENTOS LISTOS PARA CONSUMIR DE COREA DEL SUR, POR TIPO, 2018-2032 (MILES DE USD)
TABLA 560 APERITIVOS DE CARNE DE ORIGEN VEGETAL EN EL MERCADO DE ALIMENTOS LISTOS PARA CONSUMIR DE COREA DEL SUR, POR TIPO, 2018-2032 (TONELADAS)
TABLA 561 APERITIVOS DE CARNE DE ORIGEN VEGETAL EN EL MERCADO DE ALIMENTOS LISTOS PARA CONSUMIR DE COREA DEL SUR, POR TIPO, 2018-2032 (USD/KG)
TABLA 562 APERITIVOS DE CARNE DE ORIGEN VEGETAL DE COREA DEL SUR EN EL MERCADO DE ALIMENTOS LISTOS PARA CONSUMIR, POR FUENTE, 2018-2032 (MILES DE USD)
TABLA 563 APERITIVOS DE CARNE DE ORIGEN VEGETAL EN EL MERCADO DE ALIMENTOS LISTOS PARA CONSUMIR DE COREA DEL SUR, POR FUENTE, 2018-2032 (TONELADAS)
TABLA 564 APERITIVOS DE CARNE DE ORIGEN VEGETAL DE COREA DEL SUR EN EL MERCADO DE ALIMENTOS LISTOS PARA CONSUMIR, POR FUENTE, 2018-2032 (USD/KG)
TABLA 565 COMIDAS LISTAS PARA COMER EN EL MERCADO DE ALIMENTOS LISTOS PARA COMER DE COREA DEL SUR, POR TIPO, 2018-2032 (MILES DE USD)
TABLA 566 COMIDAS LISTAS PARA COMER EN EL MERCADO DE ALIMENTOS LISTOS PARA COMER DE COREA DEL SUR, POR TIPO, 2018-2032 (TONELADAS)
TABLA 567 COMIDAS LISTAS PARA CONSUMIR EN EL MERCADO DE ALIMENTOS LISTOS PARA CONSUMIR DE COREA DEL SUR, POR TIPO, 2018-2032 (USD/KG)
TABLA 568 MERCADO DE ALIMENTOS LISTOS PARA CONSUMIR DE COREA DEL SUR, POR CATEGORÍA, 2018-2032 (MILES DE USD)
TABLA 569 MERCADO DE ESPECIALIDADES DE COREA DEL SUR EN ALIMENTOS LISTOS PARA CONSUMIR, POR TIPO, 2018-2032 (MILES DE USD)
TABLA 570 MERCADO DE ALIMENTOS LISTOS PARA CONSUMIR DE COREA DEL SUR, POR TIPO DE ENVASE, 2018-2032 (MILES DE USD)
TABLA 571 BOTELLAS DE COREA DEL SUR EN EL MERCADO DE ALIMENTOS LISTOS PARA CONSUMIR, POR TIPO, 2018-2032 (MILES DE USD)
TABLA 572 MERCADO DE ALIMENTOS LISTOS PARA CONSUMIR DE COREA DEL SUR, POR TAMAÑO DE ENVASE, 2018-2032 (MILES DE USD)
TABLA 573 MERCADO DE ALIMENTOS LISTOS PARA CONSUMIR DE COREA DEL SUR, POR TECNOLOGÍA DE ENVASE, 2018-2032 (MILES DE USD)
TABLA 574 MERCADO DE ALIMENTOS LISTOS PARA CONSUMIR DE COREA DEL SUR, POR TIPO DE ALMACENAMIENTO, 2018-2032 (MILES DE USD)
TABLA 575 MERCADO DE ALIMENTOS LISTOS PARA CONSUMIR DE COREA DEL SUR, POR CANAL DE DISTRIBUCIÓN, 2018-2032 (MILES DE USD)
TABLA 576 MERCADO DE ALIMENTOS LISTOS PARA CONSUMIR EN TIENDAS DE COREA DEL SUR, POR TIPO, 2018-2032 (MILES DE USD)
TABLA 577 MERCADO DE ALIMENTOS LISTOS PARA CONSUMIR SIN TIENDAS DE COREA DEL SUR, POR TIPO, 2018-2032 (MILES DE USD)
TABLA 578 MERCADO DE ALIMENTOS LISTOS PARA CONSUMIR DE COREA DEL SUR, POR USUARIO FINAL, 2018-2032 (MILES DE USD)
TABLA 579 SERVICIOS DE LA INDUSTRIA ALIMENTARIA DE COREA DEL SUR EN EL MERCADO DE ALIMENTOS LISTOS PARA CONSUMIR, POR TIPO, 2018-2032 (MILES DE USD)
TABLA 580 RESTAURANTES DE COREA DEL SUR EN EL MERCADO DE COMIDAS LISTA PARA COMER, POR TIPO, 2018-2032 (MILES DE USD)
TABLA 581 MERCADO DE ALIMENTOS LISTOS PARA CONSUMIR DE SINGAPUR, POR TIPO DE PRODUCTO, 2018-2032 (MILES DE USD)
TABLA 582 MERCADO DE ALIMENTOS LISTOS PARA CONSUMIR DE SINGAPUR, POR TIPO DE PRODUCTO, 2018-2032 (TONELADAS)
TABLA 583 MERCADO DE ALIMENTOS LISTOS PARA CONSUMIR DE SINGAPUR, POR TIPO DE PRODUCTO, 2018-2032 (USD/KG)
TABLA 584 PRODUCTOS CÁRNICOS DE SINGAPUR EN EL MERCADO DE ALIMENTOS LISTOS PARA CONSUMIR, POR TIPO, 2018-2032 (MILES DE USD)
TABLA 585 PRODUCTOS CÁRNICOS DE SINGAPUR EN EL MERCADO DE ALIMENTOS LISTOS PARA CONSUMIR, POR TIPO, 2018-2032 (TONELADAS)
TABLA 586 PRODUCTOS CÁRNICOS DE SINGAPUR EN EL MERCADO DE ALIMENTOS LISTOS PARA CONSUMIR, POR TIPO, 2018-2032 (USD/KG)
TABLA 587 PRODUCTOS A BASE DE CEREALES DE SINGAPUR EN EL MERCADO DE ALIMENTOS LISTOS PARA CONSUMIR, POR TIPO, 2018-2032 (MILES DE USD)
TABLA 588 PRODUCTOS A BASE DE CEREALES DE SINGAPUR EN EL MERCADO DE ALIMENTOS LISTOS PARA CONSUMIR, POR TIPO, 2018-2032 (TONELADAS)
TABLA 589 PRODUCTOS A BASE DE CEREALES DE SINGAPUR EN EL MERCADO DE ALIMENTOS LISTOS PARA CONSUMIR, POR TIPO, 2018-2032 (USD/KG)
TABLA 590 PRODUCTOS LÁCTEOS DE SINGAPUR EN EL MERCADO DE ALIMENTOS LISTOS PARA CONSUMIR, POR TIPO, 2018-2032 (MILES DE USD)
TABLA 591 PRODUCTOS LÁCTEOS DE SINGAPUR EN EL MERCADO DE ALIMENTOS LISTOS PARA CONSUMIR, POR TIPO, 2018-2032 (TONELADAS)
TABLA 592 PRODUCTOS LÁCTEOS DE SINGAPUR EN EL MERCADO DE ALIMENTOS LISTOS PARA CONSUMIR, POR TIPO, 2018-2032 (USD/KG)
TABLA 593 QUESO DE SINGAPUR EN EL MERCADO DE ALIMENTOS LISTOS PARA CONSUMIR, POR FORMA, 2018-2032 (MILES DE USD)
TABLA 594 QUESO DE SINGAPUR EN EL MERCADO DE ALIMENTOS LISTOS PARA CONSUMIR, POR FORMA, 2018-2032 (TONELADAS)
TABLA 595 QUESO DE SINGAPUR EN EL MERCADO DE ALIMENTOS LISTOS PARA CONSUMIR, POR FORMA, 2018-2032 (USD/KG)
TABLA 596 QUESO DE SINGAPUR EN EL MERCADO DE ALIMENTOS LISTOS PARA CONSUMIR, POR TIPO, 2018-2032 (MILES DE USD)
TABLA 597 QUESO DE SINGAPUR EN EL MERCADO DE ALIMENTOS LISTOS PARA CONSUMIR, POR TIPO, 2018-2032 (TONELADAS)
TABLA 598 QUESO DE SINGAPUR EN EL MERCADO DE ALIMENTOS LISTOS PARA CONSUMIR, POR TIPO, 2018-2032 (USD/KG)
TABLA 599 QUESO DE ORIGEN ANIMAL DE SINGAPUR EN EL MERCADO DE ALIMENTOS LISTOS PARA CONSUMIR, POR TIPO, 2018-2032 (MILES DE USD)
TABLA 600 QUESO VEGETAL DE SINGAPUR EN EL MERCADO DE ALIMENTOS LISTOS PARA CONSUMIR, POR TIPO, 2018-2032 (MILES DE USD)
TABLA 601 HELADOS DE SINGAPUR EN EL MERCADO DE ALIMENTOS LISTOS PARA CONSUMIR, POR TIPO, 2018-2032 (MILES DE USD)
TABLA 602 HELADOS DE SINGAPUR EN EL MERCADO DE ALIMENTOS LISTOS PARA CONSUMIR, POR TIPO, 2018-2032 (TONELADAS)
TABLA 603 HELADOS DE SINGAPUR EN EL MERCADO DE ALIMENTOS LISTOS PARA CONSUMIR, POR TIPO, 2018-2032 (USD/KG)
TABLA 604 CUAJADA DE SINGAPUR EN EL MERCADO DE ALIMENTOS LISTOS PARA CONSUMIR, POR TIPO, 2018-2032 (MILES DE USD)
TABLA 605 CUAJADA DE SINGAPUR EN EL MERCADO DE ALIMENTOS LISTOS PARA CONSUMIR, POR TIPO, 2018-2032 (TONELADAS)
TABLA 606 CUAJADA DE SINGAPUR EN EL MERCADO DE ALIMENTOS LISTOS PARA CONSUMIR, POR TIPO, 2018-2032 (USD/KG)
TABLA 607 PANEER DE SINGAPUR EN EL MERCADO DE ALIMENTOS LISTOS PARA CONSUMIR, POR TIPO, 2018-2032 (MILES DE USD)
TABLA 608. PANEER DE SINGAPUR EN EL MERCADO DE ALIMENTOS LISTOS PARA CONSUMIR, POR TIPO, 2018-2032 (TONELADAS)
TABLA 609. PANEER DE SINGAPUR EN EL MERCADO DE ALIMENTOS LISTOS PARA CONSUMIR, POR TIPO, 2018-2032 (USD/KG)
TABLA 610 GHEE DE SINGAPUR EN EL MERCADO DE ALIMENTOS LISTOS PARA CONSUMIR, POR FUENTE, 2018-2032 (MILES DE USD)
TABLA 611 GHEE DE SINGAPUR EN EL MERCADO DE ALIMENTOS LISTOS PARA CONSUMIR, POR FUENTE, 2018-2032 (TONELADAS)
TABLA 612 GHEE DE SINGAPUR EN EL MERCADO DE ALIMENTOS LISTOS PARA CONSUMIR, POR FUENTE, 2018-2032 (USD/KG)
TABLA 613 PRODUCTOS DE PANADERÍA DE SINGAPUR EN EL MERCADO DE ALIMENTOS LISTOS PARA CONSUMIR, POR TIPO, 2018-2032 (MILES DE USD)
TABLA 614 PRODUCTOS DE PANADERÍA DE SINGAPUR EN EL MERCADO DE ALIMENTOS LISTOS PARA CONSUMIR, POR TIPO, 2018-2032 (TONELADAS)
TABLA 615 PRODUCTOS DE PANADERÍA DE SINGAPUR EN EL MERCADO DE ALIMENTOS LISTOS PARA CONSUMIR, POR TIPO, 2018-2032 (USD/KG)
TABLA 616 DULCES SALADOS DE SINGAPUR EN EL MERCADO DE ALIMENTOS LISTOS PARA CONSUMIR, POR TIPO, 2018-2032 (MILES DE USD)
TABLA 617 DULCES SALADOS DE SINGAPUR EN EL MERCADO DE ALIMENTOS LISTOS PARA CONSUMIR, POR TIPO, 2018-2032 (TONELADAS)
TABLA 618 DULCES SALADOS DE SINGAPUR EN EL MERCADO DE ALIMENTOS LISTOS PARA CONSUMIR, POR TIPO, 2018-2032 (USD/KG)
TABLA 619 PRODUCTOS DE CONFITERÍA DE SINGAPUR EN EL MERCADO DE ALIMENTOS LISTOS PARA CONSUMIR, POR TIPO, 2018-2032 (MILES DE USD)
TABLA 620 PRODUCTOS DE CONFITERÍA DE SINGAPUR EN EL MERCADO DE ALIMENTOS LISTOS PARA CONSUMIR, POR TIPO, 2018-2032 (TONELADAS)
TABLA 621 PRODUCTOS DE CONFITERÍA DE SINGAPUR EN EL MERCADO DE ALIMENTOS LISTOS PARA CONSUMIR, POR TIPO, 2018-2032 (USD/KG)
TABLA 622 PRODUCTOS A BASE DE VEGETALES EN EL MERCADO DE ALIMENTOS LISTOS PARA CONSUMIR DE SINGAPUR, POR TIPO, 2018-2032 (MILES DE USD)
TABLA 623 PRODUCTOS A BASE DE VEGETALES EN EL MERCADO DE ALIMENTOS LISTOS PARA CONSUMIR DE SINGAPUR, POR TIPO, 2018-2032 (TONELADAS)
TABLA 624 PRODUCTOS A BASE DE VEGETALES EN EL MERCADO DE ALIMENTOS LISTOS PARA CONSUMIR DE SINGAPUR, POR TIPO, 2018-2032 (USD/KG)
TABLA 625 SOPAS INSTANTÁNEAS DE SINGAPUR EN EL MERCADO DE ALIMENTOS LISTOS PARA CONSUMIR, POR TIPO, 2018-2032 (MILES DE USD)
TABLA 626 SOPAS INSTANTÁNEAS DE SINGAPUR EN EL MERCADO DE ALIMENTOS LISTOS PARA CONSUMIR, POR TIPO, 2018-2032 (TONELADAS)
TABLA 627 SOPAS INSTANTÁNEAS DE SINGAPUR EN EL MERCADO DE ALIMENTOS LISTOS PARA CONSUMIR, POR TIPO, 2018-2032 (USD/KG)
TABLA 628 APERITIVOS SALADOS DE SINGAPUR EN EL MERCADO DE ALIMENTOS LISTOS PARA CONSUMIR, POR TIPO, 2018-2032 (MILES DE USD)
TABLA 629 APERITIVOS SALADOS DE SINGAPUR EN EL MERCADO DE ALIMENTOS LISTOS PARA CONSUMIR, POR TIPO, 2018-2032 (TONELADAS)
TABLA 630 APERITIVOS SALADOS DE SINGAPUR EN EL MERCADO DE ALIMENTOS LISTOS PARA CONSUMIR, POR TIPO, 2018-2032 (USD/KG)
TABLA 631 PAPAS FRITAS DE SINGAPUR EN EL MERCADO DE ALIMENTOS LISTOS PARA CONSUMIR, POR TIPO, 2018-2032 (MILES DE USD)
TABLA 632 PATATAS FRITAS DE SINGAPUR EN EL MERCADO DE ALIMENTOS LISTOS PARA CONSUMIR, POR TIPO, 2018-2032 (TONELADAS)
TABLA 633 PAPAS FRITAS DE SINGAPUR EN EL MERCADO DE ALIMENTOS LISTOS PARA CONSUMIR, POR TIPO, 2018-2032 (USD/KG)
TABLA 634 OBLEAS DE SINGAPUR EN EL MERCADO DE ALIMENTOS LISTOS PARA CONSUMIR, POR TIPO, 2018-2032 (MILES DE USD)
TABLA 635 OBLEAS DE SINGAPUR EN EL MERCADO DE ALIMENTOS LISTOS PARA CONSUMIR, POR TIPO, 2018-2032 (TONELADAS)
TABLA 636 OBLEAS DE SINGAPUR EN EL MERCADO DE ALIMENTOS LISTOS PARA CONSUMIR, POR TIPO, 2018-2032 (USD/KG)
TABLA 637 NÚMEROS DE SINGAPUR EN EL MERCADO DE ALIMENTOS LISTOS PARA CONSUMIR, POR TIPO, 2018-2032 (MILES DE USD)
TABLA 638 NÚMEROS DE SINGAPUR EN EL MERCADO DE ALIMENTOS LISTOS PARA CONSUMIR, POR TIPO, 2018-2032 (TONELADAS)
TABLA 639 NAMKEENS DE SINGAPUR EN EL MERCADO DE ALIMENTOS LISTOS PARA CONSUMIR, POR TIPO, 2018-2032 (USD/KG)
TABLA 640 GALLETAS Y GALLETAS DE SINGAPUR EN EL MERCADO DE ALIMENTOS LISTOS PARA CONSUMIR, POR TIPO, 2018-2032 (MILES DE USD)
TABLA 641 GALLETAS Y GALLETAS DE SINGAPUR EN EL MERCADO DE ALIMENTOS LISTOS PARA CONSUMIR, POR TIPO, 2018-2032 (TONELADAS)
TABLA 642 GALLETAS Y GALLETAS DE SINGAPUR EN EL MERCADO DE ALIMENTOS LISTOS PARA CONSUMIR, POR TIPO, 2018-2032 (USD/KG)
TABLA 643 ALIMENTOS REFRIGERADOS EN EL MERCADO DE ALIMENTOS LISTOS PARA CONSUMIR DE SINGAPUR, POR TIPO, 2018-2032 (MILES DE USD)
TABLA 644 ALIMENTOS REFRIGERADOS EN EL MERCADO DE ALIMENTOS LISTOS PARA CONSUMIR DE SINGAPUR, POR TIPO, 2018-2032 (TONELADAS)
TABLA 645 ALIMENTOS REFRIGERADOS EN EL MERCADO DE ALIMENTOS LISTOS PARA CONSUMIR DE SINGAPUR, POR TIPO, 2018-2032 (USD/KG)
TABLA 646 SNACKS DE CARNE DE ORIGEN VEGETAL EN EL MERCADO DE ALIMENTOS LISTOS PARA CONSUMIR DE SINGAPUR, POR TIPO, 2018-2032 (MILES DE USD)
TABLA 647 APERITIVOS DE CARNE DE ORIGEN VEGETAL EN EL MERCADO DE ALIMENTOS LISTOS PARA CONSUMIR DE SINGAPUR, POR TIPO, 2018-2032 (TONELADAS)
TABLA 648 APERITIVOS DE CARNE DE ORIGEN VEGETAL EN EL MERCADO DE ALIMENTOS LISTOS PARA CONSUMIR DE SINGAPUR, POR TIPO, 2018-2032 (USD/KG)
TABLA 649 APERITIVOS DE CARNE DE ORIGEN VEGETAL EN EL MERCADO DE ALIMENTOS LISTOS PARA CONSUMIR DE SINGAPUR, POR FUENTE, 2018-2032 (MILES DE USD)
TABLA 650 APERITIVOS DE CARNE DE ORIGEN VEGETAL EN EL MERCADO DE ALIMENTOS LISTOS PARA CONSUMIR DE SINGAPUR, POR FUENTE, 2018-2032 (TONELADAS)
TABLA 651 APERITIVOS DE CARNE DE ORIGEN VEGETAL EN EL MERCADO DE ALIMENTOS LISTOS PARA CONSUMIR DE SINGAPUR, POR FUENTE, 2018-2032 (USD/KG)
TABLA 652 COMIDAS LISTAS PARA COMER EN EL MERCADO DE ALIMENTOS LISTOS PARA COMER DE SINGAPUR, POR TIPO, 2018-2032 (MILES DE USD)
TABLA 653 COMIDAS LISTAS PARA COMER EN EL MERCADO DE ALIMENTOS LISTOS PARA COMER DE SINGAPUR, POR TIPO, 2018-2032 (TONELADAS)
TABLA 654 COMIDAS LISTAS PARA COMER EN EL MERCADO DE ALIMENTOS LISTOS PARA COMER DE SINGAPUR, POR TIPO, 2018-2032 (USD/KG)
TABLA 655 MERCADO DE ALIMENTOS LISTOS PARA COMER DE SINGAPUR, POR CATEGORÍA, 2018-2032 (MILES DE USD)
TABLA 656 MERCADO DE ALIMENTOS ESPECIALES LISTOS PARA CONSUMIR DE SINGAPUR, POR TIPO, 2018-2032 (MILES DE USD)
TABLA 657 MERCADO DE ALIMENTOS LISTOS PARA CONSUMIR DE SINGAPUR, POR TIPO DE ENVASE, 2018-2032 (MILES DE USD)
TABLA 658 BOTELLAS DE SINGAPUR EN EL MERCADO DE ALIMENTOS LISTOS PARA CONSUMIR, POR TIPO, 2018-2032 (MILES DE USD)
TABLA 659 MERCADO DE ALIMENTOS LISTOS PARA CONSUMIR DE SINGAPUR, POR TAMAÑO DE ENVASE, 2018-2032 (MILES DE USD)
TABLA 660 MERCADO DE ALIMENTOS LISTOS PARA CONSUMIR DE SINGAPUR, POR TECNOLOGÍA DE ENVASADO, 2018-2032 (MILES DE USD)
TABLA 661 MERCADO DE ALIMENTOS LISTOS PARA CONSUMIR DE SINGAPUR, POR TIPO DE ALMACENAMIENTO, 2018-2032 (MILES DE USD)
TABLA 662 MERCADO DE ALIMENTOS LISTOS PARA CONSUMIR DE SINGAPUR, POR CANAL DE DISTRIBUCIÓN, 2018-2032 (MILES DE USD)
TABLA 663 MERCADO DE ALIMENTOS LISTOS PARA CONSUMIR CON TIENDAS EN SINGAPUR, POR TIPO, 2018-2032 (MILES DE USD)
TABLA 664 MERCADO DE ALIMENTOS LISTOS PARA CONSUMIR SIN TIENDAS DE SINGAPUR, POR TIPO, 2018-2032 (MILES DE USD)
TABLA 665 MERCADO DE ALIMENTOS LISTOS PARA CONSUMIR DE SINGAPUR, POR USUARIO FINAL, 2018-2032 (MILES DE USD)
TABLA 666 SERVICIOS DE LA INDUSTRIA ALIMENTARIA DE SINGAPUR EN EL MERCADO DE ALIMENTOS LISTOS PARA CONSUMIR, POR TIPO, 2018-2032 (MILES DE USD)
TABLA 667 RESTAURANTES DE SINGAPUR EN EL MERCADO DE COMIDA LISTA PARA COMER, POR TIPO, 2018-2032 (MILES DE USD)
TABLA 668 MERCADO DE ALIMENTOS LISTOS PARA CONSUMIR DE SINGAPUR, POR TIPO DE PRODUCTO, 2018-2032 (MILES DE USD)
TABLA 669 MERCADO DE ALIMENTOS LISTOS PARA CONSUMIR DE SINGAPUR, POR TIPO DE PRODUCTO, 2018-2032 (TONELADAS)
TABLA 670 MERCADO DE ALIMENTOS LISTOS PARA CONSUMIR DE SINGAPUR, POR TIPO DE PRODUCTO, 2018-2032 (USD/KG)
TABLA 671 PRODUCTOS CÁRNICOS DE SINGAPUR EN EL MERCADO DE ALIMENTOS LISTOS PARA CONSUMIR, POR TIPO, 2018-2032 (MILES DE USD)
TABLA 672 PRODUCTOS CÁRNICOS DE SINGAPUR EN EL MERCADO DE ALIMENTOS LISTOS PARA CONSUMIR, POR TIPO, 2018-2032 (TONELADAS)
TABLA 673 PRODUCTOS CÁRNICOS DE SINGAPUR EN EL MERCADO DE ALIMENTOS LISTOS PARA CONSUMIR, POR TIPO, 2018-2032 (USD/KG)
TABLA 674 PRODUCTOS A BASE DE CEREALES DE SINGAPUR EN EL MERCADO DE ALIMENTOS LISTOS PARA CONSUMIR, POR TIPO, 2018-2032 (MILES DE USD)
TABLA 675 PRODUCTOS A BASE DE CEREALES DE SINGAPUR EN EL MERCADO DE ALIMENTOS LISTOS PARA CONSUMIR, POR TIPO, 2018-2032 (TONELADAS)
TABLA 676 PRODUCTOS A BASE DE CEREALES DE SINGAPUR EN EL MERCADO DE ALIMENTOS LISTOS PARA CONSUMIR, POR TIPO, 2018-2032 (USD/KG)
TABLA 677 PRODUCTOS LÁCTEOS DE SINGAPUR EN EL MERCADO DE ALIMENTOS LISTOS PARA CONSUMIR, POR TIPO, 2018-2032 (MILES DE USD)
TABLA 678 PRODUCTOS LÁCTEOS DE SINGAPUR EN EL MERCADO DE ALIMENTOS LISTOS PARA CONSUMIR, POR TIPO, 2018-2032 (TONELADAS)
TABLA 679 PRODUCTOS LÁCTEOS DE SINGAPUR EN EL MERCADO DE ALIMENTOS LISTOS PARA CONSUMIR, POR TIPO, 2018-2032 (USD/KG)
TABLA 680 QUESO DE SINGAPUR EN EL MERCADO DE ALIMENTOS LISTOS PARA CONSUMIR, POR FORMA, 2018-2032 (MILES DE USD)
TABLA 681 QUESO DE SINGAPUR EN EL MERCADO DE ALIMENTOS LISTOS PARA CONSUMIR, POR FORMA, 2018-2032 (TONELADAS)
TABLA 682 QUESO DE SINGAPUR EN EL MERCADO DE ALIMENTOS LISTOS PARA CONSUMIR, POR FORMA, 2018-2032 (USD/KG)
TABLA 683 QUESO DE SINGAPUR EN EL MERCADO DE ALIMENTOS LISTOS PARA CONSUMIR, POR TIPO, 2018-2032 (MILES DE USD)
TABLA 684 QUESO DE SINGAPUR EN EL MERCADO DE ALIMENTOS LISTOS PARA CONSUMIR, POR TIPO, 2018-2032 (TONELADAS)
TABLA 685 QUESO DE SINGAPUR EN EL MERCADO DE ALIMENTOS LISTOS PARA CONSUMIR, POR TIPO, 2018-2032 (USD/KG)
TABLA 686 QUESO DE ORIGEN ANIMAL DE SINGAPUR EN EL MERCADO DE ALIMENTOS LISTOS PARA CONSUMIR, POR TIPO, 2018-2032 (MILES DE USD)
TABLA 687 QUESO VEGETAL DE SINGAPUR EN EL MERCADO DE ALIMENTOS LISTOS PARA CONSUMIR, POR TIPO, 2018-2032 (MILES DE USD)
TABLA 688 HELADOS DE SINGAPUR EN EL MERCADO DE ALIMENTOS LISTOS PARA CONSUMIR, POR TIPO, 2018-2032 (MILES DE USD)
TABLA 689 HELADOS DE SINGAPUR EN EL MERCADO DE ALIMENTOS LISTOS PARA CONSUMIR, POR TIPO, 2018-2032 (TONELADAS)
TABLA 690 HELADOS DE SINGAPUR EN EL MERCADO DE ALIMENTOS LISTOS PARA CONSUMIR, POR TIPO, 2018-2032 (USD/KG)
TABLA 691 CUAJADA DE SINGAPUR EN EL MERCADO DE ALIMENTOS LISTOS PARA CONSUMIR, POR TIPO, 2018-2032 (MILES DE USD)
TABLA 692 CUAJADA DE SINGAPUR EN EL MERCADO DE ALIMENTOS LISTOS PARA CONSUMIR, POR TIPO, 2018-2032 (TONELADAS)
TABLA 693 CUAJADA DE SINGAPUR EN EL MERCADO DE ALIMENTOS LISTOS PARA CONSUMIR, POR TIPO, 2018-2032 (USD/KG)
TABLA 694. PANEER DE SINGAPUR EN EL MERCADO DE ALIMENTOS LISTOS PARA CONSUMIR, POR TIPO, 2018-2032 (MILES DE USD)
TABLA 695. PANEER DE SINGAPUR EN EL MERCADO DE ALIMENTOS LISTOS PARA CONSUMIR, POR TIPO, 2018-2032 (TONELADAS)
TABLA 696 PANEER DE SINGAPUR EN EL MERCADO DE ALIMENTOS LISTOS PARA CONSUMIR, POR TIPO, 2018-2032 (USD/KG)
TABLA 697 GHEE DE SINGAPUR EN EL MERCADO DE ALIMENTOS LISTOS PARA CONSUMIR, POR FUENTE, 2018-2032 (MILES DE USD)
TABLA 698 GHEE DE SINGAPUR EN EL MERCADO DE ALIMENTOS LISTOS PARA CONSUMIR, POR FUENTE, 2018-2032 (TONELADAS)
TABLA 699 GHEE DE SINGAPUR EN EL MERCADO DE ALIMENTOS LISTOS PARA CONSUMIR, POR FUENTE, 2018-2032 (USD/KG)
TABLA 700 PRODUCTOS DE PANADERÍA DE SINGAPUR EN EL MERCADO DE ALIMENTOS LISTOS PARA CONSUMIR, POR TIPO, 2018-2032 (MILES DE USD)
TABLA 701 PRODUCTOS DE PANADERÍA DE SINGAPUR EN EL MERCADO DE ALIMENTOS LISTOS PARA CONSUMIR, POR TIPO, 2018-2032 (TONELADAS)
TABLA 702 PRODUCTOS DE PANADERÍA DE SINGAPUR EN EL MERCADO DE ALIMENTOS LISTOS PARA CONSUMIR, POR TIPO, 2018-2032 (USD/KG)
TABLA 703 DULCES SALADOS DE SINGAPUR EN EL MERCADO DE ALIMENTOS LISTOS PARA CONSUMIR, POR TIPO, 2018-2032 (MILES DE USD)
TABLA 704 DULCES SALADOS DE SINGAPUR EN EL MERCADO DE ALIMENTOS LISTOS PARA CONSUMIR, POR TIPO, 2018-2032 (TONELADAS)
TABLA 705 DULCES SALADOS DE SINGAPUR EN EL MERCADO DE ALIMENTOS LISTOS PARA CONSUMIR, POR TIPO, 2018-2032 (USD/KG)
TABLA 706 PRODUCTOS DE CONFITERÍA DE SINGAPUR EN EL MERCADO DE ALIMENTOS LISTOS PARA CONSUMIR, POR TIPO, 2018-2032 (MILES DE USD)
TABLA 707 PRODUCTOS DE CONFITERÍA DE SINGAPUR EN EL MERCADO DE ALIMENTOS LISTOS PARA CONSUMIR, POR TIPO, 2018-2032 (TONELADAS)
TABLA 708 PRODUCTOS DE CONFITERÍA DE SINGAPUR EN EL MERCADO DE ALIMENTOS LISTOS PARA CONSUMIR, POR TIPO, 2018-2032 (USD/KG)
TABLA 709 PRODUCTOS A BASE DE VEGETALES EN EL MERCADO DE ALIMENTOS LISTOS PARA CONSUMIR DE SINGAPUR, POR TIPO, 2018-2032 (MILES DE USD)
TABLA 710 PRODUCTOS A BASE DE VEGETALES EN EL MERCADO DE ALIMENTOS LISTOS PARA CONSUMIR DE SINGAPUR, POR TIPO, 2018-2032 (TONELADAS)
TABLA 711 PRODUCTOS A BASE DE VEGETALES DE SINGAPUR EN EL MERCADO DE ALIMENTOS LISTOS PARA CONSUMIR, POR TIPO, 2018-2032 (USD/KG)
TABLA 712 SOPAS INSTANTÁNEAS DE SINGAPUR EN EL MERCADO DE ALIMENTOS LISTOS PARA CONSUMIR, POR TIPO, 2018-2032 (MILES DE USD)
TABLA 713 SOPAS INSTANTÁNEAS DE SINGAPUR EN EL MERCADO DE ALIMENTOS LISTOS PARA CONSUMIR, POR TIPO, 2018-2032 (TONELADAS)
TABLA 714 SOPAS INSTANTÁNEAS DE SINGAPUR EN EL MERCADO DE ALIMENTOS LISTOS PARA CONSUMIR, POR TIPO, 2018-2032 (USD/KG)
TABLA 715 APERITIVOS SALADOS DE SINGAPUR EN EL MERCADO DE ALIMENTOS LISTOS PARA CONSUMIR, POR TIPO, 2018-2032 (MILES DE USD)
TABLA 716 APERITIVOS SALADOS DE SINGAPUR EN EL MERCADO DE ALIMENTOS LISTOS PARA CONSUMIR, POR TIPO, 2018-2032 (TONELADAS)
TABLA 717 APERITIVOS SALADOS DE SINGAPUR EN EL MERCADO DE ALIMENTOS LISTOS PARA CONSUMIR, POR TIPO, 2018-2032 (USD/KG)
TABLA 718 PATATAS FRITAS DE SINGAPUR EN EL MERCADO DE ALIMENTOS LISTOS PARA CONSUMIR, POR TIPO, 2018-2032 (MILES DE USD)
TABLA 719 PATATAS FRITAS DE SINGAPUR EN EL MERCADO DE ALIMENTOS LISTOS PARA CONSUMIR, POR TIPO, 2018-2032 (TONELADAS)
TABLA 720 PATATAS FRITAS DE SINGAPUR EN EL MERCADO DE ALIMENTOS LISTOS PARA CONSUMIR, POR TIPO, 2018-2032 (USD/KG)
TABLA 721 OBLEAS DE SINGAPUR EN EL MERCADO DE ALIMENTOS LISTOS PARA CONSUMIR, POR TIPO, 2018-2032 (MILES DE USD)
TABLA 722 OBLEAS DE SINGAPUR EN EL MERCADO DE ALIMENTOS LISTOS PARA CONSUMIR, POR TIPO, 2018-2032 (TONELADAS)
TABLA 723 OBLEAS DE SINGAPUR EN EL MERCADO DE ALIMENTOS LISTOS PARA CONSUMIR, POR TIPO, 2018-2032 (USD/KG)
TABLA 724 NÚMEROS DE SINGAPUR EN EL MERCADO DE ALIMENTOS LISTOS PARA CONSUMIR, POR TIPO, 2018-2032 (MILES DE USD)
TABLA 725 NÚMEROS DE SINGAPUR EN EL MERCADO DE ALIMENTOS LISTOS PARA CONSUMIR, POR TIPO, 2018-2032 (TONELADAS)
TABLA 726 NAMKEENS DE SINGAPUR EN EL MERCADO DE ALIMENTOS LISTOS PARA CONSUMIR, POR TIPO, 2018-2032 (USD/KG)
TABLA 727 GALLETAS Y GALLETAS DE SINGAPUR EN EL MERCADO DE ALIMENTOS LISTOS PARA CONSUMIR, POR TIPO, 2018-2032 (MILES DE USD)
TABLA 728 GALLETAS Y GALLETAS DE SINGAPUR EN EL MERCADO DE ALIMENTOS LISTOS PARA CONSUMIR, POR TIPO, 2018-2032 (TONELADAS)
TABLA 729 GALLETAS Y GALLETAS DE SINGAPUR EN EL MERCADO DE ALIMENTOS LISTOS PARA CONSUMIR, POR TIPO, 2018-2032 (USD/KG)
TABLA 730 ALIMENTOS REFRIGERADOS EN EL MERCADO DE ALIMENTOS LISTOS PARA CONSUMIR DE SINGAPUR, POR TIPO, 2018-2032 (MILES DE USD)
TABLA 731 ALIMENTOS REFRIGERADOS EN EL MERCADO DE ALIMENTOS LISTOS PARA CONSUMIR DE SINGAPUR, POR TIPO, 2018-2032 (TONELADAS)
TABLA 732 ALIMENTOS REFRIGERADOS DE SINGAPUR EN EL MERCADO DE ALIMENTOS LISTOS PARA CONSUMIR, POR TIPO, 2018-2032 (USD/KG)
TABLA 733 APERITIVOS DE CARNE DE ORIGEN VEGETAL EN EL MERCADO DE ALIMENTOS LISTOS PARA CONSUMIR DE SINGAPUR, POR TIPO, 2018-2032 (MILES DE USD)
TABLA 734 APERITIVOS DE CARNE DE ORIGEN VEGETAL EN EL MERCADO DE ALIMENTOS LISTOS PARA CONSUMIR DE SINGAPUR, POR TIPO, 2018-2032 (TONELADAS)
TABLA 735 SNACKS DE CARNE DE ORIGEN VEGETAL EN EL MERCADO DE ALIMENTOS LISTOS PARA CONSUMIR DE SINGAPUR, POR TIPO, 2018-2032 (USD/KG)
TABLA 736 APERITIVOS DE CARNE DE ORIGEN VEGETAL EN EL MERCADO DE ALIMENTOS LISTOS PARA CONSUMIR DE SINGAPUR, POR FUENTE, 2018-2032 (MILES DE USD)
TABLA 737 APERITIVOS DE CARNE DE ORIGEN VEGETAL EN EL MERCADO DE ALIMENTOS LISTOS PARA CONSUMIR DE SINGAPUR, POR FUENTE, 2018-2032 (TONELADAS)
TABLA 738 APERITIVOS DE CARNE DE ORIGEN VEGETAL EN EL MERCADO DE ALIMENTOS LISTOS PARA CONSUMIR DE SINGAPUR, POR FUENTE, 2018-2032 (USD/KG)
TABLA 739 COMIDAS LISTAS PARA COMER EN EL MERCADO DE ALIMENTOS LISTOS PARA COMER DE SINGAPUR, POR TIPO, 2018-2032 (MILES DE USD)
TABLA 740 COMIDAS LISTAS PARA COMER EN EL MERCADO DE ALIMENTOS LISTOS PARA COMER DE SINGAPUR, POR TIPO, 2018-2032 (TONELADAS)
TABLA 741 COMIDAS LISTAS PARA COMER EN EL MERCADO DE ALIMENTOS LISTOS PARA COMER DE SINGAPUR, POR TIPO, 2018-2032 (USD/KG)
TABLA 742 MERCADO DE ALIMENTOS LISTOS PARA COMER DE SINGAPUR, POR CATEGORÍA, 2018-2032 (MILES DE USD)
TABLA 743 MERCADO DE ALIMENTOS ESPECIALES LISTOS PARA CONSUMIR DE SINGAPUR, POR TIPO, 2018-2032 (MILES DE USD)
TABLA 744 MERCADO DE ALIMENTOS LISTOS PARA CONSUMIR DE SINGAPUR, POR TIPO DE ENVASE, 2018-2032 (MILES DE USD)
TABLA 745 BOTELLAS DE SINGAPUR EN EL MERCADO DE ALIMENTOS LISTOS PARA CONSUMIR, POR TIPO, 2018-2032 (MILES DE USD)
TABLA 746 MERCADO DE ALIMENTOS LISTOS PARA CONSUMIR DE SINGAPUR, POR TAMAÑO DE ENVASE, 2018-2032 (MILES DE USD)
TABLA 747 MERCADO DE ALIMENTOS LISTOS PARA CONSUMIR DE SINGAPUR, POR TECNOLOGÍA DE ENVASADO, 2018-2032 (MILES DE USD)
TABLA 748 MERCADO DE ALIMENTOS LISTOS PARA CONSUMIR DE SINGAPUR, POR TIPO DE ALMACENAMIENTO, 2018-2032 (MILES DE USD)
TABLA 749 MERCADO DE ALIMENTOS LISTOS PARA CONSUMIR DE SINGAPUR, POR CANAL DE DISTRIBUCIÓN, 2018-2032 (MILES DE USD)
TABLA 750 MERCADO DE ALIMENTOS LISTOS PARA CONSUMIR CON TIENDAS EN SINGAPUR, POR TIPO, 2018-2032 (MILES DE USD)
TABLA 751 MERCADO DE ALIMENTOS LISTOS PARA CONSUMIR SIN TIENDAS DE SINGAPUR, POR TIPO, 2018-2032 (MILES DE USD)
TABLA 752 MERCADO DE ALIMENTOS LISTOS PARA CONSUMIR DE SINGAPUR, POR USUARIO FINAL, 2018-2032 (MILES DE USD)
TABLA 753 SERVICIOS DE LA INDUSTRIA ALIMENTARIA DE SINGAPUR EN EL MERCADO DE ALIMENTOS LISTOS PARA CONSUMIR, POR TIPO, 2018-2032 (MILES DE USD)
TABLA 754 RESTAURANTES DE SINGAPUR EN EL MERCADO DE COMIDA LISTA PARA COMER, POR TIPO, 2018-2032 (MILES DE USD)
TABLA 755 MERCADO DE ALIMENTOS LISTOS PARA CONSUMIR DE TAILANDIA, POR TIPO DE PRODUCTO, 2018-2032 (MILES DE USD)
TABLA 756 MERCADO DE ALIMENTOS LISTOS PARA CONSUMIR DE TAILANDIA, POR TIPO DE PRODUCTO, 2018-2032 (TONELADAS)
TABLA 757 MERCADO DE ALIMENTOS LISTOS PARA CONSUMIR DE TAILANDIA, POR TIPO DE PRODUCTO, 2018-2032 (USD/KG)
TABLA 758 PRODUCTOS CÁRNICOS DE TAILANDIA EN EL MERCADO DE ALIMENTOS LISTOS PARA CONSUMIR, POR TIPO, 2018-2032 (MILES DE USD)
TABLA 759 PRODUCTOS CÁRNICOS DE TAILANDIA EN EL MERCADO DE ALIMENTOS LISTOS PARA CONSUMIR, POR TIPO, 2018-2032 (TONELADAS)
TABLA 760 PRODUCTOS CÁRNICOS DE TAILANDIA EN EL MERCADO DE ALIMENTOS LISTOS PARA CONSUMIR, POR TIPO, 2018-2032 (USD/KG)
TABLA 761 PRODUCTOS A BASE DE CEREALES DE TAILANDIA EN EL MERCADO DE ALIMENTOS LISTOS PARA CONSUMIR, POR TIPO, 2018-2032 (MILES DE USD)
TABLA 762 PRODUCTOS A BASE DE CEREALES DE TAILANDIA EN EL MERCADO DE ALIMENTOS LISTOS PARA CONSUMIR, POR TIPO, 2018-2032 (TONELADAS)
TABLA 763 PRODUCTOS A BASE DE CEREALES DE TAILANDIA EN EL MERCADO DE ALIMENTOS LISTOS PARA CONSUMIR, POR TIPO, 2018-2032 (USD/KG)
TABLA 764 PRODUCTOS LÁCTEOS DE TAILANDIA EN EL MERCADO DE ALIMENTOS LISTOS PARA CONSUMIR, POR TIPO, 2018-2032 (MILES DE USD)
TABLA 765 PRODUCTOS LÁCTEOS DE TAILANDIA EN EL MERCADO DE ALIMENTOS LISTOS PARA CONSUMIR, POR TIPO, 2018-2032 (TONELADAS)
TABLA 766 PRODUCTOS LÁCTEOS DE TAILANDIA EN EL MERCADO DE ALIMENTOS LISTOS PARA CONSUMIR, POR TIPO, 2018-2032 (USD/KG)
TABLA 767 QUESO TAILANDÉS EN EL MERCADO DE ALIMENTOS LISTOS PARA CONSUMIR, POR FORMA, 2018-2032 (MILES DE USD)
TABLA 768 QUESO TAILANDÉS EN EL MERCADO DE ALIMENTOS LISTOS PARA CONSUMIR, POR FORMA, 2018-2032 (TONELADAS)
TABLA 769 QUESO DE TAILANDIA EN EL MERCADO DE ALIMENTOS LISTOS PARA CONSUMIR, POR FORMA, 2018-2032 (USD/KG)
TABLA 770 QUESO TAILANDÉS EN EL MERCADO DE ALIMENTOS LISTOS PARA CONSUMIR, POR TIPO, 2018-2032 (MILES DE USD)
TABLA 771 QUESO TAILANDÉS EN EL MERCADO DE ALIMENTOS LISTOS PARA CONSUMIR, POR TIPO, 2018-2032 (TONELADAS)
TABLA 772 QUESO DE TAILANDIA EN EL MERCADO DE ALIMENTOS LISTOS PARA CONSUMIR, POR TIPO, 2018-2032 (USD/KG)
TABLA 773 QUESO DE ORIGEN ANIMAL EN EL MERCADO DE ALIMENTOS LISTOS PARA CONSUMIR DE TAILANDIA, POR TIPO, 2018-2032 (MILES DE USD)
TABLA 774 QUESO VEGETAL DE TAILANDIA EN EL MERCADO DE ALIMENTOS LISTOS PARA CONSUMIR, POR TIPO, 2018-2032 (MILES DE USD)
TABLA 775 HELADOS DE TAILANDIA EN EL MERCADO DE ALIMENTOS LISTOS PARA CONSUMIR, POR TIPO, 2018-2032 (MILES DE USD)
TABLA 776 HELADOS DE TAILANDIA EN EL MERCADO DE ALIMENTOS LISTOS PARA CONSUMIR, POR TIPO, 2018-2032 (TONELADAS)
TABLA 777 HELADOS DE TAILANDIA EN EL MERCADO DE ALIMENTOS LISTOS PARA CONSUMIR, POR TIPO, 2018-2032 (USD/KG)
TABLA 778 CUAJADA DE TAILANDIA EN EL MERCADO DE ALIMENTOS LISTOS PARA CONSUMIR, POR TIPO, 2018-2032 (MILES DE USD)
TABLA 779 CUAJADA DE TAILANDIA EN EL MERCADO DE ALIMENTOS LISTOS PARA CONSUMIR, POR TIPO, 2018-2032 (TONELADAS)
TABLA 780 CUAJADA DE TAILANDIA EN EL MERCADO DE ALIMENTOS LISTOS PARA CONSUMIR, POR TIPO, 2018-2032 (USD/KG)
TABLA 781 PANEER DE TAILANDIA EN EL MERCADO DE ALIMENTOS LISTOS PARA CONSUMIR, POR TIPO, 2018-2032 (MILES DE USD)
TABLA 782 PANEER DE TAILANDIA EN EL MERCADO DE ALIMENTOS LISTOS PARA CONSUMIR, POR TIPO, 2018-2032 (TONELADAS)
TABLA 783 PANEER DE TAILANDIA EN EL MERCADO DE ALIMENTOS LISTOS PARA CONSUMIR, POR TIPO, 2018-2032 (USD/KG)
TABLA 784 GHEE DE TAILANDIA EN EL MERCADO DE ALIMENTOS LISTOS PARA CONSUMIR, POR FUENTE, 2018-2032 (MILES DE USD)
TABLA 785 GHEE DE TAILANDIA EN EL MERCADO DE ALIMENTOS LISTOS PARA CONSUMIR, POR FUENTE, 2018-2032 (TONELADAS)
TABLA 786 GHEE DE TAILANDIA EN EL MERCADO DE ALIMENTOS LISTOS PARA CONSUMIR, POR FUENTE, 2018-2032 (USD/KG)
TABLA 787 PRODUCTOS DE PANADERÍA EN EL MERCADO DE ALIMENTOS LISTOS PARA CONSUMIR DE TAILANDIA, POR TIPO, 2018-2032 (MILES DE USD)
TABLA 788 PRODUCTOS DE PANADERÍA EN EL MERCADO DE ALIMENTOS LISTOS PARA CONSUMIR DE TAILANDIA, POR TIPO, 2018-2032 (TONELADAS)
TABLA 789 PRODUCTOS DE PANADERÍA DE TAILANDIA EN EL MERCADO DE ALIMENTOS LISTOS PARA CONSUMIR, POR TIPO, 2018-2032 (USD/KG)
TABLA 790 DULCES SALADOS DE TAILANDIA EN EL MERCADO DE ALIMENTOS LISTOS PARA CONSUMIR, POR TIPO, 2018-2032 (MILES DE USD)
TABLA 791 DULCES SALADOS DE TAILANDIA EN EL MERCADO DE ALIMENTOS LISTOS PARA CONSUMIR, POR TIPO, 2018-2032 (TONELADAS)
TABLA 792 DULCES SALADOS DE TAILANDIA EN EL MERCADO DE ALIMENTOS LISTOS PARA CONSUMIR, POR TIPO, 2018-2032 (USD/KG)
TABLA 793 PRODUCTOS DE CONFITERÍA DE TAILANDIA EN EL MERCADO DE ALIMENTOS LISTOS PARA CONSUMIR, POR TIPO, 2018-2032 (MILES DE USD)
TABLA 794 PRODUCTOS DE CONFITERÍA DE TAILANDIA EN EL MERCADO DE ALIMENTOS LISTOS PARA CONSUMIR, POR TIPO, 2018-2032 (TONELADAS)
TABLA 795 PRODUCTOS DE CONFITERÍA DE TAILANDIA EN EL MERCADO DE ALIMENTOS LISTOS PARA CONSUMIR, POR TIPO, 2018-2032 (USD/KG)
TABLA 796 PRODUCTOS A BASE DE VERDURAS EN EL MERCADO DE ALIMENTOS LISTOS PARA CONSUMIR DE TAILANDIA, POR TIPO, 2018-2032 (MILES DE USD)
TABLA 797 PRODUCTOS A BASE DE VERDURAS EN EL MERCADO DE ALIMENTOS LISTOS PARA CONSUMIR DE TAILANDIA, POR TIPO, 2018-2032 (TONELADAS)
TABLA 798 PRODUCTOS A BASE DE VERDURAS EN EL MERCADO DE ALIMENTOS LISTOS PARA CONSUMIR DE TAILANDIA, POR TIPO, 2018-2032 (USD/KG)
TABLA 799 SOPAS INSTANTÁNEAS DE TAILANDIA EN EL MERCADO DE ALIMENTOS LISTOS PARA CONSUMIR, POR TIPO, 2018-2032 (MILES DE USD)
TABLA 800 SOPAS INSTANTÁNEAS DE TAILANDIA EN EL MERCADO DE ALIMENTOS LISTOS PARA CONSUMIR, POR TIPO, 2018-2032 (TONELADAS)
TABLA 801 SOPAS INSTANTÁNEAS DE TAILANDIA EN EL MERCADO DE ALIMENTOS LISTOS PARA CONSUMIR, POR TIPO, 2018-2032 (USD/KG)
TABLA 802 APERITIVOS SALADOS DE TAILANDIA EN EL MERCADO DE ALIMENTOS LISTOS PARA CONSUMIR, POR TIPO, 2018-2032 (MILES DE USD)
TABLA 803 APERITIVOS SALADOS DE TAILANDIA EN EL MERCADO DE ALIMENTOS LISTOS PARA CONSUMIR, POR TIPO, 2018-2032 (TONELADAS)
TABLA 804 APERITIVOS SALADOS DE TAILANDIA EN EL MERCADO DE ALIMENTOS LISTOS PARA CONSUMIR, POR TIPO, 2018-2032 (USD/KG)
TABLA 805 PATATAS FRITAS DE TAILANDIA EN EL MERCADO DE ALIMENTOS LISTOS PARA CONSUMIR, POR TIPO, 2018-2032 (MILES DE USD)
TABLA 806 PATATAS FRITAS DE TAILANDIA EN EL MERCADO DE ALIMENTOS LISTOS PARA CONSUMIR, POR TIPO, 2018-2032 (TONELADAS)
TABLA 807 PATATAS FRITAS DE TAILANDIA EN EL MERCADO DE ALIMENTOS LISTOS PARA CONSUMIR, POR TIPO, 2018-2032 (USD/KG)
TABLA 808 OBLEAS DE TAILANDIA EN EL MERCADO DE ALIMENTOS LISTOS PARA CONSUMIR, POR TIPO, 2018-2032 (MILES DE USD)
TABLA 809 OBLEAS DE TAILANDIA EN EL MERCADO DE ALIMENTOS LISTOS PARA CONSUMIR, POR TIPO, 2018-2032 (TONELADAS)
TABLA 810 OBLEAS DE TAILANDIA EN EL MERCADO DE ALIMENTOS LISTOS PARA CONSUMIR, POR TIPO, 2018-2032 (USD/KG)
TABLA 811 NÚMEROS DE RESERVA DE TAILANDIA EN EL MERCADO DE ALIMENTOS LISTOS PARA CONSUMIR, POR TIPO, 2018-2032 (MILES DE USD)
TABLA 812 NAMKEENS DE TAILANDIA EN EL MERCADO DE ALIMENTOS LISTOS PARA CONSUMIR, POR TIPO, 2018-2032 (TONELADAS)
TABLA 813 NAMKEENS DE TAILANDIA EN EL MERCADO DE ALIMENTOS LISTOS PARA CONSUMIR, POR TIPO, 2018-2032 (USD/KG)
TABLA 814 GALLETAS Y GALLETAS DE TAILANDIA EN EL MERCADO DE ALIMENTOS LISTOS PARA CONSUMIR, POR TIPO, 2018-2032 (MILES DE USD)
TABLA 815 GALLETAS Y GALLETAS DE TAILANDIA EN EL MERCADO DE ALIMENTOS LISTOS PARA CONSUMIR, POR TIPO, 2018-2032 (TONELADAS)
TABLA 816 GALLETAS Y GALLETAS DE TAILANDIA EN EL MERCADO DE ALIMENTOS LISTOS PARA CONSUMIR, POR TIPO, 2018-2032 (USD/KG)
TABLA 817 ALIMENTOS REFRIGERADOS EN EL MERCADO DE ALIMENTOS LISTOS PARA CONSUMIR DE TAILANDIA, POR TIPO, 2018-2032 (MILES DE USD)
TABLA 818 ALIMENTOS REFRIGERADOS EN EL MERCADO DE ALIMENTOS LISTOS PARA CONSUMIR DE TAILANDIA, POR TIPO, 2018-2032 (TONELADAS)
TABLA 819 ALIMENTOS REFRIGERADOS EN EL MERCADO DE ALIMENTOS LISTOS PARA CONSUMIR DE TAILANDIA, POR TIPO, 2018-2032 (USD/KG)
TABLA 820 APERITIVOS DE CARNE DE ORIGEN VEGETAL EN EL MERCADO DE ALIMENTOS LISTOS PARA CONSUMIR DE TAILANDIA, POR TIPO, 2018-2032 (MILES DE USD)
TABLA 821 APERITIVOS DE CARNE DE ORIGEN VEGETAL EN EL MERCADO DE ALIMENTOS LISTOS PARA CONSUMIR DE TAILANDIA, POR TIPO, 2018-2032 (TONELADAS)
TABLA 822 APERITIVOS DE CARNE DE ORIGEN VEGETAL EN EL MERCADO DE ALIMENTOS LISTOS PARA CONSUMIR DE TAILANDIA, POR TIPO, 2018-2032 (USD/KG)
TABLA 823 APERITIVOS DE CARNE DE ORIGEN VEGETAL EN EL MERCADO DE ALIMENTOS LISTOS PARA CONSUMIR DE TAILANDIA, POR FUENTE, 2018-2032 (MILES DE USD)
TABLA 824 APERITIVOS DE CARNE DE ORIGEN VEGETAL EN EL MERCADO DE ALIMENTOS LISTOS PARA CONSUMIR DE TAILANDIA, POR FUENTE, 2018-2032 (TONELADAS)
TABLA 825 APERITIVOS DE CARNE DE ORIGEN VEGETAL EN EL MERCADO DE ALIMENTOS LISTOS PARA CONSUMIR DE TAILANDIA, POR FUENTE, 2018-2032 (USD/KG)
TABLA 826 COMIDAS LISTAS PARA COMER EN EL MERCADO DE ALIMENTOS LISTOS PARA COMER DE TAILANDIA, POR TIPO, 2018-2032 (MILES DE USD)
TABLA 827 COMIDAS LISTAS PARA COMER EN EL MERCADO DE ALIMENTOS LISTOS PARA COMER DE TAILANDIA, POR TIPO, 2018-2032 (TONELADAS)
TABLA 828 COMIDAS LISTAS PARA COMER EN EL MERCADO DE ALIMENTOS LISTOS PARA COMER DE TAILANDIA, POR TIPO, 2018-2032 (USD/KG)
TABLA 829 MERCADO DE ALIMENTOS LISTOS PARA CONSUMIR DE TAILANDIA, POR CATEGORÍA, 2018-2032 (MILES DE USD)
TABLA 830 ESPECIALIDADES DE TAILANDIA EN EL MERCADO DE ALIMENTOS LISTOS PARA CONSUMIR, POR TIPO, 2018-2032 (MILES DE USD)
TABLA 831 MERCADO DE ALIMENTOS LISTOS PARA CONSUMIR DE TAILANDIA, POR TIPO DE ENVASE, 2018-2032 (MILES DE USD)
TABLA 832 BOTELLAS DE TAILANDIA EN EL MERCADO DE ALIMENTOS LISTOS PARA CONSUMIR, POR TIPO, 2018-2032 (MILES DE USD)
TABLA 833 MERCADO DE ALIMENTOS LISTOS PARA CONSUMIR DE TAILANDIA, POR TAMAÑO DE ENVASE, 2018-2032 (MILES DE USD)
TABLA 834 MERCADO DE ALIMENTOS LISTOS PARA CONSUMIR DE TAILANDIA, POR TECNOLOGÍA DE ENVASADO, 2018-2032 (MILES DE USD)
TABLA 835 MERCADO DE ALIMENTOS LISTOS PARA CONSUMIR DE TAILANDIA, POR TIPO DE ALMACENAMIENTO, 2018-2032 (MILES DE USD)
TABLA 836 MERCADO DE ALIMENTOS LISTOS PARA CONSUMIR DE TAILANDIA, POR CANAL DE DISTRIBUCIÓN, 2018-2032 (MILES DE USD)
TABLA 837 MERCADO DE ALIMENTOS LISTOS PARA CONSUMIR EN TAILANDIA, POR TIPO, 2018-2032 (MILES DE USD)
TABLA 838 MERCADO DE ALIMENTOS LISTOS PARA CONSUMIR SIN TIENDAS DE TAILANDIA, POR TIPO, 2018-2032 (MILES DE USD)
TABLA 839 MERCADO DE ALIMENTOS LISTOS PARA CONSUMIR DE TAILANDIA, POR USUARIO FINAL, 2018-2032 (MILES DE USD)
TABLA 840 SERVICIOS DE LA INDUSTRIA ALIMENTARIA DE TAILANDIA EN EL MERCADO DE ALIMENTOS LISTOS PARA CONSUMIR, POR TIPO, 2018-2032 (MILES DE USD)
TABLA 841 RESTAURANTES DE TAILANDIA EN EL MERCADO DE COMIDA LISTA PARA COMER, POR TIPO, 2018-2032 (MILES DE USD)
TABLA 842 MERCADO DE ALIMENTOS LISTOS PARA CONSUMIR DE INDONESIA, POR TIPO DE PRODUCTO, 2018-2032 (MILES DE USD)
TABLA 843 MERCADO DE ALIMENTOS LISTOS PARA CONSUMIR DE INDONESIA, POR TIPO DE PRODUCTO, 2018-2032 (TONELADAS)
TABLA 844 MERCADO DE ALIMENTOS LISTOS PARA CONSUMIR DE INDONESIA, POR TIPO DE PRODUCTO, 2018-2032 (USD/KG)
TABLA 845 PRODUCTOS CÁRNICOS DE INDONESIA EN EL MERCADO DE ALIMENTOS LISTOS PARA CONSUMIR, POR TIPO, 2018-2032 (MILES DE USD)
TABLA 846 PRODUCTOS CÁRNICOS EN EL MERCADO DE ALIMENTOS LISTOS PARA CONSUMIR DE INDONESIA, POR TIPO, 2018-2032 (TONELADAS)
TABLA 847 PRODUCTOS CÁRNICOS DE INDONESIA EN EL MERCADO DE ALIMENTOS LISTOS PARA CONSUMIR, POR TIPO, 2018-2032 (USD/KG)
TABLA 848 PRODUCTOS A BASE DE CEREALES EN EL MERCADO DE ALIMENTOS LISTOS PARA EL CONSUMO DE INDONESIA, POR TIPO, 2018-2032 (MILES DE USD)
TABLA 849 PRODUCTOS A BASE DE CEREALES EN EL MERCADO DE ALIMENTOS LISTOS PARA EL CONSUMO DE INDONESIA, POR TIPO, 2018-2032 (TONELADAS)
TABLA 850 PRODUCTOS A BASE DE CEREALES EN EL MERCADO DE ALIMENTOS LISTOS PARA EL CONSUMO DE INDONESIA, POR TIPO, 2018-2032 (USD/KG)
TABLA 851 PRODUCTOS LÁCTEOS EN EL MERCADO DE ALIMENTOS LISTOS PARA CONSUMIR DE INDONESIA, POR TIPO, 2018-2032 (MILES DE USD)
TABLA 852 PRODUCTOS LÁCTEOS EN EL MERCADO DE ALIMENTOS LISTOS PARA CONSUMIR DE INDONESIA, POR TIPO, 2018-2032 (TONELADAS)
TABLA 853 PRODUCTOS LÁCTEOS EN EL MERCADO DE ALIMENTOS LISTOS PARA CONSUMIR DE INDONESIA, POR TIPO, 2018-2032 (USD/KG)
TABLA 854 QUESO DE INDONESIA EN EL MERCADO DE ALIMENTOS LISTOS PARA CONSUMIR, POR FORMA, 2018-2032 (MILES DE USD)
TABLA 855 QUESO DE INDONESIA EN EL MERCADO DE ALIMENTOS LISTOS PARA CONSUMIR, POR FORMA, 2018-2032 (TONELADAS)
TABLA 856 QUESO DE INDONESIA EN EL MERCADO DE ALIMENTOS LISTOS PARA CONSUMIR, POR FORMA, 2018-2032 (USD/KG)
TABLA 857 QUESO DE INDONESIA EN EL MERCADO DE ALIMENTOS LISTOS PARA CONSUMIR, POR TIPO, 2018-2032 (MILES DE USD)
TABLA 858 QUESO DE INDONESIA EN EL MERCADO DE ALIMENTOS LISTOS PARA CONSUMIR, POR TIPO, 2018-2032 (TONELADAS)
TABLA 859 QUESO DE INDONESIA EN EL MERCADO DE ALIMENTOS LISTOS PARA CONSUMIR, POR TIPO, 2018-2032 (USD/KG)
TABLA 860 QUESO DE ORIGEN ANIMAL EN EL MERCADO DE ALIMENTOS LISTOS PARA CONSUMIR DE INDONESIA, POR TIPO, 2018-2032 (MILES DE USD)
TABLA 861 QUESO VEGETAL EN EL MERCADO DE ALIMENTOS LISTOS PARA CONSUMIR DE INDONESIA, POR TIPO, 2018-2032 (MILES DE USD)
TABLA 862 HELADOS DE INDONESIA EN EL MERCADO DE ALIMENTOS LISTOS PARA CONSUMIR, POR TIPO, 2018-2032 (MILES DE USD)
TABLA 863 HELADOS DE INDONESIA EN EL MERCADO DE ALIMENTOS LISTOS PARA CONSUMIR, POR TIPO, 2018-2032 (TONELADAS)
TABLA 864 HELADOS DE INDONESIA EN EL MERCADO DE ALIMENTOS LISTOS PARA CONSUMIR, POR TIPO, 2018-2032 (USD/KG)
TABLA 865 CUAJADA DE INDONESIA EN EL MERCADO DE ALIMENTOS LISTOS PARA CONSUMIR, POR TIPO, 2018-2032 (MILES DE USD)
TABLA 866 CUAJADA DE INDONESIA EN EL MERCADO DE ALIMENTOS LISTOS PARA CONSUMIR, POR TIPO, 2018-2032 (TONELADAS)
TABLA 867 CUAJADA DE INDONESIA EN EL MERCADO DE ALIMENTOS LISTOS PARA CONSUMIR, POR TIPO, 2018-2032 (USD/KG)
TABLA 868. PANEER DE INDONESIA EN EL MERCADO DE ALIMENTOS LISTOS PARA CONSUMIR, POR TIPO, 2018-2032 (MILES DE USD)
TABLA 869 PANEER DE INDONESIA EN EL MERCADO DE ALIMENTOS LISTOS PARA CONSUMIR, POR TIPO, 2018-2032 (TONELADAS)
TABLA 870 PANEER DE INDONESIA EN EL MERCADO DE ALIMENTOS LISTOS PARA CONSUMIR, POR TIPO, 2018-2032 (USD/KG)
TABLA 871 GHEE EN EL MERCADO DE ALIMENTOS LISTOS PARA CONSUMIR DE INDONESIA, POR FUENTE, 2018-2032 (MILES DE USD)
TABLA 872 GHEE EN EL MERCADO DE ALIMENTOS LISTOS PARA CONSUMIR DE INDONESIA, POR FUENTE, 2018-2032 (TONELADAS)
TABLA 873 GHEE EN EL MERCADO DE ALIMENTOS LISTOS PARA CONSUMIR DE INDONESIA, POR FUENTE, 2018-2032 (USD/KG)
TABLA 874 PRODUCTOS DE PANADERÍA EN EL MERCADO DE ALIMENTOS LISTOS PARA CONSUMIR DE INDONESIA, POR TIPO, 2018-2032 (MILES DE USD)
TABLA 875 PRODUCTOS DE PANADERÍA EN EL MERCADO DE ALIMENTOS LISTOS PARA CONSUMIR DE INDONESIA, POR TIPO, 2018-2032 (TONELADAS)
TABLA 876 PRODUCTOS DE PANADERÍA EN EL MERCADO DE ALIMENTOS LISTOS PARA CONSUMIR DE INDONESIA, POR TIPO, 2018-2032 (USD/KG)
TABLA 877 DULCES SALADOS EN EL MERCADO DE ALIMENTOS LISTOS PARA CONSUMIR DE INDONESIA, POR TIPO, 2018-2032 (MILES DE USD)
TABLA 878 DULCES SALADOS DE INDONESIA EN EL MERCADO DE ALIMENTOS LISTOS PARA CONSUMIR, POR TIPO, 2018-2032 (TONELADAS)
TABLA 879 DULCES SALADOS EN EL MERCADO DE ALIMENTOS LISTOS PARA CONSUMIR DE INDONESIA, POR TIPO, 2018-2032 (USD/KG)
TABLA 880 PRODUCTOS DE CONFITERÍA EN EL MERCADO DE ALIMENTOS LISTOS PARA CONSUMIR DE INDONESIA, POR TIPO, 2018-2032 (MILES DE USD)
TABLA 881 PRODUCTOS DE CONFITERÍA EN EL MERCADO DE ALIMENTOS LISTOS PARA CONSUMIR DE INDONESIA, POR TIPO, 2018-2032 (TONELADAS)
TABLA 882 PRODUCTOS DE CONFITERÍA EN EL MERCADO DE ALIMENTOS LISTOS PARA CONSUMIR DE INDONESIA, POR TIPO, 2018-2032 (USD/KG)
TABLA 883 PRODUCTOS A BASE DE VEGETALES EN EL MERCADO DE ALIMENTOS LISTOS PARA CONSUMIR DE INDONESIA, POR TIPO, 2018-2032 (MILES DE USD)
TABLA 884 PRODUCTOS A BASE DE VEGETALES EN EL MERCADO DE ALIMENTOS LISTOS PARA CONSUMIR DE INDONESIA, POR TIPO, 2018-2032 (TONELADAS)
TABLA 885 PRODUCTOS A BASE DE VEGETALES EN EL MERCADO DE ALIMENTOS LISTOS PARA CONSUMIR DE INDONESIA, POR TIPO, 2018-2032 (USD/KG)
TABLA 886 SOPAS INSTANTÁNEAS EN EL MERCADO DE ALIMENTOS LISTOS PARA CONSUMIR DE INDONESIA, POR TIPO, 2018-2032 (MILES DE USD)
TABLA 887 SOPAS INSTANTÁNEAS EN EL MERCADO DE ALIMENTOS LISTOS PARA CONSUMIR DE INDONESIA, POR TIPO, 2018-2032 (TONELADAS)
TABLA 888 SOPAS INSTANTÁNEAS EN EL MERCADO DE ALIMENTOS LISTOS PARA CONSUMIR DE INDONESIA, POR TIPO, 2018-2032 (USD/KG)
TABLA 889 APERITIVOS SALADOS EN EL MERCADO DE ALIMENTOS LISTOS PARA CONSUMIR DE INDONESIA, POR TIPO, 2018-2032 (MILES DE USD)
TABLA 890 APERITIVOS SALADOS EN EL MERCADO DE ALIMENTOS LISTOS PARA CONSUMIR DE INDONESIA, POR TIPO, 2018-2032 (TONELADAS)
TABLA 891 APERITIVOS SALADOS EN EL MERCADO DE ALIMENTOS LISTOS PARA CONSUMIR DE INDONESIA, POR TIPO, 2018-2032 (USD/KG)
TABLA 892 PATATAS FRITAS DE INDONESIA EN EL MERCADO DE ALIMENTOS LISTOS PARA CONSUMIR, POR TIPO, 2018-2032 (MILES DE USD)
TABLA 893 PATATAS FRITAS DE INDONESIA EN EL MERCADO DE ALIMENTOS LISTOS PARA CONSUMIR, POR TIPO, 2018-2032 (TONELADAS)
TABLA 894 PAPAS FRITAS DE INDONESIA EN EL MERCADO DE ALIMENTOS LISTOS PARA CONSUMIR, POR TIPO, 2018-2032 (USD/KG)
TABLA 895 OBLEAS DE INDONESIA EN EL MERCADO DE ALIMENTOS LISTOS PARA CONSUMIR, POR TIPO, 2018-2032 (MILES DE USD)
TABLA 896 OBLEAS DE INDONESIA EN EL MERCADO DE ALIMENTOS LISTOS PARA CONSUMIR, POR TIPO, 2018-2032 (TONELADAS)
TABLA 897 OBLEAS DE INDONESIA EN EL MERCADO DE ALIMENTOS LISTOS PARA CONSUMIR, POR TIPO, 2018-2032 (USD/KG)
TABLA 898 NAMKEENS DE INDONESIA EN EL MERCADO DE ALIMENTOS LISTOS PARA CONSUMIR, POR TIPO, 2018-2032 (MILES DE USD)
TABLA 899 NAMKEENS DE INDONESIA EN EL MERCADO DE ALIMENTOS LISTOS PARA CONSUMIR, POR TIPO, 2018-2032 (TONELADAS)
TABLA 900 NAMKEENS DE INDONESIA EN EL MERCADO DE ALIMENTOS LISTOS PARA CONSUMIR, POR TIPO, 2018-2032 (USD/KG)
TABLA 901 GALLETAS Y GALLETAS DE INDONESIA EN EL MERCADO DE ALIMENTOS LISTOS PARA CONSUMIR, POR TIPO, 2018-2032 (MILES DE USD)
TABLA 902 GALLETAS Y GALLETAS DE INDONESIA EN EL MERCADO DE ALIMENTOS LISTOS PARA CONSUMIR, POR TIPO, 2018-2032 (TONELADAS)
TABLA 903 GALLETAS Y GALLETAS DE INDONESIA EN EL MERCADO DE ALIMENTOS LISTOS PARA CONSUMIR, POR TIPO, 2018-2032 (USD/KG)
TABLA 904 ALIMENTOS REFRIGERADOS EN EL MERCADO DE ALIMENTOS LISTOS PARA CONSUMIR DE INDONESIA, POR TIPO, 2018-2032 (MILES DE USD)
TABLA 905 ALIMENTOS REFRIGERADOS EN EL MERCADO DE ALIMENTOS LISTOS PARA CONSUMIR DE INDONESIA, POR TIPO, 2018-2032 (TONELADAS)
TABLA 906 ALIMENTOS REFRIGERADOS EN EL MERCADO DE ALIMENTOS LISTOS PARA CONSUMIR DE INDONESIA, POR TIPO, 2018-2032 (USD/KG)
TABLA 907 APERITIVOS DE CARNE DE ORIGEN VEGETAL EN EL MERCADO DE ALIMENTOS LISTOS PARA CONSUMIR DE INDONESIA, POR TIPO, 2018-2032 (MILES DE USD)
TABLA 908 APERITIVOS DE CARNE DE ORIGEN VEGETAL EN EL MERCADO DE ALIMENTOS LISTOS PARA CONSUMIR DE INDONESIA, POR TIPO, 2018-2032 (TONELADAS)
TABLA 909 APERITIVOS DE CARNE DE ORIGEN VEGETAL EN EL MERCADO DE ALIMENTOS LISTOS PARA CONSUMIR DE INDONESIA, POR TIPO, 2018-2032 (USD/KG)
TABLA 910 APERITIVOS DE CARNE DE ORIGEN VEGETAL EN EL MERCADO DE ALIMENTOS LISTOS PARA CONSUMIR DE INDONESIA, POR FUENTE, 2018-2032 (MILES DE USD)
TABLA 911 APERITIVOS DE CARNE DE ORIGEN VEGETAL EN EL MERCADO DE ALIMENTOS LISTOS PARA CONSUMIR DE INDONESIA, POR FUENTE, 2018-2032 (TONELADAS)
TABLA 912 APERITIVOS DE CARNE DE ORIGEN VEGETAL EN EL MERCADO DE ALIMENTOS LISTOS PARA CONSUMIR DE INDONESIA, POR FUENTE, 2018-2032 (USD/KG)
TABLA 913 COMIDAS LISTAS PARA CONSUMIR EN EL MERCADO DE ALIMENTOS LISTOS PARA CONSUMIR DE INDONESIA, POR TIPO, 2018-2032 (MILES DE USD)
TABLA 914 COMIDAS LISTAS PARA CONSUMIR EN EL MERCADO DE ALIMENTOS LISTOS PARA CONSUMIR DE INDONESIA, POR TIPO, 2018-2032 (TONELADAS)
TABLA 915 COMIDAS LISTAS PARA CONSUMIR EN EL MERCADO DE ALIMENTOS LISTOS PARA CONSUMIR DE INDONESIA, POR TIPO, 2018-2032 (USD/KG)
TABLA 916 MERCADO DE ALIMENTOS LISTOS PARA CONSUMIR DE INDONESIA, POR CATEGORÍA, 2018-2032 (MILES DE USD)
TABLA 917 MERCADO DE ESPECIALIDADES DE INDONESIA EN ALIMENTOS LISTOS PARA CONSUMIR, POR TIPO, 2018-2032 (MILES DE USD)
TABLA 918 MERCADO DE ALIMENTOS LISTOS PARA CONSUMIR DE INDONESIA, POR TIPO DE ENVASE, 2018-2032 (MILES DE USD)
TABLA 919 BOTELLAS DE INDONESIA EN EL MERCADO DE ALIMENTOS LISTOS PARA CONSUMIR, POR TIPO, 2018-2032 (MILES DE USD)
TABLA 920 MERCADO DE ALIMENTOS LISTOS PARA CONSUMIR DE INDONESIA, POR TAMAÑO DE ENVASE, 2018-2032 (MILES DE USD)
TABLA 921 MERCADO DE ALIMENTOS LISTOS PARA CONSUMIR EN INDONESIA, POR TECNOLOGÍA DE ENVASADO, 2018-2032 (MILES DE USD)
TABLA 922 MERCADO DE ALIMENTOS LISTOS PARA CONSUMIR DE INDONESIA, POR TIPO DE ALMACENAMIENTO, 2018-2032 (MILES DE USD)
TABLA 923 MERCADO DE ALIMENTOS LISTOS PARA CONSUMIR DE INDONESIA, POR CANAL DE DISTRIBUCIÓN, 2018-2032 (MILES DE USD)
TABLA 924 MERCADO DE ALIMENTOS LISTOS PARA CONSUMIR EN TIENDAS DE INDONESIA, POR TIPO, 2018-2032 (MILES DE USD)
TABLA 925 MERCADO DE ALIMENTOS LISTOS PARA CONSUMIR SIN TIENDAS DE INDONESIA, POR TIPO, 2018-2032 (MILES DE USD)
TABLA 926 MERCADO DE ALIMENTOS LISTOS PARA CONSUMIR DE INDONESIA, POR USUARIO FINAL, 2018-2032 (MILES DE USD)
TABLA 927 SERVICIOS DE LA INDUSTRIA ALIMENTARIA DE INDONESIA EN EL MERCADO DE ALIMENTOS LISTOS PARA CONSUMIR, POR TIPO, 2018-2032 (MILES DE USD)
TABLA 928 RESTAURANTES DE INDONESIA EN EL MERCADO DE ALIMENTOS LISTO PARA CONSUMIR, POR TIPO, 2018-2032 (MILES DE USD)
TABLA 929 MERCADO DE ALIMENTOS LISTOS PARA CONSUMIR DE MALASIA, POR TIPO DE PRODUCTO, 2018-2032 (MILES DE USD)
TABLA 930 MERCADO DE ALIMENTOS LISTOS PARA CONSUMIR DE MALASIA, POR TIPO DE PRODUCTO, 2018-2032 (TONELADAS)
TABLA 931 MERCADO DE ALIMENTOS LISTOS PARA CONSUMIR DE MALASIA, POR TIPO DE PRODUCTO, 2018-2032 (USD/KG)
TABLA 932 PRODUCTOS CÁRNICOS DE MALASIA EN EL MERCADO DE ALIMENTOS LISTOS PARA CONSUMIR, POR TIPO, 2018-2032 (MILES DE USD)
TABLA 933 PRODUCTOS CÁRNICOS DE MALASIA EN EL MERCADO DE ALIMENTOS LISTOS PARA CONSUMIR, POR TIPO, 2018-2032 (TONELADAS)
TABLA 934 PRODUCTOS CÁRNICOS DE MALASIA EN EL MERCADO DE ALIMENTOS LISTOS PARA CONSUMIR, POR TIPO, 2018-2032 (USD/KG)
TABLA 935 PRODUCTOS A BASE DE CEREALES DE MALASIA EN EL MERCADO DE ALIMENTOS LISTOS PARA CONSUMIR, POR TIPO, 2018-2032 (MILES DE USD)
TABLA 936 PRODUCTOS A BASE DE CEREALES DE MALASIA EN EL MERCADO DE ALIMENTOS LISTOS PARA EL CONSUMO, POR TIPO, 2018-2032 (TONELADAS)
TABLA 937 PRODUCTOS A BASE DE CEREALES DE MALASIA EN EL MERCADO DE ALIMENTOS LISTOS PARA EL CONSUMO, POR TIPO, 2018-2032 (USD/KG)
TABLA 938 PRODUCTOS LÁCTEOS DE MALASIA EN EL MERCADO DE ALIMENTOS LISTOS PARA CONSUMIR, POR TIPO, 2018-2032 (MILES DE USD)
TABLA 939 PRODUCTOS LÁCTEOS DE MALASIA EN EL MERCADO DE ALIMENTOS LISTOS PARA CONSUMIR, POR TIPO, 2018-2032 (TONELADAS)
TABLA 940 PRODUCTOS LÁCTEOS DE MALASIA EN EL MERCADO DE ALIMENTOS LISTOS PARA CONSUMIR, POR TIPO, 2018-2032 (USD/KG)
TABLA 941 QUESO DE MALASIA EN EL MERCADO DE ALIMENTOS LISTOS PARA CONSUMIR, POR FORMA, 2018-2032 (MILES DE USD)
TABLA 942 QUESO DE MALASIA EN EL MERCADO DE ALIMENTOS LISTOS PARA CONSUMIR, POR FORMA, 2018-2032 (TONELADAS)
TABLA 943 QUESO DE MALASIA EN EL MERCADO DE ALIMENTOS LISTOS PARA CONSUMIR, POR FORMA, 2018-2032 (USD/KG)
TABLA 944 QUESO DE MALASIA EN EL MERCADO DE ALIMENTOS LISTOS PARA CONSUMIR, POR TIPO, 2018-2032 (MILES DE USD)
TABLA 945 QUESO DE MALASIA EN EL MERCADO DE ALIMENTOS LISTOS PARA CONSUMIR, POR TIPO, 2018-2032 (TONELADAS)
TABLA 946 QUESO DE MALASIA EN EL MERCADO DE ALIMENTOS LISTOS PARA CONSUMIR, POR TIPO, 2018-2032 (USD/KG)
TABLA 947 QUESO DE ORIGEN ANIMAL EN EL MERCADO DE ALIMENTOS LISTOS PARA CONSUMIR DE MALASIA, POR TIPO, 2018-2032 (MILES DE USD)
TABLA 948 QUESO VEGETAL DE MALASIA EN EL MERCADO DE ALIMENTOS LISTOS PARA CONSUMIR, POR TIPO, 2018-2032 (MILES DE USD)
TABLA 949 HELADOS DE MALASIA EN EL MERCADO DE ALIMENTOS LISTOS PARA CONSUMIR, POR TIPO, 2018-2032 (MILES DE USD)
TABLA 950 HELADOS DE MALASIA EN EL MERCADO DE ALIMENTOS LISTOS PARA CONSUMIR, POR TIPO, 2018-2032 (TONELADAS)
TABLA 951 HELADOS DE MALASIA EN EL MERCADO DE ALIMENTOS LISTOS PARA CONSUMIR, POR TIPO, 2018-2032 (USD/KG)
TABLA 952 CUAJADA DE MALASIA EN EL MERCADO DE ALIMENTOS LISTOS PARA CONSUMIR, POR TIPO, 2018-2032 (MILES DE USD)
TABLA 953 CUAJADA DE MALASIA EN EL MERCADO DE ALIMENTOS LISTOS PARA CONSUMIR, POR TIPO, 2018-2032 (TONELADAS)
TABLA 954 CUAJADA DE MALASIA EN EL MERCADO DE ALIMENTOS LISTOS PARA CONSUMIR, POR TIPO, 2018-2032 (USD/KG)
TABLA 955 PANEER DE MALASIA EN EL MERCADO DE ALIMENTOS LISTOS PARA CONSUMIR, POR TIPO, 2018-2032 (MILES DE USD)
TABLA 956 PANEER DE MALASIA EN EL MERCADO DE ALIMENTOS LISTOS PARA CONSUMIR, POR TIPO, 2018-2032 (TONELADAS)
TABLA 957. PANEER DE MALASIA EN EL MERCADO DE ALIMENTOS LISTOS PARA CONSUMIR, POR TIPO, 2018-2032 (USD/KG)
TABLA 958 GHEE DE MALASIA EN EL MERCADO DE ALIMENTOS LISTOS PARA CONSUMIR, POR FUENTE, 2018-2032 (MILES DE USD)
TABLA 959 GHEE DE MALASIA EN EL MERCADO DE ALIMENTOS LISTOS PARA CONSUMIR, POR FUENTE, 2018-2032 (TONELADAS)
TABLA 960 GHEE DE MALASIA EN EL MERCADO DE ALIMENTOS LISTOS PARA CONSUMIR, POR FUENTE, 2018-2032 (USD/KG)
TABLA 961 PRODUCTOS DE PANADERÍA EN EL MERCADO DE ALIMENTOS LISTOS PARA CONSUMIR DE MALASIA, POR TIPO, 2018-2032 (MILES DE USD)
TABLA 962 PRODUCTOS DE PANADERÍA DE MALASIA EN EL MERCADO DE ALIMENTOS LISTOS PARA CONSUMIR, POR TIPO, 2018-2032 (TONELADAS)
TABLA 963 PRODUCTOS DE PANADERÍA DE MALASIA EN EL MERCADO DE ALIMENTOS LISTOS PARA CONSUMIR, POR TIPO, 2018-2032 (USD/KG)
TABLA 964 DULCES SALADOS DE MALASIA EN EL MERCADO DE ALIMENTOS LISTOS PARA CONSUMIR, POR TIPO, 2018-2032 (MILES DE USD)
TABLA 965 DULCES SALADOS DE MALASIA EN EL MERCADO DE ALIMENTOS LISTOS PARA CONSUMIR, POR TIPO, 2018-2032 (TONELADAS)
TABLA 966 DULCES SALADOS DE MALASIA EN EL MERCADO DE ALIMENTOS LISTOS PARA CONSUMIR, POR TIPO, 2018-2032 (USD/KG)
TABLA 967 PRODUCTOS DE CONFITERÍA DE MALASIA EN EL MERCADO DE ALIMENTOS LISTOS PARA CONSUMIR, POR TIPO, 2018-2032 (MILES DE USD)
TABLA 968 PRODUCTOS DE CONFITERÍA DE MALASIA EN EL MERCADO DE ALIMENTOS LISTOS PARA CONSUMIR, POR TIPO, 2018-2032 (TONELADAS)
TABLA 969 PRODUCTOS DE CONFITERÍA DE MALASIA EN EL MERCADO DE ALIMENTOS LISTOS PARA CONSUMIR, POR TIPO, 2018-2032 (USD/KG)
TABLA 970 PRODUCTOS A BASE DE VEGETALES EN EL MERCADO DE ALIMENTOS LISTOS PARA CONSUMIR DE MALASIA, POR TIPO, 2018-2032 (MILES DE USD)
TABLA 971 PRODUCTOS A BASE DE VEGETALES EN EL MERCADO DE ALIMENTOS LISTOS PARA CONSUMIR DE MALASIA, POR TIPO, 2018-2032 (TONELADAS)
TABLA 972 PRODUCTOS A BASE DE VEGETALES EN EL MERCADO DE ALIMENTOS LISTOS PARA CONSUMIR DE MALASIA, POR TIPO, 2018-2032 (USD/KG)
TABLA 973 SOPAS INSTANTÁNEAS DE MALASIA EN EL MERCADO DE ALIMENTOS LISTOS PARA CONSUMIR, POR TIPO, 2018-2032 (MILES DE USD)
TABLA 974 SOPAS INSTANTÁNEAS DE MALASIA EN EL MERCADO DE ALIMENTOS LISTOS PARA CONSUMIR, POR TIPO, 2018-2032 (TONELADAS)
TABLA 975 SOPAS INSTANTÁNEAS DE MALASIA EN EL MERCADO DE ALIMENTOS LISTOS PARA CONSUMIR, POR TIPO, 2018-2032 (USD/KG)
TABLA 976 APERITIVOS SALADOS DE MALASIA EN EL MERCADO DE ALIMENTOS LISTOS PARA CONSUMIR, POR TIPO, 2018-2032 (MILES DE USD)
TABLA 977 APERITIVOS SALADOS DE MALASIA EN EL MERCADO DE ALIMENTOS LISTOS PARA CONSUMIR, POR TIPO, 2018-2032 (TONELADAS)
TABLA 978 APERITIVOS SALADOS DE MALASIA EN EL MERCADO DE ALIMENTOS LISTOS PARA CONSUMIR, POR TIPO, 2018-2032 (USD/KG)
TABLA 979 PAPAS FRITAS DE MALASIA EN EL MERCADO DE ALIMENTOS LISTOS PARA CONSUMIR, POR TIPO, 2018-2032 (MILES DE USD)
TABLA 980 PATATAS FRITAS DE MALASIA EN EL MERCADO DE ALIMENTOS LISTOS PARA CONSUMIR, POR TIPO, 2018-2032 (TONELADAS)
TABLA 981 PAPAS FRITAS DE MALASIA EN EL MERCADO DE ALIMENTOS LISTOS PARA CONSUMIR, POR TIPO, 2018-2032 (USD/KG)
TABLA 982 OBLEAS DE MALASIA EN EL MERCADO DE ALIMENTOS LISTOS PARA CONSUMIR, POR TIPO, 2018-2032 (MILES DE USD)
TABLA 983 OBLEAS DE MALASIA EN EL MERCADO DE ALIMENTOS LISTOS PARA CONSUMIR, POR TIPO, 2018-2032 (TONELADAS)
TABLA 984 OBLEAS DE MALASIA EN EL MERCADO DE ALIMENTOS LISTOS PARA CONSUMIR, POR TIPO, 2018-2032 (USD/KG)
TABLA 985 NAMKEENS DE MALASIA EN EL MERCADO DE ALIMENTOS LISTOS PARA CONSUMIR, POR TIPO, 2018-2032 (MILES DE USD)
TABLA 986 NAMKEENS DE MALASIA EN EL MERCADO DE ALIMENTOS LISTOS PARA CONSUMIR, POR TIPO, 2018-2032 (TONELADAS)
TABLA 987 NAMKEENS DE MALASIA EN EL MERCADO DE ALIMENTOS LISTOS PARA CONSUMIR, POR TIPO, 2018-2032 (USD/KG)
TABLA 988 GALLETAS Y GALLETAS DE MALASIA EN EL MERCADO DE ALIMENTOS LISTOS PARA CONSUMIR, POR TIPO, 2018-2032 (MILES DE USD)
TABLA 989 GALLETAS Y GALLETAS DE MALASIA EN EL MERCADO DE ALIMENTOS LISTOS PARA CONSUMIR, POR TIPO, 2018-2032 (TONELADAS)
TABLA 990 GALLETAS Y GALLETAS DE MALASIA EN EL MERCADO DE ALIMENTOS LISTOS PARA CONSUMIR, POR TIPO, 2018-2032 (USD/KG)
TABLA 991 ALIMENTOS REFRIGERADOS EN EL MERCADO DE ALIMENTOS LISTOS PARA CONSUMIR DE MALASIA, POR TIPO, 2018-2032 (MILES DE USD)
TABLA 992 ALIMENTOS REFRIGERADOS EN EL MERCADO DE ALIMENTOS LISTOS PARA CONSUMIR DE MALASIA, POR TIPO, 2018-2032 (TONELADAS)
TABLA 993 ALIMENTOS REFRIGERADOS EN EL MERCADO DE ALIMENTOS LISTOS PARA CONSUMIR DE MALASIA, POR TIPO, 2018-2032 (USD/KG)
TABLA 994 APERITIVOS DE CARNE DE ORIGEN VEGETAL EN EL MERCADO DE ALIMENTOS LISTOS PARA CONSUMIR DE MALASIA, POR TIPO, 2018-2032 (MILES DE USD)
TABLA 995 APERITIVOS DE CARNE DE ORIGEN VEGETAL EN EL MERCADO DE ALIMENTOS LISTOS PARA CONSUMIR DE MALASIA, POR TIPO, 2018-2032 (TONELADAS)
TABLA 996 APERITIVOS DE CARNE DE ORIGEN VEGETAL EN EL MERCADO DE ALIMENTOS LISTOS PARA CONSUMIR DE MALASIA, POR TIPO, 2018-2032 (USD/KG)
TABLA 997 APERITIVOS DE CARNE DE ORIGEN VEGETAL EN EL MERCADO DE ALIMENTOS LISTOS PARA CONSUMIR DE MALASIA, POR FUENTE, 2018-2032 (MILES DE USD)
TABLA 998 APERITIVOS DE CARNE DE ORIGEN VEGETAL EN EL MERCADO DE ALIMENTOS LISTOS PARA CONSUMIR DE MALASIA, POR FUENTE, 2018-2032 (TONELADAS)
TABLA 999 APERITIVOS DE CARNE DE ORIGEN VEGETAL EN EL MERCADO DE ALIMENTOS LISTOS PARA CONSUMIR DE MALASIA, POR FUENTE, 2018-2032 (USD/KG)
TABLA 1000 COMIDAS LISTAS PARA COMER EN EL MERCADO DE ALIMENTOS LISTOS PARA COMER DE MALASIA, POR TIPO, 2018-2032 (MILES DE USD)
TABLA 1001 COMIDAS LISTAS PARA CONSUMIR EN EL MERCADO DE ALIMENTOS LISTOS PARA CONSUMIR DE MALASIA, POR TIPO, 2018-2032 (TONELADAS)
TABLA 1002 COMIDAS LISTAS PARA CONSUMIR EN EL MERCADO DE ALIMENTOS LISTOS PARA CONSUMIR DE MALASIA, POR TIPO, 2018-2032 (USD/KG)
TABLA 1003 MERCADO DE ALIMENTOS LISTOS PARA CONSUMIR DE MALASIA, POR CATEGORÍA, 2018-2032 (MILES DE USD)
TABLA 1004 ESPECIALIDADES DE MALASIA EN EL MERCADO DE ALIMENTOS LISTOS PARA CONSUMIR, POR TIPO, 2018-2032 (MILES DE USD)
TABLA 1005 MERCADO DE ALIMENTOS LISTOS PARA CONSUMIR DE MALASIA, POR TIPO DE ENVASE, 2018-2032 (MILES DE USD)
TABLA 1006 BOTELLAS DE MALASIA EN EL MERCADO DE ALIMENTOS LISTOS PARA CONSUMIR, POR TIPO, 2018-2032 (MILES DE USD)
TABLA 1007 MERCADO DE ALIMENTOS LISTOS PARA CONSUMIR DE MALASIA, POR TAMAÑO DE ENVASE, 2018-2032 (MILES DE USD)
TABLA 1008 MERCADO DE ALIMENTOS LISTOS PARA CONSUMIR DE MALASIA, POR TECNOLOGÍA DE ENVASADO, 2018-2032 (MILES DE USD)
TABLA 1009 MERCADO DE ALIMENTOS LISTOS PARA CONSUMIR DE MALASIA, POR TIPO DE ALMACENAMIENTO, 2018-2032 (MILES DE USD)
TABLA 1010 MERCADO DE ALIMENTOS LISTOS PARA CONSUMIR DE MALASIA, POR CANAL DE DISTRIBUCIÓN, 2018-2032 (MILES DE USD)
TABLA 1011 MERCADO DE ALIMENTOS LISTOS PARA CONSUMIR EN TIENDAS DE MALASIA, POR TIPO, 2018-2032 (MILES DE USD)
TABLA 1012 MERCADO DE ALIMENTOS LISTOS PARA CONSUMIR SIN TIENDAS DE MALASIA, POR TIPO, 2018-2032 (MILES DE USD)
TABLA 1013 MERCADO DE ALIMENTOS LISTOS PARA CONSUMIR DE MALASIA, POR USUARIO FINAL, 2018-2032 (MILES DE USD)
TABLA 1014 SERVICIOS DE LA INDUSTRIA ALIMENTARIA DE MALASIA EN EL MERCADO DE ALIMENTOS LISTOS PARA CONSUMIR, POR TIPO, 2018-2032 (MILES DE USD)
TABLA 1015 RESTAURANTES DE MALASIA EN EL MERCADO DE ALIMENTOS LISTA PARA COMER, POR TIPO, 2018-2032 (MILES DE USD)
TABLA 1016 MERCADO DE ALIMENTOS LISTOS PARA CONSUMIR DE FILIPINAS, POR TIPO DE PRODUCTO, 2018-2032 (MILES DE USD)
TABLA 1017 MERCADO DE ALIMENTOS LISTOS PARA CONSUMIR DE FILIPINAS, POR TIPO DE PRODUCTO, 2018-2032 (TONELADAS)
TABLA 1018 MERCADO DE ALIMENTOS LISTOS PARA CONSUMIR DE FILIPINAS, POR TIPO DE PRODUCTO, 2018-2032 (USD/KG)
TABLA 1019 PRODUCTOS CÁRNICOS DE FILIPINAS EN EL MERCADO DE ALIMENTOS LISTOS PARA CONSUMIR, POR TIPO, 2018-2032 (MILES DE USD)
TABLA 1020 PRODUCTOS CÁRNICOS DE FILIPINAS EN EL MERCADO DE ALIMENTOS LISTOS PARA CONSUMIR, POR TIPO, 2018-2032 (TONELADAS)
TABLA 1021 PRODUCTOS CÁRNICOS DE FILIPINAS EN EL MERCADO DE ALIMENTOS LISTOS PARA CONSUMIR, POR TIPO, 2018-2032 (USD/KG)
TABLA 1022 PRODUCTOS A BASE DE CEREALES EN EL MERCADO DE ALIMENTOS LISTOS PARA CONSUMIR DE FILIPINAS, POR TIPO, 2018-2032 (MILES DE USD)
TABLA 1023 PRODUCTOS A BASE DE CEREALES EN EL MERCADO DE ALIMENTOS LISTOS PARA CONSUMIR DE FILIPINAS, POR TIPO, 2018-2032 (TONELADAS)
TABLA 1024 PRODUCTOS A BASE DE CEREALES EN EL MERCADO DE ALIMENTOS LISTOS PARA CONSUMIR DE FILIPINAS, POR TIPO, 2018-2032 (USD/KG)
TABLA 1025 PRODUCTOS LÁCTEOS DE FILIPINAS EN EL MERCADO DE ALIMENTOS LISTOS PARA CONSUMIR, POR TIPO, 2018-2032 (MILES DE USD)
TABLA 1026 PRODUCTOS LÁCTEOS DE FILIPINAS EN EL MERCADO DE ALIMENTOS LISTOS PARA CONSUMIR, POR TIPO, 2018-2032 (TONELADAS)
TABLA 1027 PRODUCTOS LÁCTEOS DE FILIPINAS EN EL MERCADO DE ALIMENTOS LISTOS PARA CONSUMIR, POR TIPO, 2018-2032 (USD/KG)
TABLA 1028 QUESO FILIPINAS EN EL MERCADO DE ALIMENTOS LISTOS PARA CONSUMIR, POR FORMA, 2018-2032 (MILES DE USD)
TABLA 1029 QUESO FILIPINAS EN EL MERCADO DE ALIMENTOS LISTOS PARA CONSUMIR, POR FORMA, 2018-2032 (TONELADAS)
TABLA 1030 QUESO FILIPINAS EN EL MERCADO DE ALIMENTOS LISTOS PARA CONSUMIR, POR FORMA, 2018-2032 (USD/KG)
TABLA 1031 QUESO FILIPINAS EN EL MERCADO DE ALIMENTOS LISTOS PARA CONSUMIR, POR TIPO, 2018-2032 (MILES DE USD)
TABLA 1032 QUESO FILIPINAS EN EL MERCADO DE ALIMENTOS LISTOS PARA CONSUMIR, POR TIPO, 2018-2032 (TONELADAS)
TABLA 1033 QUESO FILIPINAS EN EL MERCADO DE ALIMENTOS LISTOS PARA CONSUMIR, POR TIPO, 2018-2032 (USD/KG)
TABLA 1034 QUESO DE ORIGEN ANIMAL EN EL MERCADO DE ALIMENTOS LISTOS PARA CONSUMIR DE FILIPINAS, POR TIPO, 2018-2032 (MILES DE USD)
TABLA 1035 QUESO VEGETAL EN EL MERCADO DE ALIMENTOS LISTOS PARA CONSUMIR DE FILIPINAS, POR TIPO, 2018-2032 (MILES DE USD)
TABLA 1036 HELADOS DE FILIPINAS EN EL MERCADO DE ALIMENTOS LISTOS PARA CONSUMIR, POR TIPO, 2018-2032 (MILES DE USD)
TABLA 1037 HELADOS DE FILIPINAS EN EL MERCADO DE ALIMENTOS LISTOS PARA CONSUMIR, POR TIPO, 2018-2032 (TONELADAS)
TABLA 1038 HELADOS DE FILIPINAS EN EL MERCADO DE ALIMENTOS LISTOS PARA CONSUMIR, POR TIPO, 2018-2032 (USD/KG)
TABLA 1039 CUAJADA DE FILIPINAS EN EL MERCADO DE ALIMENTOS LISTOS PARA CONSUMIR, POR TIPO, 2018-2032 (MILES DE USD)
TABLA 1040 CUAJADA DE FILIPINAS EN EL MERCADO DE ALIMENTOS LISTOS PARA CONSUMIR, POR TIPO, 2018-2032 (TONELADAS)
TABLA 1041 CUAJADA DE FILIPINAS EN EL MERCADO DE ALIMENTOS LISTOS PARA CONSUMIR, POR TIPO, 2018-2032 (USD/KG)
TABLA 1042 PANEER DE FILIPINAS EN EL MERCADO DE ALIMENTOS LISTOS PARA CONSUMIR, POR TIPO, 2018-2032 (MILES DE USD)
TABLA 1043 PANEER DE FILIPINAS EN EL MERCADO DE ALIMENTOS LISTOS PARA CONSUMIR, POR TIPO, 2018-2032 (TONELADAS)
TABLA 1044 PANEER DE FILIPINAS EN EL MERCADO DE ALIMENTOS LISTOS PARA CONSUMIR, POR TIPO, 2018-2032 (USD/KG)
TABLA 1045 GHEE EN EL MERCADO DE ALIMENTOS LISTOS PARA CONSUMIR DE FILIPINAS, POR FUENTE, 2018-2032 (MILES DE USD)
TABLA 1046 Ghee en el mercado de alimentos listos para consumir de Filipinas, por fuente, 2018-2032 (toneladas)
TABLA 1047 GHEE EN EL MERCADO DE ALIMENTOS LISTOS PARA CONSUMIR DE FILIPINAS, POR FUENTE, 2018-2032 (USD/KG)
TABLA 1048 PRODUCTOS DE PANADERÍA EN EL MERCADO DE ALIMENTOS LISTOS PARA CONSUMIR DE FILIPINAS, POR TIPO, 2018-2032 (MILES DE USD)
TABLA 1049 PRODUCTOS DE PANADERÍA EN EL MERCADO DE ALIMENTOS LISTOS PARA CONSUMIR DE FILIPINAS, POR TIPO, 2018-2032 (TONELADAS)
TABLA 1050 PRODUCTOS DE PANADERÍA EN EL MERCADO DE ALIMENTOS LISTOS PARA CONSUMIR DE FILIPINAS, POR TIPO, 2018-2032 (USD/KG)
TABLA 1051 DULCES SALADOS EN EL MERCADO DE ALIMENTOS LISTOS PARA CONSUMIR DE FILIPINAS, POR TIPO, 2018-2032 (MILES DE USD)
TABLA 1052 DULCES SALADOS EN EL MERCADO DE ALIMENTOS LISTOS PARA CONSUMIR DE FILIPINAS, POR TIPO, 2018-2032 (TONELADAS)
TABLA 1053 DULCES SALADOS EN EL MERCADO DE ALIMENTOS LISTOS PARA CONSUMIR DE FILIPINAS, POR TIPO, 2018-2032 (USD/KG)
TABLA 1054 PRODUCTOS DE CONFITERÍA EN EL MERCADO DE ALIMENTOS LISTOS PARA CONSUMIR DE FILIPINAS, POR TIPO, 2018-2032 (MILES DE USD)
TABLA 1055 PRODUCTOS DE CONFITERÍA DE FILIPINAS EN EL MERCADO DE ALIMENTOS LISTOS PARA CONSUMIR, POR TIPO, 2018-2032 (TONELADAS)
TABLA 1056 PRODUCTOS DE CONFITERÍA DE FILIPINAS EN EL MERCADO DE ALIMENTOS LISTOS PARA CONSUMIR, POR TIPO, 2018-2032 (USD/KG)
TABLA 1057 PRODUCTOS A BASE DE VEGETALES EN EL MERCADO DE ALIMENTOS LISTOS PARA CONSUMIR DE FILIPINAS, POR TIPO, 2018-2032 (MILES DE USD)
TABLA 1058 PRODUCTOS A BASE DE VEGETALES EN EL MERCADO DE ALIMENTOS LISTOS PARA CONSUMIR DE FILIPINAS, POR TIPO, 2018-2032 (TONELADAS)
TABLA 1059 PRODUCTOS A BASE DE VEGETALES EN EL MERCADO DE ALIMENTOS LISTOS PARA CONSUMIR DE FILIPINAS, POR TIPO, 2018-2032 (USD/KG)
TABLA 1060 SOPAS INSTANTÁNEAS EN EL MERCADO DE ALIMENTOS LISTOS PARA CONSUMIR DE FILIPINAS, POR TIPO, 2018-2032 (MILES DE USD)
TABLA 1061 SOPAS INSTANTÁNEAS EN EL MERCADO DE ALIMENTOS LISTOS PARA CONSUMIR DE FILIPINAS, POR TIPO, 2018-2032 (TONELADAS)
TABLA 1062 SOPAS INSTANTÁNEAS EN EL MERCADO DE ALIMENTOS LISTOS PARA CONSUMIR DE FILIPINAS, POR TIPO, 2018-2032 (USD/KG)
TABLA 1063 APERITIVOS SALADOS EN EL MERCADO DE ALIMENTOS LISTOS PARA CONSUMIR DE FILIPINAS, POR TIPO, 2018-2032 (MILES DE USD)
TABLA 1064 APERITIVOS SALADOS EN EL MERCADO DE ALIMENTOS LISTOS PARA CONSUMIR DE FILIPINAS, POR TIPO, 2018-2032 (TONELADAS)
TABLA 1065 APERITIVOS SALADOS EN EL MERCADO DE ALIMENTOS LISTOS PARA CONSUMIR DE FILIPINAS, POR TIPO, 2018-2032 (USD/KG)
TABLA 1066 PAPAS FRITAS EN EL MERCADO DE ALIMENTOS LISTOS PARA CONSUMIR DE FILIPINAS, POR TIPO, 2018-2032 (MILES DE USD)
TABLA 1067 PAPAS FRITAS EN EL MERCADO DE ALIMENTOS LISTOS PARA CONSUMIR DE FILIPINAS, POR TIPO, 2018-2032 (TONELADAS)
TABLA 1068 PAPAS FRITAS EN EL MERCADO DE ALIMENTOS LISTOS PARA CONSUMIR DE FILIPINAS, POR TIPO, 2018-2032 (USD/KG)
TABLA 1069 OBLEAS DE FILIPINAS EN EL MERCADO DE ALIMENTOS LISTOS PARA CONSUMIR, POR TIPO, 2018-2032 (MILES DE USD)
TABLA 1070 OBLEAS DE FILIPINAS EN EL MERCADO DE ALIMENTOS LISTOS PARA CONSUMIR, POR TIPO, 2018-2032 (TONELADAS)
TABLA 1071 OBLEAS DE FILIPINAS EN EL MERCADO DE ALIMENTOS LISTOS PARA CONSUMIR, POR TIPO, 2018-2032 (USD/KG)
TABLA 1072 NÚMEROS DE FILIPINAS EN EL MERCADO DE ALIMENTOS LISTOS PARA CONSUMIR, POR TIPO, 2018-2032 (MILES DE USD)
TABLA 1073 NÚMEROS DE PAPAS FILIPINAS EN EL MERCADO DE ALIMENTOS LISTOS PARA CONSUMIR, POR TIPO, 2018-2032 (TONELADAS)
TABLA 1074 NÚMEROS DE PAPAS FILIPINAS EN EL MERCADO DE ALIMENTOS LISTOS PARA CONSUMIR, POR TIPO, 2018-2032 (USD/KG)
TABLA 1075 GALLETAS Y GALLETAS DE FILIPINAS EN EL MERCADO DE ALIMENTOS LISTOS PARA CONSUMIR, POR TIPO, 2018-2032 (MILES DE USD)
TABLA 1076 GALLETAS Y GALLETAS DE FILIPINAS EN EL MERCADO DE ALIMENTOS LISTOS PARA CONSUMIR, POR TIPO, 2018-2032 (TONELADAS)
TABLA 1077 GALLETAS Y GALLETAS DE FILIPINAS EN EL MERCADO DE ALIMENTOS LISTOS PARA CONSUMIR, POR TIPO, 2018-2032 (USD/KG)
TABLA 1078 ALIMENTOS REFRIGERADOS EN EL MERCADO DE ALIMENTOS LISTOS PARA CONSUMIR DE FILIPINAS, POR TIPO, 2018-2032 (MILES DE USD)
TABLA 1079 ALIMENTOS REFRIGERADOS EN EL MERCADO DE ALIMENTOS LISTOS PARA CONSUMIR DE FILIPINAS, POR TIPO, 2018-2032 (TONELADAS)
TABLA 1080 ALIMENTOS REFRIGERADOS EN EL MERCADO DE ALIMENTOS LISTOS PARA CONSUMIR DE FILIPINAS, POR TIPO, 2018-2032 (USD/KG)
TABLA 1081 APERITIVOS DE CARNE DE ORIGEN VEGETAL EN EL MERCADO DE ALIMENTOS LISTOS PARA CONSUMIR DE FILIPINAS, POR TIPO, 2018-2032 (MILES DE USD)
TABLA 1082 APERITIVOS DE CARNE DE ORIGEN VEGETAL EN EL MERCADO DE ALIMENTOS LISTOS PARA CONSUMIR DE FILIPINAS, POR TIPO, 2018-2032 (TONELADAS)
TABLA 1083 APERITIVOS DE CARNE DE ORIGEN VEGETAL EN EL MERCADO DE ALIMENTOS LISTOS PARA CONSUMIR DE FILIPINAS, POR TIPO, 2018-2032 (USD/KG)
TABLA 1084 APERITIVOS DE CARNE DE ORIGEN VEGETAL EN EL MERCADO DE ALIMENTOS LISTOS PARA CONSUMIR DE FILIPINAS, POR FUENTE, 2018-2032 (MILES DE USD)
TABLA 1085 APERITIVOS DE CARNE DE ORIGEN VEGETAL EN EL MERCADO DE ALIMENTOS LISTOS PARA CONSUMIR DE FILIPINAS, POR FUENTE, 2018-2032 (TONELADAS)
TABLA 1086 APERITIVOS DE CARNE DE ORIGEN VEGETAL EN EL MERCADO DE ALIMENTOS LISTOS PARA CONSUMIR DE FILIPINAS, POR FUENTE, 2018-2032 (USD/KG)
TABLA 1087 COMIDAS LISTAS PARA COMER EN EL MERCADO DE ALIMENTOS LISTOS PARA COMER DE FILIPINAS, POR TIPO, 2018-2032 (MILES DE USD)
TABLA 1088 COMIDAS LISTAS PARA COMER EN EL MERCADO DE ALIMENTOS LISTOS PARA COMER DE FILIPINAS, POR TIPO, 2018-2032 (TONELADAS)
TABLA 1089 COMIDAS LISTAS PARA COMER EN EL MERCADO DE ALIMENTOS LISTOS PARA COMER DE FILIPINAS, POR TIPO, 2018-2032 (USD/KG)
TABLA 1090 MERCADO DE ALIMENTOS LISTOS PARA CONSUMIR DE FILIPINAS, POR CATEGORÍA, 2018-2032 (MILES DE USD)
TABLA 1091 MERCADO DE ESPECIALIDADES DE FILIPINAS EN ALIMENTOS LISTOS PARA CONSUMIR, POR TIPO, 2018-2032 (MILES DE USD)
TABLA 1092 MERCADO DE ALIMENTOS LISTOS PARA CONSUMIR DE FILIPINAS, POR TIPO DE ENVASE, 2018-2032 (MILES DE USD)
TABLA 1093 BOTELLAS DE FILIPINAS EN EL MERCADO DE ALIMENTOS LISTOS PARA CONSUMIR, POR TIPO, 2018-2032 (MILES DE USD)
TABLA 1094 MERCADO DE ALIMENTOS LISTOS PARA CONSUMIR DE FILIPINAS, POR TAMAÑO DE ENVASE, 2018-2032 (MILES DE USD)
TABLA 1095 MERCADO DE ALIMENTOS LISTOS PARA CONSUMIR DE FILIPINAS, POR TECNOLOGÍA DE ENVASE, 2018-2032 (MILES DE USD)
TABLA 1096 MERCADO DE ALIMENTOS LISTOS PARA CONSUMIR DE FILIPINAS, POR TIPO DE ALMACENAMIENTO, 2018-2032 (MILES DE USD)
TABLA 1097 MERCADO DE ALIMENTOS LISTOS PARA CONSUMIR DE FILIPINAS, POR CANAL DE DISTRIBUCIÓN, 2018-2032 (MILES DE USD)
TABLA 1098 MERCADO DE ALIMENTOS LISTOS PARA CONSUMIR EN TIENDAS DE FILIPINAS, POR TIPO, 2018-2032 (MILES DE USD)
TABLA 1099 MERCADO DE ALIMENTOS LISTOS PARA CONSUMIR SIN TIENDAS EN FILIPINAS, POR TIPO, 2018-2032 (MILES DE USD)
TABLA 1100 MERCADO DE ALIMENTOS LISTOS PARA CONSUMIR EN FILIPINAS, POR USUARIO FINAL, 2018-2032 (MILES DE USD)
TABLA 1101 SERVICIOS DE LA INDUSTRIA ALIMENTARIA DE FILIPINAS EN EL MERCADO DE ALIMENTOS LISTOS PARA CONSUMIR, POR TIPO, 2018-2032 (MILES DE USD)
TABLA 1102 RESTAURANTES DE FILIPINAS EN EL MERCADO DE ALIMENTOS LISTO PARA CONSUMIR, POR TIPO, 2018-2032 (MILES DE USD)
TABLA 1103 MERCADO DE ALIMENTOS LISTOS PARA CONSUMIR DE AUSTRALIA, POR TIPO DE PRODUCTO, 2018-2032 (MILES DE USD)
TABLA 1104 MERCADO DE ALIMENTOS LISTOS PARA CONSUMIR DE AUSTRALIA, POR TIPO DE PRODUCTO, 2018-2032 (TONELADAS)
TABLA 1105 MERCADO DE ALIMENTOS LISTOS PARA CONSUMIR DE AUSTRALIA, POR TIPO DE PRODUCTO, 2018-2032 (USD/KG)
TABLA 1106 PRODUCTOS CÁRNICOS DE AUSTRALIA EN EL MERCADO DE ALIMENTOS LISTOS PARA CONSUMIR, POR TIPO, 2018-2032 (MILES DE USD)
TABLA 1107 PRODUCTOS CÁRNICOS DE AUSTRALIA EN EL MERCADO DE ALIMENTOS LISTOS PARA CONSUMIR, POR TIPO, 2018-2032 (TONELADAS)
TABLA 1108 PRODUCTOS CÁRNICOS DE AUSTRALIA EN EL MERCADO DE ALIMENTOS LISTOS PARA CONSUMIR, POR TIPO, 2018-2032 (USD/KG)
TABLA 1109 PRODUCTOS A BASE DE CEREALES EN EL MERCADO DE ALIMENTOS LISTOS PARA CONSUMIR DE AUSTRALIA, POR TIPO, 2018-2032 (MILES DE USD)
TABLA 1110 PRODUCTOS A BASE DE CEREALES EN EL MERCADO DE ALIMENTOS LISTOS PARA CONSUMIR DE AUSTRALIA, POR TIPO, 2018-2032 (TONELADAS)
TABLA 1111 PRODUCTOS A BASE DE CEREALES EN EL MERCADO DE ALIMENTOS LISTOS PARA CONSUMIR DE AUSTRALIA, POR TIPO, 2018-2032 (USD/KG)
TABLA 1112 PRODUCTOS LÁCTEOS DE AUSTRALIA EN EL MERCADO DE ALIMENTOS LISTOS PARA CONSUMIR, POR TIPO, 2018-2032 (MILES DE USD)
TABLA 1113 PRODUCTOS LÁCTEOS DE AUSTRALIA EN EL MERCADO DE ALIMENTOS LISTOS PARA CONSUMIR, POR TIPO, 2018-2032 (TONELADAS)
TABLA 1114 PRODUCTOS LÁCTEOS DE AUSTRALIA EN EL MERCADO DE ALIMENTOS LISTOS PARA CONSUMIR, POR TIPO, 2018-2032 (USD/KG)
TABLA 1115 QUESO DE AUSTRALIA EN EL MERCADO DE ALIMENTOS LISTOS PARA CONSUMIR, POR FORMA, 2018-2032 (MILES DE USD)
TABLA 1116 QUESO DE AUSTRALIA EN EL MERCADO DE ALIMENTOS LISTOS PARA CONSUMIR, POR FORMA, 2018-2032 (TONELADAS)
TABLA 1117 QUESO DE AUSTRALIA EN EL MERCADO DE ALIMENTOS LISTOS PARA CONSUMIR, POR FORMA, 2018-2032 (USD/KG)
TABLA 1118 QUESO DE AUSTRALIA EN EL MERCADO DE ALIMENTOS LISTOS PARA CONSUMIR, POR TIPO, 2018-2032 (MILES DE USD)
TABLA 1119 QUESO DE AUSTRALIA EN EL MERCADO DE ALIMENTOS LISTOS PARA CONSUMIR, POR TIPO, 2018-2032 (TONELADAS)
TABLA 1120 QUESO DE AUSTRALIA EN EL MERCADO DE ALIMENTOS LISTOS PARA CONSUMIR, POR TIPO, 2018-2032 (USD/KG)
TABLA 1121 QUESO DE ORIGEN ANIMAL EN EL MERCADO DE ALIMENTOS LISTOS PARA CONSUMIR DE AUSTRALIA, POR TIPO, 2018-2032 (MILES DE USD)
TABLA 1122 QUESO DE ORIGEN VEGETAL EN EL MERCADO DE ALIMENTOS LISTOS PARA CONSUMIR DE AUSTRALIA, POR TIPO, 2018-2032 (MILES DE USD)
TABLA 1123 HELADOS DE AUSTRALIA EN EL MERCADO DE ALIMENTOS LISTOS PARA CONSUMIR, POR TIPO, 2018-2032 (MILES DE USD)
TABLA 1124 HELADOS DE AUSTRALIA EN EL MERCADO DE ALIMENTOS LISTOS PARA CONSUMIR, POR TIPO, 2018-2032 (TONELADAS)
TABLA 1125 HELADOS DE AUSTRALIA EN EL MERCADO DE ALIMENTOS LISTOS PARA CONSUMIR, POR TIPO, 2018-2032 (USD/KG)
TABLA 1126 CUAJADA DE AUSTRALIA EN EL MERCADO DE ALIMENTOS LISTOS PARA CONSUMIR, POR TIPO, 2018-2032 (MILES DE USD)
TABLA 1127 CUAJADA DE AUSTRALIA EN EL MERCADO DE ALIMENTOS LISTOS PARA CONSUMIR, POR TIPO, 2018-2032 (TONELADAS)
TABLA 1128 CUAJADA DE AUSTRALIA EN EL MERCADO DE ALIMENTOS LISTOS PARA CONSUMIR, POR TIPO, 2018-2032 (USD/KG)
TABLA 1129 AUSTRALIA PANEER EN EL MERCADO DE ALIMENTOS LISTOS PARA CONSUMIR, POR TIPO, 2018-2032 (MILES DE USD)
TABLA 1130 AUSTRALIA PANEER EN EL MERCADO DE ALIMENTOS LISTOS PARA CONSUMIR, POR TIPO, 2018-2032 (TONELADAS)
TABLA 1131 AUSTRALIA PANEER EN EL MERCADO DE ALIMENTOS LISTOS PARA CONSUMIR, POR TIPO, 2018-2032 (USD/KG)
TABLA 1132 AUSTRALIA GHEE EN EL MERCADO DE ALIMENTOS LISTOS PARA CONSUMIR, POR FUENTE, 2018-2032 (MILES DE USD)
TABLA 1133 AUSTRALIA GHEE EN EL MERCADO DE ALIMENTOS LISTOS PARA CONSUMIR, POR FUENTE, 2018-2032 (TONELADAS)
TABLA 1134 GHEE DE AUSTRALIA EN EL MERCADO DE ALIMENTOS LISTOS PARA CONSUMIR, POR FUENTE, 2018-2032 (USD/KG)
TABLA 1135 PRODUCTOS DE PANADERÍA EN EL MERCADO DE ALIMENTOS LISTOS PARA CONSUMIR DE AUSTRALIA, POR TIPO, 2018-2032 (MILES DE USD)
TABLA 1136 PRODUCTOS DE PANADERÍA EN EL MERCADO DE ALIMENTOS LISTOS PARA CONSUMIR DE AUSTRALIA, POR TIPO, 2018-2032 (TONELADAS)
TABLA 1137 PRODUCTOS DE PANADERÍA EN EL MERCADO DE ALIMENTOS LISTOS PARA CONSUMIR DE AUSTRALIA, POR TIPO, 2018-2032 (USD/KG)
TABLA 1138 AUSTRALIA: DULCES SALADOS EN EL MERCADO DE ALIMENTOS LISTOS PARA CONSUMIR, POR TIPO, 2018-2032 (MILES DE USD)
TABLA 1139 AUSTRALIA: DULCES SALADOS EN EL MERCADO DE ALIMENTOS LISTOS PARA CONSUMIR, POR TIPO, 2018-2032 (TONELADAS)
TABLA 1140 DULCES SALADOS EN EL MERCADO DE ALIMENTOS LISTOS PARA CONSUMIR DE AUSTRALIA, POR TIPO, 2018-2032 (USD/KG)
TABLA 1141 PRODUCTOS DE CONFITERÍA DE AUSTRALIA EN EL MERCADO DE ALIMENTOS LISTOS PARA CONSUMIR, POR TIPO, 2018-2032 (MILES DE USD)
TABLA 1142 PRODUCTOS DE CONFITERÍA EN EL MERCADO DE ALIMENTOS LISTOS PARA CONSUMIR DE AUSTRALIA, POR TIPO, 2018-2032 (TONELADAS)
TABLA 1143 PRODUCTOS DE CONFITERÍA EN EL MERCADO DE ALIMENTOS LISTOS PARA CONSUMIR DE AUSTRALIA, POR TIPO, 2018-2032 (USD/KG)
TABLA 1144 PRODUCTOS A BASE DE VEGETALES EN EL MERCADO DE ALIMENTOS LISTOS PARA CONSUMIR DE AUSTRALIA, POR TIPO, 2018-2032 (MILES DE USD)
TABLA 1145 PRODUCTOS A BASE DE VERDURAS EN EL MERCADO DE ALIMENTOS LISTOS PARA CONSUMIR DE AUSTRALIA, POR TIPO, 2018-2032 (TONELADAS)
TABLA 1146 PRODUCTOS A BASE DE VEGETALES EN EL MERCADO DE ALIMENTOS LISTOS PARA CONSUMIR DE AUSTRALIA, POR TIPO, 2018-2032 (USD/KG)
TABLA 1147 SOPAS INSTANTÁNEAS EN EL MERCADO DE ALIMENTOS LISTOS PARA CONSUMIR DE AUSTRALIA, POR TIPO, 2018-2032 (MILES DE USD)
TABLA 1148 SOPAS INSTANTÁNEAS EN EL MERCADO DE ALIMENTOS LISTOS PARA CONSUMIR DE AUSTRALIA, POR TIPO, 2018-2032 (TONELADAS)
TABLA 1149 SOPAS INSTANTÁNEAS EN EL MERCADO DE ALIMENTOS LISTOS PARA CONSUMIR DE AUSTRALIA, POR TIPO, 2018-2032 (USD/KG)
TABLA 1150 SNACKS SALADOS EN EL MERCADO DE ALIMENTOS LISTOS PARA CONSUMIR DE AUSTRALIA, POR TIPO, 2018-2032 (MILES DE USD)
TABLA 1151 AUSTRALIA SNACKS SALADOS EN EL MERCADO DE ALIMENTOS LISTOS PARA CONSUMIR, POR TIPO, 2018-2032 (TONELADAS)
TABLA 1152 SNACKS SALADOS DE AUSTRALIA EN EL MERCADO DE ALIMENTOS LISTOS PARA CONSUMIR, POR TIPO, 2018-2032 (USD/KG)
TABLA 1153 AUSTRALIA: PAPAS FRITAS EN EL MERCADO DE ALIMENTOS LISTOS PARA CONSUMIR, POR TIPO, 2018-2032 (MILES DE USD)
TABLA 1154 AUSTRALIA PAPAS FRITAS EN EL MERCADO DE ALIMENTOS LISTOS PARA CONSUMIR, POR TIPO, 2018-2032 (TONELADAS)
TABLA 1155 AUSTRALIA: PAPAS FRITAS EN EL MERCADO DE ALIMENTOS LISTOS PARA CONSUMIR, POR TIPO, 2018-2032 (USD/KG)
TABLA 1156 AUSTRALIA OBLEAS EN EL MERCADO DE ALIMENTOS LISTOS PARA CONSUMIR, POR TIPO, 2018-2032 (MILES DE USD)
TABLA 1157 AUSTRALIA OBLEAS EN EL MERCADO DE ALIMENTOS LISTOS PARA CONSUMIR, POR TIPO, 2018-2032 (TONELADAS)
TABLA 1158 AUSTRALIA OBLEAS EN EL MERCADO DE ALIMENTOS LISTOS PARA CONSUMIR, POR TIPO, 2018-2032 (USD/KG)
TABLA 1159 NÚMEROS DE AUSTRALIA EN EL MERCADO DE ALIMENTOS LISTOS PARA CONSUMIR, POR TIPO, 2018-2032 (MILES DE USD)
TABLA 1160 NÚMEROS DE AUSTRALIA EN EL MERCADO DE ALIMENTOS LISTOS PARA CONSUMIR, POR TIPO, 2018-2032 (TONELADAS)
TABLA 1161 NÚMEROS DE AUSTRALIA EN EL MERCADO DE ALIMENTOS LISTOS PARA CONSUMIR, POR TIPO, 2018-2032 (USD/KG)
TABLA 1162 GALLETAS Y GALLETAS DE AUSTRALIA EN EL MERCADO DE ALIMENTOS LISTOS PARA CONSUMIR, POR TIPO, 2018-2032 (MILES DE USD)
TABLA 1163 GALLETAS Y GALLETAS DE AUSTRALIA EN EL MERCADO DE ALIMENTOS LISTOS PARA CONSUMIR, POR TIPO, 2018-2032 (TONELADAS)
TABLA 1164 GALLETAS Y GALLETAS DE AUSTRALIA EN EL MERCADO DE ALIMENTOS LISTOS PARA CONSUMIR, POR TIPO, 2018-2032 (USD/KG)
TABLA 1165 ALIMENTOS REFRIGERADOS EN EL MERCADO DE ALIMENTOS LISTOS PARA CONSUMIR DE AUSTRALIA, POR TIPO, 2018-2032 (MILES DE USD)
TABLA 1166 ALIMENTOS REFRIGERADOS EN EL MERCADO DE ALIMENTOS LISTOS PARA CONSUMIR DE AUSTRALIA, POR TIPO, 2018-2032 (TONELADAS)
TABLA 1167 ALIMENTOS REFRIGERADOS EN EL MERCADO DE ALIMENTOS LISTOS PARA CONSUMIR DE AUSTRALIA, POR TIPO, 2018-2032 (USD/KG)
TABLA 1168 SNACKS DE CARNE DE ORIGEN VEGETAL EN EL MERCADO DE ALIMENTOS LISTOS PARA CONSUMIR DE AUSTRALIA, POR TIPO, 2018-2032 (MILES DE USD)
TABLA 1169 SNACKS DE CARNE DE ORIGEN VEGETAL EN EL MERCADO DE ALIMENTOS LISTOS PARA CONSUMIR DE AUSTRALIA, POR TIPO, 2018-2032 (TONELADAS)
TABLA 1170 SNACKS DE CARNE DE ORIGEN VEGETAL EN EL MERCADO DE ALIMENTOS LISTOS PARA CONSUMIR DE AUSTRALIA, POR TIPO, 2018-2032 (USD/KG)
TABLA 1171 SNACKS DE CARNE DE ORIGEN VEGETAL EN EL MERCADO DE ALIMENTOS LISTOS PARA CONSUMIR DE AUSTRALIA, POR FUENTE, 2018-2032 (MILES DE USD)
TABLA 1172 SNACKS DE CARNE DE ORIGEN VEGETAL EN EL MERCADO DE ALIMENTOS LISTOS PARA CONSUMIR DE AUSTRALIA, POR FUENTE, 2018-2032 (TONELADAS)
TABLA 1173 SNACKS DE CARNE DE ORIGEN VEGETAL EN EL MERCADO DE ALIMENTOS LISTOS PARA CONSUMIR DE AUSTRALIA, POR FUENTE, 2018-2032 (USD/KG)
TABLA 1174 COMIDAS LISTAS PARA COMER EN EL MERCADO DE ALIMENTOS LISTOS PARA COMER DE AUSTRALIA, POR TIPO, 2018-2032 (MILES DE USD)
TABLA 1175 COMIDAS LISTAS PARA CONSUMIR EN EL MERCADO DE ALIMENTOS LISTOS PARA CONSUMIR DE AUSTRALIA, POR TIPO, 2018-2032 (TONELADAS)
TABLA 1176 COMIDAS LISTAS PARA CONSUMIR EN EL MERCADO DE ALIMENTOS LISTOS PARA CONSUMIR DE AUSTRALIA, POR TIPO, 2018-2032 (USD/KG)
TABLA 1177 MERCADO DE ALIMENTOS LISTOS PARA CONSUMIR DE AUSTRALIA, POR CATEGORÍA, 2018-2032 (MILES DE USD)
TABLA 1178 MERCADO DE ALIMENTOS ESPECIALES LISTOS PARA CONSUMIR DE AUSTRALIA, POR TIPO, 2018-2032 (MILES DE USD)
TABLA 1179 MERCADO DE ALIMENTOS LISTOS PARA CONSUMIR DE AUSTRALIA, POR TIPO DE ENVASE, 2018-2032 (MILES DE USD)
TABLA 1180 BOTELLAS DE AUSTRALIA EN EL MERCADO DE ALIMENTOS LISTOS PARA CONSUMIR, POR TIPO, 2018-2032 (MILES DE USD)
TABLA 1181 MERCADO DE ALIMENTOS LISTOS PARA CONSUMIR DE AUSTRALIA, POR TAMAÑO DE ENVASE, 2018-2032 (MILES DE USD)
TABLA 1182 MERCADO DE ALIMENTOS LISTOS PARA CONSUMIR DE AUSTRALIA, POR TECNOLOGÍA DE ENVASADO, 2018-2032 (MILES DE USD)
TABLA 1183 MERCADO DE ALIMENTOS LISTOS PARA CONSUMIR DE AUSTRALIA, POR TIPO DE ALMACENAMIENTO, 2018-2032 (MILES DE USD)
TABLA 1184 MERCADO DE ALIMENTOS LISTOS PARA CONSUMIR DE AUSTRALIA, POR CANAL DE DISTRIBUCIÓN, 2018-2032 (MILES DE USD)
TABLA 1185 MERCADO DE ALIMENTOS LISTOS PARA CONSUMIR EN TIENDAS DE AUSTRALIA, POR TIPO, 2018-2032 (MILES DE USD)
TABLA 1186 MERCADO DE ALIMENTOS LISTOS PARA CONSUMIR SIN TIENDAS DE AUSTRALIA, POR TIPO, 2018-2032 (MILES DE USD)
TABLA 1187 MERCADO DE ALIMENTOS LISTOS PARA CONSUMIR DE AUSTRALIA, POR USUARIO FINAL, 2018-2032 (MILES DE USD)
TABLA 1188 SERVICIOS DE LA INDUSTRIA ALIMENTARIA DE AUSTRALIA EN EL MERCADO DE ALIMENTOS LISTOS PARA CONSUMIR, POR TIPO, 2018-2032 (MILES DE USD)
TABLA 1189 RESTAURANTES DE AUSTRALIA EN EL MERCADO DE ALIMENTOS LISTO PARA CONSUMIR, POR TIPO, 2018-2032 (MILES DE USD)
TABLA 1190 MERCADO DE ALIMENTOS LISTOS PARA CONSUMIR DE NUEVA ZELANDA, POR TIPO DE PRODUCTO, 2018-2032 (MILES DE USD)
TABLA 1191 MERCADO DE ALIMENTOS LISTOS PARA CONSUMIR DE NUEVA ZELANDA, POR TIPO DE PRODUCTO, 2018-2032 (TONELADAS)
TABLA 1192 MERCADO DE ALIMENTOS LISTOS PARA CONSUMIR DE NUEVA ZELANDA, POR TIPO DE PRODUCTO, 2018-2032 (USD/KG)
TABLA 1193 PRODUCTOS CÁRNICOS DE NUEVA ZELANDA EN EL MERCADO DE ALIMENTOS LISTOS PARA CONSUMIR, POR TIPO, 2018-2032 (MILES DE USD)
TABLA 1194 PRODUCTOS CÁRNICOS DE NUEVA ZELANDA EN EL MERCADO DE ALIMENTOS LISTOS PARA CONSUMIR, POR TIPO, 2018-2032 (TONELADAS)
TABLA 1195 PRODUCTOS CÁRNICOS DE NUEVA ZELANDA EN EL MERCADO DE ALIMENTOS LISTOS PARA CONSUMIR, POR TIPO, 2018-2032 (USD/KG)
TABLA 1196 PRODUCTOS A BASE DE CEREALES DE NUEVA ZELANDA EN EL MERCADO DE ALIMENTOS LISTOS PARA CONSUMIR, POR TIPO, 2018-2032 (MILES DE USD)
TABLA 1197 PRODUCTOS A BASE DE CEREALES DE NUEVA ZELANDA EN EL MERCADO DE ALIMENTOS LISTOS PARA EL CONSUMO, POR TIPO, 2018-2032 (TONELADAS)
TABLA 1198 PRODUCTOS A BASE DE CEREALES DE NUEVA ZELANDA EN EL MERCADO DE ALIMENTOS LISTOS PARA EL CONSUMO, POR TIPO, 2018-2032 (USD/KG)
TABLA 1199 PRODUCTOS LÁCTEOS DE NUEVA ZELANDA EN EL MERCADO DE ALIMENTOS LISTOS PARA CONSUMIR, POR TIPO, 2018-2032 (MILES DE USD)
TABLA 1200 PRODUCTOS LÁCTEOS DE NUEVA ZELANDA EN EL MERCADO DE ALIMENTOS LISTOS PARA CONSUMIR, POR TIPO, 2018-2032 (TONELADAS)
TABLA 1201 PRODUCTOS LÁCTEOS DE NUEVA ZELANDA EN EL MERCADO DE ALIMENTOS LISTOS PARA CONSUMIR, POR TIPO, 2018-2032 (USD/KG)
TABLA 1202 QUESO DE NUEVA ZELANDA EN EL MERCADO DE ALIMENTOS LISTOS PARA CONSUMIR, POR FORMA, 2018-2032 (MILES DE USD)
TABLA 1203 QUESO DE NUEVA ZELANDA EN EL MERCADO DE ALIMENTOS LISTOS PARA CONSUMIR, POR FORMA, 2018-2032 (TONELADAS)
TABLA 1204 QUESO DE NUEVA ZELANDA EN EL MERCADO DE ALIMENTOS LISTOS PARA CONSUMIR, POR FORMA, 2018-2032 (USD/KG)
TABLA 1205 QUESO DE NUEVA ZELANDA EN EL MERCADO DE ALIMENTOS LISTOS PARA CONSUMIR, POR TIPO, 2018-2032 (MILES DE USD)
TABLA 1206 QUESO DE NUEVA ZELANDA EN EL MERCADO DE ALIMENTOS LISTOS PARA CONSUMIR, POR TIPO, 2018-2032 (TONELADAS)
TABLA 1207 QUESO DE NUEVA ZELANDA EN EL MERCADO DE ALIMENTOS LISTOS PARA CONSUMIR, POR TIPO, 2018-2032 (USD/KG)
TABLA 1208 QUESO DE ORIGEN ANIMAL DE NUEVA ZELANDA EN EL MERCADO DE ALIMENTOS LISTOS PARA CONSUMIR, POR TIPO, 2018-2032 (MILES DE USD)
TABLA 1209 QUESO VEGETAL DE NUEVA ZELANDA EN EL MERCADO DE ALIMENTOS LISTOS PARA CONSUMIR, POR TIPO, 2018-2032 (MILES DE USD)
TABLA 1210 HELADOS DE NUEVA ZELANDA EN EL MERCADO DE ALIMENTOS LISTOS PARA CONSUMIR, POR TIPO, 2018-2032 (MILES DE USD)
TABLA 1211 HELADOS DE NUEVA ZELANDA EN EL MERCADO DE ALIMENTOS LISTOS PARA CONSUMIR, POR TIPO, 2018-2032 (TONELADAS)
TABLA 1212 HELADOS DE NUEVA ZELANDA EN EL MERCADO DE ALIMENTOS LISTOS PARA CONSUMIR, POR TIPO, 2018-2032 (USD/KG)
TABLA 1213 CUAJADA DE NUEVA ZELANDA EN EL MERCADO DE ALIMENTOS LISTOS PARA CONSUMIR, POR TIPO, 2018-2032 (MILES DE USD)
TABLA 1214 CUAJADA DE NUEVA ZELANDA EN EL MERCADO DE ALIMENTOS LISTOS PARA CONSUMIR, POR TIPO, 2018-2032 (TONELADAS)
TABLA 1215 CUAJADA DE NUEVA ZELANDA EN EL MERCADO DE ALIMENTOS LISTOS PARA CONSUMIR, POR TIPO, 2018-2032 (USD/KG)
TABLA 1216 PANEER DE NUEVA ZELANDA EN EL MERCADO DE ALIMENTOS LISTOS PARA CONSUMIR, POR TIPO, 2018-2032 (MILES DE USD)
TABLA 1217 PANEER DE NUEVA ZELANDA EN EL MERCADO DE ALIMENTOS LISTOS PARA CONSUMIR, POR TIPO, 2018-2032 (TONELADAS)
TABLA 1218 PANEER DE NUEVA ZELANDA EN EL MERCADO DE ALIMENTOS LISTOS PARA CONSUMIR, POR TIPO, 2018-2032 (USD/KG)
TABLA 1219 GHEE DE NUEVA ZELANDA EN EL MERCADO DE ALIMENTOS LISTOS PARA CONSUMIR, POR FUENTE, 2018-2032 (MILES DE USD)
TABLA 1220 GHEE DE NUEVA ZELANDA EN EL MERCADO DE ALIMENTOS LISTOS PARA CONSUMIR, POR FUENTE, 2018-2032 (TONELADAS)
TABLA 1221 GHEE DE NUEVA ZELANDA EN EL MERCADO DE ALIMENTOS LISTOS PARA CONSUMIR, POR FUENTE, 2018-2032 (USD/KG)
TABLA 1222 PRODUCTOS DE PANADERÍA DE NUEVA ZELANDA EN EL MERCADO DE ALIMENTOS LISTOS PARA CONSUMIR, POR TIPO, 2018-2032 (MILES DE USD)
TABLA 1223 PRODUCTOS DE PANADERÍA DE NUEVA ZELANDA EN EL MERCADO DE ALIMENTOS LISTOS PARA CONSUMIR, POR TIPO, 2018-2032 (TONELADAS)
TABLA 1224 PRODUCTOS DE PANADERÍA DE NUEVA ZELANDA EN EL MERCADO DE ALIMENTOS LISTOS PARA CONSUMIR, POR TIPO, 2018-2032 (USD/KG)
TABLA 1225 DULCES SALADOS DE NUEVA ZELANDA EN EL MERCADO DE ALIMENTOS LISTOS PARA CONSUMIR, POR TIPO, 2018-2032 (MILES DE USD)
TABLA 1226 DULCES SALADOS DE NUEVA ZELANDA EN EL MERCADO DE ALIMENTOS LISTOS PARA CONSUMIR, POR TIPO, 2018-2032 (TONELADAS)
TABLA 1227 DULCES SALADOS DE NUEVA ZELANDA EN EL MERCADO DE ALIMENTOS LISTOS PARA CONSUMIR, POR TIPO, 2018-2032 (USD/KG)
TABLA 1228 PRODUCTOS DE CONFITERÍA DE NUEVA ZELANDA EN EL MERCADO DE ALIMENTOS LISTOS PARA CONSUMIR, POR TIPO, 2018-2032 (MILES DE USD)
TABLA 1229 PRODUCTOS DE CONFITERÍA DE NUEVA ZELANDA EN EL MERCADO DE ALIMENTOS LISTOS PARA CONSUMIR, POR TIPO, 2018-2032 (TONELADAS)
TABLA 1230 PRODUCTOS DE CONFITERÍA DE NUEVA ZELANDA EN EL MERCADO DE ALIMENTOS LISTOS PARA CONSUMIR, POR TIPO, 2018-2032 (USD/KG)
TABLA 1231 PRODUCTOS A BASE DE VEGETALES DE NUEVA ZELANDA EN EL MERCADO DE ALIMENTOS LISTOS PARA CONSUMIR, POR TIPO, 2018-2032 (MILES DE USD)
TABLA 1232 PRODUCTOS A BASE DE VEGETALES DE NUEVA ZELANDA EN EL MERCADO DE ALIMENTOS LISTOS PARA CONSUMIR, POR TIPO, 2018-2032 (TONELADAS)
TABLA 1233 PRODUCTOS A BASE DE VEGETALES DE NUEVA ZELANDA EN EL MERCADO DE ALIMENTOS LISTOS PARA CONSUMIR, POR TIPO, 2018-2032 (USD/KG)
TABLA 1234 SOPAS INSTANTÁNEAS DE NUEVA ZELANDA EN EL MERCADO DE ALIMENTOS LISTOS PARA CONSUMIR, POR TIPO, 2018-2032 (MILES DE USD)
TABLA 1235 SOPAS INSTANTÁNEAS DE NUEVA ZELANDA EN EL MERCADO DE ALIMENTOS LISTOS PARA CONSUMIR, POR TIPO, 2018-2032 (TONELADAS)
TABLA 1236 SOPAS INSTANTÁNEAS DE NUEVA ZELANDA EN EL MERCADO DE ALIMENTOS LISTOS PARA CONSUMIR, POR TIPO, 2018-2032 (USD/KG)
TABLA 1237 APERITIVOS SALADOS DE NUEVA ZELANDA EN EL MERCADO DE ALIMENTOS LISTOS PARA CONSUMIR, POR TIPO, 2018-2032 (MILES DE USD)
TABLA 1238 APERITIVOS SALADOS DE NUEVA ZELANDA EN EL MERCADO DE ALIMENTOS LISTOS PARA CONSUMIR, POR TIPO, 2018-2032 (TONELADAS)
TABLA 1239 APERITIVOS SALADOS DE NUEVA ZELANDA EN EL MERCADO DE ALIMENTOS LISTOS PARA CONSUMIR, POR TIPO, 2018-2032 (USD/KG)
TABLA 1240 PAPAS FRITAS DE NUEVA ZELANDA EN EL MERCADO DE ALIMENTOS LISTOS PARA CONSUMIR, POR TIPO, 2018-2032 (MILES DE USD)
TABLA 1241 PATATAS FRITAS DE NUEVA ZELANDA EN EL MERCADO DE ALIMENTOS LISTOS PARA CONSUMIR, POR TIPO, 2018-2032 (TONELADAS)
TABLA 1242 PAPAS FRITAS DE NUEVA ZELANDA EN EL MERCADO DE ALIMENTOS LISTOS PARA CONSUMIR, POR TIPO, 2018-2032 (USD/KG)
TABLA 1243 OBLEAS DE NUEVA ZELANDA EN EL MERCADO DE ALIMENTOS LISTOS PARA CONSUMIR, POR TIPO, 2018-2032 (MILES DE USD)
TABLA 1244 OBLEAS DE NUEVA ZELANDA EN EL MERCADO DE ALIMENTOS LISTOS PARA CONSUMIR, POR TIPO, 2018-2032 (TONELADAS)
TABLA 1245 OBLEAS DE NUEVA ZELANDA EN EL MERCADO DE ALIMENTOS LISTOS PARA CONSUMIR, POR TIPO, 2018-2032 (USD/KG)
TABLA 1246 NAMKEENS DE NUEVA ZELANDA EN EL MERCADO DE ALIMENTOS LISTOS PARA CONSUMIR, POR TIPO, 2018-2032 (MILES DE USD)
TABLA 1247 NAMKEENS DE NUEVA ZELANDA EN EL MERCADO DE ALIMENTOS LISTOS PARA CONSUMIR, POR TIPO, 2018-2032 (TONELADAS)
TABLA 1248 NAMKEENS DE NUEVA ZELANDA EN EL MERCADO DE ALIMENTOS LISTOS PARA CONSUMIR, POR TIPO, 2018-2032 (USD/KG)
TABLA 1249 GALLETAS Y GALLETAS DE NUEVA ZELANDA EN EL MERCADO DE ALIMENTOS LISTOS PARA CONSUMIR, POR TIPO, 2018-2032 (MILES DE USD)
TABLA 1250 GALLETAS Y GALLETAS DE NUEVA ZELANDA EN EL MERCADO DE ALIMENTOS LISTOS PARA CONSUMIR, POR TIPO, 2018-2032 (TONELADAS)
TABLA 1251 GALLETAS Y GALLETAS DE NUEVA ZELANDA EN EL MERCADO DE ALIMENTOS LISTOS PARA CONSUMIR, POR TIPO, 2018-2032 (USD/KG)
TABLA 1252 ALIMENTOS REFRIGERADOS EN EL MERCADO DE ALIMENTOS LISTOS PARA CONSUMIR DE NUEVA ZELANDA, POR TIPO, 2018-2032 (MILES DE USD)
TABLA 1253 ALIMENTOS REFRIGERADOS DE NUEVA ZELANDA EN EL MERCADO DE ALIMENTOS LISTOS PARA CONSUMIR, POR TIPO, 2018-2032 (TONELADAS)
TABLA 1254 ALIMENTOS REFRIGERADOS DE NUEVA ZELANDA EN EL MERCADO DE ALIMENTOS LISTOS PARA CONSUMIR, POR TIPO, 2018-2032 (USD/KG)
TABLA 1255 APERITIVOS DE CARNE DE ORIGEN VEGETAL DE NUEVA ZELANDA EN EL MERCADO DE ALIMENTOS LISTOS PARA CONSUMIR, POR TIPO, 2018-2032 (MILES DE USD)
TABLA 1256 APERITIVOS DE CARNE DE ORIGEN VEGETAL DE NUEVA ZELANDA EN EL MERCADO DE ALIMENTOS LISTOS PARA CONSUMIR, POR TIPO, 2018-2032 (TONELADAS)
TABLA 1257 APERITIVOS DE CARNE DE ORIGEN VEGETAL EN EL MERCADO DE ALIMENTOS LISTOS PARA CONSUMIR DE NUEVA ZELANDA, POR TIPO, 2018-2032 (USD/KG)
TABLA 1258 APERITIVOS DE CARNE DE ORIGEN VEGETAL DE NUEVA ZELANDA EN EL MERCADO DE ALIMENTOS LISTOS PARA CONSUMIR, POR FUENTE, 2018-2032 (MILES DE USD)
TABLA 1259 APERITIVOS DE CARNE DE ORIGEN VEGETAL EN EL MERCADO DE ALIMENTOS LISTOS PARA CONSUMIR DE NUEVA ZELANDA, POR FUENTE, 2018-2032 (TONELADAS)
TABLA 1260 APERITIVOS DE CARNE DE ORIGEN VEGETAL DE NUEVA ZELANDA EN EL MERCADO DE ALIMENTOS LISTOS PARA CONSUMIR, POR FUENTE, 2018-2032 (USD/KG)
TABLA 1261 COMIDAS LISTAS PARA COMER EN EL MERCADO DE ALIMENTOS LISTOS PARA COMER DE NUEVA ZELANDA, POR TIPO, 2018-2032 (MILES DE USD)
TABLA 1262 COMIDAS LISTAS PARA COMER EN EL MERCADO DE ALIMENTOS LISTOS PARA COMER DE NUEVA ZELANDA, POR TIPO, 2018-2032 (TONELADAS)
TABLA 1263 COMIDAS LISTAS PARA COMER EN EL MERCADO DE ALIMENTOS LISTOS PARA COMER DE NUEVA ZELANDA, POR TIPO, 2018-2032 (USD/KG)
TABLA 1264 MERCADO DE ALIMENTOS LISTOS PARA CONSUMIR DE NUEVA ZELANDA, POR CATEGORÍA, 2018-2032 (MILES DE USD)
TABLA 1265 MERCADO DE ESPECIALIDADES DE NUEVA ZELANDA EN ALIMENTOS LISTOS PARA CONSUMIR, POR TIPO, 2018-2032 (MILES DE USD)
TABLA 1266 MERCADO DE ALIMENTOS LISTOS PARA CONSUMIR DE NUEVA ZELANDA, POR TIPO DE ENVASE, 2018-2032 (MILES DE USD)
TABLA 1267 BOTELLAS DE NUEVA ZELANDA EN EL MERCADO DE ALIMENTOS LISTOS PARA CONSUMIR, POR TIPO, 2018-2032 (MILES DE USD)
TABLA 1268 MERCADO DE ALIMENTOS LISTOS PARA CONSUMIR DE NUEVA ZELANDA, POR TAMAÑO DE ENVASE, 2018-2032 (MILES DE USD)
TABLA 1269 MERCADO DE ALIMENTOS LISTOS PARA CONSUMIR DE NUEVA ZELANDA, POR TECNOLOGÍA DE ENVASADO, 2018-2032 (MILES DE USD)
TABLA 1270 MERCADO DE ALIMENTOS LISTOS PARA CONSUMIR DE NUEVA ZELANDA, POR TIPO DE ALMACENAMIENTO, 2018-2032 (MILES DE USD)
TABLA 1271 MERCADO DE ALIMENTOS LISTOS PARA CONSUMIR DE NUEVA ZELANDA, POR CANAL DE DISTRIBUCIÓN, 2018-2032 (MILES DE USD)
TABLA 1272 MERCADO DE ALIMENTOS LISTOS PARA CONSUMIR EN TIENDAS DE NUEVA ZELANDA, POR TIPO, 2018-2032 (MILES DE USD)
TABLA 1273 MERCADO DE ALIMENTOS LISTOS PARA CONSUMIR SIN TIENDAS DE NUEVA ZELANDA, POR TIPO, 2018-2032 (MILES DE USD)
TABLA 1274 MERCADO DE ALIMENTOS LISTOS PARA CONSUMIR DE NUEVA ZELANDA, POR USUARIO FINAL, 2018-2032 (MILES DE USD)
TABLA 1275 SERVICIOS DE LA INDUSTRIA ALIMENTARIA DE NUEVA ZELANDA EN EL MERCADO DE ALIMENTOS LISTOS PARA CONSUMIR, POR TIPO, 2018-2032 (MILES DE USD)
TABLA 1276 RESTAURANTES DE NUEVA ZELANDA EN EL MERCADO DE ALIMENTOS LISTO PARA COMER, POR TIPO, 2018-2032 (MILES DE USD)
TABLA 1277 MERCADO DE ALIMENTOS LISTOS PARA CONSUMIR DE VIETNAM, POR TIPO DE PRODUCTO, 2018-2032 (MILES DE USD)
TABLA 1278 MERCADO DE ALIMENTOS LISTOS PARA CONSUMIR DE VIETNAM, POR TIPO DE PRODUCTO, 2018-2032 (TONELADAS)
TABLA 1279 MERCADO DE ALIMENTOS LISTOS PARA CONSUMIR DE VIETNAM, POR TIPO DE PRODUCTO, 2018-2032 (USD/KG)
TABLA 1280 PRODUCTOS CÁRNICOS DE VIETNAM EN EL MERCADO DE ALIMENTOS LISTOS PARA CONSUMIR, POR TIPO, 2018-2032 (MILES DE USD)
TABLA 1281 PRODUCTOS CÁRNICOS DE VIETNAM EN EL MERCADO DE ALIMENTOS LISTOS PARA CONSUMIR, POR TIPO, 2018-2032 (TONELADAS)
TABLA 1282 PRODUCTOS CÁRNICOS DE VIETNAM EN EL MERCADO DE ALIMENTOS LISTOS PARA CONSUMIR, POR TIPO, 2018-2032 (USD/KG)
TABLA 1283 PRODUCTOS A BASE DE CEREALES DE VIETNAM EN EL MERCADO DE ALIMENTOS LISTOS PARA CONSUMIR, POR TIPO, 2018-2032 (MILES DE USD)
TABLA 1284 PRODUCTOS A BASE DE CEREALES DE VIETNAM EN EL MERCADO DE ALIMENTOS LISTOS PARA CONSUMIR, POR TIPO, 2018-2032 (TONELADAS)
TABLA 1285 PRODUCTOS A BASE DE CEREALES DE VIETNAM EN EL MERCADO DE ALIMENTOS LISTOS PARA CONSUMIR, POR TIPO, 2018-2032 (USD/KG)
TABLA 1286 PRODUCTOS LÁCTEOS DE VIETNAM EN EL MERCADO DE ALIMENTOS LISTOS PARA CONSUMIR, POR TIPO, 2018-2032 (MILES DE USD)
TABLA 1287 PRODUCTOS LÁCTEOS DE VIETNAM EN EL MERCADO DE ALIMENTOS LISTOS PARA CONSUMIR, POR TIPO, 2018-2032 (TONELADAS)
TABLA 1288 PRODUCTOS LÁCTEOS DE VIETNAM EN EL MERCADO DE ALIMENTOS LISTOS PARA CONSUMIR, POR TIPO, 2018-2032 (USD/KG)
TABLA 1289 QUESO DE VIETNAM EN EL MERCADO DE ALIMENTOS LISTOS PARA CONSUMIR, POR FORMA, 2018-2032 (MILES DE USD)
TABLA 1290 QUESO DE VIETNAM EN EL MERCADO DE ALIMENTOS LISTOS PARA CONSUMIR, POR FORMA, 2018-2032 (TONELADAS)
TABLA 1291 QUESO DE VIETNAM EN EL MERCADO DE ALIMENTOS LISTOS PARA CONSUMIR, POR FORMA, 2018-2032 (USD/KG)
TABLA 1292 QUESO DE VIETNAM EN EL MERCADO DE ALIMENTOS LISTOS PARA CONSUMIR, POR TIPO, 2018-2032 (MILES DE USD)
TABLA 1293 QUESO DE VIETNAM EN EL MERCADO DE ALIMENTOS LISTOS PARA CONSUMIR, POR TIPO, 2018-2032 (TONELADAS)
TABLA 1294 QUESO DE VIETNAM EN EL MERCADO DE ALIMENTOS LISTOS PARA CONSUMIR, POR TIPO, 2018-2032 (USD/KG)
TABLA 1295 QUESO DE ORIGEN ANIMAL EN EL MERCADO DE ALIMENTOS LISTOS PARA CONSUMIR DE VIETNAM, POR TIPO, 2018-2032 (MILES DE USD)
TABLA 1296 QUESO VEGETAL DE VIETNAM EN EL MERCADO DE ALIMENTOS LISTOS PARA CONSUMIR, POR TIPO, 2018-2032 (MILES DE USD)
TABLA 1297 HELADOS DE VIETNAM EN EL MERCADO DE ALIMENTOS LISTOS PARA CONSUMIR, POR TIPO, 2018-2032 (MILES DE USD)
TABLA 1298 HELADOS DE VIETNAM EN EL MERCADO DE ALIMENTOS LISTOS PARA CONSUMIR, POR TIPO, 2018-2032 (TONELADAS)
TABLA 1299 HELADOS DE VIETNAM EN EL MERCADO DE ALIMENTOS LISTOS PARA CONSUMIR, POR TIPO, 2018-2032 (USD/KG)
TABLA 1300 CUAJADA DE VIETNAM EN EL MERCADO DE ALIMENTOS LISTOS PARA CONSUMIR, POR TIPO, 2018-2032 (MILES DE USD)
TABLA 1301 CUAJADA DE VIETNAM EN EL MERCADO DE ALIMENTOS LISTOS PARA CONSUMIR, POR TIPO, 2018-2032 (TONELADAS)
TABLA 1302 CUAJADA DE VIETNAM EN EL MERCADO DE ALIMENTOS LISTOS PARA CONSUMIR, POR TIPO, 2018-2032 (USD/KG)
TABLA 1303 PANEER DE VIETNAM EN EL MERCADO DE ALIMENTOS LISTOS PARA CONSUMIR, POR TIPO, 2018-2032 (MILES DE USD)
TABLA 1304 PANEER DE VIETNAM EN EL MERCADO DE ALIMENTOS LISTOS PARA CONSUMIR, POR TIPO, 2018-2032 (TONELADAS)
TABLA 1305 PANEER DE VIETNAM EN EL MERCADO DE ALIMENTOS LISTOS PARA CONSUMIR, POR TIPO, 2018-2032 (USD/KG)
TABLA 1306 GHEE DE VIETNAM EN EL MERCADO DE ALIMENTOS LISTOS PARA CONSUMIR, POR FUENTE, 2018-2032 (MILES DE USD)
TABLA 1307 GHEE DE VIETNAM EN EL MERCADO DE ALIMENTOS LISTOS PARA CONSUMIR, POR FUENTE, 2018-2032 (TONELADAS)
TABLA 1308 GHEE DE VIETNAM EN EL MERCADO DE ALIMENTOS LISTOS PARA CONSUMIR, POR FUENTE, 2018-2032 (USD/KG)
TABLA 1309 PRODUCTOS DE PANADERÍA DE VIETNAM EN EL MERCADO DE ALIMENTOS LISTOS PARA CONSUMIR, POR TIPO, 2018-2032 (MILES DE USD)
TABLA 1310 PRODUCTOS DE PANADERÍA EN EL MERCADO DE ALIMENTOS LISTOS PARA CONSUMIR DE VIETNAM, POR TIPO, 2018-2032 (TONELADAS)
TABLA 1311 PRODUCTOS DE PANADERÍA EN EL MERCADO DE ALIMENTOS LISTOS PARA CONSUMIR DE VIETNAM, POR TIPO, 2018-2032 (USD/KG)
TABLA 1312 DULCES SALADOS DE VIETNAM EN EL MERCADO DE ALIMENTOS LISTOS PARA CONSUMIR, POR TIPO, 2018-2032 (MILES DE USD)
TABLA 1313 DULCES SALADOS DE VIETNAM EN EL MERCADO DE ALIMENTOS LISTOS PARA CONSUMIR, POR TIPO, 2018-2032 (TONELADAS)
TABLA 1314 DULCES SALADOS DE VIETNAM EN EL MERCADO DE ALIMENTOS LISTOS PARA CONSUMIR, POR TIPO, 2018-2032 (USD/KG)
TABLA 1315 PRODUCTOS DE CONFITERÍA DE VIETNAM EN EL MERCADO DE ALIMENTOS LISTOS PARA CONSUMIR, POR TIPO, 2018-2032 (MILES DE USD)
TABLA 1316 PRODUCTOS DE CONFITERÍA DE VIETNAM EN EL MERCADO DE ALIMENTOS LISTOS PARA CONSUMIR, POR TIPO, 2018-2032 (TONELADAS)
TABLA 1317 PRODUCTOS DE CONFITERÍA DE VIETNAM EN EL MERCADO DE ALIMENTOS LISTOS PARA CONSUMIR, POR TIPO, 2018-2032 (USD/KG)
TABLA 1318 PRODUCTOS A BASE DE VEGETALES EN EL MERCADO DE ALIMENTOS LISTOS PARA CONSUMIR DE VIETNAM, POR TIPO, 2018-2032 (MILES DE USD)
TABLA 1319 PRODUCTOS A BASE DE VEGETALES EN EL MERCADO DE ALIMENTOS LISTOS PARA CONSUMIR DE VIETNAM, POR TIPO, 2018-2032 (TONELADAS)
TABLA 1320 PRODUCTOS A BASE DE VEGETALES EN EL MERCADO DE ALIMENTOS LISTOS PARA CONSUMIR DE VIETNAM, POR TIPO, 2018-2032 (USD/KG)
TABLA 1321 SOPAS INSTANTÁNEAS DE VIETNAM EN EL MERCADO DE ALIMENTOS LISTOS PARA CONSUMIR, POR TIPO, 2018-2032 (MILES DE USD)
TABLA 1322 SOPAS INSTANTÁNEAS DE VIETNAM EN EL MERCADO DE ALIMENTOS LISTOS PARA CONSUMIR, POR TIPO, 2018-2032 (TONELADAS)
TABLA 1323 SOPAS INSTANTÁNEAS DE VIETNAM EN EL MERCADO DE ALIMENTOS LISTOS PARA CONSUMIR, POR TIPO, 2018-2032 (USD/KG)
TABLA 1324 APERITIVOS SALADOS DE VIETNAM EN EL MERCADO DE ALIMENTOS LISTOS PARA CONSUMIR, POR TIPO, 2018-2032 (MILES DE USD)
TABLA 1325 APERITIVOS SALADOS DE VIETNAM EN EL MERCADO DE ALIMENTOS LISTOS PARA CONSUMIR, POR TIPO, 2018-2032 (TONELADAS)
TABLA 1326 APERITIVOS SALADOS DE VIETNAM EN EL MERCADO DE ALIMENTOS LISTOS PARA CONSUMIR, POR TIPO, 2018-2032 (USD/KG)
TABLA 1327 PAPAS FRITAS DE VIETNAM EN EL MERCADO DE ALIMENTOS LISTOS PARA CONSUMIR, POR TIPO, 2018-2032 (MILES DE USD)
TABLA 1328 PAPAS FRITAS DE VIETNAM EN EL MERCADO DE ALIMENTOS LISTOS PARA CONSUMIR, POR TIPO, 2018-2032 (TONELADAS)
TABLA 1329 PAPAS FRITAS DE VIETNAM EN EL MERCADO DE ALIMENTOS LISTOS PARA CONSUMIR, POR TIPO, 2018-2032 (USD/KG)
TABLA 1330 OBLEAS DE VIETNAM EN EL MERCADO DE ALIMENTOS LISTOS PARA CONSUMIR, POR TIPO, 2018-2032 (MILES DE USD)
TABLA 1331 OBLEAS DE VIETNAM EN EL MERCADO DE ALIMENTOS LISTOS PARA CONSUMIR, POR TIPO, 2018-2032 (TONELADAS)
TABLA 1332 OBLEAS DE VIETNAM EN EL MERCADO DE ALIMENTOS LISTOS PARA CONSUMIR, POR TIPO, 2018-2032 (USD/KG)
TABLA 1333 NAMKEENS DE VIETNAM EN EL MERCADO DE ALIMENTOS LISTOS PARA CONSUMIR, POR TIPO, 2018-2032 (MILES DE USD)
TABLA 1334 NAMKEENS DE VIETNAM EN EL MERCADO DE ALIMENTOS LISTOS PARA CONSUMIR, POR TIPO, 2018-2032 (TONELADAS)
TABLA 1335 NAMKEENS DE VIETNAM EN EL MERCADO DE ALIMENTOS LISTOS PARA CONSUMIR, POR TIPO, 2018-2032 (USD/KG)
TABLA 1336 GALLETAS Y GALLETAS DE VIETNAM EN EL MERCADO DE ALIMENTOS LISTOS PARA CONSUMIR, POR TIPO, 2018-2032 (MILES DE USD)
TABLA 1337 GALLETAS Y GALLETAS DE VIETNAM EN EL MERCADO DE ALIMENTOS LISTOS PARA CONSUMIR, POR TIPO, 2018-2032 (TONELADAS)
TABLA 1338 GALLETAS Y GALLETAS DE VIETNAM EN EL MERCADO DE ALIMENTOS LISTOS PARA CONSUMIR, POR TIPO, 2018-2032 (USD/KG)
TABLA 1339 ALIMENTOS REFRIGERADOS EN EL MERCADO DE ALIMENTOS LISTOS PARA CONSUMIR DE VIETNAM, POR TIPO, 2018-2032 (MILES DE USD)
TABLA 1340 ALIMENTOS REFRIGERADOS EN EL MERCADO DE ALIMENTOS LISTOS PARA CONSUMIR DE VIETNAM, POR TIPO, 2018-2032 (TONELADAS)
TABLA 1341 ALIMENTOS REFRIGERADOS EN EL MERCADO DE ALIMENTOS LISTOS PARA CONSUMIR DE VIETNAM, POR TIPO, 2018-2032 (USD/KG)
TABLA 1342 APERITIVOS DE CARNE DE ORIGEN VEGETAL EN EL MERCADO DE ALIMENTOS LISTOS PARA CONSUMIR DE VIETNAM, POR TIPO, 2018-2032 (MILES DE USD)
TABLA 1343 APERITIVOS DE CARNE DE ORIGEN VEGETAL EN EL MERCADO DE ALIMENTOS LISTOS PARA CONSUMIR DE VIETNAM, POR TIPO, 2018-2032 (TONELADAS)
TABLA 1344 APERITIVOS DE CARNE DE ORIGEN VEGETAL EN EL MERCADO DE ALIMENTOS LISTOS PARA CONSUMIR DE VIETNAM, POR TIPO, 2018-2032 (USD/KG)
TABLA 1345 APERITIVOS DE CARNE DE ORIGEN VEGETAL EN EL MERCADO DE ALIMENTOS LISTOS PARA CONSUMIR DE VIETNAM, POR FUENTE, 2018-2032 (MILES DE USD)
TABLA 1346 APERITIVOS DE CARNE DE ORIGEN VEGETAL EN EL MERCADO DE ALIMENTOS LISTOS PARA CONSUMIR DE VIETNAM, POR FUENTE, 2018-2032 (TONELADAS)
TABLA 1347 APERITIVOS DE CARNE DE ORIGEN VEGETAL EN EL MERCADO DE ALIMENTOS LISTOS PARA CONSUMIR DE VIETNAM, POR FUENTE, 2018-2032 (USD/KG)
TABLA 1348 COMIDAS LISTAS PARA COMER EN VIETNAM, POR TIPO, 2018-2032 (MILES DE USD)
TABLA 1349 COMIDAS LISTAS PARA COMER EN EL MERCADO DE ALIMENTOS LISTOS PARA COMER DE VIETNAM, POR TIPO, 2018-2032 (TONELADAS)
TABLA 1350 COMIDAS LISTAS PARA COMER EN EL MERCADO DE ALIMENTOS LISTOS PARA COMER DE VIETNAM, POR TIPO, 2018-2032 (USD/KG)
TABLA 1351 MERCADO DE ALIMENTOS LISTOS PARA CONSUMIR DE VIETNAM, POR CATEGORÍA, 2018-2032 (MILES DE USD)
TABLA 1352 MERCADO DE ESPECIALIDADES DE VIETNAM EN ALIMENTOS LISTOS PARA CONSUMIR, POR TIPO, 2018-2032 (MILES DE USD)
TABLA 1353 MERCADO DE ALIMENTOS LISTOS PARA CONSUMIR DE VIETNAM, POR TIPO DE ENVASE, 2018-2032 (MILES DE USD)
TABLA 1354 BOTELLAS DE VIETNAM EN EL MERCADO DE ALIMENTOS LISTOS PARA CONSUMIR, POR TIPO, 2018-2032 (MILES DE USD)
TABLA 1355 MERCADO DE ALIMENTOS LISTOS PARA CONSUMIR DE VIETNAM, POR TAMAÑO DE ENVASE, 2018-2032 (MILES DE USD)
TABLA 1356 MERCADO DE ALIMENTOS LISTOS PARA CONSUMIR DE VIETNAM, POR TECNOLOGÍA DE ENVASADO, 2018-2032 (MILES DE USD)
TABLA 1357 MERCADO DE ALIMENTOS LISTOS PARA CONSUMIR DE VIETNAM, POR TIPO DE ALMACENAMIENTO, 2018-2032 (MILES DE USD)
TABLA 1358 MERCADO DE ALIMENTOS LISTOS PARA CONSUMIR DE VIETNAM, POR CANAL DE DISTRIBUCIÓN, 2018-2032 (MILES DE USD)
TABLA 1359 MERCADO DE ALIMENTOS LISTOS PARA CONSUMIR EN TIENDAS DE VIETNAM, POR TIPO, 2018-2032 (MILES DE USD)
TABLA 1360 MERCADO DE ALIMENTOS LISTOS PARA CONSUMIR SIN TIENDAS DE VIETNAM, POR TIPO, 2018-2032 (MILES DE USD)
TABLA 1361 MERCADO DE ALIMENTOS LISTOS PARA CONSUMIR DE VIETNAM, POR USUARIO FINAL, 2018-2032 (MILES DE USD)
TABLA 1362 SERVICIOS DE LA INDUSTRIA ALIMENTARIA DE VIETNAM EN EL MERCADO DE ALIMENTOS LISTOS PARA CONSUMIR, POR TIPO, 2018-2032 (MILES DE USD)
TABLA 1363 RESTAURANTES DE VIETNAM EN EL MERCADO DE ALIMENTOS LISTA PARA COMER, POR TIPO, 2018-2032 (MILES DE USD)
TABLA 1364 MERCADO DE ALIMENTOS LISTOS PARA CONSUMIR DE TAIWÁN, POR TIPO DE PRODUCTO, 2018-2032 (MILES DE USD)
TABLA 1365 MERCADO DE ALIMENTOS LISTOS PARA CONSUMIR DE TAIWÁN, POR TIPO DE PRODUCTO, 2018-2032 (TONELADAS)
TABLA 1366 MERCADO DE ALIMENTOS LISTOS PARA CONSUMIR DE TAIWÁN, POR TIPO DE PRODUCTO, 2018-2032 (USD/KG)
TABLA 1367 PRODUCTOS CÁRNICOS DE TAIWÁN EN EL MERCADO DE ALIMENTOS LISTOS PARA CONSUMIR, POR TIPO, 2018-2032 (MILES DE USD)
TABLA 1368 PRODUCTOS CÁRNICOS DE TAIWÁN EN EL MERCADO DE ALIMENTOS LISTOS PARA CONSUMIR, POR TIPO, 2018-2032 (TONELADAS)
TABLA 1369 PRODUCTOS CÁRNICOS DE TAIWÁN EN EL MERCADO DE ALIMENTOS LISTOS PARA CONSUMIR, POR TIPO, 2018-2032 (USD/KG)
TABLA 1370 PRODUCTOS A BASE DE CEREALES DE TAIWÁN EN EL MERCADO DE ALIMENTOS LISTOS PARA CONSUMIR, POR TIPO, 2018-2032 (MILES DE USD)
TABLA 1371 PRODUCTOS A BASE DE CEREALES DE TAIWÁN EN EL MERCADO DE ALIMENTOS LISTOS PARA CONSUMIR, POR TIPO, 2018-2032 (TONELADAS)
TABLA 1372 PRODUCTOS A BASE DE CEREALES DE TAIWÁN EN EL MERCADO DE ALIMENTOS LISTOS PARA CONSUMIR, POR TIPO, 2018-2032 (USD/KG)
TABLA 1373 PRODUCTOS LÁCTEOS DE TAIWÁN EN EL MERCADO DE ALIMENTOS LISTOS PARA CONSUMIR, POR TIPO, 2018-2032 (MILES DE USD)
TABLA 1374 PRODUCTOS LÁCTEOS DE TAIWÁN EN EL MERCADO DE ALIMENTOS LISTOS PARA CONSUMIR, POR TIPO, 2018-2032 (TONELADAS)
TABLA 1375 PRODUCTOS LÁCTEOS DE TAIWÁN EN EL MERCADO DE ALIMENTOS LISTOS PARA CONSUMIR, POR TIPO, 2018-2032 (USD/KG)
TABLA 1376 QUESO DE TAIWÁN EN EL MERCADO DE ALIMENTOS LISTOS PARA CONSUMIR, POR FORMA, 2018-2032 (MILES DE USD)
TABLA 1377 QUESO DE TAIWÁN EN EL MERCADO DE ALIMENTOS LISTOS PARA CONSUMIR, POR FORMA, 2018-2032 (TONELADAS)
TABLA 1378 QUESO DE TAIWÁN EN EL MERCADO DE ALIMENTOS LISTOS PARA CONSUMIR, POR FORMA, 2018-2032 (USD/KG)
TABLA 1379 QUESO DE TAIWÁN EN EL MERCADO DE ALIMENTOS LISTOS PARA CONSUMIR, POR TIPO, 2018-2032 (MILES DE USD)
TABLA 1380 QUESO DE TAIWÁN EN EL MERCADO DE ALIMENTOS LISTOS PARA CONSUMIR, POR TIPO, 2018-2032 (TONELADAS)
TABLA 1381 QUESO DE TAIWÁN EN EL MERCADO DE ALIMENTOS LISTOS PARA CONSUMIR, POR TIPO, 2018-2032 (USD/KG)
TABLA 1382 QUESO DE ORIGEN ANIMAL DE TAIWÁN EN EL MERCADO DE ALIMENTOS LISTOS PARA CONSUMIR, POR TIPO, 2018-2032 (MILES DE USD)
TABLA 1383 QUESO VEGETAL DE TAIWÁN EN EL MERCADO DE ALIMENTOS LISTOS PARA CONSUMIR, POR TIPO, 2018-2032 (MILES DE USD)
TABLA 1384 HELADOS DE TAIWÁN EN EL MERCADO DE ALIMENTOS LISTOS PARA CONSUMIR, POR TIPO, 2018-2032 (MILES DE USD)
TABLA 1385 HELADOS DE TAIWÁN EN EL MERCADO DE ALIMENTOS LISTOS PARA CONSUMIR, POR TIPO, 2018-2032 (TONELADAS)
TABLA 1386 HELADOS DE TAIWÁN EN EL MERCADO DE ALIMENTOS LISTOS PARA CONSUMIR, POR TIPO, 2018-2032 (USD/KG)
TABLA 1387 CUAJADA DE TAIWÁN EN EL MERCADO DE ALIMENTOS LISTOS PARA CONSUMIR, POR TIPO, 2018-2032 (MILES DE USD)
TABLA 1388 CUAJADA DE TAIWÁN EN EL MERCADO DE ALIMENTOS LISTOS PARA CONSUMIR, POR TIPO, 2018-2032 (TONELADAS)
TABLA 1389 CUAJADA DE TAIWÁN EN EL MERCADO DE ALIMENTOS LISTOS PARA CONSUMIR, POR TIPO, 2018-2032 (USD/KG)
TABLA 1390 PANEER DE TAIWÁN EN EL MERCADO DE ALIMENTOS LISTOS PARA CONSUMIR, POR TIPO, 2018-2032 (MILES DE USD)
TABLA 1391 PANEER DE TAIWÁN EN EL MERCADO DE ALIMENTOS LISTOS PARA CONSUMIR, POR TIPO, 2018-2032 (TONELADAS)
TABLA 1392 PANEER DE TAIWÁN EN EL MERCADO DE ALIMENTOS LISTOS PARA CONSUMIR, POR TIPO, 2018-2032 (USD/KG)
TABLA 1393 GHEE DE TAIWÁN EN EL MERCADO DE ALIMENTOS LISTOS PARA CONSUMIR, POR FUENTE, 2018-2032 (MILES DE USD)
TABLA 1394 GHEE DE TAIWÁN EN EL MERCADO DE ALIMENTOS LISTOS PARA CONSUMIR, POR FUENTE, 2018-2032 (TONELADAS)
TABLA 1395 GHEE DE TAIWÁN EN EL MERCADO DE ALIMENTOS LISTOS PARA CONSUMIR, POR FUENTE, 2018-2032 (USD/KG)
TABLA 1396 PRODUCTOS DE PANADERÍA DE TAIWÁN EN EL MERCADO DE ALIMENTOS LISTOS PARA CONSUMIR, POR TIPO, 2018-2032 (MILES DE USD)
TABLA 1397 PRODUCTOS DE PANADERÍA DE TAIWÁN EN EL MERCADO DE ALIMENTOS LISTOS PARA CONSUMIR, POR TIPO, 2018-2032 (TONELADAS)
TABLA 1398 PRODUCTOS DE PANADERÍA DE TAIWÁN EN EL MERCADO DE ALIMENTOS LISTOS PARA CONSUMIR, POR TIPO, 2018-2032 (USD/KG)
TABLA 1399 DULCES SALADOS DE TAIWÁN EN EL MERCADO DE ALIMENTOS LISTOS PARA CONSUMIR, POR TIPO, 2018-2032 (MILES DE USD)
TABLA 1400 DULCES SALADOS DE TAIWÁN EN EL MERCADO DE ALIMENTOS LISTOS PARA CONSUMIR, POR TIPO, 2018-2032 (TONELADAS)
TABLA 1401 DULCES SALADOS DE TAIWÁN EN EL MERCADO DE ALIMENTOS LISTOS PARA CONSUMIR, POR TIPO, 2018-2032 (USD/KG)
TABLA 1402 PRODUCTOS DE CONFITERÍA DE TAIWÁN EN EL MERCADO DE ALIMENTOS LISTOS PARA CONSUMIR, POR TIPO, 2018-2032 (MILES DE USD)
TABLA 1403 PRODUCTOS DE CONFITERÍA DE TAIWÁN EN EL MERCADO DE ALIMENTOS LISTOS PARA CONSUMIR, POR TIPO, 2018-2032 (TONELADAS)
TABLA 1404 PRODUCTOS DE CONFITERÍA DE TAIWÁN EN EL MERCADO DE ALIMENTOS LISTOS PARA CONSUMIR, POR TIPO, 2018-2032 (USD/KG)
TABLA 1405 PRODUCTOS A BASE DE VEGETALES DE TAIWÁN EN EL MERCADO DE ALIMENTOS LISTOS PARA CONSUMIR, POR TIPO, 2018-2032 (MILES DE USD)
TABLA 1406 PRODUCTOS A BASE DE VEGETALES DE TAIWÁN EN EL MERCADO DE ALIMENTOS LISTOS PARA CONSUMIR, POR TIPO, 2018-2032 (TONELADAS)
TABLA 1407 PRODUCTOS A BASE DE VEGETALES DE TAIWÁN EN EL MERCADO DE ALIMENTOS LISTOS PARA CONSUMIR, POR TIPO, 2018-2032 (USD/KG)
TABLA 1408 SOPAS INSTANTÁNEAS EN EL MERCADO DE ALIMENTOS LISTOS PARA CONSUMIR DE TAIWÁN, POR TIPO, 2018-2032 (MILES DE USD)
TABLA 1409 SOPAS INSTANTÁNEAS EN EL MERCADO DE ALIMENTOS LISTOS PARA CONSUMIR DE TAIWÁN, POR TIPO, 2018-2032 (TONELADAS)
TABLA 1410 SOPAS INSTANTÁNEAS EN EL MERCADO DE ALIMENTOS LISTOS PARA CONSUMIR DE TAIWÁN, POR TIPO, 2018-2032 (USD/KG)
TABLA 1411 APERITIVOS SALADOS DE TAIWÁN EN EL MERCADO DE ALIMENTOS LISTOS PARA COMER, POR TIPO, 2018-2032 (MILES DE USD)
TABLA 1412 APERITIVOS SALADOS DE TAIWÁN EN EL MERCADO DE ALIMENTOS LISTOS PARA COMER, POR TIPO, 2018-2032 (TONELADAS)
TABLA 1413 APERITIVOS SALADOS DE TAIWÁN EN EL MERCADO DE ALIMENTOS LISTOS PARA CONSUMIR, POR TIPO, 2018-2032 (USD/KG)
TABLA 1414 PAPAS FRITAS DE TAIWÁN EN EL MERCADO DE ALIMENTOS LISTOS PARA CONSUMIR, POR TIPO, 2018-2032 (MILES DE USD)
TABLA 1415 PAPAS FRITAS DE TAIWÁN EN EL MERCADO DE ALIMENTOS LISTOS PARA CONSUMIR, POR TIPO, 2018-2032 (TONELADAS)
TABLA 1416 PAPAS FRITAS DE TAIWÁN EN EL MERCADO DE ALIMENTOS LISTOS PARA CONSUMIR, POR TIPO, 2018-2032 (USD/KG)
TABLA 1417 OBLEAS DE TAIWÁN EN EL MERCADO DE ALIMENTOS LISTOS PARA CONSUMIR, POR TIPO, 2018-2032 (MILES DE USD)
TABLA 1418 OBLEAS DE TAIWÁN EN EL MERCADO DE ALIMENTOS LISTOS PARA CONSUMIR, POR TIPO, 2018-2032 (TONELADAS)
TABLA 1419 OBLEAS DE TAIWÁN EN EL MERCADO DE ALIMENTOS LISTOS PARA CONSUMIR, POR TIPO, 2018-2032 (USD/KG)
TABLA 1420 NAMKEENS DE TAIWÁN EN EL MERCADO DE ALIMENTOS LISTOS PARA CONSUMIR, POR TIPO, 2018-2032 (MILES DE USD)
TABLA 1421 NAMKEENS DE TAIWÁN EN EL MERCADO DE ALIMENTOS LISTOS PARA CONSUMIR, POR TIPO, 2018-2032 (TONELADAS)
TABLA 1422 NAMKEENS DE TAIWÁN EN EL MERCADO DE ALIMENTOS LISTOS PARA CONSUMIR, POR TIPO, 2018-2032 (USD/KG)
TABLA 1423 GALLETAS Y GALLETAS DE TAIWÁN EN EL MERCADO DE ALIMENTOS LISTOS PARA CONSUMIR, POR TIPO, 2018-2032 (MILES DE USD)
TABLA 1424 GALLETAS Y GALLETAS DE TAIWÁN EN EL MERCADO DE ALIMENTOS LISTOS PARA CONSUMIR, POR TIPO, 2018-2032 (TONELADAS)
TABLA 1425 GALLETAS Y GALLETAS DE TAIWÁN EN EL MERCADO DE ALIMENTOS LISTOS PARA CONSUMIR, POR TIPO, 2018-2032 (USD/KG)
TABLA 1426 ALIMENTOS REFRIGERADOS EN EL MERCADO DE ALIMENTOS LISTOS PARA CONSUMIR DE TAIWÁN, POR TIPO, 2018-2032 (MILES DE USD)
TABLA 1427 ALIMENTOS REFRIGERADOS EN EL MERCADO DE ALIMENTOS LISTOS PARA CONSUMIR DE TAIWÁN, POR TIPO, 2018-2032 (TONELADAS)
TABLA 1428 ALIMENTOS REFRIGERADOS EN EL MERCADO DE ALIMENTOS LISTOS PARA CONSUMIR DE TAIWÁN, POR TIPO, 2018-2032 (USD/KG)
TABLA 1429 APERITIVOS DE CARNE DE ORIGEN VEGETAL EN EL MERCADO DE ALIMENTOS LISTOS PARA CONSUMIR DE TAIWÁN, POR TIPO, 2018-2032 (MILES DE USD)
TABLA 1430 APERITIVOS DE CARNE DE ORIGEN VEGETAL EN EL MERCADO DE ALIMENTOS LISTOS PARA CONSUMIR DE TAIWÁN, POR TIPO, 2018-2032 (TONELADAS)
TABLA 1431 APERITIVOS DE CARNE DE ORIGEN VEGETAL EN EL MERCADO DE ALIMENTOS LISTOS PARA CONSUMIR DE TAIWÁN, POR TIPO, 2018-2032 (USD/KG)
TABLA 1432 APERITIVOS DE CARNE DE ORIGEN VEGETAL EN EL MERCADO DE ALIMENTOS LISTOS PARA CONSUMIR DE TAIWÁN, POR FUENTE, 2018-2032 (MILES DE USD)
TABLA 1433 APERITIVOS DE CARNE DE ORIGEN VEGETAL EN EL MERCADO DE ALIMENTOS LISTOS PARA CONSUMIR DE TAIWÁN, POR FUENTE, 2018-2032 (TONELADAS)
TABLA 1434 APERITIVOS DE CARNE DE ORIGEN VEGETAL EN EL MERCADO DE ALIMENTOS LISTOS PARA CONSUMIR DE TAIWÁN, POR FUENTE, 2018-2032 (USD/KG)
TABLA 1435 COMIDAS LISTAS PARA COMER EN EL MERCADO DE ALIMENTOS LISTOS PARA COMER DE TAIWÁN, POR TIPO, 2018-2032 (MILES DE USD)
TABLA 1436 COMIDAS LISTAS PARA COMER EN EL MERCADO DE ALIMENTOS LISTOS PARA COMER DE TAIWÁN, POR TIPO, 2018-2032 (TONELADAS)
TABLA 1437 COMIDAS LISTAS PARA COMER EN EL MERCADO DE ALIMENTOS LISTOS PARA COMER DE TAIWÁN, POR TIPO, 2018-2032 (USD/KG)
TABLA 1438 MERCADO DE ALIMENTOS LISTOS PARA CONSUMIR DE TAIWÁN, POR CATEGORÍA, 2018-2032 (MILES DE USD)
TABLA 1439 ESPECIALIDADES DE TAIWÁN EN EL MERCADO DE ALIMENTOS LISTOS PARA CONSUMIR, POR TIPO, 2018-2032 (MILES DE USD)
TABLA 1440 MERCADO DE ALIMENTOS LISTOS PARA CONSUMIR EN TAIWÁN, POR TIPO DE ENVASE, 2018-2032 (MILES DE USD)
TABLA 1441 BOTELLAS DE TAIWÁN EN EL MERCADO DE ALIMENTOS LISTOS PARA CONSUMIR, POR TIPO, 2018-2032 (MILES DE USD)
TABLA 1442 MERCADO DE ALIMENTOS LISTOS PARA CONSUMIR DE TAIWÁN, POR TAMAÑO DE ENVASE, 2018-2032 (MILES DE USD)
TABLA 1443 MERCADO DE ALIMENTOS LISTOS PARA CONSUMIR DE TAIWÁN, POR TECNOLOGÍA DE ENVASADO, 2018-2032 (MILES DE USD)
TABLA 1444 MERCADO DE ALIMENTOS LISTOS PARA CONSUMIR DE TAIWÁN, POR TIPO DE ALMACENAMIENTO, 2018-2032 (MILES DE USD)
TABLA 1445 MERCADO DE ALIMENTOS LISTOS PARA CONSUMIR DE TAIWÁN, POR CANAL DE DISTRIBUCIÓN, 2018-2032 (MILES DE USD)
TABLA 1446 MERCADO DE ALIMENTOS LISTOS PARA COMER CON TIENDAS EN TAIWÁN, POR TIPO, 2018-2032 (MILES DE USD)
TABLA 1447 MERCADO DE ALIMENTOS LISTOS PARA CONSUMIR SIN TIENDAS DE TAIWÁN, POR TIPO, 2018-2032 (MILES DE USD)
TABLA 1448 MERCADO DE ALIMENTOS LISTOS PARA CONSUMIR EN TAIWÁN, POR USUARIO FINAL, 2018-2032 (MILES DE USD)
TABLA 1449 SERVICIOS DE LA INDUSTRIA ALIMENTARIA DE TAIWÁN EN EL MERCADO DE ALIMENTOS LISTOS PARA CONSUMIR, POR TIPO, 2018-2032 (MILES DE USD)
TABLA 1450 RESTAURANTES DE TAIWÁN EN EL MERCADO DE COMIDA LISTA PARA COMER, POR TIPO, 2018-2032 (MILES DE USD)
TABLA 1451 RESTO DEL MERCADO DE ALIMENTOS LISTOS PARA CONSUMIR DE ASIA-PACÍFICO, POR TIPO DE PRODUCTO, 2018-2032 (MILES DE USD)
TABLA 1452 RESTO DEL MERCADO DE ALIMENTOS LISTOS PARA CONSUMIR DE ASIA-PACÍFICO, POR TIPO DE PRODUCTO, 2018-2032 (TONELADAS)
Lista de figuras
FIGURA 1 MERCADO DE ALIMENTOS LISTOS PARA CONSUMIR DE ASIA-PACÍFICO
FIGURA 2 MERCADO DE ALIMENTOS LISTOS PARA CONSUMIR DE ASIA-PACÍFICO: TRIANGULACIÓN DE DATOS
FIGURA 3 MERCADO DE ALIMENTOS LISTOS PARA CONSUMIR DE ASIA-PACÍFICO: ANÁLISIS DROC
FIGURA 4 MERCADO DE ALIMENTOS LISTOS PARA CONSUMIR DE ASIA-PACÍFICO: ANÁLISIS DEL MERCADO DE ASIA-PACÍFICO VS. REGIONAL
FIGURA 5 MERCADO DE ALIMENTOS LISTOS PARA CONSUMIR DE ASIA-PACÍFICO: ANÁLISIS DE INVESTIGACIÓN DE EMPRESAS
FIGURA 6 MERCADO DE ALIMENTOS LISTOS PARA CONSUMIR DE ASIA-PACÍFICO: MODELADO MULTIVARIADO
FIGURA 7 MERCADO DE ALIMENTOS LISTOS PARA CONSUMIR DE ASIA-PACÍFICO: DATOS DEMOGRÁFICOS DE LAS ENTREVISTAS
FIGURA 8 MERCADO DE ALIMENTOS LISTOS PARA CONSUMIR DE ASIA-PACÍFICO: CUADRÍCULA DE POSICIÓN DE MERCADO DBMR
FIGURA 9 MERCADO DE ALIMENTOS LISTOS PARA CONSUMIR DE ASIA-PACÍFICO: CUADRÍCULA DE COBERTURA DE APLICACIONES DEL MERCADO
FIGURA 10 MERCADO DE ALIMENTOS LISTOS PARA CONSUMIR DE ASIA-PACÍFICO: ANÁLISIS DE LA PARTICIPACIÓN DE LOS PROVEEDORES
FIGURA 11 MERCADO DE ALIMENTOS LISTOS PARA CONSUMIR DE ASIA-PACÍFICO: SEGMENTACIÓN
FIGURA 12 RESUMEN EJECUTIVO DE ASIA-PACÍFICO
FIGURA 13 DOCE SEGMENTOS COMPRENDEN EL MERCADO DE ALIMENTOS LISTOS PARA CONSUMIR DE ASIA-PACÍFICO, POR TIPO DE PRODUCTO
FIGURA 14 DECISIONES ESTRATÉGICAS
FIGURA 15 SE ESPERA QUE EL AUMENTO DE LAS HORAS DE TRABAJO Y LOS ESTILOS DE VIDA ACELERADOS IMPULSEN EL MERCADO DE ALIMENTOS LISTOS PARA COMER DE ASIA-PACÍFICO EN EL PERÍODO DE PRONÓSTICO
FIGURA 16 SE ESPERA QUE EL SEGMENTO DE PRODUCTOS CÁRNICOS REPRESENTE LA MAYOR PARTICIPACIÓN DEL MERCADO DE ALIMENTOS LISTOS PARA CONSUMIR DE ASIA-PACÍFICO EN 2025 Y 2032
FIGURA 17 LAS CINCO FUERZAS DE PORTER
FIGURA 18 ESCENARIO DE IMPORTACIÓN Y EXPORTACIÓN (MILES DE USD)
FIGURA 19 ANÁLISIS DE LA CADENA DE VALOR
FIGURA 20 MERCADO DE ALIMENTOS LISTOS PARA CONSUMIR DE ASIA-PACÍFICO, 2024-2032, PRECIO DE VENTA PROMEDIO (USD/KG)
FIGURA 21 IMPULSORES, RESTRICCIONES, OPORTUNIDADES Y DESAFÍOS PARA EL MERCADO DE ALIMENTOS DE ASIA-PACÍFICO READY TO EAST
FIGURA 22 HORAS DE TRABAJO ANUALES
FIGURA 23 INGRESOS PERSONALES DISPONIBLES EN CHINA
FIGURA 24 MERCADO DE ALIMENTOS LISTOS PARA CONSUMIR DE ASIA-PACÍFICO: POR TIPO DE PRODUCTO, 2018-2032
FIGURA 25 MERCADO DE ALIMENTOS LISTOS PARA CONSUMIR DE ASIA-PACÍFICO: POR CATEGORÍA, 2018-2032
FIGURA 26 MERCADO DE ALIMENTOS LISTOS PARA CONSUMIR DE ASIA-PACÍFICO: POR TIPO DE ENVASE, 2024
FIGURA 27 MERCADO DE ALIMENTOS LISTOS PARA CONSUMIR DE ASIA-PACÍFICO: POR TAMAÑO DE ENVASE, 2024
FIGURA 28 MERCADO DE ALIMENTOS LISTOS PARA CONSUMIR DE ASIA-PACÍFICO: POR TECNOLOGÍA DE ENVASADO, 2024
FIGURA 29 MERCADO DE ALIMENTOS LISTOS PARA CONSUMIR DE ASIA-PACÍFICO: POR TIPO DE ALMACENAMIENTO, 2018-2032
FIGURA 30 MERCADO DE ALIMENTOS LISTOS PARA CONSUMIR DE ASIA-PACÍFICO: POR CANAL DE DISTRIBUCIÓN, 2024
FIGURA 31 MERCADO DE ALIMENTOS LISTOS PARA CONSUMIR DE ASIA-PACÍFICO: POR USUARIO FINAL, 2024
FIGURA 32 MERCADO DE ALIMENTOS LISTOS PARA CONSUMIR DE ASIA-PACÍFICO: INSTANTÁNEA (2024)
FIGURA 33 MERCADO DE ALIMENTOS LISTOS PARA CONSUMIR DE ASIA-PACÍFICO: PARTICIPACIÓN DE LA EMPRESA 2024 (%)
Metodología de investigación
La recopilación de datos y el análisis del año base se realizan utilizando módulos de recopilación de datos con muestras de gran tamaño. La etapa incluye la obtención de información de mercado o datos relacionados a través de varias fuentes y estrategias. Incluye el examen y la planificación de todos los datos adquiridos del pasado con antelación. Asimismo, abarca el examen de las inconsistencias de información observadas en diferentes fuentes de información. Los datos de mercado se analizan y estiman utilizando modelos estadísticos y coherentes de mercado. Además, el análisis de la participación de mercado y el análisis de tendencias clave son los principales factores de éxito en el informe de mercado. Para obtener más información, solicite una llamada de un analista o envíe su consulta.
La metodología de investigación clave utilizada por el equipo de investigación de DBMR es la triangulación de datos, que implica la extracción de datos, el análisis del impacto de las variables de datos en el mercado y la validación primaria (experto en la industria). Los modelos de datos incluyen cuadrícula de posicionamiento de proveedores, análisis de línea de tiempo de mercado, descripción general y guía del mercado, cuadrícula de posicionamiento de la empresa, análisis de patentes, análisis de precios, análisis de participación de mercado de la empresa, estándares de medición, análisis global versus regional y de participación de proveedores. Para obtener más información sobre la metodología de investigación, envíe una consulta para hablar con nuestros expertos de la industria.
Personalización disponible
Data Bridge Market Research es líder en investigación formativa avanzada. Nos enorgullecemos de brindar servicios a nuestros clientes existentes y nuevos con datos y análisis que coinciden y se adaptan a sus objetivos. El informe se puede personalizar para incluir análisis de tendencias de precios de marcas objetivo, comprensión del mercado de países adicionales (solicite la lista de países), datos de resultados de ensayos clínicos, revisión de literatura, análisis de mercado renovado y base de productos. El análisis de mercado de competidores objetivo se puede analizar desde análisis basados en tecnología hasta estrategias de cartera de mercado. Podemos agregar tantos competidores sobre los que necesite datos en el formato y estilo de datos que esté buscando. Nuestro equipo de analistas también puede proporcionarle datos en archivos de Excel sin procesar, tablas dinámicas (libro de datos) o puede ayudarlo a crear presentaciones a partir de los conjuntos de datos disponibles en el informe.

