Middle East And North Africa Aesthetic Injectable Fillers Market
Tamaño del mercado en miles de millones de dólares
Tasa de crecimiento anual compuesta (CAGR) :
% 
 USD
347.92 Million
USD
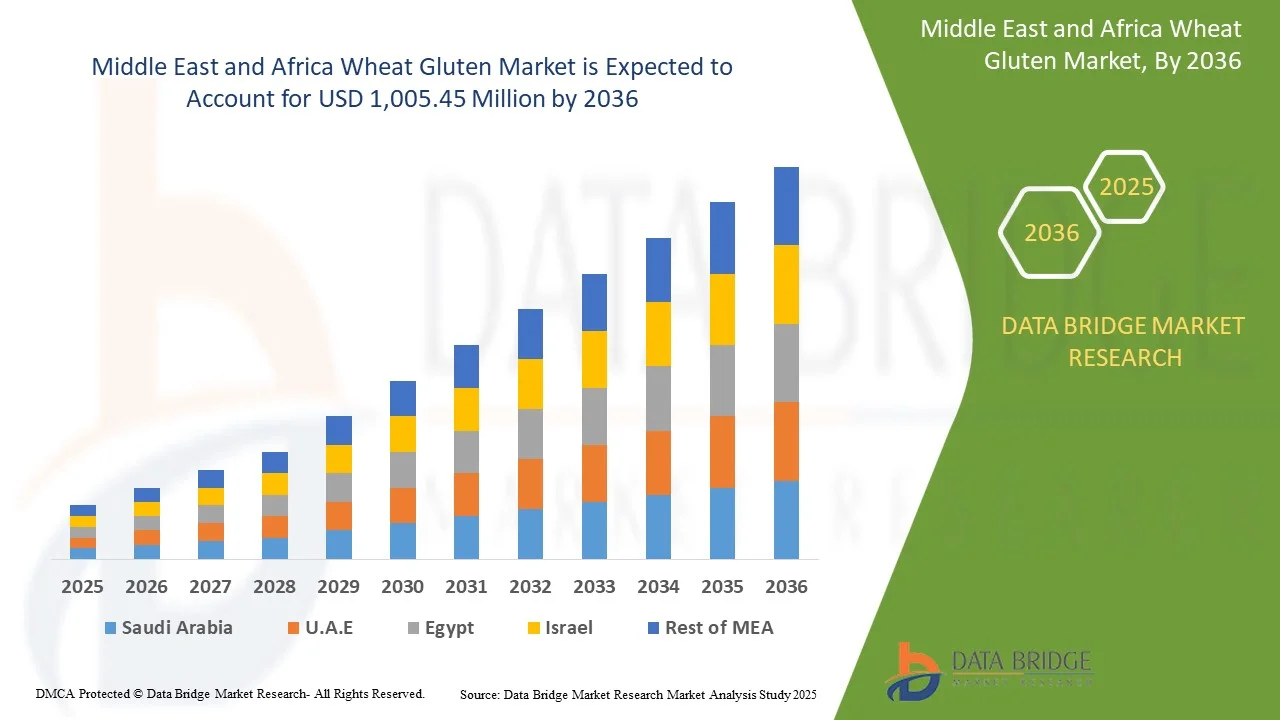
1,005.45 Million
2024
2036
USD
347.92 Million
USD
1,005.45 Million
2024
2036
| 2025 –2036 | |
| USD 347.92 Million | |
| USD 1,005.45 Million | |
| % | |
|
Segmentación del mercado de rellenos inyectables estéticos en Oriente Medio y Norte de África: por tipo de producto (rellenos inyectables estéticos naturales y sintéticos), por tipo (rellenos inyectables estéticos biodegradables y no biodegradables), por aplicación (corrección de líneas faciales, realce de labios, lifting facial, rinoplastia, tratamiento de cicatrices, flacidez, pómulos caídos, cirugía reconstructiva, restauración estética, odontología, aumento de mentón, tratamiento de lipoatrofia, suavizado de la piel, rejuvenecimiento del lóbulo de la oreja, otros), por tipo de fármaco (de marca y genérico), por usuario final (clínicas de dermatología, hospitales, centros de cirugía ambulatoria, etc.), por canal de distribución (licitación directa/distribución directa, farmacias, farmacias online, etc.): tendencias del sector y pronóstico hasta 2036.
Tamaño del mercado de rellenos inyectables estéticos en Oriente Medio y el Norte de África
- El mercado de rellenos inyectables estéticos de Oriente Medio y el Norte de África se valoró en 347,92 millones de dólares en 2024 y se espera que alcance los 1.005,45 millones de dólares en 2036.
- Durante el período de pronóstico de 2025 a 2036, es probable que el mercado crezca a una CAGR del 9,33%, impulsado principalmente por la creciente demanda de rejuvenecimiento facial no quirúrgico, el envejecimiento de la población en expansión y la mayor aceptación social de las mejoras cosméticas en los mercados desarrollados y emergentes.
- Este crecimiento se sustenta en factores clave como los avances en ácido hialurónico y tecnologías de estimulación del colágeno, la mayor accesibilidad a las clínicas estéticas y la creciente preferencia de los pacientes por resultados personalizados y de aspecto natural con un tiempo de recuperación mínimo. Las aprobaciones regulatorias de nuevos productos, las tendencias estéticas impulsadas por influencers y el auge del turismo médico están acelerando aún más la expansión del mercado en Oriente Medio y el Norte de África.
Análisis del mercado de rellenos inyectables estéticos en Oriente Medio y Norte de África
- El mercado de rellenos inyectables estéticos en Oriente Medio y Norte de África experimenta un crecimiento constante, impulsado por el aumento de la renta disponible, la mayor concienciación sobre los procedimientos cosméticos y la creciente aceptación de los tratamientos estéticos mínimamente invasivos en todos los países. La rápida urbanización, los cambios en los estándares de belleza y una población joven que busca una intervención temprana para los signos de la edad son factores clave que impulsan la demanda. Sin embargo, persisten desafíos como los altos costes de los tratamientos y las variaciones regulatorias entre países.
- La transición hacia productos de relleno naturales, biocompatibles y de larga duración es un factor clave, impulsado por los avances en ácido hialurónico y tecnologías que estimulan el colágeno. La creciente disponibilidad de profesionales cualificados y la expansión de las redes de clínicas estéticas están facilitando un mayor acceso a los tratamientos inyectables. La influencia de las redes sociales y el creciente turismo médico en la región están acelerando aún más su adopción en el mercado.
- Los Emiratos Árabes Unidos dominan la demanda regional debido a su gran población, el crecimiento de la base de consumidores de clase media y el aumento de la inversión en infraestructura sanitaria. Arabia Saudita es el país con mayor crecimiento en el mercado de Oriente Medio y el Norte de África, reconocido mundialmente por sus innovaciones estéticas y su elevado gasto per cápita en procedimientos cosméticos, impulsado por la creciente concienciación sobre la belleza y la expansión de centros de turismo médico como Tailandia y Malasia.
- Los principales fabricantes se están centrando en localizar la producción y establecer alianzas estratégicas con distribuidores regionales para mejorar la penetración en el mercado. La innovación de productos con fórmulas adaptadas a diversos tipos de piel y preferencias es una estrategia clave. Los organismos reguladores de Oriente Medio y el Norte de África están agilizando gradualmente los procesos de aprobación, pero las variaciones en los requisitos de cumplimiento exigen sólidos marcos de control de calidad. El marketing digital y la promoción de influencers desempeñan un papel cada vez más importante en la educación y la interacción con el consumidor.
- Se espera que el segmento de rellenos inyectables estéticos naturales domine con una participación de mercado del 70,13%, debido a la creciente preferencia de los consumidores por tratamientos biocompatibles y mínimamente invasivos que brinden resultados de aspecto natural con menos efectos secundarios.
Alcance del informe y segmentación del mercado de rellenos inyectables estéticos en Oriente Medio y el Norte de África
|
Atributos |
Información clave del mercado de rellenos inyectables estéticos en Oriente Medio y Norte de África |
|
Segmentos cubiertos |
|
|
Países cubiertos |
Oriente Medio y Norte de África
|
|
Actores clave del mercado |
|
|
Oportunidades de mercado |
|
|
Conjuntos de información de datos de valor añadido |
Además de los conocimientos sobre escenarios de mercado como valor de mercado, tasa de crecimiento, segmentación, cobertura geográfica y actores principales, los informes de mercado seleccionados por Data Bridge Market Research también incluyen análisis de expertos en profundidad, análisis de precios, análisis de participación de marca, encuesta de consumidores, análisis demográfico, análisis de la cadena de suministro, análisis de la cadena de valor, descripción general de materias primas/consumibles, criterios de selección de proveedores, análisis PESTLE, análisis de Porter y marco regulatorio. |
Tendencias del mercado de rellenos inyectables estéticos en Oriente Medio y el Norte de África
Avances tecnológicos, personalización y soluciones estéticas limpias
- Una tendencia destacada en el mercado de rellenos inyectables estéticos en Oriente Medio y Norte de África es la creciente demanda de tratamientos estéticos personalizados, impulsada por la preferencia de los consumidores por resultados naturales, las afecciones cutáneas propias de la edad y las variaciones anatómicas faciales. Las clínicas y los profesionales están adoptando cada vez más protocolos de inyección específicos para cada paciente, imágenes avanzadas y herramientas de mapeo facial para ofrecer resultados precisos que se ajusten a los objetivos estéticos individuales.
- El mercado está experimentando una creciente adopción de tecnologías de relleno dérmico de última generación, incluyendo rellenos híbridos, bioestimulantes a base de AH y fórmulas de doble acción que combinan la voluminización con el rejuvenecimiento de la piel. Estas innovaciones mejoran los resultados clínicos al ofrecer efectos más duraderos, menor tiempo de recuperación y perfiles de seguridad mejorados. Por ejemplo, los rellenos de RHA (ácido hialurónico resiliente) y los rellenos de AH con infusión de lidocaína o antioxidantes están ganando popularidad por su fácil integración y la reducción de las molestias posteriores al tratamiento.
- En 2024, empresas como Revance y Teoxane lanzaron productos de relleno específicos diseñados para zonas faciales de alta movilidad, como la zona perioral y la región debajo de los ojos, que abordan los problemas de arrugas dinámicas y pérdida de volumen sin comprometer la expresividad facial. Estas fórmulas suelen incorporar tecnologías de ácido hialurónico reticulado para una difusión controlada y una inflamación mínima, atractivas tanto para quienes las usan por primera vez como para pacientes con experiencia que buscan mejoras sutiles y refinadas.
- Las principales empresas están integrando plataformas de consulta basadas en IA y herramientas de previsualización basadas en RA en las consultas clínicas, lo que permite a los profesionales modelar los resultados esperados y guiar a los pacientes en su proceso estético. Simultáneamente, los fabricantes utilizan la impresión 3D y las tecnologías microfluídicas para desarrollar productos de relleno consistentes y de alta pureza, mejorando la calidad de los lotes y reduciendo la variabilidad de las inyecciones.
- Con la creciente conciencia sobre los ingredientes de los productos y su seguridad a largo plazo, existe una creciente demanda de inyectables de "belleza limpia": rellenos sin componentes de origen animal, aditivos artificiales ni conservantes. Los fabricantes están respondiendo invirtiendo en fórmulas con certificación vegana, sin OMG y totalmente biodegradables.
- A medida que los organismos reguladores y los usuarios finales se vuelven más sofisticados, las marcas de inyectables estéticos priorizan la transparencia, la validación clínica y el desarrollo de productos alineados con los criterios ESG. Esto incluye la publicación de datos de seguridad y eficacia revisados por pares, la implementación de iniciativas de producción neutra en carbono y la alineación del mensaje de marca con las filosofías de sostenibilidad y tratamiento ético, lo que contribuye a fortalecer la confianza y la fidelidad de los consumidores a la marca en los mercados de Oriente Medio y el Norte de África.
Dinámica del mercado de rellenos inyectables estéticos en Oriente Medio y el Norte de África
Conductor
“Creciente demanda de procedimientos cosméticos mínimamente invasivos”
- Los procedimientos cosméticos mínimamente invasivos están ganando popularidad rápidamente en los mercados de Oriente Medio y el Norte de África, impulsados por los cambios en los ideales de belleza, la creciente conciencia estética y un énfasis creciente en mejoras sutiles de aspecto natural
- Los rellenos inyectables estéticos, en particular, ofrecen una alternativa atractiva a las intervenciones quirúrgicas debido a su menor tiempo de recuperación, menores tasas de complicaciones y rentabilidad.
- Esta demanda se ve amplificada aún más por los grupos demográficos más jóvenes que buscan cada vez más tratamientos preventivos, así como por las poblaciones de mayor edad que desean soluciones antienvejecimiento no quirúrgicas.
- En respuesta, las clínicas y los spas médicos están ampliando su oferta, mientras que los fabricantes siguen innovando con fórmulas de relleno avanzadas, más duraderas y biocompatibles. Esta tendencia se ve respaldada por los avances tecnológicos en las técnicas de aplicación y los estándares de seguridad, que hacen que los tratamientos sean más accesibles y personalizables.
- A medida que la demanda de los pacientes continúa aumentando, las soluciones mínimamente invasivas están dando forma a las prioridades estratégicas de los proveedores y desarrolladores por igual, posicionándose firmemente como un motor de crecimiento central en el mercado de rellenos inyectables estéticos de Medio Oriente y el norte de África.
Oportunidad
“Expansión en mercados emergentes”
- El mercado de rellenos inyectables estéticos en Oriente Medio y Norte de África está experimentando un crecimiento significativo, especialmente en economías emergentes como Oriente Medio y Norte de África y Latinoamérica. Esta expansión se ve impulsada por una clase media en ascenso con mayores ingresos disponibles, una mayor conciencia y aceptación de los tratamientos estéticos, y la amplia influencia de las redes sociales y la cultura de las celebridades.
- Las empresas están adoptando cada vez más estrategias específicas para cada región que atienden las preferencias culturales locales y las expectativas de los pacientes, como favorecer mejoras más sutiles en el este de Asia y contornos más pronunciados en los mercados latinoamericanos.
- La expansión hacia mercados emergentes presenta una oportunidad significativa para que el mercado de rellenos inyectables estéticos logre un crecimiento sustancial al aprovechar una base de consumidores nueva y grande con un poder adquisitivo creciente y un interés creciente en mejoras estéticas.
Restricción/Desafío
“Alto costo de los procedimientos estéticos inyectables”
- El alto costo de los procedimientos estéticos inyectables sigue siendo una barrera importante para su adopción generalizada, especialmente en mercados sensibles a los precios y entre los consumidores más jóvenes. Estos tratamientos a menudo requieren no solo la inyección inicial, sino también sesiones regulares de mantenimiento para mantener los resultados, lo que puede acumularse rápidamente en un compromiso financiero sustancial
- El precio se ve influenciado por factores como el tipo y la marca del relleno utilizado, la experiencia del profesional y la ubicación geográfica de la clínica. Para muchos pacientes potenciales, especialmente aquellos sin ingresos discrecionales ni cobertura de seguro adecuada, estos costos pueden limitar el acceso y desalentar el uso a largo plazo.
- Además, la percepción de los rellenos inyectables como procedimientos de lujo o electivos aumenta su exclusividad, reforzando la noción de que dichos tratamientos están fuera del alcance de los consumidores promedio.
- A pesar de la creciente demanda, los altos costos iniciales y continuos restringen la base potencial de consumidores, lo que representa un desafío para el crecimiento de la industria y alienta a los proveedores a explorar soluciones más rentables u opciones de pago flexibles.
Mercado de rellenos inyectables estéticos en Oriente Medio y Norte de África
El mercado de rellenos inyectables estéticos de Oriente Medio y el Norte de África está segmentado en seis segmentos notables según el tipo de producto, tipo, aplicación, tipo de fármaco, usuarios finales y canal de distribución.
• Por tipo de producto
Según el tipo de producto, el mercado de rellenos estéticos inyectables en Oriente Medio y Norte de África se segmenta en rellenos estéticos inyectables naturales y sintéticos. En 2025, se prevé que el segmento de rellenos estéticos inyectables naturales domine el mercado con una cuota de mercado del 70,13 %, debido a la creciente preferencia de los consumidores por tratamientos biocompatibles y mínimamente invasivos que ofrecen resultados de aspecto natural con menos efectos secundarios.
Se prevé que los rellenos inyectables estéticos naturales ganen terreno con una CAGR del 9,4 % durante el período de pronóstico de 2025 a 2036, impulsados por la creciente preferencia de los consumidores por mejoras sutiles y de aspecto natural, la creciente demanda de sustancias biocompatibles y biodegradables y los avances en la estética regenerativa.
• Por tipo
Según el tipo, el mercado de rellenos inyectables estéticos de Oriente Medio y el Norte de África se segmenta en rellenos inyectables estéticos biodegradables y rellenos inyectables estéticos no biodegradables. En 2025, se espera que el segmento de rellenos inyectables estéticos biodegradables domine con una cuota de mercado del 75,51 %, debido a su alto perfil de seguridad, sus mínimos efectos secundarios a largo plazo y su amplia aceptación tanto entre pacientes como entre profesionales. Su capacidad para descomponerse naturalmente en el cuerpo con el tiempo reduce el riesgo de complicaciones permanentes, mientras que los continuos avances en las formulaciones de ácido hialurónico, hidroxiapatita de calcio y ácido poli-L-láctico mejoran los resultados y la longevidad
Se proyecta que el segmento de ácido hialurónico (AH) se expandirá de manera constante con una CAGR del 9,51 % a medida que continúa aumentando la demanda de rellenos dérmicos biocompatibles y mínimamente invasivos que ofrecen hidratación, restauración de volumen y reducción de arrugas con un tiempo de recuperación mínimo.
• Por aplicación
Según la aplicación, el mercado de rellenos inyectables estéticos de Oriente Medio y el Norte de África se segmenta en corrección de líneas faciales, aumento de labios, lifting facial, rinoplastia, tratamiento de cicatrices, flacidez de la piel, depresión de las mejillas, cirugía reconstructiva, restauración estética, odontología, aumento de mentón, tratamiento de lipoatrofia, suavizado de la piel, rejuvenecimiento del lóbulo de la oreja y otros. En 2025, se espera que el segmento de corrección de líneas faciales domine con una cuota de mercado del 31,58 %, debido a la creciente demanda de los consumidores de soluciones mínimamente invasivas que reduzcan eficazmente los signos visibles del envejecimiento, como arrugas y pliegues, sin el tiempo de recuperación asociado a los procedimientos quirúrgicos. La creciente disponibilidad de rellenos dérmicos avanzados con resultados más duraderos, perfiles de seguridad mejorados y resultados de aspecto natural está impulsando la preferencia de los pacientes por estos tratamientos
Es probable que el segmento de corrección de líneas faciales sea testigo de un crecimiento acelerado del 10,76% durante el período de pronóstico, respaldado por la creciente demanda de soluciones no quirúrgicas para tratar las arrugas dinámicas y estáticas, especialmente en la frente, los pliegues nasolabiales, las líneas de marioneta y las patas de gallo.
• Por tipo de fármaco
Según el tipo de fármaco, el mercado de rellenos estéticos inyectables en Oriente Medio y Norte de África se segmenta en de marca y genéricos. En 2025, se prevé que el segmento de marca domine con una cuota de mercado del 83,99 %, gracias a la sólida confianza de los consumidores en marcas consolidadas de rellenos estéticos que han demostrado seguridad, eficacia y resultados consistentes a lo largo del tiempo. Marcas líderes como Juvederm, Restylane y Radiesse se benefician de una extensa investigación clínica, las aprobaciones regulatorias de Oriente Medio y Norte de África y un sólido reconocimiento de marca, lo que las convierte en la opción preferida tanto de profesionales como de pacientes.
El segmento de marca está ganando importancia y creciendo con una CAGR del 9,46%, debido a la creciente confianza del consumidor en productos bien establecidos y clínicamente probados que ofrecen seguridad, eficacia y resultados consistentes comprobados.
• Por el usuario final
En función del usuario final, el mercado de rellenos estéticos inyectables en Oriente Medio y Norte de África se segmenta en clínicas dermatológicas, hospitales, centros de cirugía ambulatoria, entre otros. En 2025, se prevé que el segmento de clínicas dermatológicas domine el mercado con una cuota de mercado del 52,98 %, impulsado por la creciente demanda de procedimientos estéticos especializados y mínimamente invasivos, realizados por dermatólogos con amplia experiencia en anatomía facial y técnicas de inyección. Estas clínicas ofrecen planes de tratamiento personalizados, equipos de última generación y una amplia variedad de rellenos adaptados a las necesidades individuales de cada paciente.
Se espera que el segmento de Clínicas de Dermatología crezca a una CAGR del 9,83%, impulsado por la creciente preferencia de los consumidores por procedimientos estéticos dirigidos por especialistas, la creciente demanda de planes de tratamiento seguros y personalizados y la creciente confianza en el cuidado de la piel de grado médico y las soluciones inyectables.
• Por canal de distribución
Según el canal de distribución, el mercado de rellenos inyectables estéticos en Oriente Medio y Norte de África se segmenta en licitación directa/distribución directa, farmacias, farmacias en línea, entre otros. En 2025, se prevé que el segmento de licitación directa/distribución directa domine con una cuota de mercado del 63,69 %, debido a la gran población bovina de Oriente Medio y Norte de África y al papel crucial de los oligoelementos en la producción de leche, la fertilidad y la resistencia a las enfermedades.
Se anticipa que el segmento de Licitación Directa/Distribución Directa registrará el crecimiento más rápido del 9,59% durante 2025 a 2036, impulsado por la creciente demanda de procesos de adquisición optimizados, ahorros de costos mediante la eliminación de intermediarios y la creciente adopción de plataformas de pedidos digitales por parte de proveedores de atención médica y clínicas estéticas.
Análisis regional del mercado de rellenos inyectables estéticos en Oriente Medio y Norte de África
- Se espera que los Emiratos Árabes Unidos dominen el mercado de rellenos inyectables estéticos con la mayor participación en los ingresos del 28,07 % en 2025, impulsado por el aumento del ingreso disponible, la creciente conciencia estética y la expansión del acceso a procedimientos cosméticos no invasivos en países clave como los Emiratos Árabes Unidos, Egipto, Arabia Saudita e Israel.
- El crecimiento de la región está fuertemente respaldado por cambios demográficos que incluyen una población que envejece rápidamente y una mayor aceptación de los tratamientos estéticos entre los consumidores más jóvenes, en particular los millennials y la generación Z. La influencia de las redes sociales, el turismo médico y los cambios culturales en torno a los estándares de belleza también están contribuyendo al aumento de los volúmenes de procedimientos tanto en ciudades urbanas como de segundo nivel.
- Los Emiratos Árabes Unidos y Egipto se encuentran entre los principales motores de crecimiento en Medio Oriente y el norte de África. Los Emiratos Árabes Unidos están experimentando una rápida adopción de rellenos a base de ácido hialurónico y tratamientos antienvejecimiento, y Egipto muestra un aumento en los procedimientos de toxina botulínica y rellenos dérmicos debido a la mejora de la infraestructura de atención médica, la asequibilidad y un número creciente de clínicas estéticas certificadas.
- Los avances regulatorios y la mejora de los estándares de seguridad en países como Australia e Israel están fortaleciendo la confianza del consumidor y la credibilidad del mercado, incentivando a los nuevos usuarios y apoyando la expansión del mercado a largo plazo. Además, las innovaciones de empresas regionales como Bloomage Biotechnology en los Emiratos Árabes Unidos están fortaleciendo la competitividad de la región tanto en la fabricación como en la aplicación clínica de rellenos inyectables.
Análisis del mercado de rellenos inyectables estéticos en los EAU
Los Emiratos Árabes Unidos representaron la mayor participación en los ingresos del mercado de rellenos inyectables estéticos en Oriente Medio y el Norte de África en 2025, con un 22,92 %, impulsado por su vasta población, la rápida urbanización y la creciente demanda de tratamientos antienvejecimiento. El país se ha convertido en un centro de referencia para los rellenos dérmicos, en particular los productos a base de ácido hialurónico, gracias a la presencia de fabricantes nacionales como Bloomage Biotechnology, uno de los mayores productores de ácido hialurónico en Oriente Medio y el Norte de África. El aumento de la renta disponible y el cambio de actitud social hacia las mejoras cosméticas están normalizando el uso de rellenos inyectables en diversos grupos de edad. El apoyo gubernamental a la innovación en medicina estética y el aumento de la inversión en investigación y ensayos clínicos consolidan aún más el dominio del país en el mercado regional.
Análisis del mercado egipcio de rellenos inyectables estéticos
Egipto está experimentando un rápido crecimiento en el mercado de rellenos estéticos inyectables, impulsado por una población urbana en expansión, una mayor conciencia de la belleza y una creciente demanda de tratamientos cosméticos asequibles y no quirúrgicos. El crecimiento de las clínicas de dermatología y estética, especialmente en las ciudades metropolitanas y de segundo nivel, está haciendo que los rellenos inyectables sean más accesibles para una población más amplia. La influencia de las redes sociales y la creciente popularidad de los estándares de belleza inspirados en celebridades son impulsores clave de la expansión del mercado. Además, el sector del turismo médico egipcio, conocido por sus procedimientos rentables y sus profesionales cualificados, está contribuyendo a la creciente demanda internacional. A medida que crece el conocimiento y la aceptación de los tratamientos mínimamente invasivos, se prevé que el mercado egipcio se mantenga como uno de los de mayor crecimiento en Oriente Medio y el Norte de África.
Perspectiva del mercado israelí de rellenos inyectables estéticos
Israel es un mercado maduro e innovador para inyectables estéticos, reconocido en Oriente Medio y el Norte de África por su liderazgo en dermatología cosmética y sus avanzados estándares de belleza. La alta demanda de procedimientos de contorno facial y rejuvenecimiento de la piel ha convertido los rellenos en un componente esencial de los tratamientos estéticos convencionales. La sólida base de fabricación nacional, el riguroso marco regulatorio y la prioridad en la seguridad y eficacia de los productos fomentan la innovación continua en materiales y técnicas de relleno. Además, la gran popularidad de la K-beauty y la cultura pop coreana impulsa la demanda entre pacientes nacionales e internacionales, y Israel sigue siendo un destino clave para el turismo médico en el ámbito de la estética.
Análisis del mercado de rellenos inyectables estéticos en Arabia Saudita
Arabia Saudita representa un mercado importante y altamente regulado para los inyectables estéticos, con un creciente interés entre las personas mayores que buscan soluciones antienvejecimiento de aspecto natural y sin cirugía. La preferencia cultural por una mejora estética sutil ha impulsado la adopción de técnicas de relleno conservadoras, especialmente en el contorno de ojos y el tercio medio facial. El mercado se beneficia de una sólida infraestructura dermatológica, altos estándares de seguridad médica y un mayor conocimiento de las opciones de tratamiento avanzadas. La creciente educación del consumidor y la disponibilidad de productos importados de primera calidad, junto con las tendencias demográficas favorables, contribuyen al crecimiento constante del segmento de rellenos inyectables en Arabia Saudita.
Los principales líderes del mercado que operan en el mercado son:
- Allergan Aesthetics (AbbVie) (Estados Unidos)
- GALDERMA (Suiza)
- Merz Pharma (EAU)
- Hugel Inc. (Israel)
- LG Chem (Israel)
- Medytox Inc. (Israel)
- IBSA Institut Biochimique SA (Suiza)
- Laboratoires Vivacy (Francia)
- Prollenium Medical Technologies (Canadá)
- Croma (Austria)
- Laboratorios FillMed (Francia)
- Humedix (Israel)
- TEOXANE (Suiza)
- Sinclair (Reino Unido)
- Bioscience (EAU)
- Amalian (EAU)
- Bioxis Pharmaceuticals (Francia)
- Mesoestetic (España)
- Zhejiang Jingjia Medical Technology Co., Ltd. (EAU)
- Jalupro (Italia)
- BIOPLUS CO. LTD. (Israel)
- Shanghai Reyoungel Medical Technology Company Limited (EAU)
- Contura International Ltd (Reino Unido)
- Tiger Aesthetics Medical, LLC (Estados Unidos)
- Huons Oriente Medio y Norte de África (Israel)
- Vida Srl. (Italia)
- Sosum Oriente Medio y Norte de África (Israel)
- Revance (Estados Unidos)
- Grupo Petrone (Italia)
Últimos avances en el mercado de rellenos inyectables estéticos en Oriente Medio y el Norte de África
- En enero de 2025, Allergan Aesthetics anunció el regreso de CoolMonth, una campaña promocional que ofrece ofertas especiales en los tratamientos CoolSculpting Elite. Esta iniciativa busca ampliar el acceso de los pacientes a este procedimiento no invasivo de reducción de grasa mediante descuentos durante la campaña, fomentando su adopción y fomentando la participación de los pacientes en el remodelado corporal estético.
- En abril de 2025, Galderma anunció el lanzamiento de Sculptra en los Emiratos Árabes Unidos, una decisión clave para capitalizar uno de los mercados de la estética con mayor crecimiento a nivel mundial. Sculptra, un bioestimulante regenerativo con una fórmula única de ácido poli-L-láctico (PLLA-SCA), fue aprobado por la Administración Nacional de Productos Médicos de los Emiratos Árabes Unidos para corregir la pérdida de volumen facial y/o las deficiencias del contorno.
- Este lanzamiento brinda a los pacientes y profesionales de la salud chinos acceso a un producto premium con más de 25 años de evidencia clínica. El mercado de la estética en los EAU se ha expandido rápidamente, y la introducción de Sculptra posiciona a Galderma para satisfacer la creciente demanda de tratamientos seguros, de aspecto natural y duraderos.
- En mayo de 2025, Hugel lanzó su producto de toxina botulínica, Botulax, en los Emiratos Árabes Unidos (EAU). Hugel se asoció con la empresa local Medica Group para vender y distribuir el producto. Dado que los EAU son un centro neurálgico para la industria de la belleza y la creciente demanda de tratamientos estéticos en la región, Hugel espera consolidarse rápidamente en este nuevo mercado con su producto de alta calidad.
- En febrero de 2025, LG Chem aceleró la producción comercial de su ácido acrílico 100 % vegetal, lo que marca una innovación clave en la fabricación de productos químicos sostenibles. Este desarrollo se alinea con la demanda de materiales ecológicos en Oriente Medio y el Norte de África y reduce la dependencia de los recursos fósiles. Fortalece la posición de LG Chem en el mercado de plásticos y polímeros de origen biológico, respaldando su estrategia para un futuro de cero emisiones netas y su liderazgo en soluciones de química verde.
- En marzo de 2024, la filial de Croma en Brasil fue adquirida por Megalabs, que también obtuvo los derechos de distribución exclusivos para la cartera de productos estéticos de Croma en Latinoamérica y el Caribe. La cartera incluye rellenos de ácido hialurónico, inyectables de polinucleótidos, productos para el cuidado de la piel y tecnologías emergentes. Esta alianza permite a Croma expandirse a un mercado clave en crecimiento, a la vez que permite a Megalabs fortalecer su presencia en dermatología y medicina estética con productos premium.
SKU-
Obtenga acceso en línea al informe sobre la primera nube de inteligencia de mercado del mundo

- Panel de análisis de datos interactivo
- Panel de análisis de empresas para oportunidades con alto potencial de crecimiento
- Acceso de analista de investigación para personalización y consultas
- Análisis de la competencia con panel interactivo
- Últimas noticias, actualizaciones y análisis de tendencias
- Aproveche el poder del análisis de referencia para un seguimiento integral de la competencia
Tabla de contenido
1 INTRODUCCIÓN
1.1 OBJETIVOS DEL ESTUDIO
1.2 DEFINICIÓN DEL MERCADO
1.3 DESCRIPCIÓN GENERAL DEL MERCADO DE RELLENOS INYECTABLES ESTÉTICOS EN ORIENTE MEDIO Y ÁFRICA
1.4 LIMITACIONES
1.5 MERCADOS CUBIERTOS
2 SEGMENTACIÓN DEL MERCADO
2.1 MERCADOS CUBIERTOS
2.2 ÁMBITO GEOGRÁFICO
2.3 AÑOS CONSIDERADOS PARA EL ESTUDIO
2.4 MONEDA Y PRECIOS
2.5 MODELO DE VALIDACIÓN DE DATOS TRÍPODE DBMR
2.6 MODELADO MULTIVARIABLE
2.7 CURVA DE LÍNEA DE VIDA DEL TIPO DE PRODUCTO
2.8 ENTREVISTAS PRINCIPALES CON LÍDERES DE OPINIÓN CLAVE
2.9 CUADRÍCULA DE POSICIÓN DE MERCADO DBMR
2.1 CUADRÍCULA DE COBERTURA DE USUARIOS FINALES DEL MERCADO
2.11 ANÁLISIS DE LA PARTICIPACIÓN DE LOS PROVEEDORES
2.12 FUENTES SECUNDARIAS
2.13 SUPUESTOS
3 RESUMEN EJECUTIVO
4 INFORMACIÓN PREMIUM
4.1 LAS CINCO FUERZAS DE PORTER
4.1.1 RIVALIDAD COMPETITIVA – ALTA
4.1.2 AMENAZA DE NUEVOS ENTRANTES – MODERADA
4.1.3 PODER DE NEGOCIACIÓN DE LOS COMPRADORES – ALTO
4.1.4 PODER DE NEGOCIACIÓN DE LOS PROVEEDORES – MODERADO
4.1.5 AMENAZA DE SUSTITUTOS – MODERADA
4.2 ANÁLISIS PESTLE
4.2.1 POLÍTICO
4.2.2 ECONÓMICO
4.2.3 SOCIAL
4.2.4 TECNOLÓGICOS
4.2.5 AMBIENTALES
4.2.6 LEGALES
4.3 DESGLOSE DEL ANÁLISIS DE COSTES
4.3.1 COSTOS DE INVESTIGACIÓN Y DESARROLLO (I+D) (15-25%)
4.3.2 COSTOS DE MATERIA PRIMA Y COMPONENTES (20–30%)
4.3.3 COSTOS DE FABRICACIÓN (15–20%)
4.3.4 CUMPLIMIENTO NORMATIVO Y DE CALIDAD (5–10%)
4.3.5 MARKETING Y PROMOCIÓN (10–15%)
4.3.6 DISTRIBUCIÓN Y LOGÍSTICA (5–10%)
4.3.7 LICENCIAS, REGALÍAS Y GESTIÓN DE PROPIEDAD INTELECTUAL (1-3%)
4.3.8 FORMACIÓN, SOPORTE CLÍNICO Y POSVENTA (2-5%)
4.4 ECONOMÍA DE LA SALUD
4.4.1 GASTO EN SALUD
4.4.2 GASTO DE CAPITAL
4.4.3 TENDENCIAS DE INVERSIÓN DE CAPITAL
4.4.4 ASIGNACIÓN DE INVERSIÓN DE CAPITAL
4.4.5 FUENTES DE FINANCIACIÓN
4.4.6 PUNTOS DE REFERENCIA DE LA INDUSTRIA
4.4.7 RATIO DEL PIB EN EL PIB GENERAL
4.4.8 ESTRUCTURA DEL SISTEMA DE SALUD
4.4.9 POLÍTICAS GUBERNAMENTALES
4.4.10 DESARROLLO ECONÓMICO
4.5 ANÁLISIS DEL MAPA DE OPORTUNIDADES
4.5.1 ANÁLISIS DEL MAPA DE OPORTUNIDADES
4.5.2 INNOVACIÓN DE PRODUCTOS
4.5.3 EXPANSIÓN GEOGRÁFICA
4.5.4 SEGMENTACIÓN DEL CONSUMIDOR
4.5.5 CANALES DE ENTREGA
4.5.6 REGULACIÓN Y ACCESO AL MERCADO
4.5.7 SOSTENIBILIDAD
4.6 PERSPECTIVAS DE LA INDUSTRIA
4.6.1 FACTORES MICRO Y MACROECONÓMICOS
4.6.2 MAPEO DE PERSPECTIVAS DE PENETRACIÓN Y CRECIMIENTO
4.6.3 ESTRATEGIAS CLAVE DE PRECIOS
4.6.4 ENTREVISTAS CON ESPECIALISTAS
4.6.5 ANÁLISIS Y RECOMENDACIÓN
4.7 ANÁLISIS DE PATENTES
4.7.1 DISTRIBUCIÓN GEOGRÁFICA DE LAS SOLICITUDES DE PATENTE
4.7.2 SOLICITANTES E INNOVADORES CLAVE
4.7.3 DOMINIOS TECNOLÓGICOS (CÓDIGOS IPC)
4.8 TENDENCIAS DE PUBLICACIÓN A LO LARGO DEL TIEMPO
4.8.1 CONCLUSIÓN
4.9 MARCO DE REEMBOLSO
4.9.1 USO COSMÉTICO VS. USO MÉDICO: EL DIVISOR PRINCIPAL
4.9.2 VARIACIONES REGIONALES DE REEMBOLSO
4.9.3 PREDOMINIO DEL GASTO DE BOLSILLO
4.9.4 TENDENCIAS EN LOS MODELOS DE SEGUROS HÍBRIDOS
4.9.5 IMPLICACIONES PARA EL CRECIMIENTO DEL MERCADO
4.1 ECOSISTEMA DE LA CADENA DE SUMINISTRO
4.11 HOJA DE RUTA TECNOLÓGICA
4.12 SEGUIMIENTO DE INNOVACIÓN Y ANÁLISIS ESTRATÉGICO
4.12.1 SEGUIMIENTO DE INNOVACIÓN
4.12.1.1 Biorremodelación y tecnologías de plataforma
4.12.1.2 Diseño de llenado inteligente y eficiencia de volumen
4.12.1.3 Sistemas de entrega de próxima generación
4.12.1.4 Química verde y bioplásticos
4.12.1.5 Modalidades de combinación
4.12.2 ANÁLISIS ESTRATÉGICO
4.12.2.1 Fusiones y adquisiciones y consolidación del mercado
4.12.2.2 Estrategias de expansión geográfica y localización
4.12.2.3 Hitos regulatorios
4.12.2.4 Marketing y participación del consumidor
4.12.2.5 Asociaciones estratégicas y derechos de distribución
4.12.3 CONCLUSIÓN
5 TASAS ARANCELARIAS ACTUALES EN LOS MERCADOS DE LOS 5 PAÍSES PRINCIPALES Y PERSPECTIVAS DE IMPORTACIÓN VS. PRODUCCIÓN LOCAL
5.1 CRITERIOS DE SELECCIÓN DE PROVEEDORES Y SU IMPACTO EN LA CADENA DE SUMINISTRO
5.2 DINÁMICA DE ADQUISICIÓN, FABRICACIÓN Y DISTRIBUCIÓN DE MATERIA PRIMA
5.3 PRESENTACIÓN DE PRECIOS Y POSICIONAMIENTO COMPETITIVO EN EL MERCADO
5.4 RESPUESTA DE LA INDUSTRIA: OPTIMIZACIÓN DE LA CADENA DE SUMINISTRO Y EMPRESAS CONJUNTAS
5.5 IMPACTO DE LOS MARCOS REGULATORIOS E INCENTIVOS EN LOS PRECIOS
5.6 FACTORES GEOPOLÍTICOS Y ACUERDOS COMERCIALES QUE CONFORMAN EL MERCADO
5.7 PLANES DE DESARROLLO INDUSTRIAL E INICIATIVAS DE INFRAESTRUCTURA
6 MARCO REGULADOR
6.1 AMÉRICA DEL NORTE
6.1.1 AUTORIDADES REGULADORAS:
6.1.2 CLASIFICACIONES REGLAMENTARIAS:
6.1.3 PRESENTACIONES REGLAMENTARIAS:
6.1.4 ARMONIZACIÓN INTERNACIONAL:
6.1.5 SISTEMAS DE GESTIÓN DE CUMPLIMIENTO Y CALIDAD:
6.2 SUDAMÉRICA
6.2.1 AUTORIDADES REGULADORAS:
6.2.2 CLASIFICACIONES REGULADORAS:
6.2.3 PRESENTACIONES REGLAMENTARIAS:
6.2.4 ARMONIZACIÓN INTERNACIONAL:
6.2.5 SISTEMAS DE CUMPLIMIENTO Y GESTIÓN DE LA CALIDAD:
6.2.6 DESAFÍOS Y ESTRATEGIAS REGULATORIAS:
6.3 EUROPA
6.3.1 AUTORIDADES REGULADORAS:
6.3.2 CLASIFICACIONES REGULADORAS:
6.3.3 PRESENTACIONES REGLAMENTARIAS:
6.3.4 ARMONIZACIÓN INTERNACIONAL:
6.3.5 SISTEMAS DE CUMPLIMIENTO Y GESTIÓN DE LA CALIDAD:
6.3.6 DESAFÍOS Y ESTRATEGIAS REGULATORIAS:
6.4 ASIA-PACÍFICO
6.4.1 AUTORIDADES REGULADORAS:
6.4.2 CLASIFICACIONES REGULADORAS:
6.4.3 PRESENTACIONES REGLAMENTARIAS:
6.4.4 ARMONIZACIÓN INTERNACIONAL:
6.4.5 SISTEMAS DE CUMPLIMIENTO Y GESTIÓN DE LA CALIDAD:
6.4.6 DESAFÍOS Y ESTRATEGIAS REGULATORIAS:
6.5 ORIENTE MEDIO Y ÁFRICA
6.5.1 AUTORIDADES REGULADORAS:
6.5.2 CLASIFICACIONES REGULADORAS:
6.5.3 PRESENTACIONES REGULADORAS:
6.5.4 ARMONIZACIÓN INTERNACIONAL:
6.5.5 SISTEMAS DE CUMPLIMIENTO Y GESTIÓN DE LA CALIDAD:
6.5.6 DESAFÍOS Y ESTRATEGIAS REGULATORIAS:
7 DESCRIPCIÓN GENERAL DEL MERCADO
7.1 IMPULSORES
7.1.1 DEMANDA CRECIENTE DE PROCEDIMIENTOS COSMÉTICOS MÍNIMAMENTE INVASIVOS
7.1.2 LA CRECIENTE INFLUENCIA DE LAS REDES SOCIALES Y LA CULTURA DE LAS CELEBRIDADES
7.1.3 ACEPTACIÓN CRECIENTE DE LAS MEJORAS COSMÉTICAS ENTRE LOS MILLENNIALS Y LA GENERACIÓN Z
7.1.4 AUMENTO DE LA POPULARIDAD DE LOS TRATAMIENTOS COMBINADOS
7.2 RESTRICCIONES
7.2.1 ALTO COSTO DE LOS PROCEDIMIENTOS ESTÉTICOS INYECTABLES
7.2.2 EFICACIA A CORTO PLAZO DE CIERTOS RELLENOS
7.3 OPORTUNIDADES
7.3.1 EXPANSIÓN EN MERCADOS EMERGENTES
7.3.2 INNOVACIÓN DE PRODUCTOS Y SOLUCIONES PERSONALIZADAS
7.3.3 AMPLIACIÓN A ÁREAS TERAPÉUTICAS ADICIONALES
7.4 DESAFÍOS
7.4.1 FALTA DE PROFESIONALES CALIFICADOS EN CIERTAS REGIONES
7.4.2 PRODUCTOS FALSIFICADOS Y NO REGULADOS
8 MERCADO DE RELLENOS INYECTABLES ESTÉTICOS DE ORIENTE MEDIO Y ÁFRICA, POR TIPO
8.1 DESCRIPCIÓN GENERAL
8.2 RELLENOS INYECTABLES ESTÉTICOS BIODEGRADABLES
8.2.1 RELLENOS TEMPORALES BIODEGRADABLES
8.2.2 RELLENOS SEMIPERMANENTES BIODEGRADABLES
8.3 RELLENOS INYECTABLES ESTÉTICOS NO BIODEGRADABLES
9 MERCADO DE RELLENOS INYECTABLES ESTÉTICOS DE ORIENTE MEDIO Y ÁFRICA, POR TIPO DE PRODUCTO
9.1 DESCRIPCIÓN GENERAL
9.2 RELLENOS INYECTABLES ESTÉTICOS NATURALES
9.2.1 ÁCIDO HIALURÓNICO (AH)
9.2.1.1 RELLENOS MONOFÁSICOS
9.2.1.1.1 ÁCIDO HIALURÓNICO + LIDOCAÍNA
9.2.1.1.2 MONODENSIFICADOS
9.2.1.1.3 POLIDENSIFICA
9.2.1.1.4 CORRECCIÓN DE LÍNEAS FACIALES
9.2.1.1.5 AUMENTO DE LABIOS
9.2.1.1.6 LIFTING FACIAL
9.2.1.1.7 RINOPLASTIA
9.2.1.1.8 TRATAMIENTO DE CICATRICES
9.2.1.1.9 PIEL FLÁCIDA
9.2.1.1.10 DEPRESIÓN DE LAS MEJILLAS
9.2.1.1.11 ODONTOLOGÍA
9.2.1.1.12 CIRUGÍA RECONSTRUCTIVA
9.2.1.1.13 RESTAURACIÓN ESTÉTICA
9.2.1.1.14 AUMENTO DE MENTÓN
9.2.1.1.15 TRATAMIENTO DE LIPOATROFIA
9.2.1.1.16 SUAVIZAMIENTO DE LA PIEL
9.2.1.1.17 REJUVENECIMIENTO DEL LÓBULO DE LA OREJA
9.2.1.1.18 OTROS.
9.2.1.2 RELLENOS BIFÁSICOS
9.2.1.2.1 ÁCIDO HIALURÓNICO + LIDOCAÍNA
9.2.1.2.2 MONOFÁSICO
9.2.1.2.3 DÚPLEXFÁSICO
9.2.1.2.4 CORRECCIÓN DE LÍNEAS FACIALES
9.2.1.2.5 AUMENTO DE LABIOS
9.2.1.2.6 ESTIRAMIENTO FACIAL
9.2.1.2.7 RINOPLASTIA
9.2.1.2.8 TRATAMIENTO DE CICATRICES
9.2.1.2.9 PIEL FLÁCIDA
9.2.1.2.10 DEPRESIÓN DE LAS MEJILLAS
9.2.1.2.11 ODONTOLOGÍA
9.2.1.2.12 CIRUGÍA RECONSTRUCTIVA
9.2.1.2.13 RESTAURACIÓN ESTÉTICA
9.2.1.2.14 AUMENTO DE MENTÓN
9.2.1.2.15 TRATAMIENTO DE LIPOATROFIA
9.2.1.2.16 ALISADO DE LA PIEL
9.2.1.2.17 REJUVENECIMIENTO DEL LÓBULO DE LA OREJA
9.2.1.2.18 OTROS
9.2.2 GRASA
9.2.2.1 CORRECCIÓN DE LÍNEAS FACIALES
9.2.2.2 AUMENTO DE LABIOS
9.2.2.3 ESTIRAMIENTO FACIAL
9.2.2.4 RINOPLASTIA
9.2.2.5 TRATAMIENTO DE CICATRICES
9.2.2.6 PIEL FLÁCIDA
9.2.2.7 DEPRESIÓN DE LAS MEJILLAS
9.2.2.8 CIRUGÍA RECONSTRUCTIVA
9.2.2.9 ODONTOLOGÍA
9.2.2.10 RESTAURACIÓN ESTÉTICA
9.2.2.11 TRATAMIENTO DE LIPOATROFIA
9.2.2.12 AUMENTO DE MENTÓN
9.2.2.13 SUAVIZAMIENTO DE LA PIEL
9.2.2.14 REJUVENECIMIENTO DEL LÓBULO DE LA OREJA
9.2.2.15 OTROS
9.2.3 COLÁGENO
9.2.3.1 CORRECCIÓN DE LÍNEAS FACIALES
9.2.3.2 AUMENTO DE LABIOS
9.2.3.3 LIFTING FACIAL
9.2.3.4 RINOPLASTIA
9.2.3.5 TRATAMIENTO DE CICATRICES
9.2.3.6 PIEL FLÁCIDA
9.2.3.7 DEPRESIÓN DE MEJILLAS
9.2.3.8 CIRUGÍA RECONSTRUCTIVA
9.2.3.9 RESTAURACIÓN ESTÉTICA
9.2.3.10 AUMENTO DE MENTÓN
9.2.3.11 ODONTOLOGÍA
9.2.3.12 TRATAMIENTO DE LIPOATROFIA
9.2.3.13 SUAVIZADO DE LA PIEL
9.2.3.14 REJUVENECIMIENTO DEL LÓBULO DE LA OREJA
9.2.3.15 OTROS
9.2.4 POLINUCLEÓTIDOS/POLIDEOXIRRIBONUCLEÓTIDOS (PN/PDRN)
9.2.4.1 CORRECCIÓN DE LÍNEAS FACIALES
9.2.4.2 AUMENTO DE LABIOS
9.2.4.3 ESTIRAMIENTO FACIAL
9.2.4.4 RINOPLASTIA
9.2.4.5 TRATAMIENTO DE CICATRICES
9.2.4.6 PIEL FLÁCIDA
9.2.4.7 DEPRESIÓN DE LAS MEJILLAS
9.2.4.8 RESTAURACIÓN ESTÉTICA
9.2.4.9 CIRUGÍA RECONSTRUCTIVA
9.2.4.10 ODONTOLOGÍA
9.2.4.11 AUMENTO DE MENTÓN
9.2.4.12 TRATAMIENTO DE LIPOATROFIA
9.2.4.13 SUAVIZAMIENTO DE LA PIEL
9.2.4.14 REJUVENECIMIENTO DEL LÓBULO DE LA OREJA
9.2.4.15 OTROS
9.2.5 OTROS
9.2.5.1 CORRECCIÓN DE LÍNEAS FACIALES
9.2.5.2 AUMENTO DE LABIOS
9.2.5.3 ESTIRAMIENTO FACIAL
9.2.5.4 RINOPLASTIA
9.2.5.5 TRATAMIENTO DE CICATRICES
9.2.5.6 PIEL FLÁCIDA
9.2.5.7 DEPRESIÓN DE MEJILLAS
9.2.5.8 CIRUGÍA RECONSTRUCTIVA
9.2.5.9 RESTAURACIÓN ESTÉTICA
9.2.5.10 ODONTOLOGÍA
9.2.5.11 AUMENTO DE MENTÓN
9.2.5.12 TRATAMIENTO DE LIPOATROFIA
9.2.5.13 SUAVIZANTE DE LA PIEL
9.2.5.14 REJUVENECIMIENTO DEL LÓBULO DE LA OREJA
9.2.5.15 OTROS
9.3 RELLENOS INYECTABLES ESTÉTICOS SINTÉTICOS
9.3.1 HIDROXILAPATITA DE CALCIO (CAHA)
9.3.1.1 CORRECCIÓN DE LÍNEAS FACIALES
9.3.1.2 AUMENTO DE LABIOS
9.3.1.3 ESTIRAMIENTO FACIAL
9.3.1.4 RINOPLASTIA
9.3.1.5 TRATAMIENTO DE CICATRICES
9.3.1.6 PIEL FLÁCIDA
9.3.1.7 DEPRESIÓN DE LAS MEJILLAS
9.3.1.8 CIRUGÍA RECONSTRUCTIVA
9.3.1.9 RESTAURACIÓN ESTÉTICA
9.3.1.10 ODONTOLOGÍA
9.3.1.11 AUMENTO DE MENTÓN
9.3.1.12 TRATAMIENTO DE LIPOATROFIA
9.3.1.13 SUAVIZAMIENTO DE LA PIEL
9.3.1.14 REJUVENECIMIENTO DEL LÓBULO DE LA OREJA
9.3.1.15 OTROS
9.3.2 ÁCIDO POLI-L-LÁCTICO (PLLA)
9.3.2.1 CORRECCIÓN DE LÍNEAS FACIALES
9.3.2.2 AUMENTO DE LABIOS
9.3.2.3 ESTIRAMIENTO FACIAL
9.3.2.4 RINOPLASTIA
9.3.2.5 TRATAMIENTO DE CICATRICES
9.3.2.6 PIEL FLÁCIDA
9.3.2.7 DEPRESIÓN DE LAS MEJILLAS
9.3.2.8 CIRUGÍA RECONSTRUCTIVA
9.3.2.9 RESTAURACIÓN ESTÉTICA
9.3.2.10 ODONTOLOGÍA
9.3.2.11 AUMENTO DE MENTÓN
9.3.2.12 TRATAMIENTO DE LIPOATROFIA
9.3.2.13 SUAVIZAMIENTO DE LA PIEL
9.3.2.14 REJUVENECIMIENTO DEL LÓBULO DE LA OREJA
9.3.2.15 OTROS
9.3.3 MICROESFERAS DE POLIMETILMETACRILATO (PMMA)
9.3.3.1 CORRECCIÓN DE LÍNEAS FACIALES
9.3.3.2 AUMENTO DE LABIOS
9.3.3.3 ESTIRAMIENTO FACIAL
9.3.3.4 RINOPLASTIA
9.3.3.5 TRATAMIENTO DE CICATRICES
9.3.3.6 PIEL FLÁCIDA
9.3.3.7 DEPRESIÓN DE LAS MEJILLAS
9.3.3.8 CIRUGÍA RECONSTRUCTIVA
9.3.3.9 RESTAURACIÓN ESTÉTICA
9.3.3.10 ODONTOLOGÍA
9.3.3.11 AUMENTO DE MENTÓN
9.3.3.12 TRATAMIENTO DE LIPOATROFIA
9.3.3.13 SUAVIZAMIENTO DE LA PIEL
9.3.3.14 REJUVENECIMIENTO DEL LÓBULO DE LA OREJA
9.3.3.15 OTROS
10 MERCADO DE RELLENOS INYECTABLES ESTÉTICOS DE ORIENTE MEDIO Y ÁFRICA, POR TIPO DE FÁRMACO
10.1 DESCRIPCIÓN GENERAL
10.2 DE MARCA
10.2.1 JUVEDERM
10.2.2 RESTYLANE
10.2.3 Radiesse
10.2.4 Sculptra
10.2.5 Ellanse
10.2.6 Bellafill
10.2.7 AQUAMID
10.2.8 ELEVESS
10.2.9 OTROS
10.3 GENÉRICO
11 MERCADO DE RELLENOS INYECTABLES ESTÉTICOS DE ORIENTE MEDIO Y ÁFRICA, POR APLICACIÓN
11.1 RESUMEN
11.2 CORRECCIÓN DE LÍNEAS FACIALES
11.2.1 ARRUGAS DINÁMICAS
11.2.2 ARRUGAS ESTÁTICAS
11.2.3 PLIEGUES DE ARRUGAS
11.2.4 LÍNEAS DE LA RISA
11.2.5 LÍNEAS DE LA FRENTE
11.2.6 LÍNEAS DE PREOCUPACIÓN
11.2.7 PATAS DE GALLO
11.2.8 LÍNEAS DE LOS LABIOS
11.2.9 LÍNEAS DE MARIONETA
11.2.10 ARRUGAS DE MARIONETA
11.2.11 LÍNEAS DE CONEJO
11.2.12 OTROS
11.2.13 JUVEDERM
11.2.14 RESTYLANE
11.2.15 BELOTERO
11.2.16 RADIESSE
11.2.17 OTROS
11.3 AUMENTO DE LABIOS
11.3.1 JUVÉDERM
11.3.1.1 JUVÉDERM XC
11.3.1.2 VOLUMEN
11.3.1.3 VOLUMEN
11.3.1.4 VOLUMEN
11.3.2 RESTYLANE
11.3.2.1 RESTYLANE LYFT
11.3.2.2 RESTYLANE KYSSE
11.3.2.3 RESTYLANE CONTOUR
11.3.2.4 RESTYLANE REFYNE
11.3.2.5 RESTYLANE SILK
11.3.3 EQUILIBRIO BELOTERO
11.3.4 RHA
11.3.4.1 RHA 2
11.3.4.2 RHA 3
11.3.4.3 RHA 4
11.3.5 REVANESSE VERSA
11.3.6 HYLAFORM
11.3.7 ELEVESS
11.3.8 PREVELLE SILK
11.3.9 OTROS
11.4 ESTIRAMIENTO FACIAL
11.4.1 ESTIRAMIENTO FACIAL DE PLANO PROFUNDO/SMAS
11.4.2 MINI ESTIRAMIENTO FACIAL
11.4.3 ESTIRAMIENTO FACIAL MEDIO
11.4.4 ESTIRAMIENTO FACIAL LÍQUIDO
11.4.5 Levantamiento de mejillas
11.4.6 Rejuvenecimiento de la línea mandibular
11.4.7 Levantamiento en S
11.4.8 Levantamiento cutáneo
11.4.9 ELEVACIÓN TEMPORAL/DE CEJAS
11.4.10 OTROS
11.4.11 JUVEDERM
11.4.12 RESTYLANE
11.4.13 SCULPTRA
11.4.14 Dysport
11.4.15 Otros
11.5 Rinoplastia
11.5.1 JUVÉDERM
11.5.1.1 VOLUMA
11.5.1.2 VOLBELLA
11.5.1.3 JUVÉDERM XC
11.5.1.4 VOLLURE
11.5.2 RESTYLANE
11.5.2.1 RESTYLANE LYFT
11.5.2.2 RESTYLANE SILK
11.5.2.3 RESTYLANE REFYNE
11.5.2.4 RESTYLANE KYSSE
11.5.2.5 RESTYLANE CONTOUR
11.5.3 Equilibrio de Belotero
11.5.4 Revanesa inversa
11.5.5 RHA
11.5.5.1 RHA 2
11.5.5.2 RHA 3
11.5.5.3 RHA 4
11.5.6 HYLAFORM
11.5.7 ELEVESS
11.5.8 PREVELLE SILK
11.5.9 OTROS
11.6 TRATAMIENTO DE CICATRICES
11.6.1 CICATRICES DE ACNÉ
11.6.2 CICATRICES HIPERTRÓFICAS
11.6.3 CICATRICES QUELOIDES
11.6.4 CICATRICES POR CONTRACTURA
11.6.5 OTROS
11.6.6 JUVEDERM
11.6.7 RESTYLANE
11.6.8 RADIESSE
11.6.9 BELOTERO
11.6.10 PERLANE
11.6.11 OTROS
11.7 PIEL FLÁCIDA
11.7.1 Boletero
11.7.2 Restylane
11.7.3 Juvederm
11.7.4 Otros
11.8 DEPRESIÓN DE MEJILLAS
11.8.1 JUVEDERM VOLUMA
11.8.2 RESTYLANE-LYFT
11.8.3 SCULPTRA
11.8.4 RADIESSE
11.8.5 OTROS
11.9 CIRUGÍA RECONSTRUCTIVA
11.9.1 JUVEDERM
11.9.2 RESTYLANE
11.9.3 OTROS
11.1 RESTAURACIÓN ESTÉTICA
11.10.1 JUVÉDERM
11.10.1.1 JUVEDERM ULTRA XC
11.10.1.2 JUVEDERM VOLBELLA XC
11.10.1.3 JUVEDERM VOLLURE XC
11.10.2 RESTYLANE
11.10.2.1 RESTYLANE LYFT
11.10.2.2 RESTYLANE-L
11.10.2.3 RESTYLANE REFYNE Y DEFYNE
11.10.2.4 RESTYLANE SILK
11.10.3 SCULPTRA
11.10.4 RADIESSE
11.10.5 RHA
11.10.5.1 RHA 2
11.10.5.2 RHA 3
11.10.5.3 RHA 4
11.10.6 REVANESSE VERSA
11.10.7 BELOTERO BALANCE
11.10.8 BELLAFILL
11.10.9 OTROS
11.11 ODONTOLOGÍA
11.11.1 JUVEDERM
11.11.2 RESTYLANE
11.11.3 RADIESSE
11.11.4 OTROS
11.12 AUMENTO DE MENTÓN
11.12.1 JUVEDERM VOLUMA XC
11.12.2 RESTYLANE DEFYNE
11.12.3 OTROS
11.13 TRATAMIENTO DE LIPOATROFIA
11.13.1 SCULPTRA
11.13.2 OTROS
11.14 SUAVIZANTE DE LA PIEL
11.14.1 RESTYLANE
11.14.2 BELOTERO
11.14.3 BELLAFIL
11.14.4 OTROS
11.15 REJUVENECIMIENTO DEL LÓBULO DE LA OREJA
11.15.1 SCULPTRA
11.15.2 RESTYLANE
11.15.3 ELLANSÉ
11.15.4 BELOTERO
11.15.5 JUVEDERM
11.15.6 OTROS
11.16 OTROS
12 MERCADO DE RELLENOS INYECTABLES ESTÉTICOS DE ORIENTE MEDIO Y ÁFRICA, POR USUARIO FINAL
12.1 DESCRIPCIÓN GENERAL
12.2 CLÍNICAS DE DERMATOLOGÍA
12.3 HOSPITALES
12.4 CENTROS DE CIRUGÍA AMBULATORIA
12.5 OTROS
13 MERCADO DE RELLENOS INYECTABLES ESTÉTICOS DE ORIENTE MEDIO Y ÁFRICA, POR CANAL DE DISTRIBUCIÓN
13.1 DESCRIPCIÓN GENERAL
13.2 LICITACIÓN DIRECTA/DISTRIBUCIÓN DIRECTA
13.3 FARMACIAS
13.4 FARMACIA EN LÍNEA
13.5 OTROS
14 MERCADO DE RELLENOS INYECTABLES ESTÉTICOS DE ORIENTE MEDIO Y ÁFRICA, POR REGIÓN
14.1 ORIENTE MEDIO Y ÁFRICA DEL NORTE
14.1.1 EAU
14.1.2 ARABIA SAUDITA
14.1.3 EGIPTO
14.1.4 ISRAEL
14.1.5 BARÉIN
14.1.6 TURQUÍA
14.1.7 KUWAIT
14.1.8 OMÁN
14.1.9 RESTO DE ORIENTE MEDIO Y NORTE DE ÁFRICA
15 MERCADO DE RELLENOS INYECTABLES ESTÉTICOS DE ORIENTE MEDIO Y ÁFRICA: PANORAMA EMPRESARIAL
15.1 ANÁLISIS DE ACCIONES DE LA EMPRESA: MEA
16 ANÁLISIS FODA
17 PERFIL DE LA EMPRESA
17.1 ALLERGAN AESTHETICS
17.1.1 RESEÑAS DE LA EMPRESA
17.1.2 ANÁLISIS DE INGRESOS Y ANÁLISIS SEGMENTADO
17.1.3 ANÁLISIS DE LAS ACCIONES DE LA EMPRESA
17.1.4 CARTERA DE PRODUCTOS
17.1.5 DESARROLLO RECIENTE
17.2 GALDERMA
17.2.1 INSTANTÁNEA DE LA EMPRESA
17.2.2 ANÁLISIS DE INGRESOS
17.2.3 ANÁLISIS DE LAS ACCIONES DE LA EMPRESA
17.2.4 CARTERA DE PRODUCTOS
17.2.5 DESARROLLO RECIENTE
17.3 MERZ PHARMA
17.3.1 RESUMEN DE LA EMPRESA
17.3.2 ANÁLISIS DE LAS ACCIONES DE LA EMPRESA
17.3.3 CARTERA DE PRODUCTOS
17.3.4 DESARROLLO RECIENTE
17.4 HUGEL, INC.
17.4.1 RESUMEN DE LA EMPRESA
17.4.2 ANÁLISIS DE INGRESOS
17.4.3 ANÁLISIS DE LA PARTICIPACIÓN DE LA EMPRESA
17.4.4 CARTERA DE PRODUCTOS
17.4.5 DESARROLLO RECIENTE
17.5 LG CHEM
17.5.1 RESUMEN DE LA EMPRESA
17.5.2 ANÁLISIS DE INGRESOS
17.5.3 ANÁLISIS DE LA PARTICIPACIÓN DE LA EMPRESA
17.5.4 CARTERA DE PRODUCTOS
17.5.5 DESARROLLO RECIENTE
17.6 AMALIAN
17.6.1 RESUMEN DE LA EMPRESA
17.6.2 CARTERA DE PRODUCTOS
17.6.3 DESARROLLO RECIENTE
17.7 BIOCIENCIA
17.7.1 RESUMEN DE LA EMPRESA
17.7.2 CARTERA DE PRODUCTOS
17.7.3 DESARROLLO RECIENTE
17.8 BIOPLUS CO. LTD.
17.8.1 RESUMEN DE LA EMPRESA
17.8.2 CARTERA DE PRODUCTOS
17.8.3 DESARROLLO RECIENTE
17.9 BIOXIS PHARMACEUTICALS
17.9.1 RESUMEN DE LA EMPRESA
17.9.2 CARTERA DE PRODUCTOS
17.9.3 DESARROLLO RECIENTE
17.1 CONTURA INTERNATIONAL LTD
17.10.1 RESUMEN DE LA EMPRESA
17.10.2 CARTERA DE PRODUCTOS
17.10.3 DESARROLLO RECIENTE
17.11 CROMA-PHARMA GMBH
17.11.1 RESUMEN DE LA EMPRESA
17.11.2 PORTAFOLIO DE PRODUCTOS
17.11.3 DESARROLLO RECIENTE
17.12 HUONS GLOBAL
17.12.1 RESUMEN DE LA EMPRESA
17.12.2 ANÁLISIS DE INGRESOS
17.12.3 CARTERA DE PRODUCTOS
17.12.4 DESARROLLO RECIENTE
17.13 HUMEDIX
17.13.1 RESUMEN DE LA EMPRESA
17.13.2 ANÁLISIS DE INGRESOS
17.13.3 CARTERA DE PRODUCTOS
17.13.4 DESARROLLO RECIENTE
17.14 IBSA INSTITUT BIOCHIMIQUE SA
17.14.1 RESUMEN DE LA EMPRESA
17.14.2 PORTAFOLIO DE PRODUCTOS
17.14.3 DESARROLLO RECIENTE
17.15 JALUPRO
17.15.1 RESUMEN DE LA EMPRESA
17.15.2 CARTERA DE PRODUCTOS
17.15.3 DESARROLLO RECIENTE
17.16 LABORATORIOS VIVACY
17.16.1 RESUMEN DE LA EMPRESA
17.16.2 PORTAFOLIO DE PRODUCTOS
17.16.3 DESARROLLO RECIENTE
17.17 LABORATORIOS FILLMED
17.17.1 RESUMEN DE LA EMPRESA
17.17.2 PORTAFOLIO DE PRODUCTOS
17.17.3 DESARROLLO RECIENTE
17.18 MEDYTOX INC
17.18.1 RESUMEN DE LA EMPRESA
17.18.2 ANÁLISIS DE INGRESOS
17.18.3 CARTERA DE PRODUCTOS
17.18.4 DESARROLLO RECIENTE
17.19 MESOESTETIC
17.19.1 RESUMEN DE LA EMPRESA
17.19.2 CARTERA DE PRODUCTOS
17.19.3 DESARROLLO RECIENTE
17.2 GRUPO PETRONE
17.20.1 RESUMEN DE LA EMPRESA
17.20.2 CARTERA DE PRODUCTOS
17.20.3 DESARROLLO RECIENTE
17.21 GRUPO MÉDICO PREMIER
17.21.1 RESUMEN DE LA EMPRESA
17.21.2 CARTERA DE PRODUCTOS
17.21.3 DESARROLLO RECIENTE
17.22 TECNOLOGÍAS MÉDICAS PROLENIUM
17.22.1 RESUMEN DE LA EMPRESA
17.22.2 CARTERA DE PRODUCTOS
17.22.3 DESARROLLO RECIENTE
17.23 REVANCE
17.23.1 RESUMEN DE LA EMPRESA
17.23.2 CARTERA DE PRODUCTOS
17.23.3 DESARROLLO RECIENTE
17.24 SINCLAIR
17.24.1 RESUMEN DE LA EMPRESA
17.24.2 CARTERA DE PRODUCTOS
17.24.3 DESARROLLO RECIENTE
17.25 SHANGHAI REYOUNGEL MEDICAL TECHNOLOGY COMPANY LIMITED
17.25.1 RESUMEN DE LA EMPRESA
17.25.2 CARTERA DE PRODUCTOS
17.25.3 DESARROLLO RECIENTE
17.26 SOSUM GLOBAL
17.26.1 RESUMEN DE LA EMPRESA
17.26.2 CARTERA DE PRODUCTOS
17.26.3 DESARROLLO RECIENTE
17.27 TIGER AESTHETICS MEDICAL, LLC
17.27.1 RESUMEN DE LA EMPRESA
17.27.2 PORTAFOLIO DE PRODUCTOS
17.27.3 DESARROLLO RECIENTE
17.28 TEOXANE
17.28.1 RESUMEN DE LA EMPRESA
17.28.2 CARTERA DE PRODUCTOS
17.28.3 DESARROLLO RECIENTE
17.29 VIDA SRL.
17.29.1 RESUMEN DE LA EMPRESA
17.29.2 CARTERA DE PRODUCTOS
17.29.3 DESARROLLO RECIENTE
17.3 ZHEJIANG JINGJIA MEDICAL TECHNOLOGY CO., LTD.
17.30.1 RESUMEN DE LA EMPRESA
17.30.2 PORTAFOLIO DE PRODUCTOS
17.30.3 DESARROLLO RECIENTE
18 CUESTIONARIO
19 INFORMES RELACIONADOS
Lista de Tablas
TABLA 1 MERCADO DE RELLENOS INYECTABLES ESTÉTICOS DE ORIENTE MEDIO Y ÁFRICA, POR TIPO, 2018-2036 (MILES DE USD)
TABLA 2 MERCADO DE RELLENOS INYECTABLES ESTÉTICOS DE ORIENTE MEDIO Y ÁFRICA, POR TIPO, 2018-2036 (VOLUMEN EN MILES DE UNIDADES)
TABLA 3 MERCADO DE RELLENOS INYECTABLES ESTÉTICOS DE ORIENTE MEDIO Y ÁFRICA, POR TIPO, 2018-2036 (ASP EN USD/UNIDADES)
TABLA 4 RELLENOS INYECTABLES ESTÉTICOS BIODEGRADABLES EN EL MERCADO DE RELLENOS INYECTABLES ESTÉTICOS DE ORIENTE MEDIO Y ÁFRICA, POR REGIÓN, 2018-2036 (MILES DE USD)
TABLA 5 RELLENOS INYECTABLES ESTÉTICOS BIODEGRADABLES EN EL MERCADO DE RELLENOS INYECTABLES ESTÉTICOS DE ORIENTE MEDIO Y ÁFRICA, POR TIPO, 2018-2036 (MILES DE USD)
TABLA 6 RELLENOS INYECTABLES ESTÉTICOS BIODEGRADABLES EN EL MERCADO DE RELLENOS INYECTABLES ESTÉTICOS DE ORIENTE MEDIO Y ÁFRICA, POR TIPO, 2018-2036 (VOLUMEN EN MILES DE UNIDADES)
TABLA 7 RELLENOS INYECTABLES ESTÉTICOS BIODEGRADABLES EN EL MERCADO DE RELLENOS INYECTABLES ESTÉTICOS DE ORIENTE MEDIO Y ÁFRICA, POR TIPO, 2018-2036 (ASP EN USD/UNIDADES)
TABLA 8 RELLENOS INYECTABLES ESTÉTICOS NO BIODEGRADABLES EN EL MERCADO DE RELLENOS INYECTABLES ESTÉTICOS DE ORIENTE MEDIO Y ÁFRICA, POR REGIÓN, 2018-2036 (MILES DE USD)
TABLA 9 MERCADO DE RELLENOS INYECTABLES ESTÉTICOS DE ORIENTE MEDIO Y ÁFRICA, POR TIPO DE PRODUCTO, 2018-2036 (MILES DE USD)
TABLA 10 MERCADO DE RELLENOS INYECTABLES ESTÉTICOS DE ORIENTE MEDIO Y ÁFRICA, POR TIPO DE PRODUCTO, 2018-2036 (VOLUMEN EN MILES DE UNIDADES)
TABLA 11 MERCADO DE RELLENOS INYECTABLES ESTÉTICOS DE ORIENTE MEDIO Y ÁFRICA, POR TIPO DE PRODUCTO, 2018-2036 (ASP EN USD/UNIDADES)
TABLA 12 RELLENOS INYECTABLES ESTÉTICOS NATURALES DE ORIENTE MEDIO Y ÁFRICA EN EL MERCADO DE RELLENOS INYECTABLES ESTÉTICOS, POR REGIÓN, 2018-2036 (MILES DE USD)
TABLA 13 RELLENOS INYECTABLES ESTÉTICOS NATURALES DE ORIENTE MEDIO Y ÁFRICA EN EL MERCADO DE RELLENOS INYECTABLES ESTÉTICOS, POR TIPO, 2018-2036 (MILES DE USD)
TABLA 14 ORIENTE MEDIO Y ÁFRICA ÁCIDO HIALURÓNICO (AH) EN EL MERCADO DE RELLENOS INYECTABLES ESTÉTICOS, POR TIPO, 2018-2036 (MILES DE USD)
TABLA 15 RELLENOS MONOFÁSICOS EN EL MERCADO DE RELLENOS INYECTABLES ESTÉTICOS DE ORIENTE MEDIO Y ÁFRICA, POR TIPO, 2018-2036 (MILES DE USD)
TABLA 16 RELLENOS MONOFÁSICOS EN EL MERCADO DE RELLENOS INYECTABLES ESTÉTICOS DE ORIENTE MEDIO Y ÁFRICA, POR APLICACIÓN, 2018-2036 (MILES DE USD)
TABLA 17 RELLENOS BIFÁSICOS EN EL MERCADO DE RELLENOS INYECTABLES ESTÉTICOS DE ORIENTE MEDIO Y ÁFRICA, POR TIPO DE MATERIAL, 2018-2036 (MILES DE USD)
TABLA 18 RELLENOS BIFÁSICOS EN EL MERCADO DE RELLENOS INYECTABLES ESTÉTICOS DE ORIENTE MEDIO Y ÁFRICA, POR APLICACIÓN, 2018-2036 (MILES DE USD)
TABLA 19 ORIENTE MEDIO Y ÁFRICA GRASA EN EL MERCADO DE RELLENOS INYECTABLES ESTÉTICOS, POR APLICACIÓN, 2018-2036 (MILES DE USD)
TABLA 20 MERCADO DE COLÁGENO EN RELLENOS INYECTABLES ESTÉTICOS DE ORIENTE MEDIO Y ÁFRICA, POR APLICACIÓN, 2018-2036 (MILES DE USD)
TABLA 21 ORIENTE MEDIO Y ÁFRICA POLINUCLEÓTIDOS/POLIDEOXIRRIBONUCLEÓTIDOS (PN/PDRN) EN EL MERCADO DE RELLENOS INYECTABLES ESTÉTICOS, POR APLICACIÓN, 2018-2036 (MILES DE USD)
TABLA 22 ORIENTE MEDIO Y ÁFRICA OTROS MERCADOS DE RELLENOS INYECTABLES ESTÉTICOS, POR APLICACIÓN, 2018-2036 (MILES DE USD)
TABLA 23 RELLENOS INYECTABLES ESTÉTICOS SINTÉTICOS DE ORIENTE MEDIO Y ÁFRICA EN EL MERCADO DE RELLENOS INYECTABLES ESTÉTICOS, POR REGIÓN, 2018-2036 (MILES DE USD)
TABLA 24 RELLENOS INYECTABLES ESTÉTICOS SINTÉTICOS EN EL MERCADO DE RELLENOS INYECTABLES ESTÉTICOS DE ORIENTE MEDIO Y ÁFRICA, POR TIPO, 2018-2036 (MILES DE USD)
TABLA 25 ORIENTE MEDIO Y ÁFRICA HIDROXILAPATITA DE CALCIO (CAHA) EN EL MERCADO DE RELLENOS INYECTABLES ESTÉTICOS, POR APLICACIÓN, 2018-2036 (MILES DE USD)
TABLA 26 ORIENTE MEDIO Y ÁFRICA ÁCIDO POLI-L-LÁCTICO (PLLA) EN EL MERCADO DE RELLENOS INYECTABLES ESTÉTICOS, POR APLICACIÓN, 2018-2036 (MILES DE USD)
TABLA 27 ORIENTE MEDIO Y ÁFRICA MICROESFERAS DE POLIMETILMETACRILATO (PMMA) EN EL MERCADO DE RELLENOS INYECTABLES ESTÉTICOS, POR APLICACIÓN, 2018-2036 (MILES DE USD)
TABLA 28 MERCADO DE RELLENOS INYECTABLES ESTÉTICOS DE ORIENTE MEDIO Y ÁFRICA, POR TIPO DE MEDICAMENTO, 2018-2036 (MILES DE USD)
TABLA 29 ORIENTE MEDIO Y ÁFRICA MARCAS EN EL MERCADO DE RELLENOS INYECTABLES ESTÉTICOS, POR REGIÓN, 2018-2036 (MILES DE USD)
TABLA 30 ORIENTE MEDIO Y ÁFRICA MARCAS EN EL MERCADO DE RELLENOS INYECTABLES ESTÉTICOS, POR TIPO, 2018-2036 (MILES DE USD)
TABLA 31 MERCADO DE RELLENOS INYECTABLES GENÉRICOS ESTÉTICOS EN ORIENTE MEDIO Y ÁFRICA, POR REGIÓN, 2018-2036 (MILES DE USD)
TABLA 32 MERCADO DE RELLENOS INYECTABLES ESTÉTICOS DE ORIENTE MEDIO Y ÁFRICA, POR APLICACIÓN, 2018-2036 (MILES DE USD)
TABLA 33 CORRECCIÓN DE LÍNEAS FACIALES EN EL MERCADO DE RELLENOS INYECTABLES ESTÉTICOS DE ORIENTE MEDIO Y ÁFRICA, POR REGIÓN, 2018-2036 (MILES DE USD)
TABLA 34 CORRECCIÓN DE LÍNEAS FACIALES EN EL MERCADO DE RELLENOS INYECTABLES ESTÉTICOS DE ORIENTE MEDIO Y ÁFRICA, POR TIPO, 2018-2036 (MILES DE USD)
TABLA 35 CORRECCIÓN DE LÍNEAS FACIALES EN EL MERCADO DE RELLENOS INYECTABLES ESTÉTICOS DE ORIENTE MEDIO Y ÁFRICA, POR UBICACIÓN, 2018-2036 (MILES DE USD)
TABLA 36 CORRECCIÓN DE LÍNEAS FACIALES EN EL MERCADO DE RELLENOS INYECTABLES ESTÉTICOS DE ORIENTE MEDIO Y ÁFRICA, POR MARCA, 2018-2036 (MILES DE USD)
TABLA 37 MERCADO DE RELLENOS INYECTABLES ESTÉTICOS PARA EL MEJORAMIENTO DE LABIOS EN ORIENTE MEDIO Y ÁFRICA, POR REGIÓN, 2018-2036 (MILES DE USD)
TABLA 38 MERCADO DE RELLENOS INYECTABLES ESTÉTICOS PARA EL MEJORAMIENTO DE LABIOS EN ORIENTE MEDIO Y ÁFRICA, POR TIPO, 2018-2036 (MILES DE USD)
TABLA 39 ORIENTE MEDIO Y ÁFRICA JUVÉDERM EN EL MERCADO DE RELLENOS INYECTABLES ESTÉTICOS, POR TIPO, 2018-2036 (MILES DE USD)
TABLA 40 ORIENTE MEDIO Y ÁFRICA RESTYLANE EN EL MERCADO DE RELLENOS INYECTABLES ESTÉTICOS, POR TIPO, 2018-2036 (MILES DE USD)
TABLA 41 ORIENTE MEDIO Y ÁFRICA RHA EN EL MERCADO DE RELLENOS INYECTABLES ESTÉTICOS, POR TIPO, 2018-2036 (MILES DE USD)
TABLA 42 MERCADO DE RELLENOS INYECTABLES ESTÉTICOS DE LIFTING FACIAL EN ORIENTE MEDIO Y ÁFRICA, POR REGIÓN, 2018-2036 (MILES DE USD)
TABLA 43 MERCADO DE RELLENOS INYECTABLES ESTÉTICOS EN ORIENTE MEDIO Y ÁFRICA, POR TIPO, 2018-2036 (MILES DE USD)
TABLA 44. ESTIRAMIENTO FACIAL EN EL MERCADO DE RELLENOS INYECTABLES ESTÉTICOS DE ORIENTE MEDIO Y ÁFRICA, POR MARCA, 2018-2036 (MILES DE USD)
TABLA 45 ORIENTE MEDIO Y ÁFRICA RINOPLASTIA EN EL MERCADO DE RELLENOS INYECTABLES ESTÉTICOS, POR REGIÓN, 2018-2036 (MILES DE USD)
TABLA 46 ORIENTE MEDIO Y ÁFRICA RINOPLASTIA EN EL MERCADO DE RELLENOS INYECTABLES ESTÉTICOS, POR TIPO, 2018-2036 (MILES DE USD)
TABLA 47 ORIENTE MEDIO Y ÁFRICA JUVÉDERM EN EL MERCADO DE RELLENOS INYECTABLES ESTÉTICOS, POR TIPO, 2018-2036 (MILES DE USD)
TABLA 48 ORIENTE MEDIO Y ÁFRICA RESTYLANE EN EL MERCADO DE RELLENOS INYECTABLES ESTÉTICOS, POR TIPO, 2018-2036 (MILES DE USD)
TABLA 49 ORIENTE MEDIO Y ÁFRICA RHA EN EL MERCADO DE RELLENOS INYECTABLES ESTÉTICOS, POR TIPO, 2018-2036 (MILES DE USD)
TABLA 50 TRATAMIENTO DE CICATRICES EN EL MERCADO DE RELLENOS INYECTABLES ESTÉTICOS DE ORIENTE MEDIO Y ÁFRICA, POR REGIÓN, 2018-2036 (MILES DE USD)
TABLA 51 TRATAMIENTO DE CICATRICES EN EL MERCADO DE RELLENOS INYECTABLES ESTÉTICOS DE ORIENTE MEDIO Y ÁFRICA, POR TIPO, 2018-2036 (MILES DE USD)
TABLA 52 TRATAMIENTO DE CICATRICES EN EL MERCADO DE RELLENOS INYECTABLES ESTÉTICOS DE ORIENTE MEDIO Y ÁFRICA, POR MARCA, 2018-2036 (MILES DE USD)
TABLA 53 ORIENTE MEDIO Y ÁFRICA FLAPIDEZ DE LA PIEL EN EL MERCADO DE RELLENOS INYECTABLES ESTÉTICOS, POR REGIÓN, 2018-2036 (MILES DE USD)
TABLA 54 ORIENTE MEDIO Y ÁFRICA FLAPIDEZ DE LA PIEL EN EL MERCADO DE RELLENOS INYECTABLES ESTÉTICOS, POR TIPO, 2018-2036 (MILES DE USD)
TABLA 55 DEPRESIÓN DE LAS MEJILLAS EN EL MERCADO DE RELLENOS INYECTABLES ESTÉTICOS DE ORIENTE MEDIO Y ÁFRICA, POR REGIÓN, 2018-2036 (MILES DE USD)
TABLA 56 DEPRESIÓN DE LAS MEJILLAS EN EL MERCADO DE RELLENOS INYECTABLES ESTÉTICOS DE ORIENTE MEDIO Y ÁFRICA, POR TIPO, 2018-2036 (MILES DE USD)
TABLA 57 ORIENTE MEDIO Y ÁFRICA CIRUGÍA RECONSTRUCTIVA EN EL MERCADO DE RELLENOS INYECTABLES ESTÉTICOS, POR REGIÓN, 2018-2036 (MILES DE USD)
TABLA 58 CIRUGÍA RECONSTRUCTIVA EN EL MERCADO DE RELLENOS INYECTABLES ESTÉTICOS DE ORIENTE MEDIO Y ÁFRICA, POR TIPO, 2018-2036 (MILES DE USD)
TABLA 59 RESTAURACIÓN ESTÉTICA EN EL MERCADO DE RELLENOS INYECTABLES ESTÉTICOS DE ORIENTE MEDIO Y ÁFRICA, POR REGIÓN, 2018-2036 (MILES DE USD)
TABLA 60 RESTAURACIÓN ESTÉTICA EN EL MERCADO DE RELLENOS INYECTABLES ESTÉTICOS DE ORIENTE MEDIO Y ÁFRICA, POR TIPO, 2018-2036 (MILES DE USD)
TABLA 61 ORIENTE MEDIO Y ÁFRICA JUVÉDERM EN EL MERCADO DE RELLENOS INYECTABLES ESTÉTICOS, POR TIPO, 2018-2036 (MILES DE USD)
TABLA 62 ORIENTE MEDIO Y ÁFRICA RESTYLANE EN EL MERCADO DE RELLENOS INYECTABLES ESTÉTICOS, POR TIPO, 2018-2036 (MILES DE USD)
TABLA 63 ORIENTE MEDIO Y ÁFRICA RHA EN EL MERCADO DE RELLENOS INYECTABLES ESTÉTICOS, POR TIPO, 2018-2036 (MILES DE USD)
TABLA 64 MERCADO DE RELLENOS INYECTABLES ESTÉTICOS EN ODONTOLOGÍA DE ORIENTE MEDIO Y ÁFRICA, POR REGIÓN, 2018-2036 (MILES DE USD)
TABLA 65 MERCADO DE RELLENOS INYECTABLES ESTÉTICOS EN ODONTOLOGÍA DE ORIENTE MEDIO Y ÁFRICA, POR TIPO, 2018-2036 (MILES DE USD)
TABLA 66 AUMENTO DE MENTÓN EN EL MERCADO DE RELLENOS INYECTABLES ESTÉTICOS DE ORIENTE MEDIO Y ÁFRICA, POR REGIÓN, 2018-2036 (MILES DE USD)
TABLA 67 AUMENTO DE MENTÓN EN EL MERCADO DE RELLENOS INYECTABLES ESTÉTICOS DE ORIENTE MEDIO Y ÁFRICA, POR TIPO, 2018-2036 (MILES DE USD)
TABLA 68 TRATAMIENTO DE LIPOATROFIA EN EL MERCADO DE RELLENOS INYECTABLES ESTÉTICOS DE ORIENTE MEDIO Y ÁFRICA, POR REGIÓN, 2018-2036 (MILES DE USD)
TABLA 69 TRATAMIENTO DE LIPOATROFIA EN EL MERCADO DE RELLENOS INYECTABLES ESTÉTICOS DE ORIENTE MEDIO Y ÁFRICA, POR TIPO, 2018-2036 (MILES DE USD)
TABLA 70 ORIENTE MEDIO Y ÁFRICA: MERCADO DE RELLENOS INYECTABLES ESTÉTICOS PARA EL SUAVIZADO DE LA PIEL, POR REGIÓN, 2018-2036 (MILES DE USD)
TABLA 71 ORIENTE MEDIO Y ÁFRICA SUAVIZAMIENTO DE LA PIEL EN EL MERCADO DE RELLENOS INYECTABLES ESTÉTICOS, POR TIPO, 2018-2036 (MILES DE USD)
TABLA 72 ORIENTE MEDIO Y ÁFRICA REJUVENECIMIENTO DEL LÓBULO DE LA OREJA EN EL MERCADO DE RELLENOS INYECTABLES ESTÉTICOS, POR REGIÓN, 2018-2036 (MILES DE USD)
TABLA 73 ORIENTE MEDIO Y ÁFRICA REJUVENECIMIENTO DEL LÓBULO DE LA OREJA EN EL MERCADO DE RELLENOS INYECTABLES ESTÉTICOS, POR TIPO, 2018-2036 (MILES DE USD)
TABLA 74 ORIENTE MEDIO Y ÁFRICA OTROS MERCADOS DE RELLENOS INYECTABLES ESTÉTICOS, POR REGIÓN, 2018-2036 (MILES DE USD)
TABLA 75 MERCADO DE RELLENOS INYECTABLES ESTÉTICOS DE ORIENTE MEDIO Y ÁFRICA, POR USUARIO FINAL, 2018-2036 (MILES DE USD)
TABLA 76 CLÍNICAS DE DERMATOLOGÍA EN EL MERCADO DE RELLENOS INYECTABLES ESTÉTICOS DE ORIENTE MEDIO Y ÁFRICA, POR REGIÓN, 2018-2036 (MILES DE USD)
TABLA 77 HOSPITALES DE ORIENTE MEDIO Y ÁFRICA EN EL MERCADO DE RELLENOS INYECTABLES ESTÉTICOS, POR REGIÓN, 2018-2036 (MILES DE USD)
TABLA 78 CENTROS DE CIRUGÍA AMBULATORIA EN EL MERCADO DE RELLENOS INYECTABLES ESTÉTICOS DE ORIENTE MEDIO Y ÁFRICA, POR REGIÓN, 2018-2036 (MILES DE USD)
TABLA 79 ORIENTE MEDIO Y ÁFRICA OTROS MERCADOS DE RELLENOS INYECTABLES ESTÉTICOS, POR REGIÓN, 2018-2036 (MILES DE USD)
TABLA 80 MERCADO DE RELLENOS INYECTABLES ESTÉTICOS DE ORIENTE MEDIO Y ÁFRICA, POR CANAL DE DISTRIBUCIÓN, 2018-2036 (MILES DE USD)
TABLA 81 ORIENTE MEDIO Y ÁFRICA LICITACIÓN DIRECTA/DISTRIBUCIÓN DIRECTA EN EL MERCADO DE RELLENOS INYECTABLES ESTÉTICOS, POR REGIÓN, 2018-2036 (MILES DE USD)
TABLA 82 FARMACIAS DE ORIENTE MEDIO Y ÁFRICA EN EL MERCADO DE RELLENOS INYECTABLES ESTÉTICOS, POR REGIÓN, 2018-2036 (MILES DE USD)
TABLA 83 MERCADO DE FARMACIAS EN LÍNEA DE RELLENOS INYECTABLES ESTÉTICOS EN ORIENTE MEDIO Y ÁFRICA, POR REGIÓN, 2018-2036 (MILES DE USD)
TABLA 84 ORIENTE MEDIO Y ÁFRICA OTROS MERCADOS DE RELLENOS INYECTABLES ESTÉTICOS, POR REGIÓN, 2018-2036 (MILES DE USD)
TABLA 85 MERCADO DE RELLENOS INYECTABLES ESTÉTICOS DE ORIENTE MEDIO Y NORTE DE ÁFRICA, POR PAÍS, 2018-2036 (MILES DE USD)
TABLA 86 MERCADO DE RELLENOS INYECTABLES ESTÉTICOS DE ORIENTE MEDIO Y NORTE DE ÁFRICA, POR TIPO DE PRODUCTO, 2018-2036 (MILES DE USD)
TABLA 87 MERCADO DE RELLENOS INYECTABLES ESTÉTICOS DE ORIENTE MEDIO Y NORTE DE ÁFRICA, POR TIPO DE PRODUCTO, 2018-2036 (VOLUMEN EN MILES DE UNIDADES)
TABLA 88 MERCADO DE RELLENOS INYECTABLES ESTÉTICOS DE ORIENTE MEDIO Y ÁFRICA DEL NORTE, POR TIPO DE PRODUCTO, 2018-2036 (ASP EN USD/UNIDADES)
TABLA 89 ORIENTE MEDIO Y NORTE DE ÁFRICA RELLENOS INYECTABLES ESTÉTICOS NATURALES EN EL MERCADO DE RELLENOS INYECTABLES ESTÉTICOS, POR TIPO, 2018-2036 (MILES DE USD)
TABLA 90 ORIENTE MEDIO Y NORTE DE ÁFRICA ÁCIDO HIALURÓNICO (AH) EN EL MERCADO DE RELLENOS INYECTABLES ESTÉTICOS, POR TIPO, 2018-2036 (MILES DE USD)
TABLA 91 RELLENOS MONOFÁSICOS EN EL MERCADO DE RELLENOS INYECTABLES ESTÉTICOS DE ORIENTE MEDIO Y NORTE DE ÁFRICA, POR TIPO, 2018-2036 (MILES DE USD)
TABLA 92 RELLENOS MONOFÁSICOS EN EL MERCADO DE RELLENOS INYECTABLES ESTÉTICOS DE ORIENTE MEDIO Y NORTE DE ÁFRICA, POR APLICACIÓN, 2018-2036 (MILES DE USD)
TABLA 93 RELLENOS BIFÁSICOS EN EL MERCADO DE RELLENOS INYECTABLES ESTÉTICOS DE ORIENTE MEDIO Y NORTE DE ÁFRICA, POR TIPO DE MATERIAL, 2018-2036 (MILES DE USD)
TABLA 94 RELLENOS BIFÁSICOS EN EL MERCADO DE RELLENOS INYECTABLES ESTÉTICOS DE ORIENTE MEDIO Y ÁFRICA DEL NORTE, POR APLICACIÓN, 2018-2036 (MILES DE USD)
TABLA 95 ORIENTE MEDIO Y ÁFRICA DEL NORTE GRASA EN EL MERCADO DE RELLENOS INYECTABLES ESTÉTICOS, POR APLICACIÓN, 2018-2036 (MILES DE USD)
TABLA 96 ORIENTE MEDIO Y NORTE DE ÁFRICA COLÁGENO EN EL MERCADO DE RELLENOS INYECTABLES ESTÉTICOS, POR APLICACIÓN, 2018-2036 (MILES DE USD)
TABLA 97 ORIENTE MEDIO Y NORTE DE ÁFRICA POLINUCLEÓTIDOS/POLIDEOXIRRIBONUCLEÓTIDOS (PN/PDRN) EN EL MERCADO DE RELLENOS INYECTABLES ESTÉTICOS, POR APLICACIÓN, 2018-2036 (MILES DE USD)
TABLA 98 ORIENTE MEDIO Y NORTE DE ÁFRICA OTROS MERCADOS DE RELLENOS INYECTABLES ESTÉTICOS, POR APLICACIÓN, 2018-2036 (MILES DE USD)
TABLA 99 RELLENOS INYECTABLES ESTÉTICOS SINTÉTICOS EN EL MERCADO DE RELLENOS INYECTABLES ESTÉTICOS DE ORIENTE MEDIO Y ÁFRICA DEL NORTE, POR TIPO, 2018-2036 (MILES DE USD)
TABLA 100 ORIENTE MEDIO Y NORTE DE ÁFRICA HIDROXILAPATITA DE CALCIO (CAHA) EN EL MERCADO DE RELLENOS INYECTABLES ESTÉTICOS, POR APLICACIÓN, 2018-2036 (MILES DE USD)
TABLA 101 ORIENTE MEDIO Y NORTE DE ÁFRICA ÁCIDO POLI-L-LÁCTICO (PLLA) EN EL MERCADO DE RELLENOS INYECTABLES ESTÉTICOS, POR APLICACIÓN, 2018-2036 (MILES DE USD)
TABLA 102 ORIENTE MEDIO Y NORTE DE ÁFRICA MICROESFERAS DE POLIMETILMETACRILATO (PMMA) EN EL MERCADO DE RELLENOS INYECTABLES ESTÉTICOS, POR APLICACIÓN, 2018-2036 (MILES DE USD)
TABLA 103 MERCADO DE RELLENOS INYECTABLES ESTÉTICOS DE ORIENTE MEDIO Y ÁFRICA DEL NORTE, POR TIPO, 2018-2036 (MILES DE USD)
TABLA 104 MERCADO DE RELLENOS INYECTABLES ESTÉTICOS DE ORIENTE MEDIO Y NORTE DE ÁFRICA, POR TIPO, 2018-2036 (VOLUMEN EN MILES DE UNIDADES)
TABLA 105 MERCADO DE RELLENOS INYECTABLES ESTÉTICOS DE ORIENTE MEDIO Y ÁFRICA DEL NORTE, POR TIPO, 2018-2036 (ASP EN USD/UNIDADES)
TABLA 106 ORIENTE MEDIO Y NORTE DE ÁFRICA RELLENOS INYECTABLES ESTÉTICOS BIODEGRADABLES EN EL MERCADO DE RELLENOS INYECTABLES ESTÉTICOS, POR TIPO, 2018-2036 (MILES DE USD)
TABLA 107 ORIENTE MEDIO Y NORTE DE ÁFRICA RELLENOS INYECTABLES ESTÉTICOS BIODEGRADABLES EN EL MERCADO DE RELLENOS INYECTABLES ESTÉTICOS, POR TIPO, 2018-2036 (VOLUMEN EN MILES DE UNIDADES)
TABLA 108 ORIENTE MEDIO Y NORTE DE ÁFRICA RELLENOS INYECTABLES ESTÉTICOS BIODEGRADABLES EN EL MERCADO DE RELLENOS INYECTABLES ESTÉTICOS, POR TIPO, 2018-2036 (ASP EN USD/UNIDADES)
TABLA 109 MERCADO DE RELLENOS INYECTABLES ESTÉTICOS DE ORIENTE MEDIO Y ÁFRICA DEL NORTE, POR APLICACIÓN, 2018-2036 (MILES DE USD)
TABLA 110 CORRECCIÓN DE LÍNEAS FACIALES EN EL MERCADO DE RELLENOS INYECTABLES ESTÉTICOS DE ORIENTE MEDIO Y NORTE DE ÁFRICA, POR TIPO, 2018-2036 (MILES DE USD)
TABLA 111 CORRECCIÓN DE LÍNEAS FACIALES EN EL MERCADO DE RELLENOS INYECTABLES ESTÉTICOS DE ORIENTE MEDIO Y NORTE DE ÁFRICA, POR UBICACIÓN, 2018-2036 (MILES DE USD)
TABLA 112 CORRECCIÓN DE LÍNEAS FACIALES EN EL MERCADO DE RELLENOS INYECTABLES ESTÉTICOS DE ORIENTE MEDIO Y NORTE DE ÁFRICA, POR MARCA, 2018-2036 (MILES DE USD)
TABLA 113 MERCADO DE RELLENOS INYECTABLES ESTÉTICOS PARA EL MEJORAMIENTO DE LABIOS EN ORIENTE MEDIO Y ÁFRICA DEL NORTE, POR TIPO, 2018-2036 (MILES DE USD)
TABLA 114 ORIENTE MEDIO Y NORTE DE ÁFRICA JUVÉDERM EN EL MERCADO DE RELLENOS INYECTABLES ESTÉTICOS, POR TIPO, 2018-2036 (MILES DE USD)
TABLA 115 ORIENTE MEDIO Y NORTE DE ÁFRICA RESTYLANE EN EL MERCADO DE RELLENOS INYECTABLES ESTÉTICOS, POR TIPO, 2018-2036 (MILES DE USD)
TABLA 116 ORIENTE MEDIO Y NORTE DE ÁFRICA RHA EN EL MERCADO DE RELLENOS INYECTABLES ESTÉTICOS, POR TIPO, 2018-2036 (MILES DE USD)
TABLA 117 ESTIRAMIENTO FACIAL EN EL MERCADO DE RELLENOS INYECTABLES ESTÉTICOS DE ORIENTE MEDIO Y NORTE DE ÁFRICA, POR TIPO, 2018-2036 (MILES DE USD)
TABLA 118 ESTIRAMIENTO FACIAL EN EL MERCADO DE RELLENOS INYECTABLES ESTÉTICOS DE ORIENTE MEDIO Y NORTE DE ÁFRICA, POR MARCA, 2018-2036 (MILES DE USD)
TABLA 119 ORIENTE MEDIO Y NORTE DE ÁFRICA RINOPLASTIA EN EL MERCADO DE RELLENOS INYECTABLES ESTÉTICOS, POR TIPO, 2018-2036 (MILES DE USD)
TABLA 120 ORIENTE MEDIO Y NORTE DE ÁFRICA JUVÉDERM EN EL MERCADO DE RELLENOS INYECTABLES ESTÉTICOS, POR TIPO, 2018-2036 (MILES DE USD)
TABLA 121 ORIENTE MEDIO Y NORTE DE ÁFRICA RESTYLANE EN EL MERCADO DE RELLENOS INYECTABLES ESTÉTICOS, POR TIPO, 2018-2036 (MILES DE USD)
TABLA 122 ORIENTE MEDIO Y NORTE DE ÁFRICA RHA EN EL MERCADO DE RELLENOS INYECTABLES ESTÉTICOS, POR TIPO, 2018-2036 (MILES DE USD)
TABLA 123 TRATAMIENTO DE CICATRICES EN EL MERCADO DE RELLENOS INYECTABLES ESTÉTICOS DE ORIENTE MEDIO Y NORTE DE ÁFRICA, POR TIPO, 2018-2036 (MILES DE USD)
TABLA 124 TRATAMIENTO DE CICATRICES EN EL MERCADO DE RELLENOS INYECTABLES ESTÉTICOS DE ORIENTE MEDIO Y NORTE DE ÁFRICA, POR MARCA, 2018-2036 (MILES DE USD)
TABLA 125 ORIENTE MEDIO Y NORTE DE ÁFRICA FLAPIDEZ DE LA PIEL EN EL MERCADO DE RELLENOS INYECTABLES ESTÉTICOS, POR TIPO, 2018-2036 (MILES DE USD)
TABLA 126 ORIENTE MEDIO Y NORTE DE ÁFRICA DEPRESIÓN DE MEJILLAS EN EL MERCADO DE RELLENOS INYECTABLES ESTÉTICOS, POR TIPO, 2018-2036 (MILES DE USD)
TABLA 127 ORIENTE MEDIO Y NORTE DE ÁFRICA CIRUGÍA RECONSTRUCTIVA EN EL MERCADO DE RELLENOS INYECTABLES ESTÉTICOS, POR TIPO, 2018-2036 (MILES DE USD)
TABLA 128 RESTAURACIÓN ESTÉTICA EN EL MERCADO DE RELLENOS INYECTABLES ESTÉTICOS DE ORIENTE MEDIO Y NORTE DE ÁFRICA, POR TIPO, 2018-2036 (MILES DE USD)
TABLA 129 ORIENTE MEDIO Y NORTE DE ÁFRICA JUVÉDERM EN EL MERCADO DE RELLENOS INYECTABLES ESTÉTICOS, POR TIPO, 2018-2036 (MILES DE USD)
TABLA 130 ORIENTE MEDIO Y NORTE DE ÁFRICA RESTYLANE EN EL MERCADO DE RELLENOS INYECTABLES ESTÉTICOS, POR TIPO, 2018-2036 (MILES DE USD)
TABLA 131 ORIENTE MEDIO Y NORTE DE ÁFRICA RHA EN EL MERCADO DE RELLENOS INYECTABLES ESTÉTICOS, POR TIPO, 2018-2036 (MILES DE USD)
TABLA 132 ORIENTE MEDIO Y NORTE DE ÁFRICA MERCADO DE RELLENOS INYECTABLES ESTÉTICOS, POR TIPO, 2018-2036 (MILES DE USD)
TABLA 133 AUMENTO DE MENTÓN EN EL MERCADO DE RELLENOS INYECTABLES ESTÉTICOS DE ORIENTE MEDIO Y NORTE DE ÁFRICA, POR TIPO, 2018-2036 (MILES DE USD)
TABLA 134 TRATAMIENTO DE LIPOATROFIA EN EL MERCADO DE RELLENOS INYECTABLES ESTÉTICOS DE ORIENTE MEDIO Y NORTE DE ÁFRICA, POR TIPO, 2018-2036 (MILES DE USD)
TABLA 135 ORIENTE MEDIO Y NORTE DE ÁFRICA: SUAVIZAMIENTO DE LA PIEL EN EL MERCADO DE RELLENOS INYECTABLES ESTÉTICOS, POR TIPO, 2018-2036 (MILES DE USD)
TABLA 136 ORIENTE MEDIO Y NORTE DE ÁFRICA REJUVENECIMIENTO DEL LÓBULO DE LA OREJA EN EL MERCADO DE RELLENOS INYECTABLES ESTÉTICOS, POR TIPO, 2018-2036 (MILES DE USD)
TABLA 137 MERCADO DE RELLENOS INYECTABLES ESTÉTICOS DE ORIENTE MEDIO Y NORTE DE ÁFRICA, POR TIPO DE MEDICAMENTO, 2018-2036 (MILES DE USD)
TABLA 138 ORIENTE MEDIO Y NORTE DE ÁFRICA: MARCAS EN EL MERCADO DE RELLENOS INYECTABLES ESTÉTICOS, POR TIPO, 2018-2036 (MILES DE USD)
TABLA 139 MERCADO DE RELLENOS INYECTABLES ESTÉTICOS DE ORIENTE MEDIO Y NORTE DE ÁFRICA, POR USUARIO FINAL, 2018-2036 (MILES DE USD)
TABLA 140 MERCADO DE RELLENOS INYECTABLES ESTÉTICOS DE ORIENTE MEDIO Y NORTE DE ÁFRICA, POR CANAL DE DISTRIBUCIÓN, 2018-2036 (MILES DE USD)
TABLA 141 MERCADO DE RELLENOS INYECTABLES ESTÉTICOS DE LOS EAU, POR TIPO DE PRODUCTO, 2018-2036 (MILES DE USD)
TABLA 142 MERCADO DE RELLENOS INYECTABLES ESTÉTICOS DE LOS EAU, POR TIPO DE PRODUCTO, 2018-2036 (VOLUMEN EN MILES DE UNIDADES)
TABLA 143 MERCADO DE RELLENOS INYECTABLES ESTÉTICOS DE LOS EAU, POR TIPO DE PRODUCTO, 2018-2036 (ASP EN USD/UNIDADES)
TABLA 144 RELLENOS INYECTABLES ESTÉTICOS NATURALES EN EL MERCADO DE RELLENOS INYECTABLES ESTÉTICOS DE LOS EAU, POR TIPO, 2018-2036 (MILES DE USD)
TABLA 145 ÁCIDO HIALURÓNICO (AH) EN EL MERCADO DE RELLENOS INYECTABLES ESTÉTICOS DE LOS EAU, POR TIPO, 2018-2036 (MILES DE USD)
TABLA 146 RELLENOS MONOFÁSICOS EN EL MERCADO DE RELLENOS INYECTABLES ESTÉTICOS DE LOS EAU, POR TIPO, 2018-2036 (MILES DE USD)
TABLA 147 RELLENOS MONOFÁSICOS EN EL MERCADO DE RELLENOS INYECTABLES ESTÉTICOS DE LOS EAU, POR APLICACIÓN, 2018-2036 (MILES DE USD)
TABLA 148 RELLENOS BIFÁSICOS EN EL MERCADO DE RELLENOS INYECTABLES ESTÉTICOS DE LOS EAU, POR TIPO DE MATERIAL, 2018-2036 (MILES DE USD)
TABLA 149 RELLENOS BIFÁSICOS EN EL MERCADO DE RELLENOS INYECTABLES ESTÉTICOS DE LOS EAU, POR APLICACIÓN, 2018-2036 (MILES DE USD)
TABLA 150 GRASA EN EL MERCADO DE RELLENOS INYECTABLES ESTÉTICOS DE LOS EAU, POR APLICACIÓN, 2018-2036 (MILES DE USD)
TABLA 151 COLÁGENO EN EL MERCADO DE RELLENOS INYECTABLES ESTÉTICOS DE LOS EAU, POR APLICACIÓN, 2018-2036 (MILES DE USD)
TABLA 152 POLINUCLEÓTIDOS/POLIDEOXIRRIBONUCLEÓTIDOS (PN/PDRN) DE LOS EAU EN EL MERCADO DE RELLENOS INYECTABLES ESTÉTICOS, POR APLICACIÓN, 2018-2036 (MILES DE USD)
TABLA 153 EMIRATOS ÁRABES UNIDOS EN EL MERCADO DE RELLENOS INYECTABLES ESTÉTICOS, POR APLICACIÓN, 2018-2036 (MILES DE USD)
TABLA 154 RELLENOS INYECTABLES ESTÉTICOS SINTÉTICOS EN EL MERCADO DE RELLENOS INYECTABLES ESTÉTICOS DE LOS EAU, POR TIPO, 2018-2036 (MILES DE USD)
TABLA 155 HIDROXILAPATITA DE CALCIO (CAHA) EN EL MERCADO DE RELLENOS INYECTABLES ESTÉTICOS DE LOS EAU, POR APLICACIÓN, 2018-2036 (MILES DE USD)
TABLA 156 ÁCIDO POLI-L-LÁCTICO (PLLA) EN EL MERCADO DE RELLENOS INYECTABLES ESTÉTICOS DE LOS EAU, POR APLICACIÓN, 2018-2036 (MILES DE USD)
TABLA 157 MICROESFERAS DE POLIMETILMETACRILATO (PMMA) EN EL MERCADO DE RELLENOS INYECTABLES ESTÉTICOS DE LOS EAU, POR APLICACIÓN, 2018-2036 (MILES DE USD)
TABLA 158 MERCADO DE RELLENOS INYECTABLES ESTÉTICOS DE LOS EAU, POR TIPO, 2018-2036 (MILES DE USD)
TABLA 159 MERCADO DE RELLENOS INYECTABLES ESTÉTICOS DE LOS EAU, POR TIPO, 2018-2036 (VOLUMEN EN MILES DE UNIDADES)
TABLA 160 MERCADO DE RELLENOS INYECTABLES ESTÉTICOS DE LOS EAU, POR TIPO, 2018-2036 (ASP EN USD/UNIDADES)
TABLA 161 RELLENOS INYECTABLES ESTÉTICOS BIODEGRADABLES EN EL MERCADO DE RELLENOS INYECTABLES ESTÉTICOS DE LOS EAU, POR TIPO, 2018-2036 (MILES DE USD)
TABLA 162 RELLENOS INYECTABLES ESTÉTICOS BIODEGRADABLES EN EL MERCADO DE RELLENOS INYECTABLES ESTÉTICOS DE LOS EAU, POR TIPO, 2018-2036 (VOLUMEN EN MILES DE UNIDADES)
TABLA 163 RELLENOS INYECTABLES ESTÉTICOS BIODEGRADABLES EN EL MERCADO DE RELLENOS INYECTABLES ESTÉTICOS DE LOS EAU, POR TIPO, 2018-2036 (ASP EN USD/UNIDADES)
TABLA 164 MERCADO DE RELLENOS INYECTABLES ESTÉTICOS DE LOS EAU, POR APLICACIÓN, 2018-2036 (MILES DE USD)
TABLA 165 CORRECCIÓN DE LÍNEAS FACIALES EN EL MERCADO DE RELLENOS INYECTABLES ESTÉTICOS DE LOS EAU, POR TIPO, 2018-2036 (MILES DE USD)
TABLA 166 CORRECCIÓN DE LÍNEAS FACIALES EN EL MERCADO DE RELLENOS INYECTABLES ESTÉTICOS DE LOS EAU, POR UBICACIÓN, 2018-2036 (MILES DE USD)
TABLA 167 CORRECCIÓN DE LÍNEAS FACIALES EN EL MERCADO DE RELLENOS INYECTABLES ESTÉTICOS DE LOS EAU, POR MARCA, 2018-2036 (MILES DE USD)
TABLA 168 MERCADO DE RELLENOS INYECTABLES ESTÉTICOS PARA EL MEJORAMIENTO DE LABIOS EN LOS EAU, POR TIPO, 2018-2036 (MILES DE USD)
TABLA 169 JUVÉDERM EN EL MERCADO DE RELLENOS INYECTABLES ESTÉTICOS DE LOS EAU, POR TIPO, 2018-2036 (MILES DE USD)
TABLA 170 RESTYLANE EN EL MERCADO DE RELLENOS INYECTABLES ESTÉTICOS DE LOS EAU, POR TIPO, 2018-2036 (MILES DE USD)
TABLA 171 RHA DE LOS EAU EN EL MERCADO DE RELLENOS INYECTABLES ESTÉTICOS, POR TIPO, 2018-2036 (MILES DE USD)
TABLA 172 ESTIRAMIENTO FACIAL EN EL MERCADO DE RELLENOS INYECTABLES ESTÉTICOS DE LOS EAU, POR TIPO, 2018-2036 (MILES DE USD)
TABLA 173 ESTIRAMIENTO FACIAL EN EL MERCADO DE RELLENOS INYECTABLES ESTÉTICOS DE LOS EAU, POR MARCA, 2018-2036 (MILES DE USD)
TABLA 174 RINOPLASTIA EN EL MERCADO DE RELLENOS INYECTABLES ESTÉTICOS DE LOS EAU, POR TIPO, 2018-2036 (MILES DE USD)
TABLA 175 JUVÉDERM EN EL MERCADO DE RELLENOS INYECTABLES ESTÉTICOS DE LOS EAU, POR TIPO, 2018-2036 (MILES DE USD)
TABLA 176 RESTYLANE EN EL MERCADO DE RELLENOS INYECTABLES ESTÉTICOS DE LOS EAU, POR TIPO, 2018-2036 (MILES DE USD)
TABLA 177 RHA DE LOS EAU EN EL MERCADO DE RELLENOS INYECTABLES ESTÉTICOS, POR TIPO, 2018-2036 (MILES DE USD)
TABLA 178 TRATAMIENTO DE CICATRICES EN EL MERCADO DE RELLENOS INYECTABLES ESTÉTICOS DE LOS EAU, POR TIPO, 2018-2036 (MILES DE USD)
TABLA 179 TRATAMIENTO DE CICATRICES EN EL MERCADO DE RELLENOS INYECTABLES ESTÉTICOS DE LOS EAU, POR MARCA, 2018-2036 (MILES DE USD)
TABLA 180. FLIDEZ DE LA PIEL EN EL MERCADO DE RELLENOS INYECTABLES ESTÉTICOS DE LOS EAU, POR TIPO, 2018-2036 (MILES DE USD)
TABLA 181 DEPRESIÓN DE MEJILLAS EN EL MERCADO DE RELLENOS INYECTABLES ESTÉTICOS DE LOS EAU, POR TIPO, 2018-2036 (MILES DE USD)
TABLA 182 MERCADO DE RELLENOS INYECTABLES ESTÉTICOS DE CIRUGÍA RECONSTRUCTIVA EN LOS EAU, POR TIPO, 2018-2036 (MILES DE USD)
TABLA 183 RESTAURACIÓN ESTÉTICA EN EL MERCADO DE RELLENOS INYECTABLES ESTÉTICOS DE LOS EAU, POR TIPO, 2018-2036 (MILES DE USD)
TABLA 184 JUVÉDERM EN EL MERCADO DE RELLENOS INYECTABLES ESTÉTICOS DE LOS EAU, POR TIPO, 2018-2036 (MILES DE USD)
TABLA 185 RESTYLANE EN EL MERCADO DE RELLENOS INYECTABLES ESTÉTICOS DE LOS EAU, POR TIPO, 2018-2036 (MILES DE USD)
TABLA 186 RHA DE LOS EAU EN EL MERCADO DE RELLENOS INYECTABLES ESTÉTICOS, POR TIPO, 2018-2036 (MILES DE USD)
TABLA 187 MERCADO DE RELLENOS INYECTABLES ESTÉTICOS EN ODONTOLOGÍA DE LOS EAU, POR TIPO, 2018-2036 (MILES DE USD)
TABLA 188 AUMENTO DE MENTÓN EN EL MERCADO DE RELLENOS INYECTABLES ESTÉTICOS DE LOS EAU, POR TIPO, 2018-2036 (MILES DE USD)
TABLA 189 TRATAMIENTO DE LIPOATROFIA EN EL MERCADO DE RELLENOS INYECTABLES ESTÉTICOS DE LOS EAU, POR TIPO, 2018-2036 (MILES DE USD)
TABLA 190 SUAVIZAMIENTO DE LA PIEL EN EL MERCADO DE RELLENOS INYECTABLES ESTÉTICOS DE LOS EAU, POR TIPO, 2018-2036 (MILES DE USD)
TABLA 191 REJUVENECIMIENTO DEL LÓBULO DE LA OREJA EN EL MERCADO DE RELLENOS INYECTABLES ESTÉTICOS DE LOS EAU, POR TIPO, 2018-2036 (MILES DE USD)
TABLA 192 MERCADO DE RELLENOS INYECTABLES ESTÉTICOS DE LOS EAU, POR TIPO DE MEDICAMENTO, 2018-2036 (MILES DE USD)
TABLA 193 MARCAS DE LOS EAU EN EL MERCADO DE RELLENOS INYECTABLES ESTÉTICOS, POR TIPO, 2018-2036 (MILES DE USD)
TABLA 194 MERCADO DE RELLENOS INYECTABLES ESTÉTICOS DE LOS EAU, POR USUARIO FINAL, 2018-2036 (MILES DE USD)
TABLA 195 MERCADO DE RELLENOS INYECTABLES ESTÉTICOS DE LOS EAU, POR CANAL DE DISTRIBUCIÓN, 2018-2036 (MILES DE USD)
TABLA 196 MERCADO DE RELLENOS INYECTABLES ESTÉTICOS DE ARABIA SAUDITA, POR TIPO DE PRODUCTO, 2018-2036 (MILES DE USD)
TABLA 197 MERCADO DE RELLENOS INYECTABLES ESTÉTICOS DE ARABIA SAUDITA, POR TIPO DE PRODUCTO, 2018-2036 (VOLUMEN EN MILES DE UNIDADES)
TABLA 198 MERCADO DE RELLENOS INYECTABLES ESTÉTICOS DE ARABIA SAUDITA, POR TIPO DE PRODUCTO, 2018-2036 (ASP EN USD/UNIDADES)
TABLA 199 RELLENOS INYECTABLES ESTÉTICOS NATURALES DE ARABIA SAUDITA EN EL MERCADO DE RELLENOS INYECTABLES ESTÉTICOS, POR TIPO, 2018-2036 (MILES DE USD)
TABLA 200 ÁCIDO HIALURÓNICO (AH) EN EL MERCADO DE RELLENOS INYECTABLES ESTÉTICOS DE ARABIA SAUDITA, POR TIPO, 2018-2036 (MILES DE USD)
TABLA 201 RELLENOS MONOFÁSICOS EN EL MERCADO DE RELLENOS INYECTABLES ESTÉTICOS DE ARABIA SAUDITA, POR TIPO, 2018-2036 (MILES DE USD)
TABLA 202 RELLENOS MONOFÁSICOS EN EL MERCADO DE RELLENOS INYECTABLES ESTÉTICOS DE ARABIA SAUDITA, POR APLICACIÓN, 2018-2036 (MILES DE USD)
TABLA 203 RELLENOS BIFÁSICOS EN EL MERCADO DE RELLENOS INYECTABLES ESTÉTICOS DE ARABIA SAUDITA, POR TIPO DE MATERIAL, 2018-2036 (MILES DE USD)
TABLA 204 RELLENOS BIFÁSICOS EN EL MERCADO DE RELLENOS INYECTABLES ESTÉTICOS DE ARABIA SAUDITA, POR APLICACIÓN, 2018-2036 (MILES DE USD)
TABLA 205 GRASA EN EL MERCADO DE RELLENOS INYECTABLES ESTÉTICOS DE ARABIA SAUDITA, POR APLICACIÓN, 2018-2036 (MILES DE USD)
TABLA 206 MERCADO DE COLÁGENO EN RELLENOS INYECTABLES ESTÉTICOS DE ARABIA SAUDITA, POR APLICACIÓN, 2018-2036 (MILES DE USD)
TABLA 207 POLINUCLEÓTIDOS/POLIDEOXIRRIBONUCLEÓTIDOS (PN/PDRN) DE ARABIA SAUDITA EN EL MERCADO DE RELLENOS INYECTABLES ESTÉTICOS, POR APLICACIÓN, 2018-2036 (MILES DE USD)
TABLA 208 ARABIA SAUDITA: OTROS MERCADOS DE RELLENOS INYECTABLES ESTÉTICOS, POR APLICACIÓN, 2018-2036 (MILES DE USD)
TABLA 209 RELLENOS INYECTABLES ESTÉTICOS SINTÉTICOS DE ARABIA SAUDITA EN EL MERCADO DE RELLENOS INYECTABLES ESTÉTICOS, POR TIPO, 2018-2036 (MILES DE USD)
TABLA 210 HIDROXILAPATITA DE CALCIO (CAHA) EN EL MERCADO DE RELLENOS INYECTABLES ESTÉTICOS DE ARABIA SAUDITA, POR APLICACIÓN, 2018-2036 (MILES DE USD)
TABLA 211 ÁCIDO POLI-L-LÁCTICO (PLLA) EN EL MERCADO DE RELLENOS INYECTABLES ESTÉTICOS DE ARABIA SAUDITA, POR APLICACIÓN, 2018-2036 (MILES DE USD)
TABLA 212 ARABIA SAUDITA MICROESFERAS DE POLIMETILMETACRILATO (PMMA) EN EL MERCADO DE RELLENOS INYECTABLES ESTÉTICOS, POR APLICACIÓN, 2018-2036 (MILES DE USD)
TABLA 213 MERCADO DE RELLENOS INYECTABLES ESTÉTICOS DE ARABIA SAUDITA, POR TIPO, 2018-2036 (MILES DE USD)
TABLA 214 MERCADO DE RELLENOS INYECTABLES ESTÉTICOS DE ARABIA SAUDITA, POR TIPO, 2018-2036 (VOLUMEN EN MILES DE UNIDADES)
TABLA 215 MERCADO DE RELLENOS INYECTABLES ESTÉTICOS DE ARABIA SAUDITA, POR TIPO, 2018-2036 (ASP EN USD/UNIDADES)
TABLA 216 RELLENOS INYECTABLES ESTÉTICOS BIODEGRADABLES EN EL MERCADO DE RELLENOS INYECTABLES ESTÉTICOS DE ARABIA SAUDITA, POR TIPO, 2018-2036 (MILES DE USD)
TABLA 217 RELLENOS INYECTABLES ESTÉTICOS BIODEGRADABLES EN EL MERCADO DE RELLENOS INYECTABLES ESTÉTICOS DE ARABIA SAUDITA, POR TIPO, 2018-2036 (VOLUMEN EN MILES DE UNIDADES)
TABLA 218 RELLENOS INYECTABLES ESTÉTICOS BIODEGRADABLES EN EL MERCADO DE RELLENOS INYECTABLES ESTÉTICOS DE ARABIA SAUDITA, POR TIPO, 2018-2036 (ASP EN USD/UNIDADES)
TABLA 219 MERCADO DE RELLENOS INYECTABLES ESTÉTICOS DE ARABIA SAUDITA, POR APLICACIÓN, 2018-2036 (MILES DE USD)
TABLA 220 CORRECCIÓN DE LÍNEAS FACIALES EN ARABIA SAUDITA EN EL MERCADO DE RELLENOS INYECTABLES ESTÉTICOS, POR TIPO, 2018-2036 (MILES DE USD)
TABLA 221 CORRECCIÓN DE LÍNEAS FACIALES EN ARABIA SAUDITA EN EL MERCADO DE RELLENOS INYECTABLES ESTÉTICOS, POR UBICACIÓN, 2018-2036 (MILES DE USD)
TABLA 222 CORRECCIÓN DE LÍNEAS FACIALES EN ARABIA SAUDITA EN EL MERCADO DE RELLENOS INYECTABLES ESTÉTICOS, POR MARCA, 2018-2036 (MILES DE USD)
TABLA 223 ARABIA SAUDITA MERCADO DE RELLENOS INYECTABLES ESTÉTICOS PARA EL MEJORAMIENTO DE LABIOS, POR TIPO, 2018-2036 (MILES DE USD)
TABLA 224 ARABIA SAUDITA JUVÉDERM EN EL MERCADO DE RELLENOS INYECTABLES ESTÉTICOS, POR TIPO, 2018-2036 (MILES DE USD)
TABLA 225 ARABIA SAUDITA RESTYLANE EN EL MERCADO DE RELLENOS INYECTABLES ESTÉTICOS, POR TIPO, 2018-2036 (MILES DE USD)
TABLA 226 ARABIA SAUDITA RHA EN EL MERCADO DE RELLENOS INYECTABLES ESTÉTICOS, POR TIPO, 2018-2036 (MILES DE USD)
TABLA 227 ARABIA SAUDITA: MERCADO DE RELLENOS INYECTABLES ESTÉTICOS, POR TIPO, 2018-2036 (MILES DE USD)
TABLA 228 ESTIRAMIENTO FACIAL EN ARABIA SAUDITA EN EL MERCADO DE RELLENOS INYECTABLES ESTÉTICOS, POR MARCA, 2018-2036 (MILES DE USD)
TABLA 229 ARABIA SAUDITA: MERCADO DE RINOPLASTIA EN RELLENOS INYECTABLES ESTÉTICOS, POR TIPO, 2018-2036 (MILES DE USD)
TABLA 230 ARABIA SAUDITA JUVÉDERM EN EL MERCADO DE RELLENOS INYECTABLES ESTÉTICOS, POR TIPO, 2018-2036 (MILES DE USD)
TABLA 231 ARABIA SAUDITA RESTYLANE EN EL MERCADO DE RELLENOS INYECTABLES ESTÉTICOS, POR TIPO, 2018-2036 (MILES DE USD)
TABLA 232 ARABIA SAUDITA RHA EN EL MERCADO DE RELLENOS INYECTABLES ESTÉTICOS, POR TIPO, 2018-2036 (MILES DE USD)
TABLA 233 TRATAMIENTO DE CICATRICES EN ARABIA SAUDITA EN EL MERCADO DE RELLENOS INYECTABLES ESTÉTICOS, POR TIPO, 2018-2036 (MILES DE USD)
TABLA 234 TRATAMIENTO DE CICATRICES EN ARABIA SAUDITA EN EL MERCADO DE RELLENOS INYECTABLES ESTÉTICOS, POR MARCA, 2018-2036 (MILES DE USD)
TABLA 235 ARABIA SAUDITA: FLAPEZ DE LA PIEL EN EL MERCADO DE RELLENOS INYECTABLES ESTÉTICOS, POR TIPO, 2018-2036 (MILES DE USD)
TABLA 236 ARABIA SAUDITA DEPRESIÓN DE MEJILLAS EN EL MERCADO DE RELLENOS INYECTABLES ESTÉTICOS, POR TIPO, 2018-2036 (MILES DE USD)
TABLA 237 ARABIA SAUDITA: MERCADO DE RELLENOS INYECTABLES DE CIRUGÍA RECONSTRUCTIVA, POR TIPO, 2018-2036 (MILES DE USD)
TABLA 238 RESTAURACIÓN ESTÉTICA EN ARABIA SAUDITA EN EL MERCADO DE RELLENOS INYECTABLES ESTÉTICOS, POR TIPO, 2018-2036 (MILES DE USD)
TABLA 239 ARABIA SAUDITA JUVÉDERM EN EL MERCADO DE RELLENOS INYECTABLES ESTÉTICOS, POR TIPO, 2018-2036 (MILES DE USD)
TABLA 240 ARABIA SAUDITA RESTYLANE EN EL MERCADO DE RELLENOS INYECTABLES ESTÉTICOS, POR TIPO, 2018-2036 (MILES DE USD)
TABLA 241 ARABIA SAUDITA RHA EN EL MERCADO DE RELLENOS INYECTABLES ESTÉTICOS, POR TIPO, 2018-2036 (MILES DE USD)
TABLA 242 ODONTOLOGÍA EN ARABIA SAUDITA: MERCADO DE RELLENOS INYECTABLES ESTÉTICOS, POR TIPO, 2018-2036 (MILES DE USD)
TABLA 243 ARABIA SAUDITA: MERCADO DE AUMENTO DE MENTÓN EN RELLENOS INYECTABLES ESTÉTICOS, POR TIPO, 2018-2036 (MILES DE USD)
TABLA 244 TRATAMIENTO DE LIPOATROFIA EN ARABIA SAUDITA EN EL MERCADO DE RELLENOS INYECTABLES ESTÉTICOS, POR TIPO, 2018-2036 (MILES DE USD)
TABLA 245 ARABIA SAUDITA: SUAVIZAMIENTO DE LA PIEL EN EL MERCADO DE RELLENOS INYECTABLES ESTÉTICOS, POR TIPO, 2018-2036 (MILES DE USD)
TABLA 246 REJUVENECIMIENTO DEL LÓBULO DE LA OREJA EN ARABIA SAUDITA EN EL MERCADO DE RELLENOS INYECTABLES ESTÉTICOS, POR TIPO, 2018-2036 (MILES DE USD)
TABLA 247 MERCADO DE RELLENOS INYECTABLES ESTÉTICOS DE ARABIA SAUDITA, POR TIPO DE MEDICAMENTO, 2018-2036 (MILES DE USD)
TABLA 248 ARABIA SAUDITA, MARCA EN EL MERCADO DE RELLENOS INYECTABLES ESTÉTICOS, POR TIPO, 2018-2036 (MILES DE USD)
TABLA 249 MERCADO DE RELLENOS INYECTABLES ESTÉTICOS DE ARABIA SAUDITA, POR USUARIO FINAL, 2018-2036 (MILES DE USD)
TABLA 250 MERCADO DE RELLENOS INYECTABLES ESTÉTICOS DE ARABIA SAUDITA, POR CANAL DE DISTRIBUCIÓN, 2018-2036 (MILES DE USD)
TABLA 251 MERCADO DE RELLENOS INYECTABLES ESTÉTICOS DE EGIPTO, POR TIPO DE PRODUCTO, 2018-2036 (MILES DE USD)
TABLA 252 MERCADO DE RELLENOS INYECTABLES ESTÉTICOS DE EGIPTO, POR TIPO DE PRODUCTO, 2018-2036 (VOLUMEN EN MILES DE UNIDADES)
TABLA 253 MERCADO DE RELLENOS INYECTABLES ESTÉTICOS DE EGIPTO, POR TIPO DE PRODUCTO, 2018-2036 (ASP EN USD/UNIDADES)
TABLA 254 RELLENOS INYECTABLES ESTÉTICOS NATURALES DE EGIPTO EN EL MERCADO DE RELLENOS INYECTABLES ESTÉTICOS, POR TIPO, 2018-2036 (MILES DE USD)
TABLA 255 ÁCIDO HIALURÓNICO (AH) EN EL MERCADO DE RELLENOS INYECTABLES ESTÉTICOS DE EGIPTO, POR TIPO, 2018-2036 (MILES DE USD)
TABLA 256 RELLENOS MONOFÁSICOS EN EL MERCADO DE RELLENOS INYECTABLES ESTÉTICOS DE EGIPTO, POR TIPO, 2018-2036 (MILES DE USD)
TABLA 257 RELLENOS MONOFÁSICOS EN EL MERCADO DE RELLENOS INYECTABLES ESTÉTICOS DE EGIPTO, POR APLICACIÓN, 2018-2036 (MILES DE USD)
TABLA 258 RELLENOS BIFÁSICOS EN EL MERCADO DE RELLENOS INYECTABLES ESTÉTICOS DE EGIPTO, POR TIPO DE MATERIAL, 2018-2036 (MILES DE USD)
TABLA 259 RELLENOS BIFÁSICOS EN EL MERCADO DE RELLENOS INYECTABLES ESTÉTICOS DE EGIPTO, POR APLICACIÓN, 2018-2036 (MILES DE USD)
TABLA 260 GRASA DE EGIPTO EN EL MERCADO DE RELLENOS INYECTABLES ESTÉTICOS, POR APLICACIÓN, 2018-2036 (MILES DE USD)
TABLA 261 COLÁGENO EN EL MERCADO DE RELLENOS INYECTABLES ESTÉTICOS DE EGIPTO, POR APLICACIÓN, 2018-2036 (MILES DE USD)
TABLA 262 POLINUCLEÓTIDOS/POLIDEOXIRRIBONUCLEÓTIDOS (PN/PDRN) DE EGIPTO EN EL MERCADO DE RELLENOS INYECTABLES ESTÉTICOS, POR APLICACIÓN, 2018-2036 (MILES DE USD)
TABLA 263 EGIPTO OTROS EN EL MERCADO DE RELLENOS INYECTABLES ESTÉTICOS, POR APLICACIÓN, 2018-2036 (MILES DE USD)
TABLA 264 RELLENOS INYECTABLES ESTÉTICOS SINTÉTICOS EN EL MERCADO DE RELLENOS INYECTABLES ESTÉTICOS DE EGIPTO, POR TIPO, 2018-2036 (MILES DE USD)
TABLA 265 HIDROXILAPATITA DE CALCIO (CAHA) EN EL MERCADO DE RELLENOS INYECTABLES ESTÉTICOS DE EGIPTO, POR APLICACIÓN, 2018-2036 (MILES DE USD)
TABLA 266 ÁCIDO POLI-L-LÁCTICO (PLLA) EN EL MERCADO DE RELLENOS INYECTABLES ESTÉTICOS DE EGIPTO, POR APLICACIÓN, 2018-2036 (MILES DE USD)
TABLA 267 MICROESFERAS DE POLIMETILMETACRILATO (PMMA) EN EL MERCADO DE RELLENOS INYECTABLES ESTÉTICOS DE EGIPTO, POR APLICACIÓN, 2018-2036 (MILES DE USD)
TABLA 268 MERCADO DE RELLENOS INYECTABLES ESTÉTICOS DE EGIPTO, POR TIPO, 2018-2036 (MILES DE USD)
TABLA 269 MERCADO DE RELLENOS INYECTABLES ESTÉTICOS DE EGIPTO, POR TIPO, 2018-2036 (VOLUMEN EN MILES DE UNIDADES)
TABLA 270 MERCADO DE RELLENOS INYECTABLES ESTÉTICOS DE EGIPTO, POR TIPO, 2018-2036 (ASP EN USD/UNIDADES)
TABLA 271 RELLENOS INYECTABLES ESTÉTICOS BIODEGRADABLES EN EL MERCADO DE RELLENOS INYECTABLES ESTÉTICOS DE EGIPTO, POR TIPO, 2018-2036 (MILES DE USD)
TABLA 272 RELLENOS INYECTABLES ESTÉTICOS BIODEGRADABLES EN EL MERCADO DE RELLENOS INYECTABLES ESTÉTICOS DE EGIPTO, POR TIPO, 2018-2036 (VOLUMEN EN MILES DE UNIDADES)
TABLA 273 RELLENOS INYECTABLES ESTÉTICOS BIODEGRADABLES EN EL MERCADO DE RELLENOS INYECTABLES ESTÉTICOS DE EGIPTO, POR TIPO, 2018-2036 (ASP EN USD/UNIDADES)
TABLA 274 MERCADO DE RELLENOS INYECTABLES ESTÉTICOS DE EGIPTO, POR APLICACIÓN, 2018-2036 (MILES DE USD)
TABLA 275 CORRECCIÓN DE LÍNEAS FACIALES EN EGIPTO EN EL MERCADO DE RELLENOS INYECTABLES ESTÉTICOS, POR TIPO, 2018-2036 (MILES DE USD)
TABLA 276 CORRECCIÓN DE LÍNEAS FACIALES EN EGIPTO EN EL MERCADO DE RELLENOS INYECTABLES ESTÉTICOS, POR UBICACIÓN, 2018-2036 (MILES DE USD)
TABLA 277 CORRECCIÓN DE LÍNEAS FACIALES EN EGIPTO EN EL MERCADO DE RELLENOS INYECTABLES ESTÉTICOS, POR MARCA, 2018-2036 (MILES DE USD)
TABLA 278 MERCADO DE RELLENOS INYECTABLES ESTÉTICOS PARA EL MEJORAMIENTO DE LABIOS EN EGIPTO, POR TIPO, 2018-2036 (MILES DE USD)
TABLA 279 EGIPTO JUVÉDERM EN EL MERCADO DE RELLENOS INYECTABLES ESTÉTICOS, POR TIPO, 2018-2036 (MILES DE USD)
TABLA 280 EGIPTO RESTYLANE EN EL MERCADO DE RELLENOS INYECTABLES ESTÉTICOS, POR TIPO, 2018-2036 (MILES DE USD)
TABLA 281 EGIPTO RHA EN EL MERCADO DE RELLENOS INYECTABLES ESTÉTICOS, POR TIPO, 2018-2036 (MILES DE USD)
TABLA 282 ESTIRAMIENTO FACIAL EN EGIPTO EN EL MERCADO DE RELLENOS INYECTABLES ESTÉTICOS, POR TIPO, 2018-2036 (MILES DE USD)
TABLA 283 ESTIRAMIENTO FACIAL EN EGIPTO EN EL MERCADO DE RELLENOS INYECTABLES ESTÉTICOS, POR MARCA, 2018-2036 (MILES DE USD)
TABLA 284 RINOPLASTIA EN EGIPTO EN EL MERCADO DE RELLENOS INYECTABLES ESTÉTICOS, POR TIPO, 2018-2036 (MILES DE USD)
TABLA 285 EGIPTO JUVÉDERM EN EL MERCADO DE RELLENOS INYECTABLES ESTÉTICOS, POR TIPO, 2018-2036 (MILES DE USD)
TABLA 286 EGIPTO RESTYLANE EN EL MERCADO DE RELLENOS INYECTABLES ESTÉTICOS, POR TIPO, 2018-2036 (MILES DE USD)
TABLA 287 EGIPTO RHA EN EL MERCADO DE RELLENOS INYECTABLES ESTÉTICOS, POR TIPO, 2018-2036 (MILES DE USD)
TABLA 288 TRATAMIENTO DE CICATRICES EN EGIPTO EN EL MERCADO DE RELLENOS INYECTABLES ESTÉTICOS, POR TIPO, 2018-2036 (MILES DE USD)
TABLA 289 TRATAMIENTO DE CICATRICES EN EGIPTO EN EL MERCADO DE RELLENOS INYECTABLES ESTÉTICOS, POR MARCA, 2018-2036 (MILES DE USD)
TABLA 290 EGIPTO: FLAPEZ DE LA PIEL EN EL MERCADO DE RELLENOS INYECTABLES ESTÉTICOS, POR TIPO, 2018-2036 (MILES DE USD)
TABLA 291 DEPRESIÓN DE MEJILLAS EN EGIPTO EN EL MERCADO DE RELLENOS INYECTABLES ESTÉTICOS, POR TIPO, 2018-2036 (MILES DE USD)
TABLA 292 CIRUGÍA RECONSTRUCTIVA EN EL MERCADO DE RELLENOS INYECTABLES ESTÉTICOS DE EGIPTO, POR TIPO, 2018-2036 (MILES DE USD)
TABLA 293 RESTAURACIÓN ESTÉTICA EN EGIPTO EN EL MERCADO DE RELLENOS INYECTABLES ESTÉTICOS, POR TIPO, 2018-2036 (MILES DE USD)
TABLA 294 EGIPTO JUVÉDERM EN EL MERCADO DE RELLENOS INYECTABLES ESTÉTICOS, POR TIPO, 2018-2036 (MILES DE USD)
TABLA 295 EGIPTO RESTYLANE EN EL MERCADO DE RELLENOS INYECTABLES ESTÉTICOS, POR TIPO, 2018-2036 (MILES DE USD)
TABLA 296 EGIPTO RHA EN EL MERCADO DE RELLENOS INYECTABLES ESTÉTICOS, POR TIPO, 2018-2036 (MILES DE USD)
TABLA 297 ODONTOLOGÍA EGIPCIA EN EL MERCADO DE RELLENOS INYECTABLES ESTÉTICOS, POR TIPO, 2018-2036 (MILES DE USD)
TABLA 298 AUMENTO DE MENTÓN EN EL MERCADO DE RELLENOS INYECTABLES ESTÉTICOS EN EGIPTO, POR TIPO, 2018-2036 (MILES DE USD)
TABLA 299 TRATAMIENTO DE LIPOATROFIA EN EGIPTO EN EL MERCADO DE RELLENOS INYECTABLES ESTÉTICOS, POR TIPO, 2018-2036 (MILES DE USD)
TABLA 300 EGIPTO: SUAVIZAMIENTO DE LA PIEL EN EL MERCADO DE RELLENOS INYECTABLES ESTÉTICOS, POR TIPO, 2018-2036 (MILES DE USD)
TABLA 301 REJUVENECIMIENTO DEL LÓBULO DE LA OREJA EN EGIPTO EN EL MERCADO DE RELLENOS INYECTABLES ESTÉTICOS, POR TIPO, 2018-2036 (MILES DE USD)
TABLA 302 MERCADO DE RELLENOS INYECTABLES ESTÉTICOS DE EGIPTO, POR TIPO DE MEDICAMENTO, 2018-2036 (MILES DE USD)
TABLA 303 RELLENOS INYECTABLES ESTÉTICOS DE MARCA EGIPTO, POR TIPO, 2018-2036 (MILES DE USD)
TABLA 304 MERCADO DE RELLENOS INYECTABLES ESTÉTICOS DE EGIPTO, POR USUARIO FINAL, 2018-2036 (MILES DE USD)
TABLA 305 MERCADO DE RELLENOS INYECTABLES ESTÉTICOS DE EGIPTO, POR CANAL DE DISTRIBUCIÓN, 2018-2036 (MILES DE USD)
TABLA 306 MERCADO DE RELLENOS INYECTABLES ESTÉTICOS DE ISRAEL, POR TIPO DE PRODUCTO, 2018-2036 (MILES DE USD)
TABLA 307 MERCADO DE RELLENOS INYECTABLES ESTÉTICOS DE ISRAEL, POR TIPO DE PRODUCTO, 2018-2036 (VOLUMEN EN MILES DE UNIDADES)
TABLA 308 MERCADO DE RELLENOS INYECTABLES ESTÉTICOS DE ISRAEL, POR TIPO DE PRODUCTO, 2018-2036 (ASP EN USD/UNIDADES)
TABLA 309 RELLENOS INYECTABLES ESTÉTICOS NATURALES DE ISRAEL EN EL MERCADO DE RELLENOS INYECTABLES ESTÉTICOS, POR TIPO, 2018-2036 (MILES DE USD)
TABLA 310 ÁCIDO HIALURÓNICO (AH) EN EL MERCADO DE RELLENOS INYECTABLES ESTÉTICOS DE ISRAEL, POR TIPO, 2018-2036 (MILES DE USD)
TABLA 311 RELLENOS MONOFÁSICOS DE ISRAEL EN EL MERCADO DE RELLENOS INYECTABLES ESTÉTICOS, POR TIPO, 2018-2036 (MILES DE USD)
TABLA 312 RELLENOS MONOFÁSICOS DE ISRAEL EN EL MERCADO DE RELLENOS INYECTABLES ESTÉTICOS, POR APLICACIÓN, 2018-2036 (MILES DE USD)
TABLA 313 RELLENOS BIFÁSICOS DE ISRAEL EN EL MERCADO DE RELLENOS INYECTABLES ESTÉTICOS, POR TIPO DE MATERIAL, 2018-2036 (MILES DE USD)
TABLA 314 RELLENOS BIFÁSICOS DE ISRAEL EN EL MERCADO DE RELLENOS INYECTABLES ESTÉTICOS, POR APLICACIÓN, 2018-2036 (MILES DE USD)
TABLA 315 GRASA ISRAELÍ EN EL MERCADO DE RELLENOS INYECTABLES ESTÉTICOS, POR APLICACIÓN, 2018-2036 (MILES DE USD)
TABLA 316 COLÁGENO EN EL MERCADO DE RELLENOS INYECTABLES ESTÉTICOS DE ISRAEL, POR APLICACIÓN, 2018-2036 (MILES DE USD)
TABLA 317 POLINUCLEÓTIDOS/POLIDEOXIRRIBONUCLEÓTIDOS (PN/PDRN) DE ISRAEL EN EL MERCADO DE RELLENOS INYECTABLES ESTÉTICOS, POR APLICACIÓN, 2018-2036 (MILES DE USD)
TABLA 318 ISRAEL OTROS EN EL MERCADO DE RELLENOS INYECTABLES ESTÉTICOS, POR APLICACIÓN, 2018-2036 (MILES DE USD)
TABLA 319 RELLENOS INYECTABLES ESTÉTICOS SINTÉTICOS DE ISRAEL EN EL MERCADO DE RELLENOS INYECTABLES ESTÉTICOS, POR TIPO, 2018-2036 (MILES DE USD)
TABLA 320 HIDROXILAPATITA DE CALCIO (CAHA) DE ISRAEL EN EL MERCADO DE RELLENOS INYECTABLES ESTÉTICOS, POR APLICACIÓN, 2018-2036 (MILES DE USD)
TABLA 321 ÁCIDO POLI-L-LÁCTICO (PLLA) EN EL MERCADO DE RELLENOS INYECTABLES ESTÉTICOS DE ISRAEL, POR APLICACIÓN, 2018-2036 (MILES DE USD)
TABLA 322 MICROESFERAS DE POLIMETILMETACRILATO (PMMA) EN EL MERCADO DE RELLENOS INYECTABLES ESTÉTICOS DE ISRAEL, POR APLICACIÓN, 2018-2036 (MILES DE USD)
TABLA 323 MERCADO DE RELLENOS INYECTABLES ESTÉTICOS DE ISRAEL, POR TIPO, 2018-2036 (MILES DE USD)
TABLA 324 MERCADO DE RELLENOS INYECTABLES ESTÉTICOS DE ISRAEL, POR TIPO, 2018-2036 (VOLUMEN EN MILES DE UNIDADES)
TABLA 325 MERCADO DE RELLENOS INYECTABLES ESTÉTICOS DE ISRAEL, POR TIPO, 2018-2036 (ASP EN USD/UNIDADES)
TABLA 326 RELLENOS INYECTABLES ESTÉTICOS BIODEGRADABLES DE ISRAEL EN EL MERCADO DE RELLENOS INYECTABLES ESTÉTICOS, POR TIPO, 2018-2036 (MILES DE USD)
TABLA 327 RELLENOS INYECTABLES ESTÉTICOS BIODEGRADABLES EN EL MERCADO DE RELLENOS INYECTABLES ESTÉTICOS DE ISRAEL, POR TIPO, 2018-2036 (VOLUMEN EN MILES DE UNIDADES)
TABLA 328 RELLENOS INYECTABLES ESTÉTICOS BIODEGRADABLES EN EL MERCADO DE RELLENOS INYECTABLES ESTÉTICOS DE ISRAEL, POR TIPO, 2018-2036 (ASP EN USD/UNIDADES)
TABLA 329 MERCADO DE RELLENOS INYECTABLES ESTÉTICOS DE ISRAEL, POR APLICACIÓN, 2018-2036 (MILES DE USD)
TABLA 330 CORRECCIÓN DE LÍNEAS FACIALES EN EL MERCADO DE RELLENOS INYECTABLES ESTÉTICOS DE ISRAEL, POR TIPO, 2018-2036 (MILES DE USD)
TABLA 331 CORRECCIÓN DE LÍNEAS FACIALES EN EL MERCADO DE RELLENOS INYECTABLES ESTÉTICOS DE ISRAEL, POR UBICACIÓN, 2018-2036 (MILES DE USD)
TABLA 332 CORRECCIÓN DE LÍNEAS FACIALES EN EL MERCADO DE RELLENOS INYECTABLES ESTÉTICOS DE ISRAEL, POR MARCA, 2018-2036 (MILES DE USD)
TABLA 333 MERCADO DE RELLENOS INYECTABLES ESTÉTICOS PARA EL AUMENTO DE LABIOS EN ISRAEL, POR TIPO, 2018-2036 (MILES DE USD)
TABLA 334 ISRAEL JUVÉDERM EN EL MERCADO DE RELLENOS INYECTABLES ESTÉTICOS, POR TIPO, 2018-2036 (MILES DE USD)
TABLA 335 ISRAEL RESTYLANE EN EL MERCADO DE RELLENOS INYECTABLES ESTÉTICOS, POR TIPO, 2018-2036 (MILES DE USD)
TABLA 336 ISRAEL RHA EN EL MERCADO DE RELLENOS INYECTABLES ESTÉTICOS, POR TIPO, 2018-2036 (MILES DE USD)
TABLA 337 ESTIRAMIENTO FACIAL EN EL MERCADO DE RELLENOS INYECTABLES ESTÉTICOS DE ISRAEL, POR TIPO, 2018-2036 (MILES DE USD)
TABLA 338 ESTIRAMIENTO FACIAL EN ISRAEL EN EL MERCADO DE RELLENOS INYECTABLES ESTÉTICOS, POR MARCA, 2018-2036 (MILES DE USD)
TABLA 339 RINOPLASTIA EN EL MERCADO DE RELLENOS INYECTABLES ESTÉTICOS DE ISRAEL, POR TIPO, 2018-2036 (MILES DE USD)
TABLA 340 ISRAEL JUVÉDERM EN EL MERCADO DE RELLENOS INYECTABLES ESTÉTICOS, POR TIPO, 2018-2036 (MILES DE USD)
TABLA 341 ISRAEL RESTYLANE EN EL MERCADO DE RELLENOS INYECTABLES ESTÉTICOS, POR TIPO, 2018-2036 (MILES DE USD)
TABLA 342 ISRAEL RHA EN EL MERCADO DE RELLENOS INYECTABLES ESTÉTICOS, POR TIPO, 2018-2036 (MILES DE USD)
TABLA 343 TRATAMIENTO DE CICATRICES EN EL MERCADO DE RELLENOS INYECTABLES ESTÉTICOS DE ISRAEL, POR TIPO, 2018-2036 (MILES DE USD)
TABLA 344 TRATAMIENTO DE CICATRICES EN EL MERCADO DE RELLENOS INYECTABLES ESTÉTICOS DE ISRAEL, POR MARCA, 2018-2036 (MILES DE USD)
TABLA 345 FLIDEZ DE LA PIEL EN EL MERCADO DE RELLENOS INYECTABLES ESTÉTICOS DE ISRAEL, POR TIPO, 2018-2036 (MILES DE USD)
TABLA 346 DEPRESIÓN DE MEJILLAS EN EL MERCADO DE RELLENOS INYECTABLES ESTÉTICOS DE ISRAEL, POR TIPO, 2018-2036 (MILES DE USD)
TABLA 347 CIRUGÍA RECONSTRUCTIVA EN EL MERCADO DE RELLENOS INYECTABLES ESTÉTICOS DE ISRAEL, POR TIPO, 2018-2036 (MILES DE USD)
TABLA 348 RESTAURACIÓN ESTÉTICA EN EL MERCADO DE RELLENOS INYECTABLES ESTÉTICOS DE ISRAEL, POR TIPO, 2018-2036 (MILES DE USD)
TABLA 349 ISRAEL JUVÉDERM EN EL MERCADO DE RELLENOS INYECTABLES ESTÉTICOS, POR TIPO, 2018-2036 (MILES DE USD)
TABLA 350 ISRAEL RESTYLANE EN EL MERCADO DE RELLENOS INYECTABLES ESTÉTICOS, POR TIPO, 2018-2036 (MILES DE USD)
TABLA 351 ISRAEL RHA EN EL MERCADO DE RELLENOS INYECTABLES ESTÉTICOS, POR TIPO, 2018-2036 (MILES DE USD)
TABLA 352 ODONTOLOGÍA ISRAELÍ EN EL MERCADO DE RELLENOS INYECTABLES ESTÉTICOS, POR TIPO, 2018-2036 (MILES DE USD)
TABLA 353 AUMENTO DE MENTÓN EN EL MERCADO DE RELLENOS INYECTABLES ESTÉTICOS DE ISRAEL, POR TIPO, 2018-2036 (MILES DE USD)
TABLA 354 TRATAMIENTO DE LIPOATROFIA EN EL MERCADO DE RELLENOS INYECTABLES ESTÉTICOS DE ISRAEL, POR TIPO, 2018-2036 (MILES DE USD)
TABLA 355 SUAVIZAMIENTO DE LA PIEL EN EL MERCADO DE RELLENOS INYECTABLES ESTÉTICOS DE ISRAEL, POR TIPO, 2018-2036 (MILES DE USD)
TABLA 356 REJUVENECIMIENTO DEL LÓBULO DE LA OREJA EN EL MERCADO DE RELLENOS INYECTABLES ESTÉTICOS DE ISRAEL, POR TIPO, 2018-2036 (MILES DE USD)
TABLA 357 MERCADO DE RELLENOS INYECTABLES ESTÉTICOS DE ISRAEL, POR TIPO DE MEDICAMENTO, 2018-2036 (MILES DE USD)
TABLA 358. ISRAEL MARCADO EN EL MERCADO DE RELLENOS INYECTABLES ESTÉTICOS, POR TIPO, 2018-2036 (MILES DE USD)
TABLA 359 MERCADO DE RELLENOS INYECTABLES ESTÉTICOS DE ISRAEL, POR USUARIO FINAL, 2018-2036 (MILES DE USD)
TABLA 360 MERCADO DE RELLENOS INYECTABLES ESTÉTICOS DE ISRAEL, POR CANAL DE DISTRIBUCIÓN, 2018-2036 (MILES DE USD)
TABLA 361 MERCADO DE RELLENOS INYECTABLES ESTÉTICOS DE BAHREIN, POR TIPO DE PRODUCTO, 2018-2036 (MILES DE USD)
TABLA 362 MERCADO DE RELLENOS INYECTABLES ESTÉTICOS DE BAHREIN, POR TIPO DE PRODUCTO, 2018-2036 (VOLUMEN EN MILES DE UNIDADES)
TABLA 363 MERCADO DE RELLENOS INYECTABLES ESTÉTICOS DE BAHREIN, POR TIPO DE PRODUCTO, 2018-2036 (ASP EN USD/UNIDADES)
TABLA 364 RELLENOS INYECTABLES ESTÉTICOS NATURALES DE BAHREIN EN EL MERCADO DE RELLENOS INYECTABLES ESTÉTICOS, POR TIPO, 2018-2036 (MILES DE USD)
TABLA 365 ÁCIDO HIALURÓNICO (AH) EN EL MERCADO DE RELLENOS INYECTABLES ESTÉTICOS DE BAHREIN, POR TIPO, 2018-2036 (MILES DE USD)
TABLA 366 RELLENOS MONOFÁSICOS EN EL MERCADO DE RELLENOS INYECTABLES ESTÉTICOS DE BAHREIN, POR TIPO, 2018-2036 (MILES DE USD)
TABLA 367 RELLENOS MONOFÁSICOS DE BAHREIN EN EL MERCADO DE RELLENOS INYECTABLES ESTÉTICOS, POR APLICACIÓN, 2018-2036 (MILES DE USD)
TABLA 368 RELLENOS BIFÁSICOS DE BAHREIN EN EL MERCADO DE RELLENOS INYECTABLES ESTÉTICOS, POR TIPO DE MATERIAL, 2018-2036 (MILES DE USD)
TABLA 369 RELLENOS BIFÁSICOS DE BAHREIN EN EL MERCADO DE RELLENOS INYECTABLES ESTÉTICOS, POR APLICACIÓN, 2018-2036 (MILES DE USD)
TABLA 370 GRASA DE BAHREIN EN EL MERCADO DE RELLENOS INYECTABLES ESTÉTICOS, POR APLICACIÓN, 2018-2036 (MILES DE USD)
TABLA 371 COLÁGENO EN EL MERCADO DE RELLENOS INYECTABLES ESTÉTICOS DE BAHREIN, POR APLICACIÓN, 2018-2036 (MILES DE USD)
TABLA 372 POLINUCLEÓTIDOS/POLIDEOXIRRIBONUCLEÓTIDOS (PN/PDRN) DE BAHREIN EN EL MERCADO DE RELLENOS INYECTABLES ESTÉTICOS, POR APLICACIÓN, 2018-2036 (MILES DE USD)
TABLA 373 BARÉIN OTROS MERCADOS DE RELLENOS INYECTABLES ESTÉTICOS, POR APLICACIÓN, 2018-2036 (MILES DE USD)
TABLA 374 RELLENOS INYECTABLES ESTÉTICOS SINTÉTICOS DE BAHREIN EN EL MERCADO DE RELLENOS INYECTABLES ESTÉTICOS, POR TIPO, 2018-2036 (MILES DE USD)
TABLA 375 HIDROXILAPATITA DE CALCIO (CAHA) DE BAHREIN EN EL MERCADO DE RELLENOS INYECTABLES ESTÉTICOS, POR APLICACIÓN, 2018-2036 (MILES DE USD)
TABLA 376 ÁCIDO POLI-L-LÁCTICO (PLLA) DE BAHREIN EN EL MERCADO DE RELLENOS INYECTABLES ESTÉTICOS, POR APLICACIÓN, 2018-2036 (MILES DE USD)
TABLA 377 MICROESFERAS DE POLIMETILMETACRILATO (PMMA) EN EL MERCADO DE RELLENOS INYECTABLES ESTÉTICOS DE BAHREIN, POR APLICACIÓN, 2018-2036 (MILES DE USD)
TABLA 378 MERCADO DE RELLENOS INYECTABLES ESTÉTICOS DE BAHREIN, POR TIPO, 2018-2036 (MILES DE USD)
TABLA 379 MERCADO DE RELLENOS INYECTABLES ESTÉTICOS DE BAHREIN, POR TIPO, 2018-2036 (VOLUMEN EN MILES DE UNIDADES)
TABLA 380 MERCADO DE RELLENOS INYECTABLES ESTÉTICOS DE BAHREIN, POR TIPO, 2018-2036 (ASP EN USD/UNIDADES)
TABLA 381 RELLENOS INYECTABLES ESTÉTICOS BIODEGRADABLES EN EL MERCADO DE RELLENOS INYECTABLES ESTÉTICOS DE BAHREIN, POR TIPO, 2018-2036 (MILES DE USD)
TABLA 382 RELLENOS INYECTABLES ESTÉTICOS BIODEGRADABLES EN EL MERCADO DE RELLENOS INYECTABLES ESTÉTICOS DE BAHREIN, POR TIPO, 2018-2036 (VOLUMEN EN MILES DE UNIDADES)
TABLA 383 RELLENOS INYECTABLES ESTÉTICOS BIODEGRADABLES EN EL MERCADO DE RELLENOS INYECTABLES ESTÉTICOS DE BAHREIN, POR TIPO, 2018-2036 (ASP EN USD/UNIDADES)
TABLA 384 MERCADO DE RELLENOS INYECTABLES ESTÉTICOS DE BAHREIN, POR APLICACIÓN, 2018-2036 (MILES DE USD)
TABLA 385 CORRECCIÓN DE LÍNEAS FACIALES EN EL MERCADO DE RELLENOS INYECTABLES ESTÉTICOS DE BAHREIN, POR TIPO, 2018-2036 (MILES DE USD)
TABLA 386 CORRECCIÓN DE LÍNEAS FACIALES EN EL MERCADO DE RELLENOS INYECTABLES ESTÉTICOS DE BAHREIN, POR UBICACIÓN, 2018-2036 (MILES DE USD)
TABLA 387 CORRECCIÓN DE LÍNEAS FACIALES EN EL MERCADO DE RELLENOS INYECTABLES ESTÉTICOS DE BAHREIN, POR MARCA, 2018-2036 (MILES DE USD)
TABLA 388 MERCADO DE RELLENOS INYECTABLES ESTÉTICOS PARA EL MEJORAMIENTO DE LABIOS EN BAHREIN, POR TIPO, 2018-2036 (MILES DE USD)
TABLA 389 JUVÉDERM EN EL MERCADO DE RELLENOS INYECTABLES ESTÉTICOS DE BAHREIN, POR TIPO, 2018-2036 (MILES DE USD)
TABLA 390 BARÉIN RESTYLANE EN EL MERCADO DE RELLENOS INYECTABLES ESTÉTICOS, POR TIPO, 2018-2036 (MILES DE USD)
TABLA 391 RHA DE BAHREIN EN EL MERCADO DE RELLENOS INYECTABLES ESTÉTICOS, POR TIPO, 2018-2036 (MILES DE USD)
TABLA 392 ESTIRAMIENTO FACIAL EN EL MERCADO DE RELLENOS INYECTABLES ESTÉTICOS DE BAHREIN, POR TIPO, 2018-2036 (MILES DE USD)
TABLA 393 ESTIRAMIENTO FACIAL EN EL MERCADO DE RELLENOS INYECTABLES ESTÉTICOS DE BAHREIN, POR MARCA, 2018-2036 (MILES DE USD)
TABLA 394 RINOPLASTIA EN EL MERCADO DE RELLENOS INYECTABLES ESTÉTICOS DE BAHREIN, POR TIPO, 2018-2036 (MILES DE USD)
TABLA 395 JUVÉDERM EN EL MERCADO DE RELLENOS INYECTABLES ESTÉTICOS DE BAHREIN, POR TIPO, 2018-2036 (MILES DE USD)
TABLA 396 BARÉIN RESTYLANE EN EL MERCADO DE RELLENOS INYECTABLES ESTÉTICOS, POR TIPO, 2018-2036 (MILES DE USD)
TABLA 397 RHA DE BAHREIN EN EL MERCADO DE RELLENOS INYECTABLES ESTÉTICOS, POR TIPO, 2018-2036 (MILES DE USD)
TABLA 398 TRATAMIENTO DE CICATRICES EN EL MERCADO DE RELLENOS INYECTABLES ESTÉTICOS DE BAHREIN, POR TIPO, 2018-2036 (MILES DE USD)
TABLA 399 TRATAMIENTO DE CICATRICES EN EL MERCADO DE RELLENOS INYECTABLES ESTÉTICOS DE BAHREIN, POR MARCA, 2018-2036 (MILES DE USD)
TABLA 400. FLIDEZ DE LA PIEL EN EL MERCADO DE RELLENOS INYECTABLES ESTÉTICOS DE BAHREIN, POR TIPO, 2018-2036 (MILES DE USD)
TABLA 401 DEPRESIÓN DE MEJILLAS EN EL MERCADO DE RELLENOS INYECTABLES ESTÉTICOS DE BAHREIN, POR TIPO, 2018-2036 (MILES DE USD)
TABLA 402 CIRUGÍA RECONSTRUCTIVA EN EL MERCADO DE RELLENOS INYECTABLES ESTÉTICOS DE BAHREIN, POR TIPO, 2018-2036 (MILES DE USD)
TABLA 403 RESTAURACIÓN ESTÉTICA EN EL MERCADO DE RELLENOS INYECTABLES ESTÉTICOS DE BAHREIN, POR TIPO, 2018-2036 (MILES DE USD)
TABLA 404. BAHRÉIN: JUVÉDERM EN EL MERCADO DE RELLENOS INYECTABLES ESTÉTICOS, POR TIPO, 2018-2036 (MILES DE USD)
TABLA 405 BARÉIN RESTYLANE EN EL MERCADO DE RELLENOS INYECTABLES ESTÉTICOS, POR TIPO, 2018-2036 (MILES DE USD)
TABLA 406 RHA DE BAHREIN EN EL MERCADO DE RELLENOS INYECTABLES ESTÉTICOS, POR TIPO, 2018-2036 (MILES DE USD)
TABLA 407 MERCADO DE RELLENOS INYECTABLES ESTÉTICOS EN ODONTOLOGÍA DE BAHREIN, POR TIPO, 2018-2036 (MILES DE USD)
TABLA 408 AUMENTO DE MENTÓN EN EL MERCADO DE RELLENOS INYECTABLES ESTÉTICOS DE BAHREIN, POR TIPO, 2018-2036 (MILES DE USD)
TABLA 409 TRATAMIENTO DE LIPOATROFIA EN EL MERCADO DE RELLENOS INYECTABLES ESTÉTICOS DE BAHREIN, POR TIPO, 2018-2036 (MILES DE USD)
TABLA 410 SUAVIZAMIENTO DE LA PIEL EN EL MERCADO DE RELLENOS INYECTABLES ESTÉTICOS DE BAHREIN, POR TIPO, 2018-2036 (MILES DE USD)
TABLA 411 REJUVENECIMIENTO DEL LÓBULO DE LA OREJA EN EL MERCADO DE RELLENOS INYECTABLES ESTÉTICOS DE BAHREIN, POR TIPO, 2018-2036 (MILES DE USD)
TABLA 412 MERCADO DE RELLENOS INYECTABLES ESTÉTICOS DE BAHREIN, POR TIPO DE MEDICAMENTO, 2018-2036 (MILES DE USD)
TABLA 413 MARCAS DE BAHREIN EN EL MERCADO DE RELLENOS INYECTABLES ESTÉTICOS, POR TIPO, 2018-2036 (MILES DE USD)
TABLA 414 MERCADO DE RELLENOS INYECTABLES ESTÉTICOS DE BAHREIN, POR USUARIO FINAL, 2018-2036 (MILES DE USD)
TABLA 415 MERCADO DE RELLENOS INYECTABLES ESTÉTICOS DE BAHREIN, POR CANAL DE DISTRIBUCIÓN, 2018-2036 (MILES DE USD)
TABLA 416 MERCADO DE RELLENOS INYECTABLES ESTÉTICOS DE TURQUÍA, POR TIPO DE PRODUCTO, 2018-2036 (MILES DE USD)
TABLA 417 MERCADO DE RELLENOS INYECTABLES ESTÉTICOS DE TURQUÍA, POR TIPO DE PRODUCTO, 2018-2036 (VOLUMEN EN MILES DE UNIDADES)
TABLA 418 MERCADO DE RELLENOS INYECTABLES ESTÉTICOS DE TURQUÍA, POR TIPO DE PRODUCTO, 2018-2036 (ASP EN USD/UNIDADES)
TABLA 419 RELLENOS INYECTABLES ESTÉTICOS NATURALES DE TURQUÍA EN EL MERCADO DE RELLENOS INYECTABLES ESTÉTICOS, POR TIPO, 2018-2036 (MILES DE USD)
TABLA 420 ÁCIDO HIALURÓNICO (AH) DE TURQUÍA EN EL MERCADO DE RELLENOS INYECTABLES ESTÉTICOS, POR TIPO, 2018-2036 (MILES DE USD)
TABLA 421 RELLENOS MONOFÁSICOS DE TURQUÍA EN EL MERCADO DE RELLENOS INYECTABLES ESTÉTICOS, POR TIPO, 2018-2036 (MILES DE USD)
TABLA 422 RELLENOS MONOFÁSICOS DE TURQUÍA EN EL MERCADO DE RELLENOS INYECTABLES ESTÉTICOS, POR APLICACIÓN, 2018-2036 (MILES DE USD)
TABLA 423 RELLENOS BIFÁSICOS DE TURQUÍA EN EL MERCADO DE RELLENOS INYECTABLES ESTÉTICOS, POR TIPO DE MATERIAL, 2018-2036 (MILES DE USD)
TABLA 424 RELLENOS BIFÁSICOS DE TURQUÍA EN EL MERCADO DE RELLENOS INYECTABLES ESTÉTICOS, POR APLICACIÓN, 2018-2036 (MILES DE USD)
TABLA 425 GRASA DE PAVO EN EL MERCADO DE RELLENOS INYECTABLES ESTÉTICOS, POR APLICACIÓN, 2018-2036 (MILES DE USD)
TABLA 426 COLÁGENO DE TURQUÍA EN EL MERCADO DE RELLENOS INYECTABLES ESTÉTICOS, POR APLICACIÓN, 2018-2036 (MILES DE USD)
TABLA 427 POLINUCLEÓTIDOS/POLIDEOXIRRIBONUCLEÓTIDOS (PN/PDRN) DE TURQUÍA EN EL MERCADO DE RELLENOS INYECTABLES ESTÉTICOS, POR APLICACIÓN, 2018-2036 (MILES DE USD)
TABLA 428 OTROS RELLENOS INYECTABLES ESTÉTICOS EN EL MERCADO DE TURQUÍA, POR APLICACIÓN, 2018-2036 (MILES DE USD)
TABLA 429 RELLENOS INYECTABLES ESTÉTICOS SINTÉTICOS DE TURQUÍA EN EL MERCADO DE RELLENOS INYECTABLES ESTÉTICOS, POR TIPO, 2018-2036 (MILES DE USD)
TABLA 430 HIDROXILAPATITA DE CALCIO (CAHA) DE TURQUÍA EN EL MERCADO DE RELLENOS INYECTABLES ESTÉTICOS, POR APLICACIÓN, 2018-2036 (MILES DE USD)
TABLA 431 ÁCIDO POLI-L-LÁCTICO (PLLA) DE TURQUÍA EN EL MERCADO DE RELLENOS INYECTABLES ESTÉTICOS, POR APLICACIÓN, 2018-2036 (MILES DE USD)
TABLA 432 MICROESFERAS DE POLIMETILMETACRILATO (PMMA) EN EL MERCADO DE RELLENOS INYECTABLES ESTÉTICOS DE TURQUÍA, POR APLICACIÓN, 2018-2036 (MILES DE USD)
TABLA 433 MERCADO DE RELLENOS INYECTABLES ESTÉTICOS DE TURQUÍA, POR TIPO, 2018-2036 (MILES DE USD)
TABLA 434 MERCADO DE RELLENOS INYECTABLES ESTÉTICOS DE TURQUÍA, POR TIPO, 2018-2036 (VOLUMEN EN MILES DE UNIDADES)
TABLA 435 MERCADO DE RELLENOS INYECTABLES ESTÉTICOS DE TURQUÍA, POR TIPO, 2018-2036 (ASP EN USD/UNIDADES)
TABLA 436 RELLENOS INYECTABLES ESTÉTICOS BIODEGRADABLES DE TURQUÍA EN EL MERCADO DE RELLENOS INYECTABLES ESTÉTICOS, POR TIPO, 2018-2036 (MILES DE USD)
TABLA 437 RELLENOS INYECTABLES ESTÉTICOS BIODEGRADABLES EN EL MERCADO DE RELLENOS INYECTABLES ESTÉTICOS DE TURQUÍA, POR TIPO, 2018-2036 (VOLUMEN EN MILES DE UNIDADES)
TABLA 438 RELLENOS INYECTABLES ESTÉTICOS BIODEGRADABLES EN EL MERCADO DE RELLENOS INYECTABLES ESTÉTICOS DE TURQUÍA, POR TIPO, 2018-2036 (ASP EN USD/UNIDADES)
TABLA 439 MERCADO DE RELLENOS INYECTABLES ESTÉTICOS DE TURQUÍA, POR APLICACIÓN, 2018-2036 (MILES DE USD)
TABLA 440 CORRECCIÓN DE LÍNEAS FACIALES EN EL MERCADO DE RELLENOS INYECTABLES ESTÉTICOS DE TURQUÍA, POR TIPO, 2018-2036 (MILES DE USD)
TABLA 441 CORRECCIÓN DE LÍNEAS FACIALES EN EL MERCADO DE RELLENOS INYECTABLES ESTÉTICOS DE TURQUÍA, POR UBICACIÓN, 2018-2036 (MILES DE USD)
TABLA 442 CORRECCIÓN DE LÍNEAS FACIALES EN EL MERCADO DE RELLENOS INYECTABLES ESTÉTICOS DE TURQUÍA, POR MARCA, 2018-2036 (MILES DE USD)
TABLA 443 MERCADO DE RELLENOS INYECTABLES ESTÉTICOS PARA EL MEJORAMIENTO DE LABIOS EN TURQUÍA, POR TIPO, 2018-2036 (MILES DE USD)
TABLA 444 TURQUÍA JUVÉDERM EN EL MERCADO DE RELLENOS INYECTABLES ESTÉTICOS, POR TIPO, 2018-2036 (MILES DE USD)
TABLA 445 TURQUÍA RESTYLANE EN EL MERCADO DE RELLENOS INYECTABLES ESTÉTICOS, POR TIPO, 2018-2036 (MILES DE USD)
TABLA 446 RHA DE TURQUÍA EN EL MERCADO DE RELLENOS INYECTABLES ESTÉTICOS, POR TIPO, 2018-2036 (MILES DE USD)
TABLA 447 ESTIRAMIENTO FACIAL EN EL MERCADO DE RELLENOS INYECTABLES ESTÉTICOS DE TURQUÍA, POR TIPO, 2018-2036 (MILES DE USD)
TABLA 448 ESTIRAMIENTO FACIAL EN EL MERCADO DE RELLENOS INYECTABLES ESTÉTICOS DE TURQUÍA, POR MARCA, 2018-2036 (MILES DE USD)
TABLA 449 RINOPLASTIA EN EL MERCADO DE RELLENOS INYECTABLES ESTÉTICOS DE TURQUÍA, POR TIPO, 2018-2036 (MILES DE USD)
TABLA 450 TURQUÍA JUVÉDERM EN EL MERCADO DE RELLENOS INYECTABLES ESTÉTICOS, POR TIPO, 2018-2036 (MILES DE USD)
TABLA 451 TURQUÍA RESTYLANE EN EL MERCADO DE RELLENOS INYECTABLES ESTÉTICOS, POR TIPO, 2018-2036 (MILES DE USD)
TABLA 452 RHA DE TURQUÍA EN EL MERCADO DE RELLENOS INYECTABLES ESTÉTICOS, POR TIPO, 2018-2036 (MILES DE USD)
TABLA 453 TRATAMIENTO DE CICATRICES EN EL MERCADO DE RELLENOS INYECTABLES ESTÉTICOS DE TURQUÍA, POR TIPO, 2018-2036 (MILES DE USD)
TABLA 454 TRATAMIENTO DE CICATRICES EN EL MERCADO DE RELLENOS INYECTABLES ESTÉTICOS, POR MARCA, 2018-2036 (MILES DE USD)
TABLA 455 FLAPEZ DE LA PIEL EN EL MERCADO DE RELLENOS INYECTABLES ESTÉTICOS, POR TIPO, 2018-2036 (MILES DE USD)
TABLA 456 DEPRESIÓN DE LA MEJILLA DE PAVO EN EL MERCADO DE RELLENOS INYECTABLES ESTÉTICOS, POR TIPO, 2018-2036 (MILES DE USD)
TABLA 457 MERCADO DE RELLENOS INYECTABLES ESTÉTICOS DE CIRUGÍA RECONSTRUCTIVA EN TURQUÍA, POR TIPO, 2018-2036 (MILES DE USD)
TABLA 458 RESTAURACIÓN ESTÉTICA EN EL MERCADO DE RELLENOS INYECTABLES ESTÉTICOS DE TURQUÍA, POR TIPO, 2018-2036 (MILES DE USD)
TABLA 459 TURQUÍA JUVÉDERM EN EL MERCADO DE RELLENOS INYECTABLES ESTÉTICOS, POR TIPO, 2018-2036 (MILES DE USD)
TABLA 460 TURQUÍA RESTYLANE EN EL MERCADO DE RELLENOS INYECTABLES ESTÉTICOS, POR TIPO, 2018-2036 (MILES DE USD)
TABLA 461 RHA DE TURQUÍA EN EL MERCADO DE RELLENOS INYECTABLES ESTÉTICOS, POR TIPO, 2018-2036 (MILES DE USD)
TABLA 462 MERCADO DE RELLENOS INYECTABLES ESTÉTICOS EN ODONTOLOGÍA DE TURQUÍA, POR TIPO, 2018-2036 (MILES DE USD)
TABLA 463 AUMENTO DE MENTÓN EN EL MERCADO DE RELLENOS INYECTABLES ESTÉTICOS, POR TIPO, 2018-2036 (MILES DE USD)
TABLA 464 TRATAMIENTO DE LIPOATROFIA EN EL MERCADO DE RELLENOS INYECTABLES ESTÉTICOS, POR TIPO, 2018-2036 (MILES DE USD)
TABLA 465 SUAVIZAMIENTO DE LA PIEL DE PAVO EN EL MERCADO DE RELLENOS INYECTABLES ESTÉTICOS, POR TIPO, 2018-2036 (MILES DE USD)
TABLA 466 REJUVENECIMIENTO DEL LÓBULO DE LA OREJA EN EL MERCADO DE RELLENOS INYECTABLES ESTÉTICOS, POR TIPO, 2018-2036 (MILES DE USD)
TABLA 467 MERCADO DE RELLENOS INYECTABLES ESTÉTICOS DE TURQUÍA, POR TIPO DE MEDICAMENTO, 2018-2036 (MILES DE USD)
TABLA 468. PAVO DE MARCA EN EL MERCADO DE RELLENOS INYECTABLES ESTÉTICOS, POR TIPO, 2018-2036 (MILES DE USD)
TABLA 469 MERCADO DE RELLENOS INYECTABLES ESTÉTICOS DE TURQUÍA, POR USUARIO FINAL, 2018-2036 (MILES DE USD)
TABLA 470 MERCADO DE RELLENOS INYECTABLES ESTÉTICOS DE TURQUÍA, POR CANAL DE DISTRIBUCIÓN, 2018-2036 (MILES DE USD)
TABLA 471 MERCADO DE RELLENOS INYECTABLES ESTÉTICOS DE KUWAIT, POR TIPO DE PRODUCTO, 2018-2036 (MILES DE USD)
TABLA 472 MERCADO DE RELLENOS INYECTABLES ESTÉTICOS DE KUWAIT, POR TIPO DE PRODUCTO, 2018-2036 (VOLUMEN EN MILES DE UNIDADES)
TABLA 473 MERCADO DE RELLENOS INYECTABLES ESTÉTICOS DE KUWAIT, POR TIPO DE PRODUCTO, 2018-2036 (ASP EN USD/UNIDADES)
TABLA 474 RELLENOS INYECTABLES ESTÉTICOS NATURALES DE KUWAIT EN EL MERCADO DE RELLENOS INYECTABLES ESTÉTICOS, POR TIPO, 2018-2036 (MILES DE USD)
TABLA 475 ÁCIDO HIALURÓNICO (AH) DE KUWAIT EN EL MERCADO DE RELLENOS INYECTABLES ESTÉTICOS, POR TIPO, 2018-2036 (MILES DE USD)
TABLA 476 RELLENOS MONOFÁSICOS EN EL MERCADO DE RELLENOS INYECTABLES ESTÉTICOS DE KUWAIT, POR TIPO, 2018-2036 (MILES DE USD)
TABLA 477 RELLENOS MONOFÁSICOS DE KUWAIT EN EL MERCADO DE RELLENOS INYECTABLES ESTÉTICOS, POR APLICACIÓN, 2018-2036 (MILES DE USD)
TABLA 478 RELLENOS BIFÁSICOS DE KUWAIT EN EL MERCADO DE RELLENOS INYECTABLES ESTÉTICOS, POR TIPO DE MATERIAL, 2018-2036 (MILES DE USD)
TABLA 479 RELLENOS BIFÁSICOS DE KUWAIT EN EL MERCADO DE RELLENOS INYECTABLES ESTÉTICOS, POR APLICACIÓN, 2018-2036 (MILES DE USD)
TABLA 480 GRASA DE KUWAIT EN EL MERCADO DE RELLENOS INYECTABLES ESTÉTICOS, POR APLICACIÓN, 2018-2036 (MILES DE USD)
TABLA 481 COLÁGENO DE KUWAIT EN EL MERCADO DE RELLENOS INYECTABLES ESTÉTICOS, POR APLICACIÓN, 2018-2036 (MILES DE USD)
TABLA 482 POLINUCLEÓTIDOS/POLIDEOXIRRIBONUCLEÓTIDOS (PN/PDRN) DE KUWAIT EN EL MERCADO DE RELLENOS INYECTABLES ESTÉTICOS, POR APLICACIÓN, 2018-2036 (MILES DE USD)
TABLA 483 KUWAIT OTROS EN EL MERCADO DE RELLENOS INYECTABLES ESTÉTICOS, POR APLICACIÓN, 2018-2036 (MILES DE USD)
TABLA 484 RELLENOS INYECTABLES ESTÉTICOS SINTÉTICOS DE KUWAIT EN EL MERCADO DE RELLENOS INYECTABLES ESTÉTICOS, POR TIPO, 2018-2036 (MILES DE USD)
TABLA 485 HIDROXILAPATITA DE CALCIO (CAHA) DE KUWAIT EN EL MERCADO DE RELLENOS INYECTABLES ESTÉTICOS, POR APLICACIÓN, 2018-2036 (MILES DE USD)
TABLA 486 ÁCIDO POLI-L-LÁCTICO (PLLA) DE KUWAIT EN EL MERCADO DE RELLENOS INYECTABLES ESTÉTICOS, POR APLICACIÓN, 2018-2036 (MILES DE USD)
TABLA 487 MICROESFERAS DE POLIMETILMETACRILATO (PMMA) EN EL MERCADO DE RELLENOS INYECTABLES ESTÉTICOS DE KUWAIT, POR APLICACIÓN, 2018-2036 (MILES DE USD)
TABLA 488 MERCADO DE RELLENOS INYECTABLES ESTÉTICOS DE KUWAIT, POR TIPO, 2018-2036 (MILES DE USD)
TABLA 489 MERCADO DE RELLENOS INYECTABLES ESTÉTICOS DE KUWAIT, POR TIPO, 2018-2036 (VOLUMEN EN MILES DE UNIDADES)
TABLA 490 MERCADO DE RELLENOS INYECTABLES ESTÉTICOS DE KUWAIT, POR TIPO, 2018-2036 (ASP EN USD/UNIDADES)
TABLA 491 RELLENOS INYECTABLES ESTÉTICOS BIODEGRADABLES EN EL MERCADO DE RELLENOS INYECTABLES ESTÉTICOS DE KUWAIT, POR TIPO, 2018-2036 (MILES DE USD)
TABLA 492 RELLENOS INYECTABLES ESTÉTICOS BIODEGRADABLES EN EL MERCADO DE RELLENOS INYECTABLES ESTÉTICOS DE KUWAIT, POR TIPO, 2018-2036 (VOLUMEN EN MILES DE UNIDADES)
TABLA 493 RELLENOS INYECTABLES ESTÉTICOS BIODEGRADABLES EN EL MERCADO DE RELLENOS INYECTABLES ESTÉTICOS DE KUWAIT, POR TIPO, 2018-2036 (ASP EN USD/UNIDADES)
TABLA 494 MERCADO DE RELLENOS INYECTABLES ESTÉTICOS DE KUWAIT, POR APLICACIÓN, 2018-2036 (MILES DE USD)
TABLA 495 CORRECCIÓN DE LÍNEAS FACIALES EN EL MERCADO DE RELLENOS INYECTABLES ESTÉTICOS DE KUWAIT, POR TIPO, 2018-2036 (MILES DE USD)
TABLA 496 CORRECCIÓN DE LÍNEAS FACIALES EN EL MERCADO DE RELLENOS INYECTABLES ESTÉTICOS DE KUWAIT, POR UBICACIÓN, 2018-2036 (MILES DE USD)
TABLA 497 CORRECCIÓN DE LÍNEAS FACIALES EN EL MERCADO DE RELLENOS INYECTABLES ESTÉTICOS DE KUWAIT, POR MARCA, 2018-2036 (MILES DE USD)
TABLA 498 MERCADO DE RELLENOS INYECTABLES ESTÉTICOS PARA EL MEJORAMIENTO DE LABIOS EN KUWAIT, POR TIPO, 2018-2036 (MILES DE USD)
TABLA 499 KUWAIT JUVÉDERM EN EL MERCADO DE RELLENOS INYECTABLES ESTÉTICOS, POR TIPO, 2018-2036 (MILES DE USD)
TABLA 500 KUWAIT RESTYLANE EN EL MERCADO DE RELLENOS INYECTABLES ESTÉTICOS, POR TIPO, 2018-2036 (MILES DE USD)
TABLA 501 KUWAIT RHA EN EL MERCADO DE RELLENOS INYECTABLES ESTÉTICOS, POR TIPO, 2018-2036 (MILES DE USD)
TABLA 502 ESTIRAMIENTO FACIAL EN KUWAIT EN EL MERCADO DE RELLENOS INYECTABLES ESTÉTICOS, POR TIPO, 2018-2036 (MILES DE USD)
TABLA 503 ESTIRAMIENTO FACIAL EN KUWAIT EN EL MERCADO DE RELLENOS INYECTABLES ESTÉTICOS, POR MARCA, 2018-2036 (MILES DE USD)
TABLA 504 RINOPLASTIA EN EL MERCADO DE RELLENOS INYECTABLES ESTÉTICOS DE KUWAIT, POR TIPO, 2018-2036 (MILES DE USD)
TABLA 505 KUWAIT JUVÉDERM EN EL MERCADO DE RELLENOS INYECTABLES ESTÉTICOS, POR TIPO, 2018-2036 (MILES DE USD)
TABLA 506 KUWAIT RESTYLANE EN EL MERCADO DE RELLENOS INYECTABLES ESTÉTICOS, POR TIPO, 2018-2036 (MILES DE USD)
TABLA 507 KUWAIT RHA EN EL MERCADO DE RELLENOS INYECTABLES ESTÉTICOS, POR TIPO, 2018-2036 (MILES DE USD)
TABLA 508 TRATAMIENTO DE CICATRICES EN EL MERCADO DE RELLENOS INYECTABLES ESTÉTICOS DE KUWAIT, POR TIPO, 2018-2036 (MILES DE USD)
TABLA 509 TRATAMIENTO DE CICATRICES EN EL MERCADO DE RELLENOS INYECTABLES ESTÉTICOS DE KUWAIT, POR MARCA, 2018-2036 (MILES DE USD)
TABLA 510 FLIDEZ DE LA PIEL EN EL MERCADO DE RELLENOS INYECTABLES ESTÉTICOS DE KUWAIT, POR TIPO, 2018-2036 (MILES DE USD)
TABLA 511 DEPRESIÓN DE MEJILLAS EN EL MERCADO DE RELLENOS INYECTABLES ESTÉTICOS DE KUWAIT, POR TIPO, 2018-2036 (MILES DE USD)
TABLA 512 CIRUGÍA RECONSTRUCTIVA EN EL MERCADO DE RELLENOS INYECTABLES ESTÉTICOS DE KUWAIT, POR TIPO, 2018-2036 (MILES DE USD)
TABLA 513 RESTAURACIÓN ESTÉTICA EN EL MERCADO DE RELLENOS INYECTABLES ESTÉTICOS DE KUWAIT, POR TIPO, 2018-2036 (MILES DE USD)
TABLA 514 KUWAIT JUVÉDERM EN EL MERCADO DE RELLENOS INYECTABLES ESTÉTICOS, POR TIPO, 2018-2036 (MILES DE USD)
TABLA 515 KUWAIT RESTYLANE EN EL MERCADO DE RELLENOS INYECTABLES ESTÉTICOS, POR TIPO, 2018-2036 (MILES DE USD)
TABLA 516 KUWAIT RHA EN EL MERCADO DE RELLENOS INYECTABLES ESTÉTICOS, POR TIPO, 2018-2036 (MILES DE USD)
TABLA 517 MERCADO DE RELLENOS INYECTABLES ESTÉTICOS EN ODONTOLOGÍA DE KUWAIT, POR TIPO, 2018-2036 (MILES DE USD)
TABLA 518 AUMENTO DE MENTÓN EN EL MERCADO DE RELLENOS INYECTABLES ESTÉTICOS DE KUWAIT, POR TIPO, 2018-2036 (MILES DE USD)
TABLA 519 TRATAMIENTO DE LIPOATROFIA EN EL MERCADO DE RELLENOS INYECTABLES ESTÉTICOS DE KUWAIT, POR TIPO, 2018-2036 (MILES DE USD)
TABLA 520 RELLENOS INYECTABLES ESTÉTICOS EN KUWAIT, POR TIPO, 2018-2036 (MILES DE USD)
TABLA 521 REJUVENECIMIENTO DEL LÓBULO DE LA OREJA EN EL MERCADO DE RELLENOS INYECTABLES ESTÉTICOS DE KUWAIT, POR TIPO, 2018-2036 (MILES DE USD)
TABLA 522 MERCADO DE RELLENOS INYECTABLES ESTÉTICOS DE KUWAIT, POR TIPO DE MEDICAMENTO, 2018-2036 (MILES DE USD)
TABLA 523 MARCAS KUWAIT EN EL MERCADO DE RELLENOS INYECTABLES ESTÉTICOS, POR TIPO, 2018-2036 (MILES DE USD)
TABLA 524 MERCADO DE RELLENOS INYECTABLES ESTÉTICOS DE KUWAIT, POR USUARIO FINAL, 2018-2036 (MILES DE USD)
TABLA 525 MERCADO DE RELLENOS INYECTABLES ESTÉTICOS DE KUWAIT, POR CANAL DE DISTRIBUCIÓN, 2018-2036 (MILES DE USD)
TABLA 526 MERCADO DE RELLENOS INYECTABLES ESTÉTICOS DE OMÁN, POR TIPO DE PRODUCTO, 2018-2036 (MILES DE USD)
TABLA 527 MERCADO DE RELLENOS INYECTABLES ESTÉTICOS DE OMÁN, POR TIPO DE PRODUCTO, 2018-2036 (VOLUMEN EN MILES DE UNIDADES)
TABLA 528 MERCADO DE RELLENOS INYECTABLES ESTÉTICOS DE OMÁN, POR TIPO DE PRODUCTO, 2018-2036 (ASP EN USD/UNIDADES)
TABLA 529 RELLENOS INYECTABLES ESTÉTICOS NATURALES DE OMÁN EN EL MERCADO DE RELLENOS INYECTABLES ESTÉTICOS, POR TIPO, 2018-2036 (MILES DE USD)
TABLA 530 ÁCIDO HIALURÓNICO (AH) DE OMÁN EN EL MERCADO DE RELLENOS INYECTABLES ESTÉTICOS, POR TIPO, 2018-2036 (MILES DE USD)
TABLA 531 RELLENOS MONOFÁSICOS EN EL MERCADO DE RELLENOS INYECTABLES ESTÉTICOS DE OMÁN, POR TIPO, 2018-2036 (MILES DE USD)
TABLA 532 RELLENOS MONOFÁSICOS DE OMÁN EN EL MERCADO DE RELLENOS INYECTABLES ESTÉTICOS, POR APLICACIÓN, 2018-2036 (MILES DE USD)
TABLA 533 RELLENOS BIFÁSICOS DE OMÁN EN EL MERCADO DE RELLENOS INYECTABLES ESTÉTICOS, POR TIPO DE MATERIAL, 2018-2036 (MILES DE USD)
TABLA 534 RELLENOS BIFÁSICOS DE OMÁN EN EL MERCADO DE RELLENOS INYECTABLES ESTÉTICOS, POR APLICACIÓN, 2018-2036 (MILES DE USD)
TABLA 535 GRASA DE OMÁN EN EL MERCADO DE RELLENOS INYECTABLES ESTÉTICOS, POR APLICACIÓN, 2018-2036 (MILES DE USD)
TABLA 536 COLÁGENO DE OMÁN EN EL MERCADO DE RELLENOS INYECTABLES ESTÉTICOS, POR APLICACIÓN, 2018-2036 (MILES DE USD)
TABLA 537 POLINUCLEÓTIDOS/POLIDEOXIRRIBONUCLEÓTIDOS (PN/PDRN) DE OMÁN EN EL MERCADO DE RELLENOS INYECTABLES ESTÉTICOS, POR APLICACIÓN, 2018-2036 (MILES DE USD)
TABLA 538 OTROS MERCADOS DE RELLENOS INYECTABLES ESTÉTICOS DE OMÁN, POR APLICACIÓN, 2018-2036 (MILES DE USD)
TABLA 539 RELLENOS INYECTABLES ESTÉTICOS SINTÉTICOS DE OMÁN EN EL MERCADO DE RELLENOS INYECTABLES ESTÉTICOS, POR TIPO, 2018-2036 (MILES DE USD)
TABLA 540 HIDROXILAPATITA DE CALCIO (CAHA) DE OMÁN EN EL MERCADO DE RELLENOS INYECTABLES ESTÉTICOS, POR APLICACIÓN, 2018-2036 (MILES DE USD)
TABLA 541 ÁCIDO POLI-L-LÁCTICO (PLLA) DE OMÁN EN EL MERCADO DE RELLENOS INYECTABLES ESTÉTICOS, POR APLICACIÓN, 2018-2036 (MILES DE USD)
TABLA 542 MICROESFERAS DE POLIMETILMETACRILATO (PMMA) EN EL MERCADO DE RELLENOS INYECTABLES ESTÉTICOS DE OMÁN, POR APLICACIÓN, 2018-2036 (MILES DE USD)
TABLA 543 MERCADO DE RELLENOS INYECTABLES ESTÉTICOS DE OMÁN, POR TIPO, 2018-2036 (MILES DE USD)
TABLA 544 MERCADO DE RELLENOS INYECTABLES ESTÉTICOS DE OMÁN, POR TIPO, 2018-2036 (VOLUMEN EN MILES DE UNIDADES)
TABLA 545 MERCADO DE RELLENOS INYECTABLES ESTÉTICOS DE OMÁN, POR TIPO, 2018-2036 (ASP EN USD/UNIDADES)
TABLA 546 RELLENOS INYECTABLES ESTÉTICOS BIODEGRADABLES DE OMÁN EN EL MERCADO DE RELLENOS INYECTABLES ESTÉTICOS, POR TIPO, 2018-2036 (MILES DE USD)
TABLA 547 RELLENOS INYECTABLES ESTÉTICOS BIODEGRADABLES DE OMÁN EN EL MERCADO DE RELLENOS INYECTABLES ESTÉTICOS, POR TIPO, 2018-2036 (VOLUMEN EN MILES DE UNIDADES)
TABLA 548 RELLENOS INYECTABLES ESTÉTICOS BIODEGRADABLES EN EL MERCADO DE RELLENOS INYECTABLES ESTÉTICOS DE OMÁN, POR TIPO, 2018-2036 (ASP EN USD/UNIDADES)
TABLA 549 MERCADO DE RELLENOS INYECTABLES ESTÉTICOS DE OMÁN, POR APLICACIÓN, 2018-2036 (MILES DE USD)
TABLA 550 CORRECCIÓN DE LÍNEAS FACIALES EN EL MERCADO DE RELLENOS INYECTABLES ESTÉTICOS DE OMÁN, POR TIPO, 2018-2036 (MILES DE USD)
TABLA 551 CORRECCIÓN DE LÍNEAS FACIALES EN EL MERCADO DE RELLENOS INYECTABLES ESTÉTICOS DE OMÁN, POR UBICACIÓN, 2018-2036 (MILES DE USD)
TABLA 552 CORRECCIÓN DE LÍNEAS FACIALES EN EL MERCADO DE RELLENOS INYECTABLES ESTÉTICOS DE OMÁN, POR MARCA, 2018-2036 (MILES DE USD)
TABLA 553 MERCADO DE RELLENOS INYECTABLES ESTÉTICOS PARA EL MEJORAMIENTO DE LABIOS EN OMÁN, POR TIPO, 2018-2036 (MILES DE USD)
TABLA 554 OMÁN JUVÉDERM EN EL MERCADO DE RELLENOS INYECTABLES ESTÉTICOS, POR TIPO, 2018-2036 (MILES DE USD)
TABLA 555 OMÁN RESTYLANE EN EL MERCADO DE RELLENOS INYECTABLES ESTÉTICOS, POR TIPO, 2018-2036 (MILES DE USD)
TABLA 556 RHA DE OMÁN EN EL MERCADO DE RELLENOS INYECTABLES ESTÉTICOS, POR TIPO, 2018-2036 (MILES DE USD)
TABLA 557 ESTIRAMIENTO FACIAL EN EL MERCADO DE RELLENOS INYECTABLES ESTÉTICOS DE OMÁN, POR TIPO, 2018-2036 (MILES DE USD)
TABLA 558 ESTIRAMIENTO FACIAL EN EL MERCADO DE RELLENOS INYECTABLES ESTÉTICOS DE OMÁN, POR MARCA, 2018-2036 (MILES DE USD)
TABLA 559 RINOPLASTIA EN EL MERCADO DE RELLENOS INYECTABLES ESTÉTICOS DE OMÁN, POR TIPO, 2018-2036 (MILES DE USD)
TABLA 560 OMÁN JUVÉDERM EN EL MERCADO DE RELLENOS INYECTABLES ESTÉTICOS, POR TIPO, 2018-2036 (MILES DE USD)
TABLA 561 OMÁN RESTYLANE EN EL MERCADO DE RELLENOS INYECTABLES ESTÉTICOS, POR TIPO, 2018-2036 (MILES DE USD)
TABLA 562 RHA DE OMÁN EN EL MERCADO DE RELLENOS INYECTABLES ESTÉTICOS, POR TIPO, 2018-2036 (MILES DE USD)
TABLA 563 TRATAMIENTO DE CICATRICES EN EL MERCADO DE RELLENOS INYECTABLES ESTÉTICOS DE OMÁN, POR TIPO, 2018-2036 (MILES DE USD)
TABLA 564 TRATAMIENTO DE CICATRICES EN EL MERCADO DE RELLENOS INYECTABLES ESTÉTICOS DE OMÁN, POR MARCA, 2018-2036 (MILES DE USD)
TABLA 565 OMÁN: FLAPEZ DE LA PIEL EN EL MERCADO DE RELLENOS INYECTABLES ESTÉTICOS, POR TIPO, 2018-2036 (MILES DE USD)
TABLA 566 DEPRESIÓN DE MEJILLAS EN EL MERCADO DE RELLENOS INYECTABLES ESTÉTICOS DE OMÁN, POR TIPO, 2018-2036 (MILES DE USD)
TABLA 567 MERCADO DE RELLENOS INYECTABLES ESTÉTICOS DE CIRUGÍA RECONSTRUCTIVA EN OMÁN, POR TIPO, 2018-2036 (MILES DE USD)
TABLA 568 RESTAURACIÓN ESTÉTICA EN EL MERCADO DE RELLENOS INYECTABLES ESTÉTICOS DE OMÁN, POR TIPO, 2018-2036 (MILES DE USD)
TABLA 569 OMÁN JUVÉDERM EN EL MERCADO DE RELLENOS INYECTABLES ESTÉTICOS, POR TIPO, 2018-2036 (MILES DE USD)
TABLA 570 OMÁN RESTYLANE EN EL MERCADO DE RELLENOS INYECTABLES ESTÉTICOS, POR TIPO, 2018-2036 (MILES DE USD)
TABLA 571 RHA DE OMÁN EN EL MERCADO DE RELLENOS INYECTABLES ESTÉTICOS, POR TIPO, 2018-2036 (MILES DE USD)
TABLA 572 MERCADO DE RELLENOS INYECTABLES ESTÉTICOS EN OMANÍA, POR TIPO, 2018-2036 (MILES DE USD)
TABLA 573 AUMENTO DE MENTÓN EN EL MERCADO DE RELLENOS INYECTABLES ESTÉTICOS DE OMÁN, POR TIPO, 2018-2036 (MILES DE USD)
TABLA 574 TRATAMIENTO DE LIPOATROFIA EN EL MERCADO DE RELLENOS INYECTABLES ESTÉTICOS DE OMÁN, POR TIPO, 2018-2036 (MILES DE USD)
TABLA 575 OMÁN: SUAVIZAMIENTO DE LA PIEL EN EL MERCADO DE RELLENOS INYECTABLES ESTÉTICOS, POR TIPO, 2018-2036 (MILES DE USD)
TABLA 576 REJUVENECIMIENTO DEL LÓBULO DE LA OREJA EN EL MERCADO DE RELLENOS INYECTABLES ESTÉTICOS DE OMÁN, POR TIPO, 2018-2036 (MILES DE USD)
TABLA 577 MERCADO DE RELLENOS INYECTABLES ESTÉTICOS DE OMÁN, POR TIPO DE MEDICAMENTO, 2018-2036 (MILES DE USD)
TABLA 578 RELLENOS INYECTABLES DE MARCA OMÁN EN EL MERCADO, POR TIPO, 2018-2036 (MILES DE USD)
TABLA 579 MERCADO DE RELLENOS INYECTABLES ESTÉTICOS DE OMÁN, POR USUARIO FINAL, 2018-2036 (MILES DE USD)
TABLA 580 MERCADO DE RELLENOS INYECTABLES ESTÉTICOS DE OMÁN, POR CANAL DE DISTRIBUCIÓN, 2018-2036 (MILES DE USD)
TABLA 581 MERCADO DE RELLENOS INYECTABLES ESTÉTICOS DE QATAR, POR TIPO DE PRODUCTO, 2018-2036 (MILES DE USD)
TABLA 582 MERCADO DE RELLENOS INYECTABLES ESTÉTICOS DE QATAR, POR TIPO DE PRODUCTO, 2018-2036 (VOLUMEN EN MILES DE UNIDADES)
TABLA 583 MERCADO DE RELLENOS INYECTABLES ESTÉTICOS DE QATAR, POR TIPO DE PRODUCTO, 2018-2036 (ASP EN USD/UNIDADES)
TABLA 584 RELLENOS INYECTABLES ESTÉTICOS NATURALES DE QATAR EN EL MERCADO DE RELLENOS INYECTABLES ESTÉTICOS, POR TIPO, 2018-2036 (MILES DE USD)
TABLA 585 ÁCIDO HIALURÓNICO (AH) EN EL MERCADO DE RELLENOS INYECTABLES ESTÉTICOS DE QATAR, POR TIPO, 2018-2036 (MILES DE USD)
TABLA 586 RELLENOS MONOFÁSICOS EN EL MERCADO DE RELLENOS INYECTABLES ESTÉTICOS DE QATAR, POR TIPO, 2018-2036 (MILES DE USD)
TABLA 587 RELLENOS MONOFÁSICOS EN EL MERCADO DE RELLENOS INYECTABLES ESTÉTICOS DE QATAR, POR APLICACIÓN, 2018-2036 (MILES DE USD)
TABLA 588 RELLENOS BIFÁSICOS EN EL MERCADO DE RELLENOS INYECTABLES ESTÉTICOS DE QATAR, POR TIPO DE MATERIAL, 2018-2036 (MILES DE USD)
TABLA 589 RELLENOS BIFÁSICOS DE CATAR EN EL MERCADO DE RELLENOS INYECTABLES ESTÉTICOS, POR APLICACIÓN, 2018-2036 (MILES DE USD)
TABLA 590 GRASA DE QATAR EN EL MERCADO DE RELLENOS INYECTABLES ESTÉTICOS, POR APLICACIÓN, 2018-2036 (MILES DE USD)
TABLA 591 COLÁGENO EN EL MERCADO DE RELLENOS INYECTABLES ESTÉTICOS DE QATAR, POR APLICACIÓN, 2018-2036 (MILES DE USD)
TABLA 592 POLINUCLEÓTIDOS/POLIDEOXIRRIBONUCLEÓTIDOS (PN/PDRN) DE QATAR EN EL MERCADO DE RELLENOS INYECTABLES ESTÉTICOS, POR APLICACIÓN, 2018-2036 (MILES DE USD)
TABLA 593 OTROS MERCADOS DE RELLENOS INYECTABLES ESTÉTICOS DE QATAR, POR APLICACIÓN, 2018-2036 (MILES DE USD)
TABLA 594 RELLENOS INYECTABLES ESTÉTICOS SINTÉTICOS DE QATAR EN EL MERCADO DE RELLENOS INYECTABLES ESTÉTICOS, POR TIPO, 2018-2036 (MILES DE USD)
TABLA 595 HIDROXILAPATITA DE CALCIO (CAHA) EN EL MERCADO DE RELLENOS INYECTABLES ESTÉTICOS DE QATAR, POR APLICACIÓN, 2018-2036 (MILES DE USD)
TABLA 596 ÁCIDO POLI-L-LÁCTICO (PLLA) EN EL MERCADO DE RELLENOS INYECTABLES ESTÉTICOS DE QATAR, POR APLICACIÓN, 2018-2036 (MILES DE USD)
TABLA 597 MICROESFERAS DE POLIMETILMETACRILATO (PMMA) EN EL MERCADO DE RELLENOS INYECTABLES ESTÉTICOS DE QATAR, POR APLICACIÓN, 2018-2036 (MILES DE USD)
TABLA 598 MERCADO DE RELLENOS INYECTABLES ESTÉTICOS DE QATAR, POR TIPO, 2018-2036 (MILES DE USD)
TABLA 599 MERCADO DE RELLENOS INYECTABLES ESTÉTICOS DE QATAR, POR TIPO, 2018-2036 (VOLUMEN EN MILES DE UNIDADES)
TABLA 600 MERCADO DE RELLENOS INYECTABLES ESTÉTICOS DE QATAR, POR TIPO, 2018-2036 (ASP EN USD/UNIDADES)
TABLA 601 RELLENOS INYECTABLES ESTÉTICOS BIODEGRADABLES EN EL MERCADO DE RELLENOS INYECTABLES ESTÉTICOS DE QATAR, POR TIPO, 2018-2036 (MILES DE USD)
TABLA 602 RELLENOS INYECTABLES ESTÉTICOS BIODEGRADABLES DE QATAR EN EL MERCADO DE RELLENOS INYECTABLES ESTÉTICOS, POR TIPO, 2018-2036 (VOLUMEN EN MILES DE UNIDADES)
TABLA 603 RELLENOS INYECTABLES ESTÉTICOS BIODEGRADABLES EN EL MERCADO DE RELLENOS INYECTABLES ESTÉTICOS DE QATAR, POR TIPO, 2018-2036 (ASP EN USD/UNIDADES)
TABLA 604 MERCADO DE RELLENOS INYECTABLES ESTÉTICOS DE QATAR, POR APLICACIÓN, 2018-2036 (MILES DE USD)
TABLA 605 CORRECCIÓN DE LÍNEAS FACIALES EN EL MERCADO DE RELLENOS INYECTABLES ESTÉTICOS DE CATAR, POR TIPO, 2018-2036 (MILES DE USD)
TABLA 606 CORRECCIÓN DE LÍNEAS FACIALES EN EL MERCADO DE RELLENOS INYECTABLES ESTÉTICOS DE CATAR, POR UBICACIÓN, 2018-2036 (MILES DE USD)
TABLA 607 CORRECCIÓN DE LÍNEAS FACIALES EN EL MERCADO DE RELLENOS INYECTABLES ESTÉTICOS DE CATAR, POR MARCA, 2018-2036 (MILES DE USD)
TABLA 608 MERCADO DE RELLENOS INYECTABLES ESTÉTICOS PARA EL MEJORAMIENTO DE LABIOS EN CATAR, POR TIPO, 2018-2036 (MILES DE USD)
TABLA 609 JUVÉDERM EN EL MERCADO DE RELLENOS INYECTABLES ESTÉTICOS DE QATAR, POR TIPO, 2018-2036 (MILES DE USD)
TABLA 610 RESTYLANE EN EL MERCADO DE RELLENOS INYECTABLES ESTÉTICOS DE QATAR, POR TIPO, 2018-2036 (MILES DE USD)
TABLA 611 RHA DE QATAR EN EL MERCADO DE RELLENOS INYECTABLES ESTÉTICOS, POR TIPO, 2018-2036 (MILES DE USD)
TABLA 612 ESTIRAMIENTO FACIAL EN EL MERCADO DE RELLENOS INYECTABLES ESTÉTICOS DE QATAR, POR TIPO, 2018-2036 (MILES DE USD)
TABLA 613 ESTIRAMIENTO FACIAL EN EL MERCADO DE RELLENOS INYECTABLES ESTÉTICOS DE QATAR, POR MARCA, 2018-2036 (MILES DE USD)
TABLA 614 RINOPLASTIA EN EL MERCADO DE RELLENOS INYECTABLES ESTÉTICOS DE QATAR, POR TIPO, 2018-2036 (MILES DE USD)
TABLA 615 JUVÉDERM EN EL MERCADO DE RELLENOS INYECTABLES ESTÉTICOS DE QATAR, POR TIPO, 2018-2036 (MILES DE USD)
TABLA 616 RESTYLANE EN EL MERCADO DE RELLENOS INYECTABLES ESTÉTICOS DE QATAR, POR TIPO, 2018-2036 (MILES DE USD)
TABLA 617 QATAR RHA EN EL MERCADO DE RELLENOS INYECTABLES ESTÉTICOS, POR TIPO, 2018-2036 (MILES DE USD)
TABLA 618 TRATAMIENTO DE CICATRICES EN EL MERCADO DE RELLENOS INYECTABLES ESTÉTICOS DE QATAR, POR TIPO, 2018-2036 (MILES DE USD)
TABLA 619 TRATAMIENTO DE CICATRICES EN EL MERCADO DE RELLENOS INYECTABLES ESTÉTICOS DE CATAR, POR MARCA, 2018-2036 (MILES DE USD)
TABLA 620 FLIDEZ DE LA PIEL EN EL MERCADO DE RELLENOS INYECTABLES ESTÉTICOS DE QATAR, POR TIPO, 2018-2036 (MILES DE USD)
TABLA 621 DEPRESIÓN DE MEJILLAS EN EL MERCADO DE RELLENOS INYECTABLES ESTÉTICOS DE QATAR, POR TIPO, 2018-2036 (MILES DE USD)
TABLA 622 CIRUGÍA RECONSTRUCTIVA EN EL MERCADO DE RELLENOS INYECTABLES ESTÉTICOS DE CATAR, POR TIPO, 2018-2036 (MILES DE USD)
TABLA 623 RESTAURACIÓN ESTÉTICA EN EL MERCADO DE RELLENOS INYECTABLES ESTÉTICOS DE QATAR, POR TIPO, 2018-2036 (MILES DE USD)
TABLA 624 JUVÉDERM EN EL MERCADO DE RELLENOS INYECTABLES ESTÉTICOS DE QATAR, POR TIPO, 2018-2036 (MILES DE USD)
TABLA 625 RESTYLANE EN EL MERCADO DE RELLENOS INYECTABLES ESTÉTICOS DE QATAR, POR TIPO, 2018-2036 (MILES DE USD)
TABLA 626 QATAR RHA EN EL MERCADO DE RELLENOS INYECTABLES ESTÉTICOS, POR TIPO, 2018-2036 (MILES DE USD)
TABLA 627 MERCADO DE RELLENOS INYECTABLES ESTÉTICOS EN ODONTOLOGÍA DE QATAR, POR TIPO, 2018-2036 (MILES DE USD)
TABLA 628 AUMENTO DE MENTÓN EN EL MERCADO DE RELLENOS INYECTABLES ESTÉTICOS DE QATAR, POR TIPO, 2018-2036 (MILES DE USD)
TABLA 629 TRATAMIENTO DE LIPOATROFIA EN EL MERCADO DE RELLENOS INYECTABLES ESTÉTICOS DE QATAR, POR TIPO, 2018-2036 (MILES DE USD)
TABLA 630 SUAVIZAMIENTO DE LA PIEL EN EL MERCADO DE RELLENOS INYECTABLES ESTÉTICOS DE QATAR, POR TIPO, 2018-2036 (MILES DE USD)
TABLA 631 REJUVENECIMIENTO DEL LÓBULO DE LA OREJA EN EL MERCADO DE RELLENOS INYECTABLES ESTÉTICOS DE QATAR, POR TIPO, 2018-2036 (MILES DE USD)
TABLA 632 MERCADO DE RELLENOS INYECTABLES ESTÉTICOS DE QATAR, POR TIPO DE MEDICAMENTO, 2018-2036 (MILES DE USD)
TABLA 633 MARCAS DE QATAR EN EL MERCADO DE RELLENOS INYECTABLES ESTÉTICOS, POR TIPO, 2018-2036 (MILES DE USD)
TABLA 634 MERCADO DE RELLENOS INYECTABLES ESTÉTICOS DE QATAR, POR USUARIO FINAL, 2018-2036 (MILES DE USD)
TABLA 635 MERCADO DE RELLENOS INYECTABLES ESTÉTICOS DE QATAR, POR CANAL DE DISTRIBUCIÓN, 2018-2036 (MILES DE USD)
TABLA 636 RESTO DEL MERCADO DE RELLENOS INYECTABLES ESTÉTICOS DE ORIENTE MEDIO Y NORTE DE ÁFRICA, POR TIPO DE PRODUCTO, 2018-2036 (MILES DE USD)
TABLA 637 RESTO DEL MERCADO DE RELLENOS INYECTABLES ESTÉTICOS DE ORIENTE MEDIO Y NORTE DE ÁFRICA, POR TIPO DE PRODUCTO, 2018-2036 (VOLUMEN EN MILES DE UNIDADES)
TABLA 638 RESTO DEL MERCADO DE RELLENOS INYECTABLES ESTÉTICOS DE ORIENTE MEDIO Y NORTE DE ÁFRICA, POR TIPO DE PRODUCTO, 2018-2036 (ASP EN USD/UNIDADES)
Lista de figuras
FIGURA 1 MERCADO DE RELLENOS INYECTABLES ESTÉTICOS DE ORIENTE MEDIO Y ÁFRICA: SEGMENTACIÓN
FIGURA 2 MERCADO DE RELLENOS INYECTABLES ESTÉTICOS DE ORIENTE MEDIO Y ÁFRICA: TRIANGULACIÓN DE DATOS
FIGURA 3 MERCADO DE RELLENOS INYECTABLES ESTÉTICOS DE ORIENTE MEDIO Y ÁFRICA: ANÁLISIS DROC
FIGURA 4 MERCADO DE RELLENOS INYECTABLES ESTÉTICOS DE ORIENTE MEDIO Y ÁFRICA: ORIENTE MEDIO Y ÁFRICA VS ANÁLISIS REGIONAL
FIGURA 5 MERCADO DE RELLENOS INYECTABLES ESTÉTICOS DE ORIENTE MEDIO Y ÁFRICA: ANÁLISIS DE INVESTIGACIÓN DE EMPRESAS
FIGURA 6 MERCADO DE RELLENOS INYECTABLES ESTÉTICOS DE ORIENTE MEDIO Y ÁFRICA: DATOS DEMOGRÁFICOS DE LAS ENTREVISTAS
FIGURA 7 MERCADO DE RELLENOS INYECTABLES ESTÉTICOS DE ORIENTE MEDIO Y ÁFRICA: CUADRÍCULA DE POSICIÓN DE MERCADO DE DBMR
FIGURA 8 MERCADO DE RELLENOS INYECTABLES ESTÉTICOS DE ORIENTE MEDIO Y ÁFRICA: CUADRÍCULA DE COBERTURA DE USUARIOS FINALES DEL MERCADO
FIGURA 9 MERCADO DE RELLENOS INYECTABLES ESTÉTICOS DE ORIENTE MEDIO Y ÁFRICA: ANÁLISIS DE LA PARTICIPACIÓN DE LOS PROVEEDORES
FIGURA 10 MERCADO DE RELLENOS INYECTABLES ESTÉTICOS DE ORIENTE MEDIO Y ÁFRICA: RESUMEN EJECUTIVO
FIGURA 11 MERCADO DE RELLENOS INYECTABLES ESTÉTICOS DE ORIENTE MEDIO Y ÁFRICA: SEGMENTACIÓN
FIGURA 12 DOS SEGMENTOS COMPRENDEN EL MERCADO DE RELLENOS INYECTABLES ESTÉTICOS DE ORIENTE MEDIO Y ÁFRICA, POR TIPO DE PRODUCTO (2024)
FIGURA 13 DECISIONES ESTRATÉGICAS
FIGURA 14 SE ESPERA QUE LA CRECIENTE DEMANDA DE PROCEDIMIENTOS COSMÉTICOS MÍNIMAMENTE INVASIVOS IMPULSARA EL MERCADO DE RELLENOS INYECTABLES ESTÉTICOS DE ORIENTE MEDIO Y ÁFRICA EN EL PERÍODO PRONOSTICADO DE 2025 A 2036
FIGURA 15 SE ESPERA QUE EL SEGMENTO DE RELLENOS INYECTABLES ESTÉTICOS NATURALES REPRESENTE LA MAYOR PARTICIPACIÓN DEL MERCADO DE RELLENOS INYECTABLES ESTÉTICOS DE ORIENTE MEDIO Y ÁFRICA EN 2025 Y 2036
FIGURA 16 LAS CINCO FUERZAS DE PORTER
FIGURA 17 SOLICITUDES DE PATENTES EN VARIAS JURISDICCIONES CLAVE:
FIGURA 18 SOLICITANTES CLAVE V/S NÚMERO DE PATENTES.
FIGURA 19 CÓDIGOS IPC V/S NÚMERO DE PATENTES.
FIGURA 20 AÑOS V/S NÚMERO DE PATENTES PUBLICADAS
FIGURA 21 ANÁLISIS DROC
FIGURA 22 MERCADO DE RELLENOS INYECTABLES ESTÉTICOS DE ORIENTE MEDIO Y ÁFRICA: POR TIPO, 2024
FIGURA 23 MERCADO DE RELLENOS INYECTABLES ESTÉTICOS DE ORIENTE MEDIO Y ÁFRICA: POR TIPO, 2025 A 2036 (MILES DE USD)
FIGURA 24 MERCADO DE RELLENOS INYECTABLES ESTÉTICOS DE ORIENTE MEDIO Y ÁFRICA: POR TIPO, CAGR (2025-2036)
FIGURA 25 MERCADO DE RELLENOS INYECTABLES ESTÉTICOS DE ORIENTE MEDIO Y ÁFRICA: POR TIPO, CURVA DE LÍNEA DE VIDA
FIGURA 26 MERCADO DE RELLENOS INYECTABLES ESTÉTICOS DE ORIENTE MEDIO Y ÁFRICA: POR TIPO DE PRODUCTO, 2024
FIGURA 27 MERCADO DE RELLENOS INYECTABLES ESTÉTICOS DE ORIENTE MEDIO Y ÁFRICA: POR TIPO DE PRODUCTO, 2025 A 2036 (MILES DE USD)
FIGURA 28 MERCADO DE RELLENOS INYECTABLES ESTÉTICOS DE ORIENTE MEDIO Y ÁFRICA: POR TIPO DE PRODUCTO, CAGR (2025-2036)
FIGURA 29 MERCADO DE RELLENOS INYECTABLES ESTÉTICOS DE ORIENTE MEDIO Y ÁFRICA: POR TIPO DE PRODUCTO, CURVA LIFELINE
FIGURA 30 MERCADO DE RELLENOS INYECTABLES ESTÉTICOS DE ORIENTE MEDIO Y ÁFRICA: POR TIPO DE MEDICAMENTO, 2024
FIGURA 31 MERCADO DE RELLENOS INYECTABLES ESTÉTICOS DE ORIENTE MEDIO Y ÁFRICA: POR TIPO DE MEDICAMENTO, 2025 A 2036 (MILES DE USD)
FIGURA 32 MERCADO DE RELLENOS INYECTABLES ESTÉTICOS DE ORIENTE MEDIO Y ÁFRICA: POR TIPO DE FÁRMACO, CAGR (2025-2036)
FIGURA 33 MERCADO DE RELLENOS INYECTABLES ESTÉTICOS DE ORIENTE MEDIO Y ÁFRICA: POR TIPO DE FÁRMACO, CURVA LIFELINE
FIGURA 34 MERCADO DE RELLENOS INYECTABLES ESTÉTICOS DE ORIENTE MEDIO Y ÁFRICA: POR APLICACIÓN, 2024
FIGURA 35 MERCADO DE RELLENOS INYECTABLES ESTÉTICOS DE ORIENTE MEDIO Y ÁFRICA: POR APLICACIÓN, 2025 A 2036 (MILES DE USD)
FIGURA 36 MERCADO DE RELLENOS INYECTABLES ESTÉTICOS DE ORIENTE MEDIO Y ÁFRICA: POR APLICACIÓN, CAGR (2025-2036)
FIGURA 37 MERCADO DE RELLENOS INYECTABLES ESTÉTICOS DE ORIENTE MEDIO Y ÁFRICA: POR APLICACIÓN, CURVA DE LÍNEA DE VIDA
FIGURA 38 MERCADO DE RELLENOS INYECTABLES ESTÉTICOS DE ORIENTE MEDIO Y ÁFRICA: POR USUARIO FINAL, 2024
FIGURA 39 MERCADO DE RELLENOS INYECTABLES ESTÉTICOS DE ORIENTE MEDIO Y ÁFRICA: POR USUARIO FINAL, 2025 A 2036 (MILES DE USD)
FIGURA 40 MERCADO DE RELLENOS INYECTABLES ESTÉTICOS DE ORIENTE MEDIO Y ÁFRICA: POR USUARIO FINAL, CAGR (2025-2036)
FIGURA 41 MERCADO DE RELLENOS INYECTABLES ESTÉTICOS DE ORIENTE MEDIO Y ÁFRICA: POR USUARIO FINAL, CURVA LIFELINE
FIGURA 42 MERCADO DE RELLENOS INYECTABLES ESTÉTICOS DE ORIENTE MEDIO Y ÁFRICA: POR CANAL DE DISTRIBUCIÓN, 2024
FIGURA 43 MERCADO DE RELLENOS INYECTABLES ESTÉTICOS DE ORIENTE MEDIO Y ÁFRICA: POR CANAL DE DISTRIBUCIÓN, 2025 A 2036 (MILES DE USD)
FIGURA 44 MERCADO DE RELLENOS INYECTABLES ESTÉTICOS DE ORIENTE MEDIO Y ÁFRICA: POR CANAL DE DISTRIBUCIÓN, CAGR (2025-2036)
FIGURA 45 MERCADO DE RELLENOS INYECTABLES ESTÉTICOS DE ORIENTE MEDIO Y ÁFRICA: POR CANAL DE DISTRIBUCIÓN, CURVA LIFELINE
FIGURA 46 MERCADO DE RELLENOS INYECTABLES ESTÉTICOS DE ORIENTE MEDIO Y ÁFRICA: INSTANTÁNEA (2024)
FIGURA 47 MERCADO DE RELLENOS INYECTABLES ESTÉTICOS DE ORIENTE MEDIO Y ÁFRICA: PARTICIPACIÓN DE LA EMPRESA 2024 (%)
Metodología de investigación
La recopilación de datos y el análisis del año base se realizan utilizando módulos de recopilación de datos con muestras de gran tamaño. La etapa incluye la obtención de información de mercado o datos relacionados a través de varias fuentes y estrategias. Incluye el examen y la planificación de todos los datos adquiridos del pasado con antelación. Asimismo, abarca el examen de las inconsistencias de información observadas en diferentes fuentes de información. Los datos de mercado se analizan y estiman utilizando modelos estadísticos y coherentes de mercado. Además, el análisis de la participación de mercado y el análisis de tendencias clave son los principales factores de éxito en el informe de mercado. Para obtener más información, solicite una llamada de un analista o envíe su consulta.
La metodología de investigación clave utilizada por el equipo de investigación de DBMR es la triangulación de datos, que implica la extracción de datos, el análisis del impacto de las variables de datos en el mercado y la validación primaria (experto en la industria). Los modelos de datos incluyen cuadrícula de posicionamiento de proveedores, análisis de línea de tiempo de mercado, descripción general y guía del mercado, cuadrícula de posicionamiento de la empresa, análisis de patentes, análisis de precios, análisis de participación de mercado de la empresa, estándares de medición, análisis global versus regional y de participación de proveedores. Para obtener más información sobre la metodología de investigación, envíe una consulta para hablar con nuestros expertos de la industria.
Personalización disponible
Data Bridge Market Research es líder en investigación formativa avanzada. Nos enorgullecemos de brindar servicios a nuestros clientes existentes y nuevos con datos y análisis que coinciden y se adaptan a sus objetivos. El informe se puede personalizar para incluir análisis de tendencias de precios de marcas objetivo, comprensión del mercado de países adicionales (solicite la lista de países), datos de resultados de ensayos clínicos, revisión de literatura, análisis de mercado renovado y base de productos. El análisis de mercado de competidores objetivo se puede analizar desde análisis basados en tecnología hasta estrategias de cartera de mercado. Podemos agregar tantos competidores sobre los que necesite datos en el formato y estilo de datos que esté buscando. Nuestro equipo de analistas también puede proporcionarle datos en archivos de Excel sin procesar, tablas dinámicas (libro de datos) o puede ayudarlo a crear presentaciones a partir de los conjuntos de datos disponibles en el informe.

